
Abstract
The effect of second-phase particles on the formation of recrystallisation textures in Al–Fe alloy sheet was analysed. Four commercial AA 8xxx series alloys were chosen on the basis of their Fe and Si contents, one alloy additionally comprised Mn. Main focus was laid on the efficiency of particle stimulated nucleation (PSN) at the large constituent phases. As known from other Al alloys, the recrystallisation textures of the present AA 8xxx alloys are composed of new grains forming at three distinct nucleation sites, viz. cube bands, pre-existing grain boundaries and coarse intermetallic particles. The efficiency of each of these nucleation mechanisms strongly depends on the details of the as-deformed microstructure, especially on the size distribution of the constituent particles.
Introduction
The intrinsic properties of aluminium, in particular its impermeability and barrier properties together with a high level of corrosion resistance and high formability, make aluminium an excellent material in packaging, household and industrial applications. With a variety of alloys and tempers plus a range of obtainable thicknesses, Al foil and sheet may be used in numerous ways to package goods like food, dairy products, pharmaceuticals or industrial products. For thin Al foil and semi-rigid packaging applications, commonly either commercially pure Al or alloys of the AA 8xxx series with a heightened Fe content are utilised (e.g.,1–9). Rigid Al packaging products, e.g., containers or closures for food and beverage, personal care, and household products, usually require higher strength to protect the content and withstand regular handling without deformation or breakage. Hence, within the AA 8xxx alloy class variants with greater amounts of Si and/or Mn may be deployed (e.g.,10–14).
Most Al foil products and many applications of thicker packaging sheet will be used in the soft O-temper which means that the material is fully recrystallised. Thus, proper control of the final materials properties requires detailed knowledge of the effect of microstructure and processing parameters on recrystallisation (e.g.,15–22). In non-age-hardening AA 8xxx alloys it is mainly the materials microchemistry, i.e., the solution / precipitation state of the main alloying elements Fe and Si and other impurities, which affects both processing and materials properties at final gauge. Because of the very low solubility of Fe in Al, commercial Al alloys will always contain large eutectic Fe-rich phases. Type, volume, size and morphology of these so-called constituent particles have an impact on ductility and formability. Pre-heating or homogenisation annealing prior to hot rolling will lead to the formation of fine secondary intermetallic phases, which likewise affect materials properties, especially in the presence of Mn. Grain size has a relatively small influence on strength, but impacts ductility of AA 8xxx alloys, with finer grain size giving higher ductility. Thus, to achieve a good balance of strength and formability in the final gauge product, recrystallisation to a fine, uniform grain structure is required which, again, is affected by solute concentrations of alloying elements as well as size and volume fraction of second-phase particles.
It is well established that recrystallisation of Al semi-finished products is typically accompanied by characteristic changes in preferred crystallographic orientation of the grains, i.e., the material's crystallographic texture (e.g.,23–32). In turn, analysis of the texture changes during annealing provides valuable insight into the microstructural mechanisms of nucleation and growth of the recrystallising grains. In Al sheet products, typically three nucleation sites may be activated, including cube bands, pre-existing grain boundaries as well as large intermetallic particles. The cube bands are band-like structures in the deformed state comprising pre-existent subgrains with orientations of the later cube recrystallisation texture {001}<100 > . Recrystallisation nuclei also form at the pre-existing high-angle grain boundaries between the as-deformed grains, which entails that the newly forming grains typically inherit some of the former rolling texture orientations. Finally, nucleation may occur in the deformation zones around large second-phase particles, the so-called particle stimulated nucleation (PSN), 33 which usually leads to a weakening or randomisation of the recrystallisation texture. The contribution of each of these characteristic nucleation sites on the final recrystallisation texture strongly depends on the chemical composition, the thermomechanical processing and, in turn, on the resultant microstructural details.
Unlike in other Al alloy classes, information on recrystallisation and texture in AA 8xxx series packaging alloys is rather limited, which especially holds for the effect of PSN. Mahon and Marshall 4 analysed the impact of increasing Fe content on the tensile properties of foil stock in a range of model ternary Al–Fe–Si alloys. They observed that, for a given level of strain, the higher Fe content alloy produced a finer grain size, which they attributed to PSN. Aryshenskii et al. 18 probed the influence of the rolling parameters on the recrystallisation of AA 8011. With increasing Zener-Hollomon parameter the stability of the cube texture was reduced, whereas PSN was reinforced during final annealing. Oscarsson et al. 23 conducted experiments on Al–Fe–Si alloys with various amounts of Fe and Si, concluding that the presence of Fe-rich second-phase particles is a dominant factor governing texture evolution and the resulting earing behaviour. Especially, nucleation via PSN was observed at particles of size greater than 1 µm. By contrast, Davies et al. 34 investigated the phenomenon of continuous recrystallisation in heavily cold rolled AA 8079 containing a distribution of both large and small second-phase particles. Transmission electron microscopy revealed that at lower temperatures the small particles restricted growth by pinning boundaries, while at higher temperatures the particles coarsened in size allowing homogeneous subgrain growth to take place. The large Al3Fe particles did not act as preferential nucleation sites, but critical particle sizes for PSN were estimated to be in the range 3 … 6 µm. Ryu and Lee 35 studied the effect of precipitation on the evolution of recrystallisation texture in 0.32 mm thick AA 8011 alloy sheet. Upon annealing at a low temperature (275 °C), substantial precipitation took place before recrystallisation, leading to a weak recrystallisation texture consisting of the cube orientation {001}<100>, the RD rotated cube orientation {hk0}<001>, and the P orientation {011}<122 > . Among these, the latter was ascribed to PSN in the vicinity of large Al3Fe particles. Roy et al. 36 analysed the evolution of the recrystallised microstructure in cold-rolled AA 8011 for different annealing conditions. The recrystallisation texture consisted of cube texture along with rolling and random textures, with the ratio between the recrystallisation texture components being controlled by the precipitation of fine precipitates during annealing. PSN at the large constituent particles was not addressed, however. Sukhopar and Gottstein 37 conducted in-situ experiments to track formation of the cube texture during annealing of cold rolled AA 8079; again, PSN was not a topic. Conversely, Kumar et al. 38 investigated the texture development during recrystallisation of strip cast AA 8011 and reported that low-temperature annealing gave an optimum combination of deformation texture and cube recrystallisation texture components. The authors concluded that PSN – depending on size and distribution of second-phase particles resulting from the materials thermo-mechanical processing history – plays a significant role in TRC AA 8011. Chen et al. 39 analysed the texture evolution of 40 µm AA 8021 Al battery foil during annealing at 270 °C with two different heating rates. The slow heating rate was found to be beneficial to grain refinement, while the annealing textures consisting of cube and retained rolling texture components were basically the same. Kraner et al. 40 investigated the effect of reverse and tandem hot rolling on the microstructure and texture of 60 µm pharmaceutical foil from alloy AA 8021B. In both cases similar cube recrystallisation textures were obtained, albeit with different topological arrangements of the cube-oriented grains.
Recently, Engler et al. 41 tracked the evolution of texture, microstructure and the resultant earing properties during processing of Al alloy AA 8011A closure stock. Control of texture and earing was achieved through balancing the deformation texture with the cube recrystallisation texture forming during inter-annealing. Along the same line of argument, Kraner et al. 42 studied the effect of rolling reduction and annealing conditions on the development of texture in order to balance anisotropy in 90 µm thick foil of alloy AA 8011A by adjusting the proportion of randomly oriented texture components and the ratio between the deformed and recrystallised texture components.
To summarise the above, despite the abundant presence of large Fe-rich intermetallic particles in Al–Fe–Si wrought alloys, our knowledge on the occurrence of PSN in these alloys is surprisingly sparse and contradictory. In the present study we have attempted to correlate PSN with the size distribution of the constituent phases in AA 8xxx series packaging sheet. For that purpose, four different alloys were cold rolled and soft annealed with different heating rates. Both the actual particle size distributions and the resulting recrystallised microstructures and textures were analysed by scanning electron microscopy (SEM) based techniques. The results obtained enabled us to draw conclusions on the efficiency of PSN as a function of the size distribution of the second-phase particles in AA 8xxx series alloys.
Experimental procedures
Material and mechanical tests
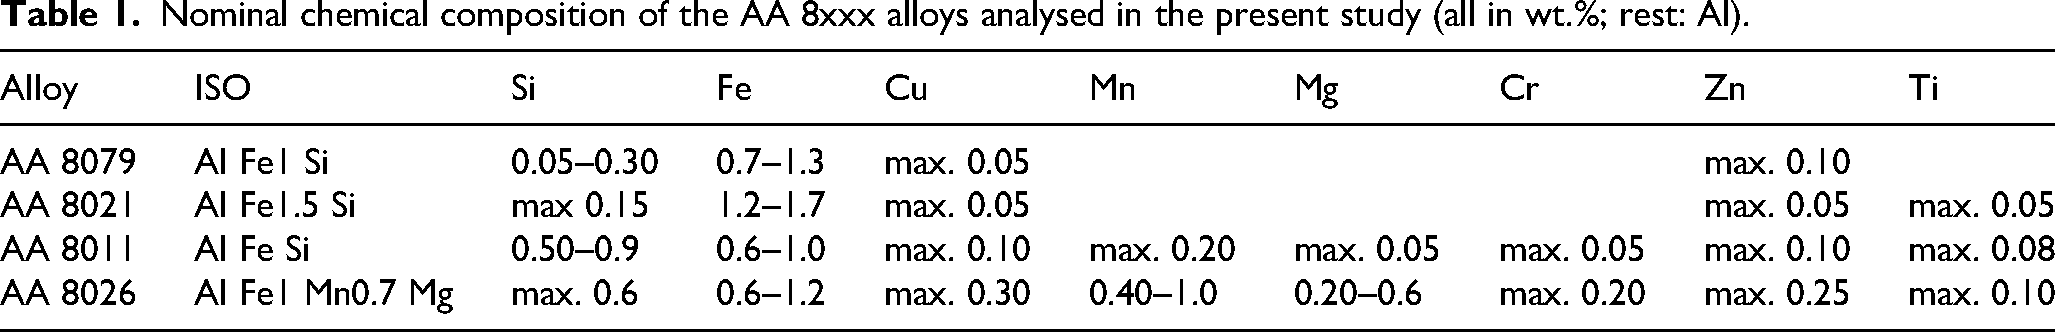
Hot strips samples were taken from four different batches of industrially processed AA 8xxx series alloys. The nominal chemical composition of the alloys is given in Table 1, indicating that all alloys contain significant levels of Fe ranging between 0.6 and 1.7% (note that all chemical compositions are given in wt.% throughout this paper). The present alloy variants AA 8079 and 8021 both had very low Si concentrations of 0.07%, but were differentiated by their Fe contents of 0.85% and 1.55%, respectively. Alloy AA 8011 had similar Fe as AA 8079, but contained about 0.6% Si to provide additional strength and ductility required for specific packaging applications. Lastly, alloy AA 8026 is a recycling-friendly variant dedicated to replacing cleaner AA 8xxx packaging alloys. Besides some 0.9% Fe and almost 0.5% Si, this alloy contained significant portions of Cu, Mg and as much as 0.6% Mn. As such, this alloy comes close to the typical Mn-containing AA 3xxx series packaging alloys, especially AA 3005 (Al Mn1 Mg0.5) or AA 3105 (Al Mn0.5 Mg0.5). 3
Nominal chemical composition of the AA 8xxx alloys analysed in the present study (all in wt.%; rest: Al).
Industrial standard-sized rolling ingots of the four different alloys were produced by direct-chill (DC) casting, followed by conventional reheating and hot rolling at the Alunorf rolling plant in Norf, Germany. Lab-sized coupons of the hot strips were cold rolled on a lab rolling mill with a roll diameter of 410 mm in a number of passes to total thickness reductions of 75% and 90%, which corresponds to logarithmic strains of 1.4 and 2.3, respectively. Finally, the rolled sheets were soft annealed (condition “O”), which was conducted by one out of two different annealing practices. Industrial batch annealing (denoted “BA” hereafter) was simulated in an air-circulation furnace N60/65HA (Nabertherm, Germany) with temperature control by slowly heating the sample with 30 K/h to a peak metal temperature of 350 °C, a one hour holding phase, followed by slow (air) cooling back to ambient temperature. Soft annealing in a continuous annealing line (denoted flash annealing, “FA”) was mimicked by annealing individual lab-sized specimens for 10 min at a temperature of 350 °C in a fluidised sand bath Thermocal TH 500-12 (Schwing, Germany), terminated by rapid cooling in forced air.
Tensile tests were carried out according to the international standard ISO 6892-1. Standard flat dog-bone shaped tensile coupons were machined perpendicular (90°) to the former sheet rolling direction. For each condition a minimum of two specimens were tested in a screw-driven testing machine Zwick Z100 at ambient temperature. Earing was characterised with the help of cup drawing tests as described in the international standards ISO 11531 and EN 1669. To this end, round blanks with a diameter of 60 mm were deformed on a hydraulic press with a punch diameter of 33.3 mm, referring to a drawing ratio of 1.8. The degree of earing can be quantitatively assessed by the percentage of earing or mean earing value, Z: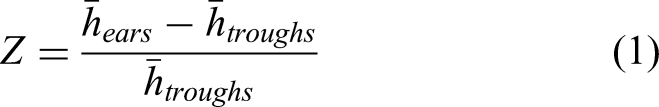
Characterisation of microstructure and texture
The topological parameters and chemical composition of the second-phase particles observed in the different hot strip samples were analysed in an SEM Zeiss Merlin equipped with a four-quadrant backscattered electron detector. Longitudinal (i.e., RD–ND) sections were prepared using standard cutting, grinding and polishing techniques, using oxide polishing suspension (OPS, Struers) for several minutes in the final polishing step. Statistical area measurements were conducted with the software package AZtecFeature from Oxford Instruments 43 at an acceleration voltage of 10 kV and a working distance of 8 to 9 mm. To that end, 30 maps were acquired at a magnification of 1000× to yield quantitative data on the type, size, shape and area fraction of the constituent particles; the total measuring area amounted to 0.318 mm2. Simultaneously, the chemical composition of the particles was determined by energy-dispersive X-ray spectroscopy (EDS). Contrast and brightness of all maps were adapted to facilitate a consistent detection of the second-phase particles. 44 With the appropriate settings particles larger than 0.25 µm could reliably be detected. The resulting data sets were quantitatively evaluated in terms of size and area fraction of the particles, where the former is expressed as the diameter of a circle with the same area as the particle (“equivalent circle diameter”, ECD). The particle size distributions were expressed in the form of area densities, i.e., particles per square millimetre, as a function of the ECD.
The crystallographic textures of the differently rolled and annealed conditions were determined by electron back-scattered diffraction (EBSD) (e.g., 45 ), using the HKL Channel 5 software package with the Nordlys II EBSD detector from Oxford Instruments. Longitudinal sections of the sheets were prepared by mechanical polishing followed by electropolishing. In each sample the complete area through the sheet thickness was scanned with a step width of 1 µm. Figure 1 shows an example of the resulting EBSD orientation maps for AA 8021, rolled by 75% and batch annealed (BA), where the individual pixels were coloured according to their crystal orientation along the sheet normal direction, ND (see inset in Figure 1).

EBSD orientation map of AA 8021, 75% cold rolled and batch annealed (BA), (longitudinal section, RD horizontal).
From the EBSD data the orientation distribution functions (ODF) f(g) were computed by associating the individual orientations g = {φ1, Φ, φ2} of each orientation map with a Gauss-shaped peak with a (half) scatter width ψ0 = 5° in Euler angle space. For each sample 10,000 orientations were explored that uniformly cover the complete EBSD map, the ODFs were then determined by superposition of the corresponding 10,000 Gauss peaks in orientation space. In determining ODFs from orientation data on a regular measuring grid, the orientation of each measured point i contributes to the final texture with the same weight 1/N without considering additional size effects. Then, the 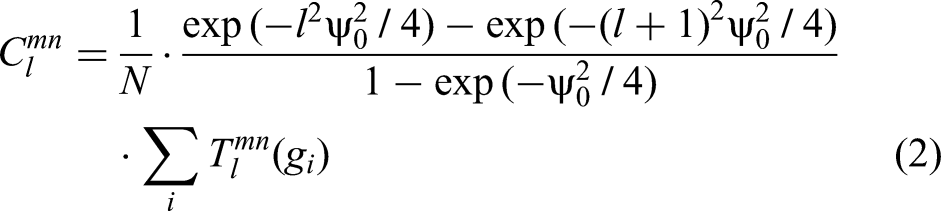
In doing so, orthotropic sample symmetry is imposed, i.e., 0° ≤ {φ1, Φ, φ2} ≤ 90°. Once the ODF f(g) has been derived, the overall texture strength can be assessed with the help of the so-called texture index J, which is defined as45,46: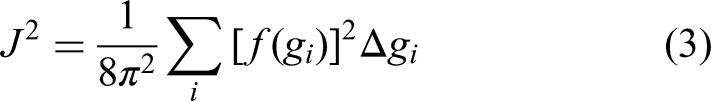
The ODFs were presented by plotting the orientation densities in three characteristic sections of the Euler space, viz. φ2 = 45°, 65° and 90°, which contain the most important texture components observed in rolled and recrystallised Al sheet. Figure 2 provides a schematic representation of these three ODF sections, including the positions of the most important rolling and recrystallisation texture orientations encountered in the present study. The rolling textures of Al sheet products are typically comprised of the orientations copper (Cu) {112}<111 > at φ2 = 45°, S {123}<634 > at φ2 = 65°, and brass (Bs) {011}<211 > at φ2 = 90°. The salient component of the recrystallisation texture of Al alloys is the cube orientation {001}<100> (visible at φ2 = 90°) with some characteristic scatter about the rolling direction towards Goss {011}<100 > . Furthermore, the recrystallisation textures often display remnants of the former rolling texture, which are commonly subsumed under the name R orientation (at φ2 = 65°). Occasionally the P orientation {011}<233> (at φ1 ∼ 65° and φ2 = 90°) is obtained which is usually attributed to PSN.
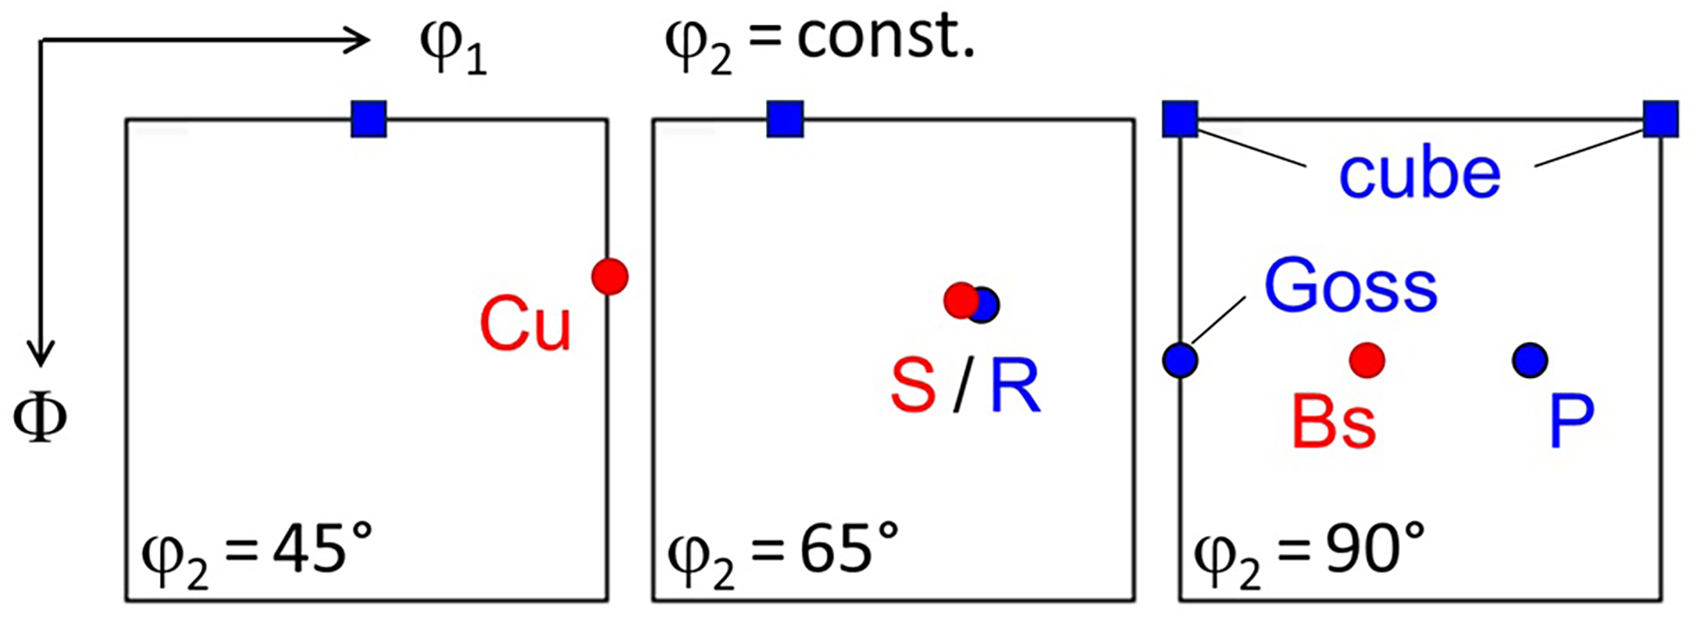
Schematic ODF sections φ2 = 45°, 65° and 90° with the positions of the most important rolling (red) and recrystallisation texture orientations (blue) of Al alloys (colour figure online).
Besides providing information on crystallographic texture, the EBSD data were also analysed with regard to the recrystallised grain size. For this purpose the Channel 5 software was applied to reconstruct the grain structure from the EBSD maps under the assumption that two adjacent map points are part of the same grain if their mutual misorientation is below a critical value, typically 15°. Grain reconstruction allows the grain area and other topological parameters to be determined, including the average grain size (e.g., in terms of the equivalent circle diameter), aspect ratio, etc. For a comprehensive treatment of measurement, evaluation and interpretation of EBSD results the reader is referred to Ref. 45
Experimental results
Mechanical tests and earing properties
The mechanical properties of the lab-rolled sheets of the different AA 8xxx series alloys were determined by standard quasi-static tensile tests conducted perpendicular (90°) to the former sheet rolling direction. Figure 3 summarises the resulting materials data yield strength, Rp0.2, ultimate tensile strength, Rm, and elongation at fracture, A50mm for the sheets rolled by 75% and subsequently batch annealed (BA). Analogous results for commercial purity aluminium, AA 1050 (Al 99.5), are included for comparison. For the 90% rolled sheets the yield strength Rp0.2 increased by about 3 MPa, the ultimate tensile strength Rm twice as much, i.e., roughly by 6 MPa. The elongation at fracture, A50mm, did not vary systematically with strain. The annealing method, especially flash annealing rather than batch annealing, did not notably alter the mechanical properties.
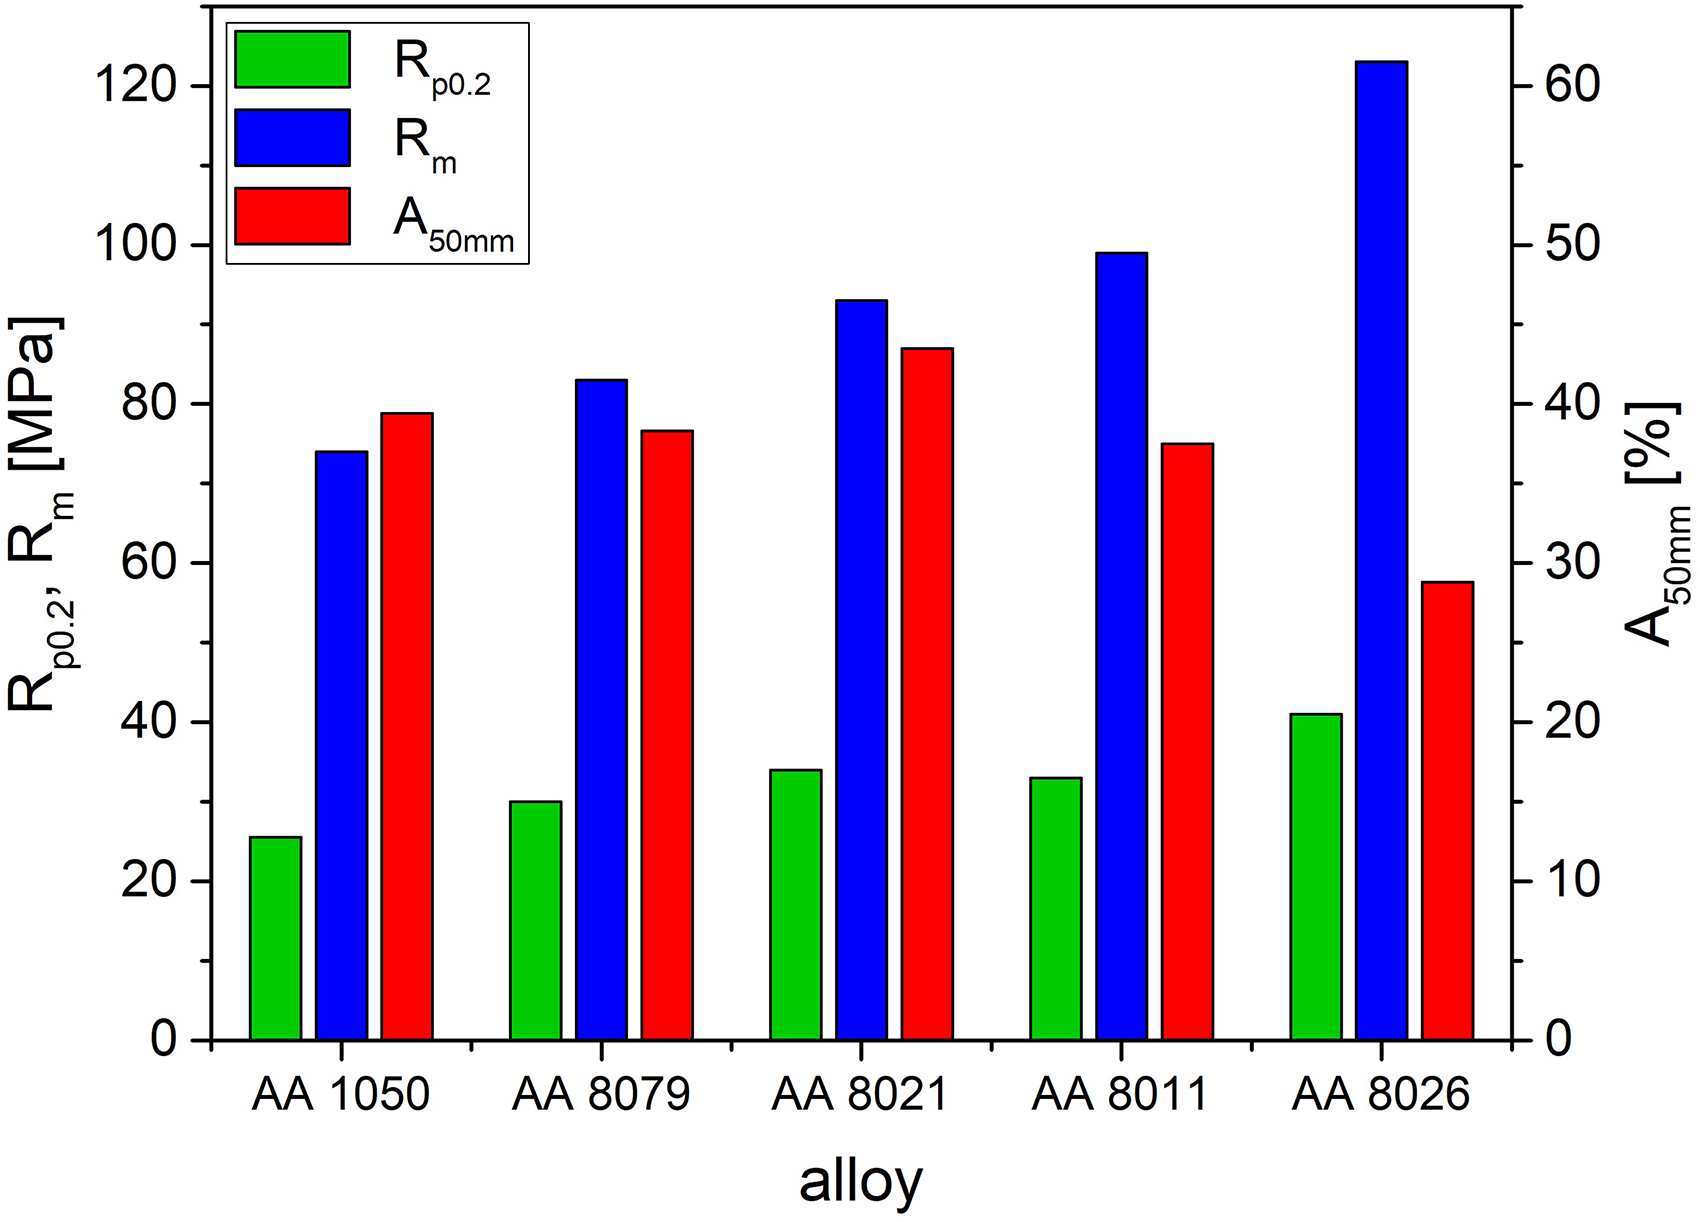
Yield strength, Rp0.2, ultimate tensile strength, Rm, and elongation at fracture, A50mm, of the different AA 8xxx series alloys (all 75% cold rolled and batch annealed).
Furthermore, earing was characterised with the help of standard cup drawing tests, the resulting mean earing values, Z, computed according to equation (1), are displayed in Figure 4. Note that, depending on the underlying crystallographic texture (see below), the observed earing profiles disclosed either ears at 0°/90° or at ±45°.
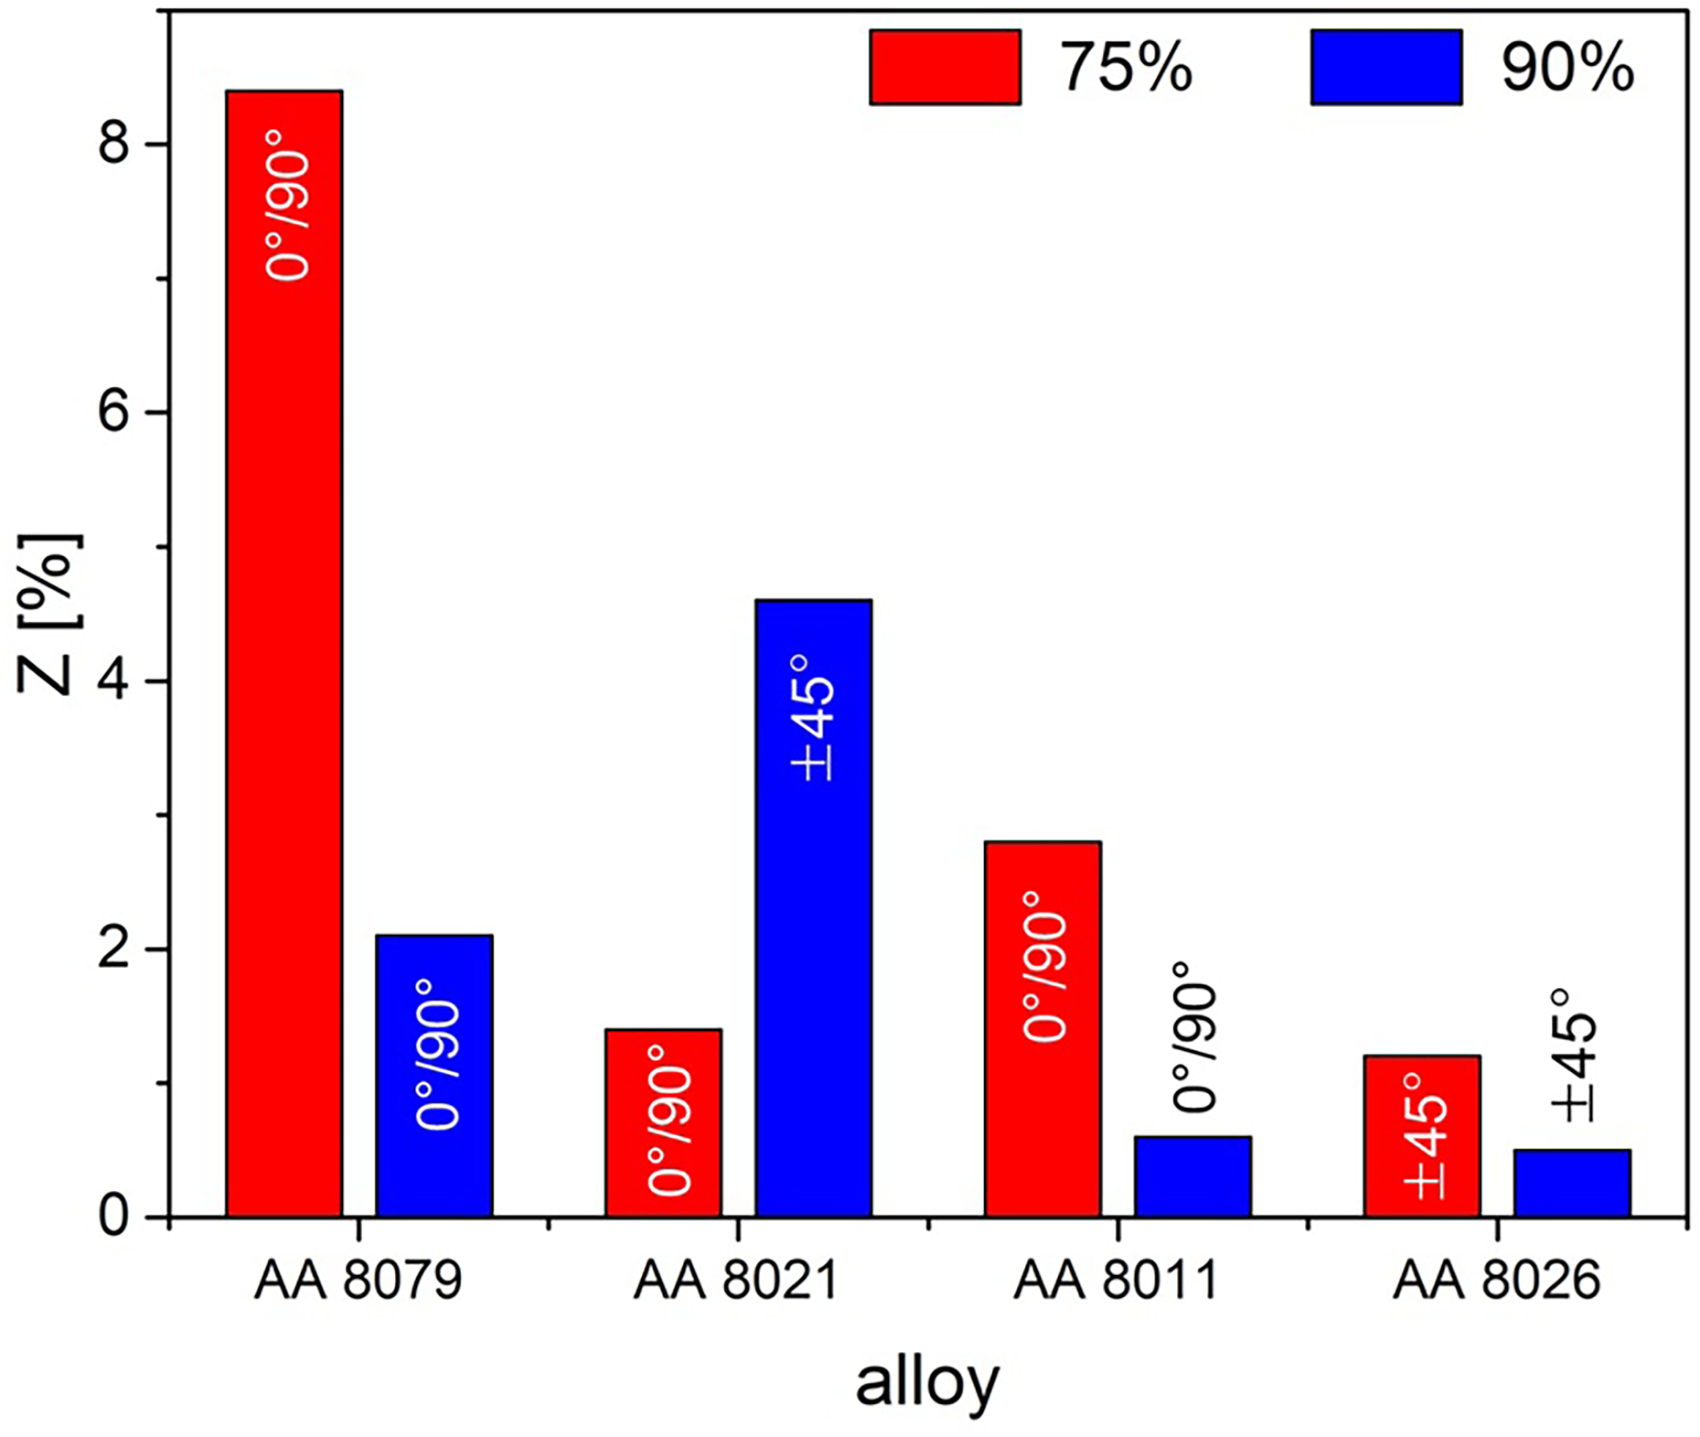
Mean earing value, Z, of the different AA 8xxx series alloys (75% and 90% cold rolled, all batch annealed).
The results confirm that additions of Fe simultaneously increase strength and ductility of AA 8xxx series alloys in the sequence AA 1050 → AA 8079 → AA 8021. The reference material AA 1050, cold rolled by 81%, depicted pronounced in-plane anisotropy with four ears under angles of 0°/90° to the former sheet rolling direction and Z = 13.7%. Increasing Fe concentrations in alloys AA 8079 and 8021 were accompanied by a significant reduction in Z, pointing at a weakening of the underlying recrystallisation textures. Conversely, in alloy AA 8021, rolled by 90%, enlarged ±45° earing with Z = 4.6% was observed. Alloy AA 8011 with additional 0.6% Si showed slightly higher strength together with lower ductility than AA 8079. The plastic anisotropy was moderate (Z = 1 … 3%) with prevalent 0°/90° ears. The recycling-friendly variant AA 8026 showed another step increase in strength at the expense of ductility, combined with negligible in-plane anisotropy (Z ∼ 1%).
Analysis of the second-phase particles in the as-received hot strips
Figure 5(a) exemplarily shows an SEM micrograph of the particle structure in one of the alloys, AA 8021, displaying a large fraction of bright constituent phases with sizes ranging from less than 1 µm up to about 20 µm. In the Mn-rich alloy AA 8026 the constituents appeared larger and less densely distributed; additionally, the alloy contained a large fraction of sub-micron-sized particles, the so-called dispersoids (Figure 5(b)).
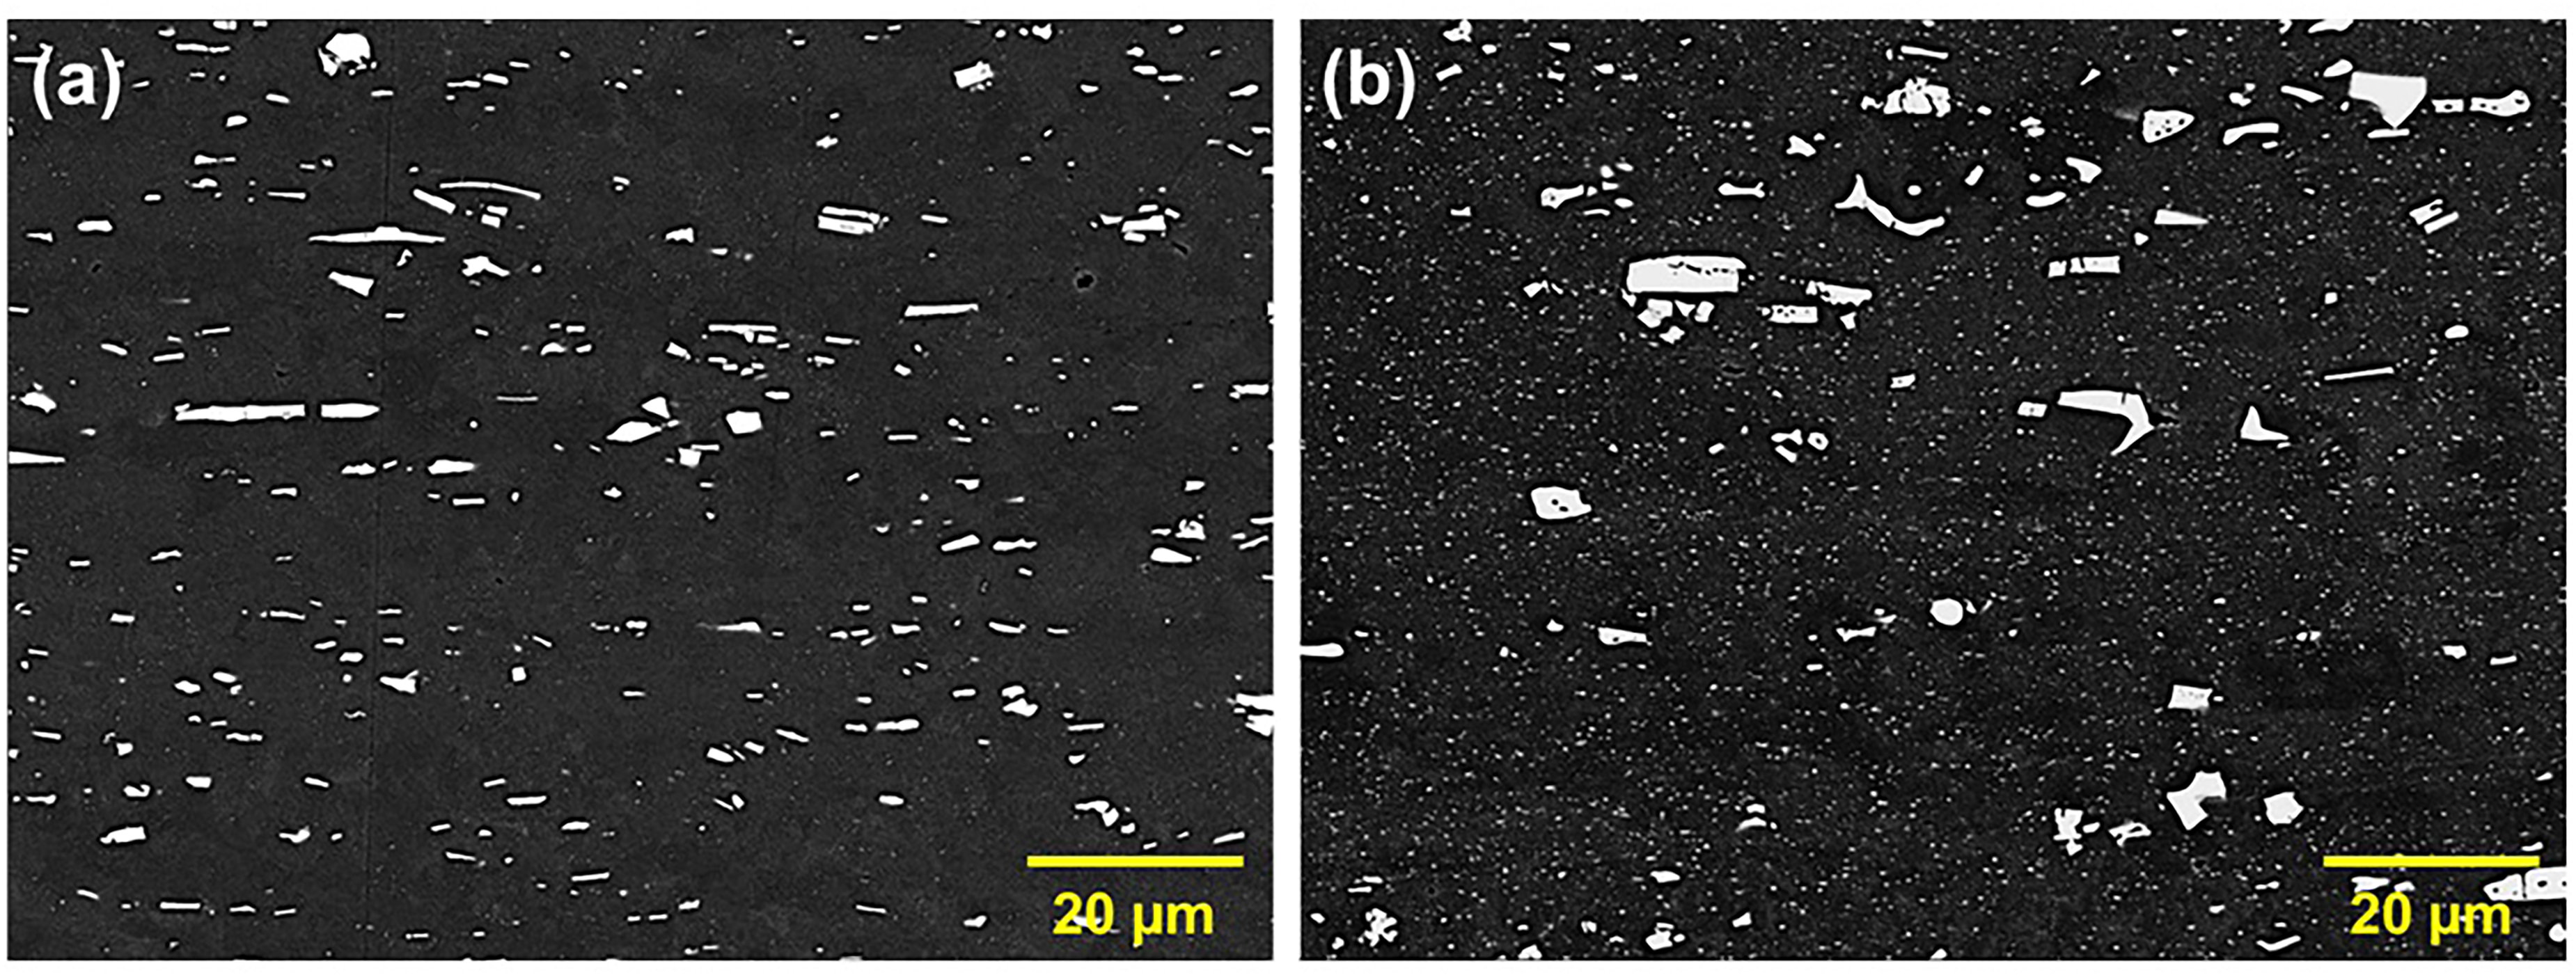
Examples of the second-phase particles (bright) in the AA 8xxx hot strip samples, (a) AA 8021, (b) AA 8026 (SEM, magn. 1000×, longitudinal section, RD horizontal).
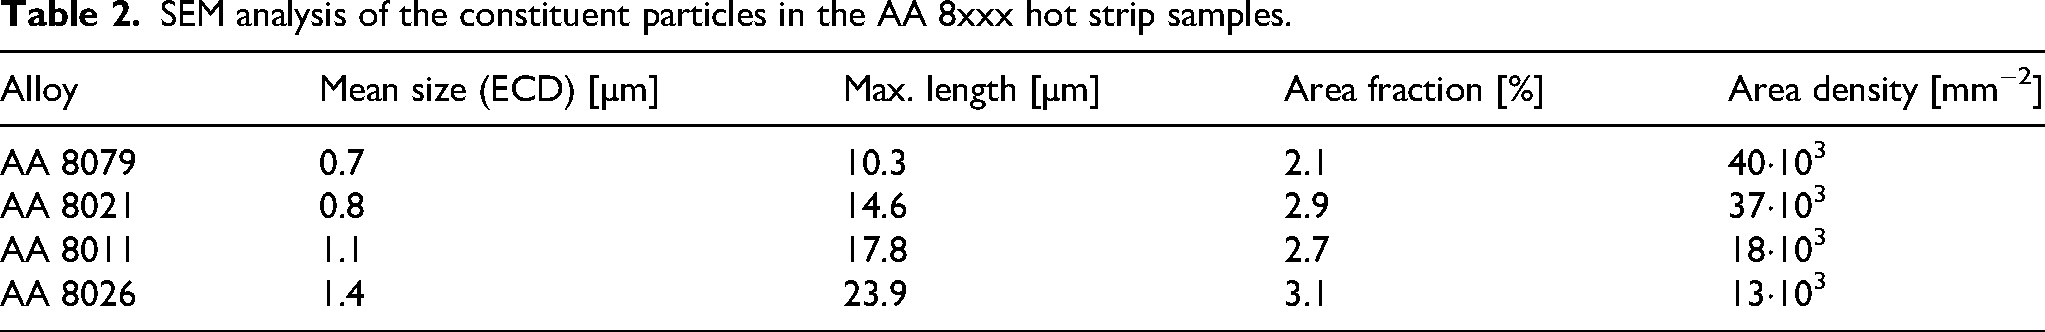
The topological parameters and the chemical composition of the second-phase particles in the various alloys were analysed by detailed SEM feature measurements (see the section “experimental procedures”). Statistical information about the small dispersoids in alloy AA 8026 was acquired by an additional SEM scan of 30 maps at a higher magnification of 5000× in order to extend spatial resolution down to 0.05 µm. The analysis yielded an area fraction of as much as 1.3% of dispersoids with a mean size of 0.17 µm. However, as will be addressed later, particles capable of acting as PSN nuclei have to be an order of magnitude larger than this, typically about 2 µm in size. Thus, for the subsequent discussion of the efficiency of PSN, the dispersoids can safely be ignored; accordingly, all particles with sizes below 0.5 µm were erased from the size distribution of alloy AA 8026. Table 2 summarises the quantitative results regarding mean size and maximum length as well as area fraction and density of the constituent particles. Figure 6 shows the resultant particle size distributions obtained in the present AA 8xxx series alloys, displayed in the form of the particles’ area density as a function of their size (bin size 0.2 µm).
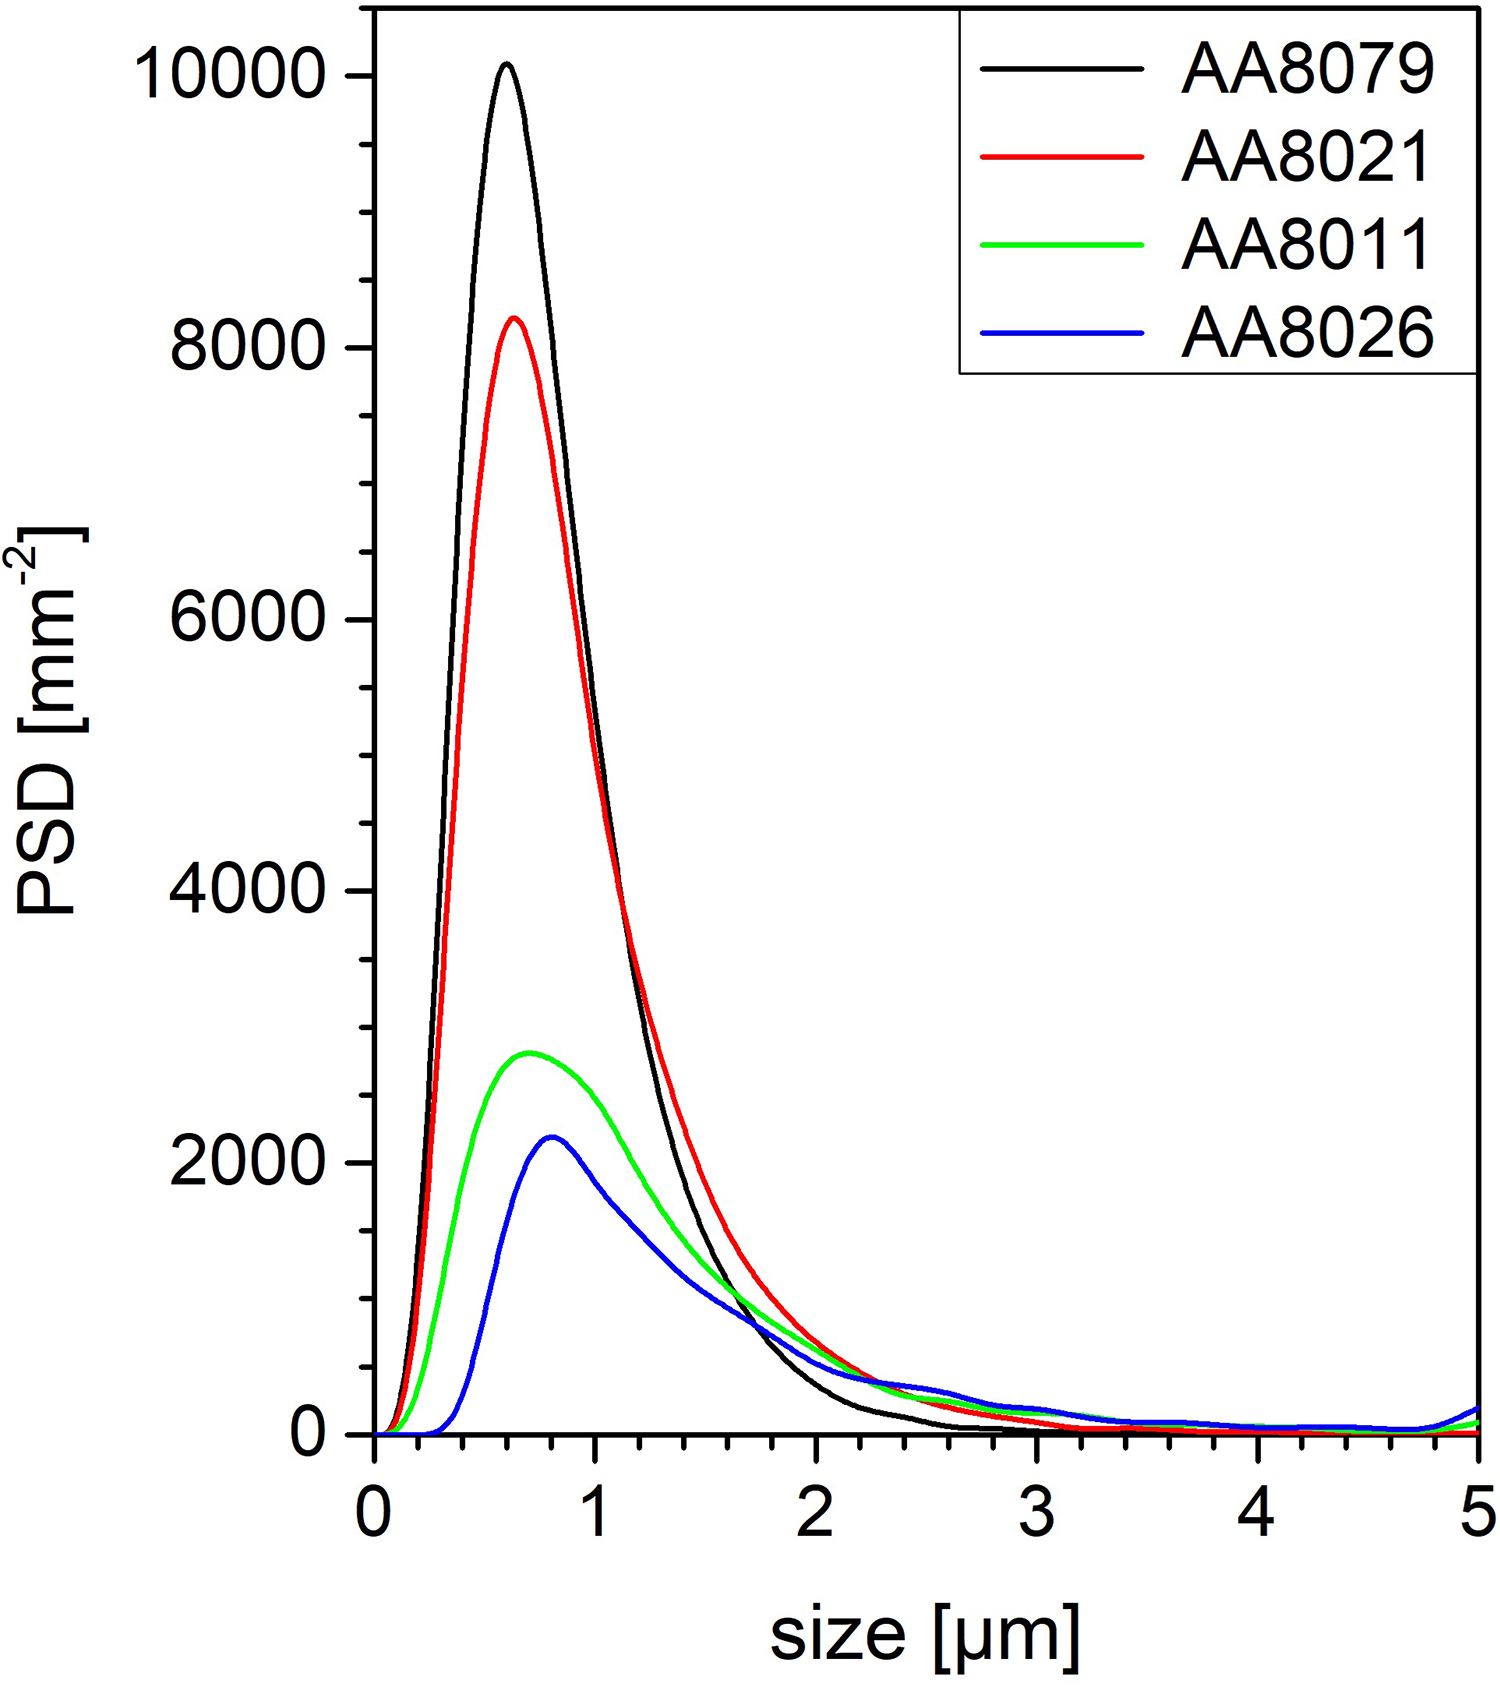
Particle size distribution (PSD) of the constituent phases in the AA 8xxx hot strip samples (bin size 0.2 µm, SEM feature analysis).
SEM analysis of the constituent particles in the AA 8xxx hot strip samples.
The SEM feature measurements were further analysed with respect to the chemical composition of the coarse constituent particles. General information on the prevalent types of second-phase particles is readily attained with the CALPHAD approach (CALculation of PHAse Diagrams). To this end, Figure 7 shows the Al-rich corner of the ternary phase diagram Al–Fe–Si as a function of the Si content for a fixed Fe content of 0.9%, computed with the software package FactSage from GTT-Technologies (Herzogenrath, Germany). 47 With a maximum of 0.05% at 650°C the solubility of Fe in Al is very low. 48 Accordingly, alloys based on commercial purity Al will always comprise Fe-rich constituent particles. The phase diagram displays a total of three species of Fe-bearing phases in equilibrium with the Al-matrix (Al), the stability ranges of which depending on temperature and the exact Si content.49–52 Alloys with low Si contents usually contain the monoclinic phase Al3Fe (or Al13Fe4). At medium Si contents and/or high temperatures the cubic α-AlFeSi phase is obtained. The chemical composition of this phase is described as Al8Fe2Si with rather large scatter. That is to say, the ratio of Fe:Si (in at.%) is centred around 2:1 or, in wt.%, 4:1. Higher Si contents and/or lower temperatures stabilise the monoclinic phase β-AlFeSi with a stoichiometric composition of Al5FeSi. Thus, the Fe:Si ratio (in at.%) is unity or, expressed in wt.%, close to 2:1. At very high Si contents, pure diamond Si is obtained. Note that in the presence of Mn the α-AlFeSi phase may be replaced by an isostructural quaternary α-Al(Fe,Mn)Si phase which likewise shows large scatter in chemical composition.16,53
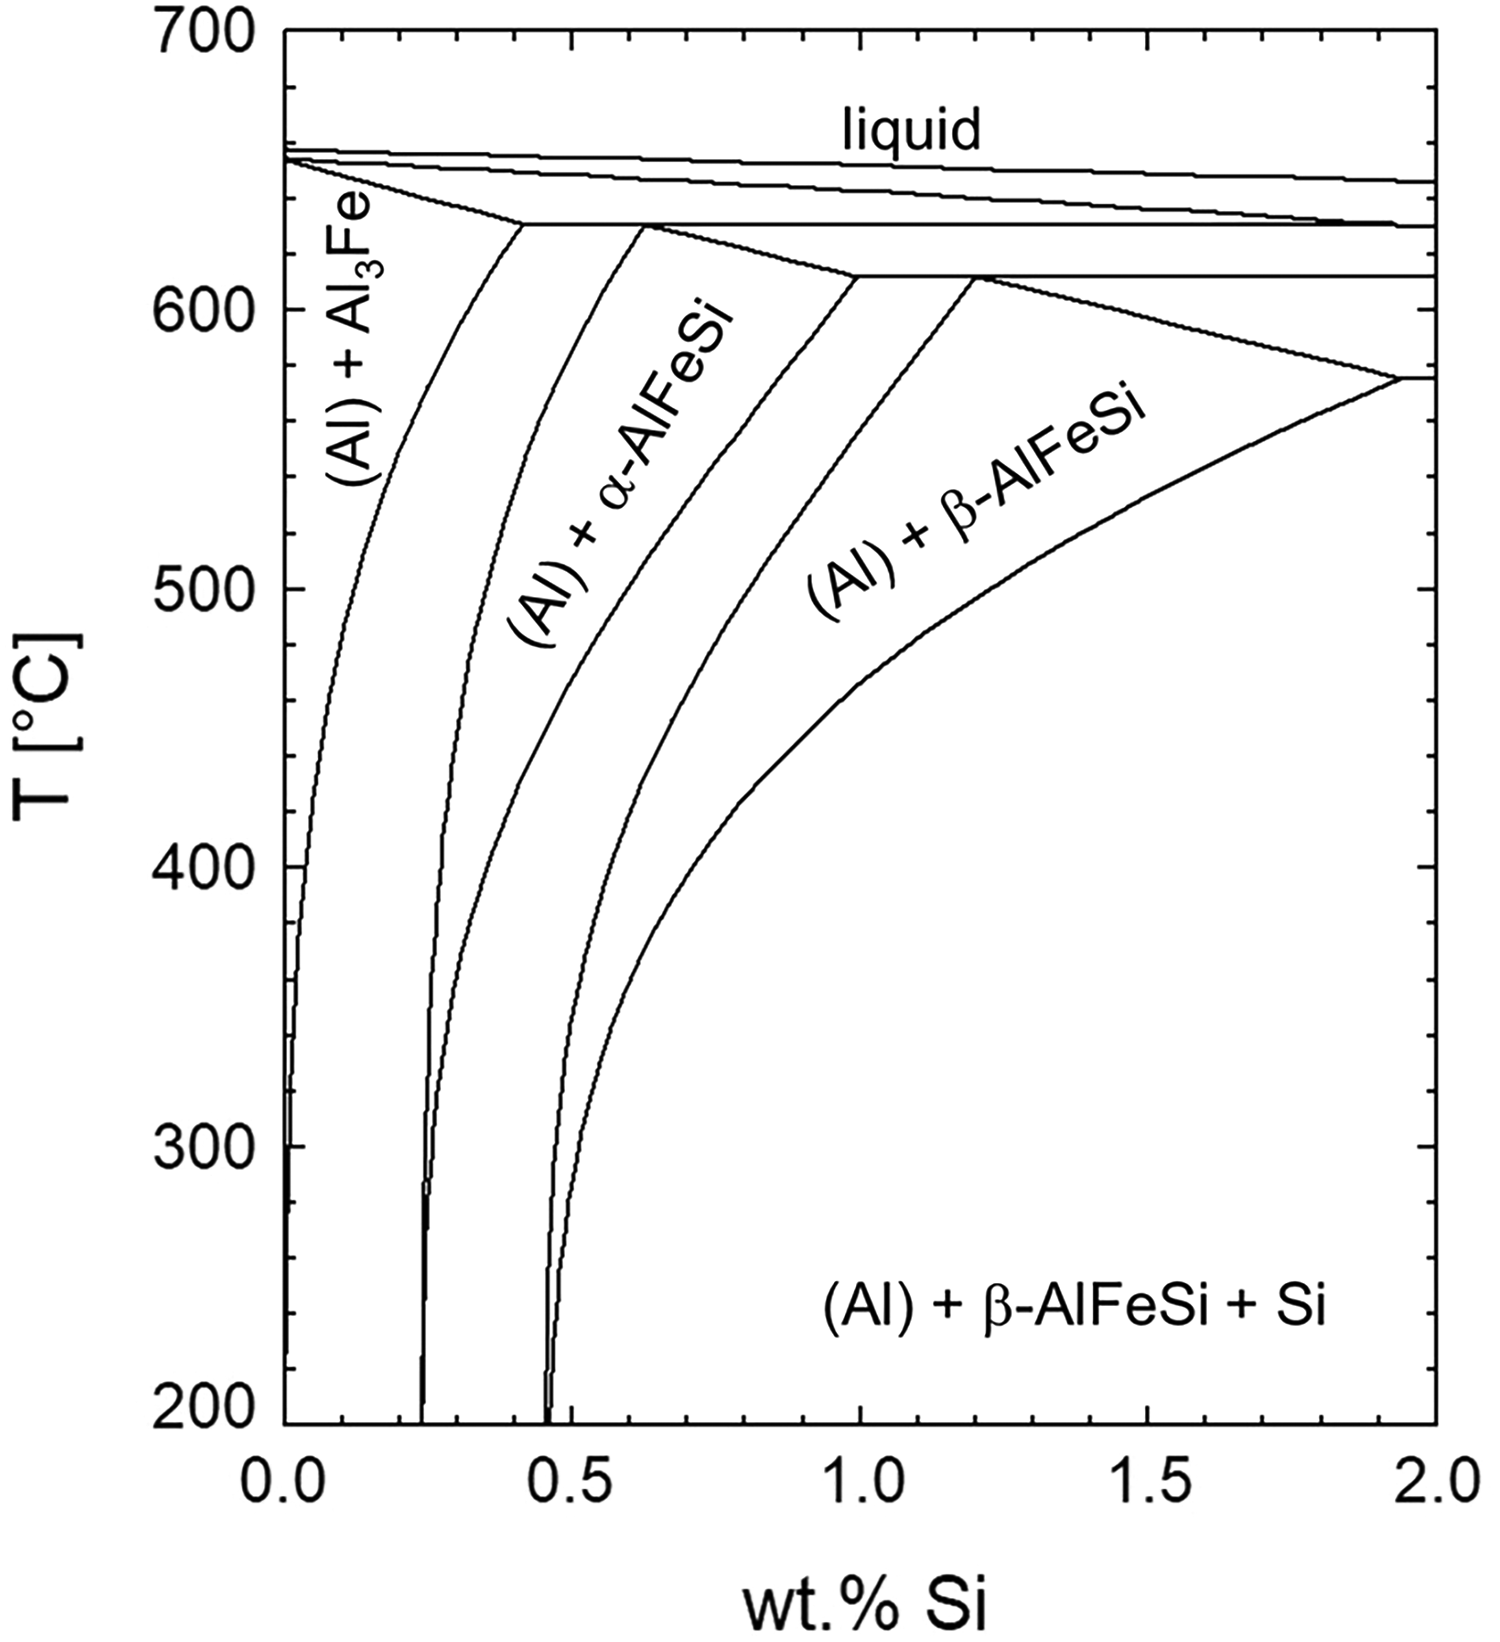
Al-rich corner of the ternary phase diagram Al–Fe–Si, computed for 0.9% Fe (FactSage).
The results of the EDS analysis of the constituent phases are summarised in Figure 8(a) in the form of the Fe vs. Si concentration of all particles in the alloys AA 8079, 8021 and 8011. In order to avoid artefacts and improve the reliability of the EDS measurements, the analysis was limited to particles with Al concentrations below 85%. The present representation provides a clear overview of the occurrence of the various Al–Fe–Si phases – Al3Fe, α-AlFeSi and β-AlFeSi – in the Mn-free AA 8xxx alloys. Correspondingly, Figure 8(b) shows the ratio of Fe, Mn and the summed (Fe + Mn) concentration as a function of the particles’ Si content, which gives a good indication of the constituent phases in the Mn-bearing alloy AA 8026.
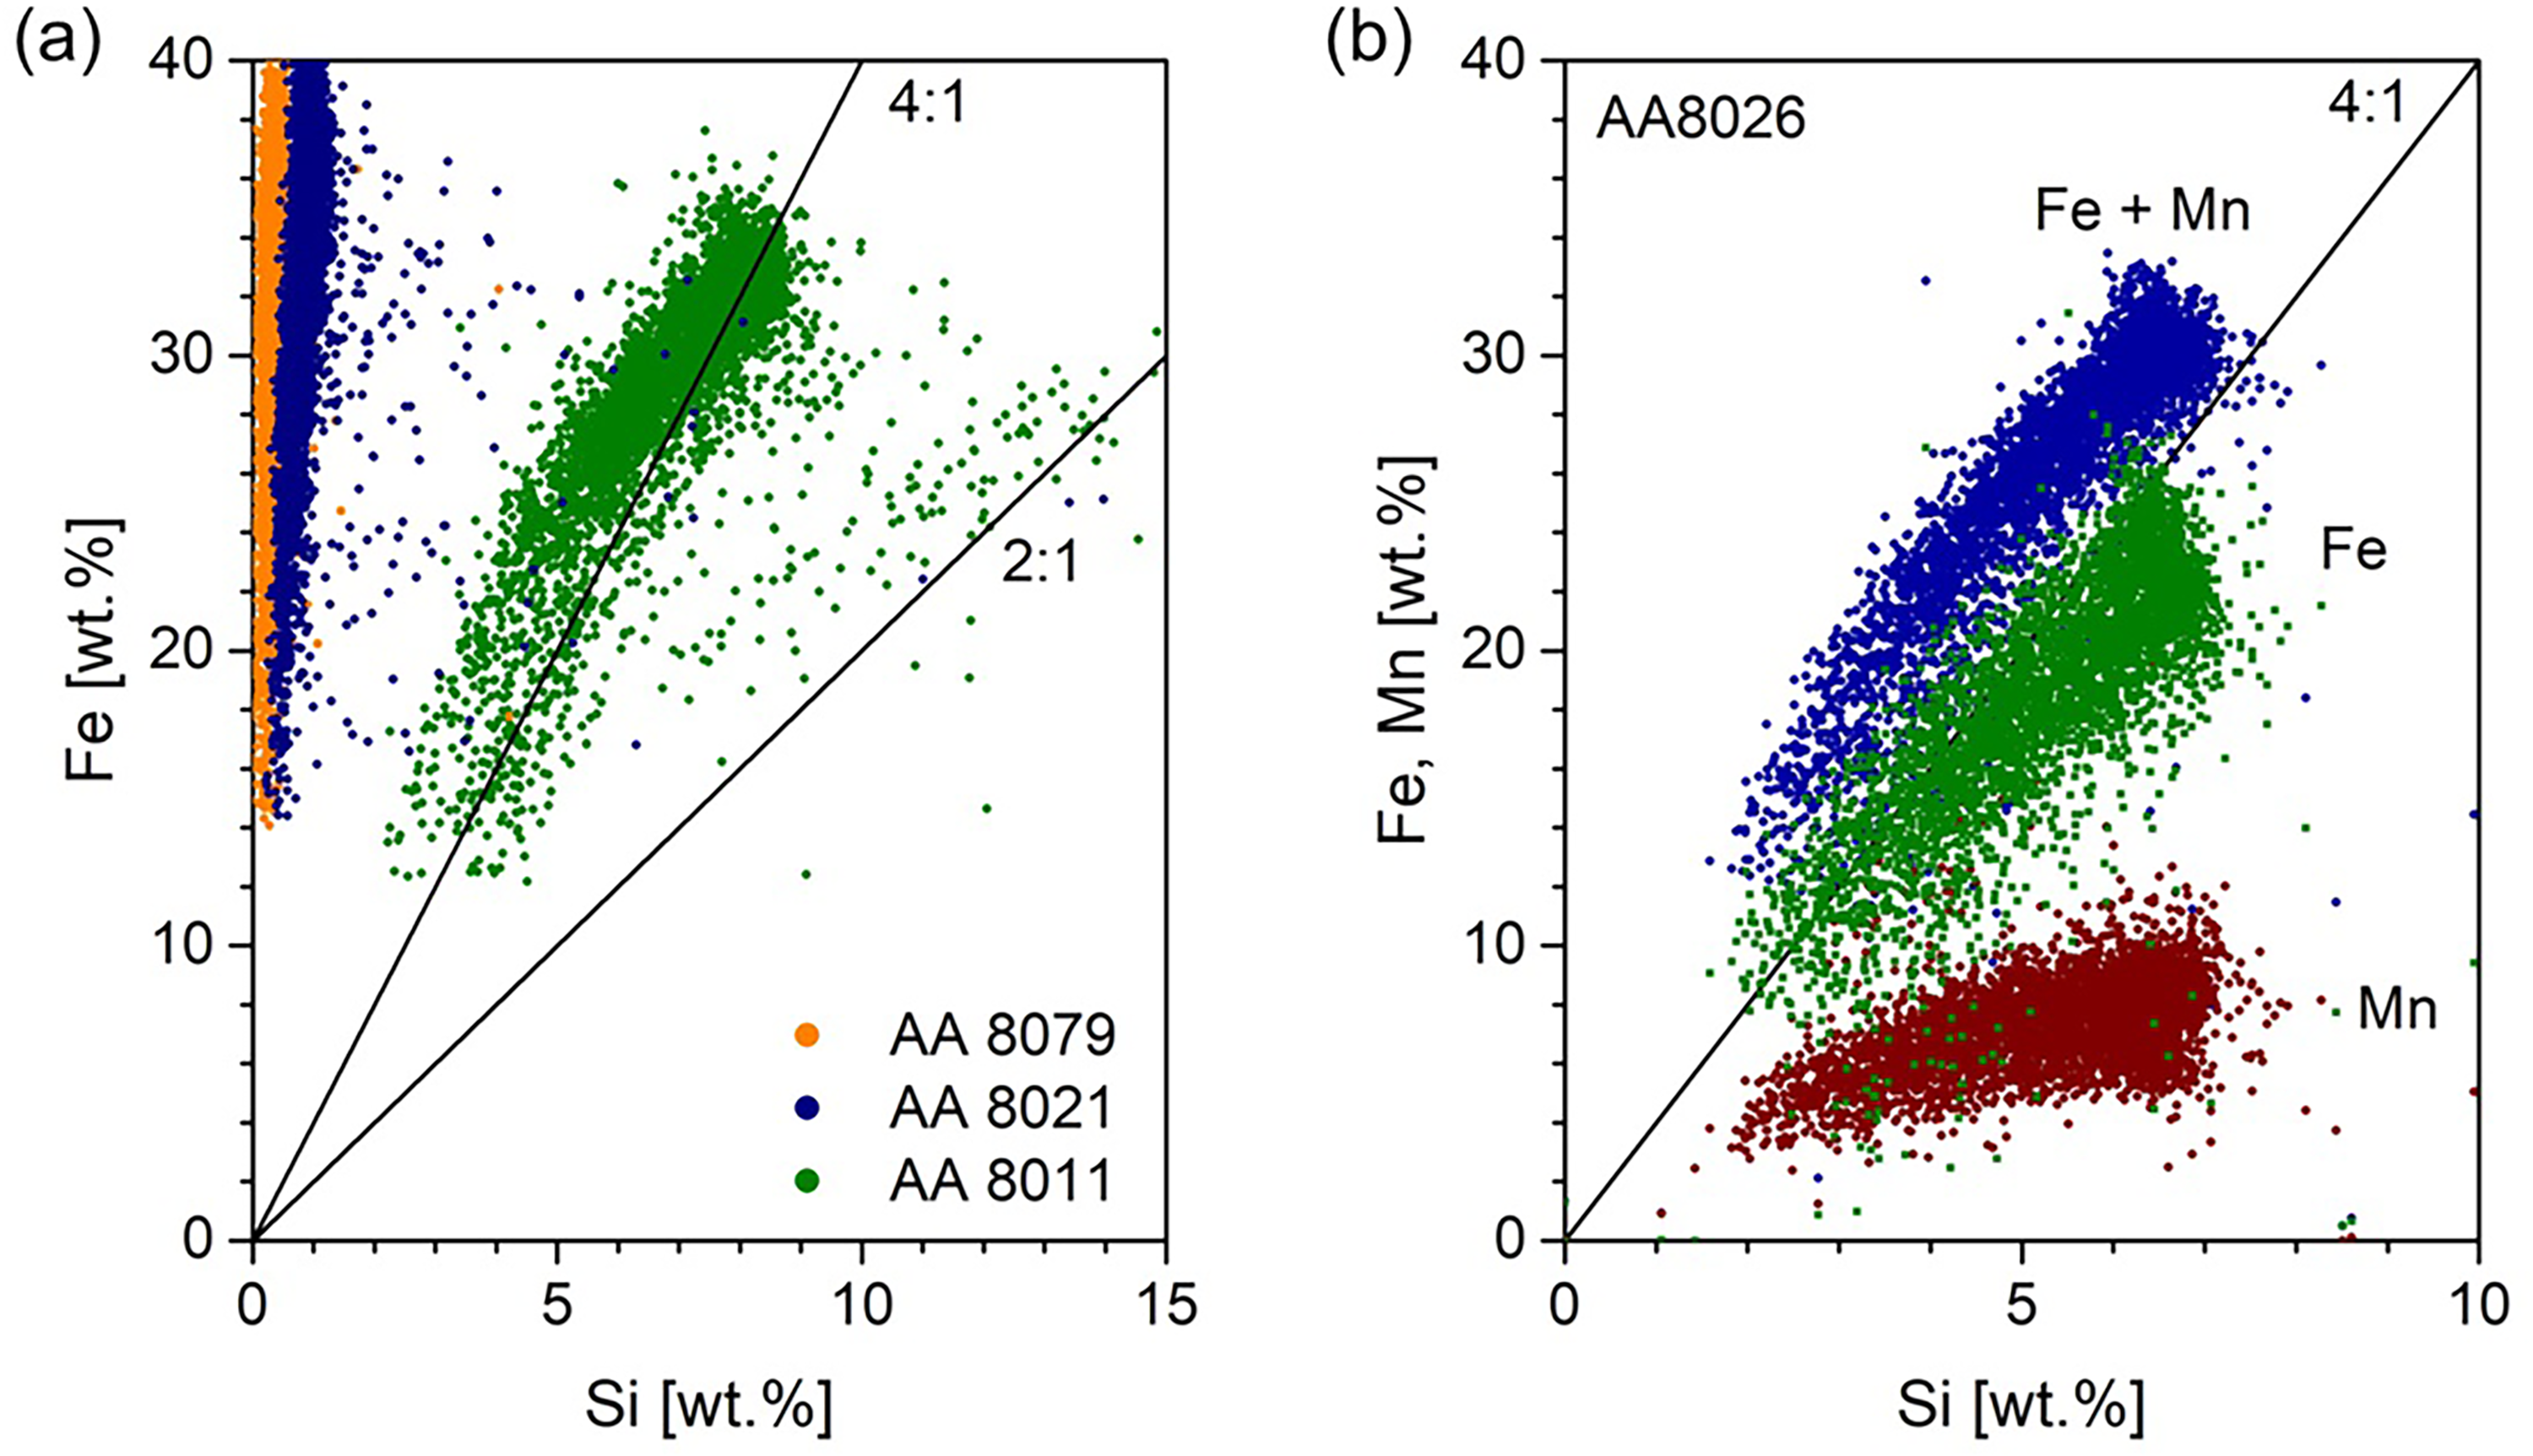
EDS analysis of the constituent particles in the AA 8xxx hot strip samples; (a) Mn-free variants AA 8079 and 8011, and (b) Mn-bearing variant AA 8026 (SEM feature analysis).
A thorough appraisal of the above findings revealed that the two Al–Fe alloy variants, AA 8079 and 8021, showed a quite steep size distribution of constituent particles, with a mean size of 0.7 and 0.8 µm, respectively (Figure 6, Table 2). The area density of the constituents was similar in both alloys, close to 40·103 mm−2, whereas the area fraction increased with the alloys’ Fe content. EDS analysis confirmed that the vast majority of the constituent phases in AA8079 and AA8021 was of the type Al3Fe together with a tiny fraction of α-AlFeSi-phases (Figure 8(a)). 52 Alloy AA 8011 featured a fraction of 2.7% of constituent phases with a mean size of 1.1 µm. This combination of a comparable area fraction with larger particles resulted in a lower particle density of 18·103 mm−2. Most constituent particles disclosed concentrations of both Fe and Si, with Fe:Si ratios of about 4:1 (Figure 8(a)). Hence, these phases are of the type α-AlFeSi (see Ref. 52 ). A few phases revealing much higher Si concentrations were classified as β-AlFeSi (Fe:Si ∼ 2:1) and pure diamond Si (Si >> Fe). The constituent particles obtained in alloy AA 8026 were larger than in the former three alloys; accordingly, their area density was lower (Figure 6, Table 2). Almost all phases in AA 8026 contained significant portions of Si, Fe and Mn, which is characteristic of α-Al(Fe,Mn)Si (Figure 8(b)).
Given that the constituent phases in AA 8xxx series alloys are essentially composed of the elements Fe, Si and, if available, Mn, their area fractions scale with the alloys’ combined Fe + Mn + Si content. By contrast, the particle sizes are independent of the amount of Fe, yet seem to be controlled by the additions of Si and/or Mn. While the two Al–Fe variants AA 8079 and 8021 both had very small mean particle sizes well below 1 µm with narrow size distributions, the phases in alloy AA 8011 with 0.6% Si were larger and the distribution wider. Alloy AA 8026 comprised the largest particles with the lowest density, again combined with a broad size distribution (Figures 5 and 6).
EBSD analysis of the cold rolled and annealed samples
As addressed in detail in the section “experimental procedures”, the crystallographic textures of the different samples were determined by EBSD. For each state – i.e., alloy, rolling reduction and annealing condition – an EBSD map was acquired, and from the resulting data sets ODFs f(g) were computed according to equation (2). Furthermore, from the ODFs the texture indices J were derived according to equation (3). The EBSD maps were also analysed with regard to the average recrystallised grain size. The results of the EBSD measurements are summarised in Table 3 in the form of the recrystallised grain size dGS, the maximum texture intensity f(g)max, the texture index J and the overall texture type. Three examples of the recrystallisation textures which are representative of the present three main texture types are displayed in Figure 9 in the form of grey shades in three characteristic sections of the Euler space, viz. φ2 = 45°, 65° and 90° (see Figure 2). The complete set of ODFs of all samples is given in the appendix (Figures A1–A4).
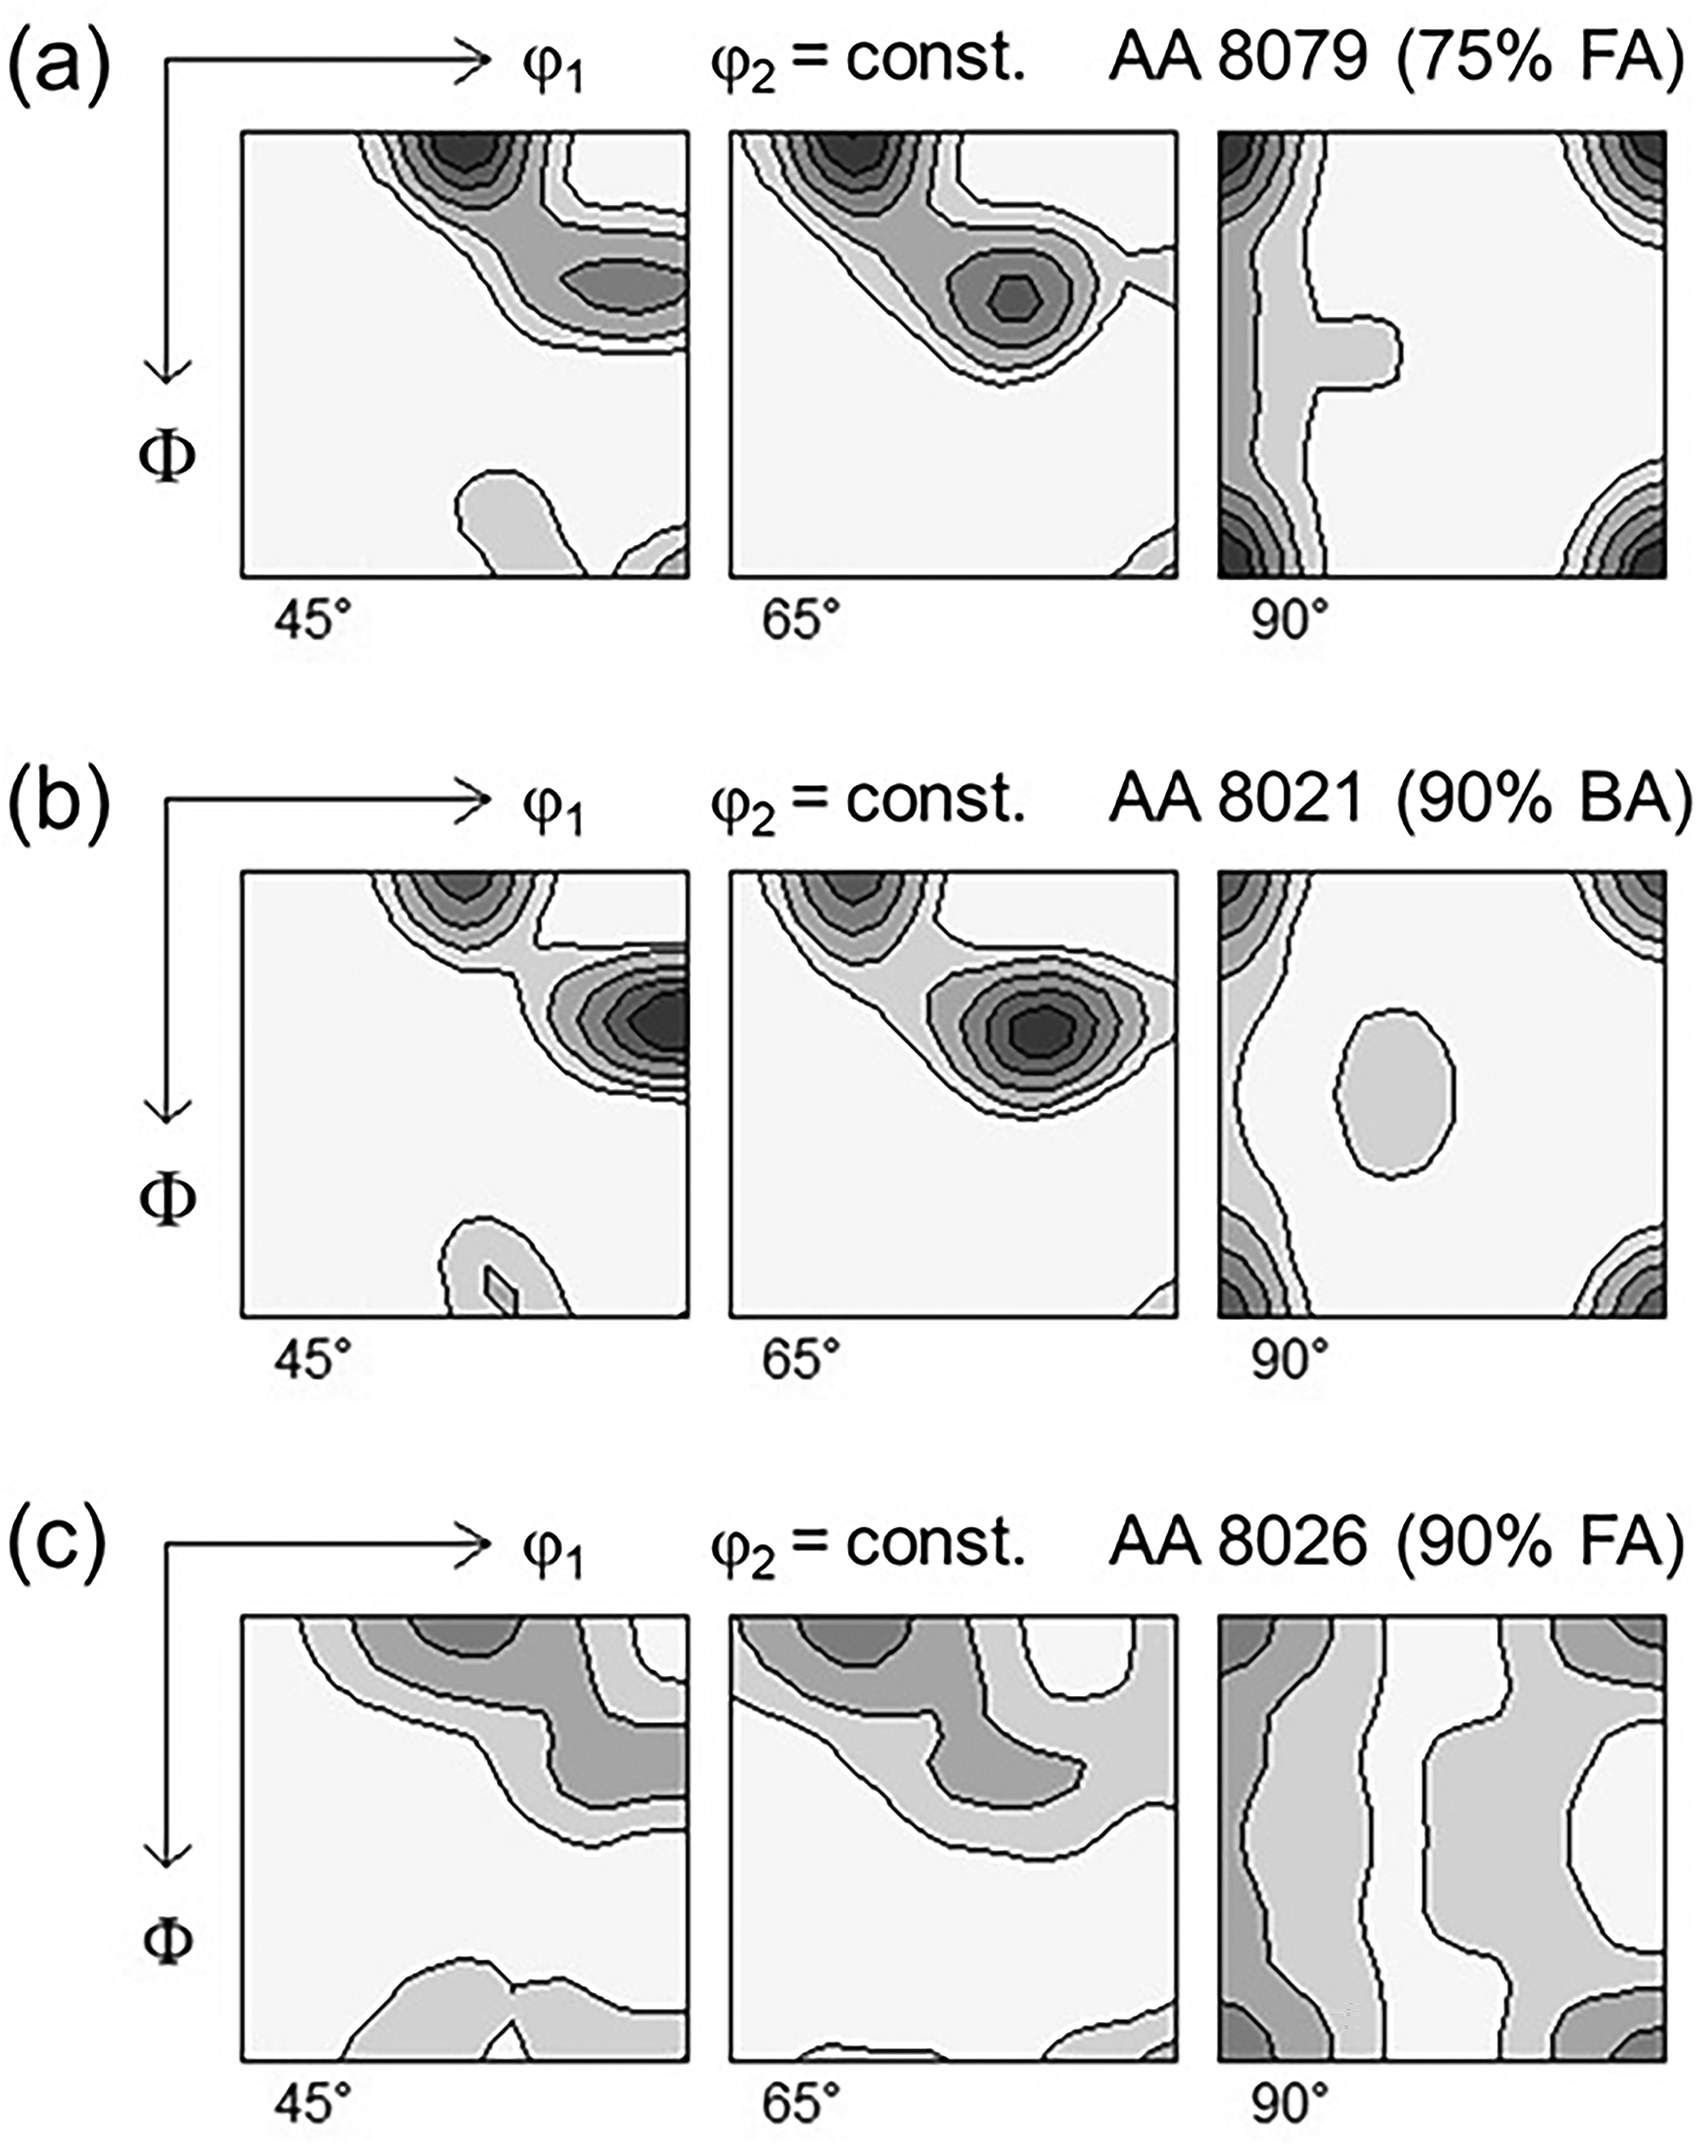
Examples of the recrystallisation texture of the AA 8xxx alloys, showing (a) AA 8079 (75% rolled, FA), (b) AA 8021 (90% rolled, BA) and (c) AA 8026 (90% rolled, FA).
Recrystallised grain size and texture information derived from the EBSD maps (see text for details).
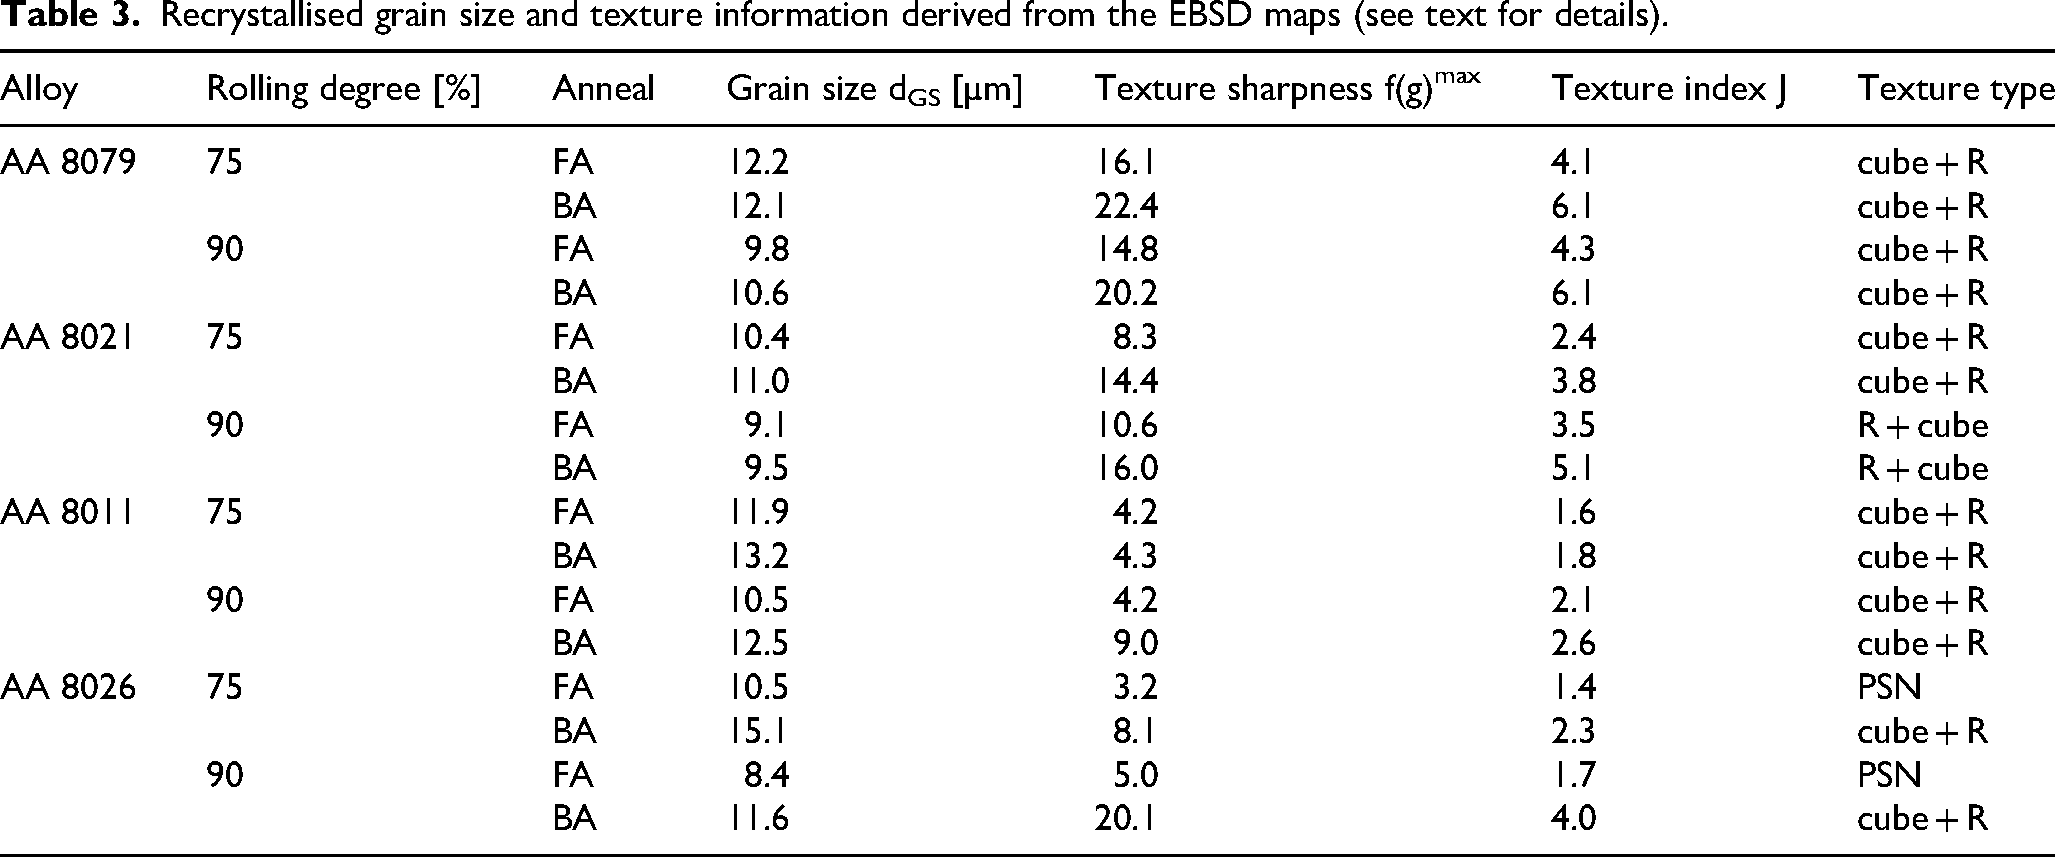
Clearly, the ODFs of the two Al–Fe alloys AA 8079 and 8021 are governed by the cube component together with significant intensities of the retained rolling texture or R orientation (Figures 9(a), A1 and A2). In Table 3 such textures are marked as type cube + R. In several cases, e.g., AA 8021 after 90% rolling, the intensity of the R orientation exceeded that of the cube orientation (Figures 9(b), A1 and A2), which in Table 3 is tagged as type R + cube. Comparing the effect of the Fe content in alloys AA 8079 and 8021 implies that the textures of AA 8021 were generally less pronounced, which is visible from both the maximum texture intensities f(g)max and the texture indices J in Table 3. Similar cube + R textures, yet with much lower sharpness, were obtained in the samples of alloy AA 8011 (Figure A3, Table 3).
By contrast, in the samples of the Mn-containing alloy AA 8026 a different texture type was obtained, most notably in the flash-annealed condition FA, which is labelled PSN in Table 3 (see Figures 9(c) and A4). Here, the texture intensity was rather low and the cube orientation displayed a noticeable scatter about the sheet normal direction (i.e., along Euler angle φ1). Moreover, intensities of the P orientation {011}<233 > at φ1 ∼ 65° in the section φ2 = 90° were observed (Figure 2). As already alluded to earlier, such textures are frequently obtained in the case of PSN. In the batch annealed samples BA both cube and R orientations were stronger, but again intensities of the P orientation were detected.
Finally, we would like to point out that the present texture results correlate well with the earing measurements represented in Figure 4 (see Ref. 54 ). Textures of type cube + R are accompanied by 0°/90° earing, with the earing level Z generally increasing with the sharpness of the cube orientation. In the samples with R + cube textures the rolling texture orientations dominated, leading to pronounced ±45° earing. The weak PSN textures of alloy AA 8026 resulted in a very mild in-plane anisotropy.
Discussion
Efficiency of PSN
The formation of recrystallisation texture is the result of the underlying microstructural mechanisms of nucleation and growth that occur during annealing in the as-deformed state.26,29,30 The present measurements corroborate that the recrystallisation textures of AA 8xxx series alloys are constituted by grains nucleating at cube bands, pre-existing grain boundaries and large constituent particles, with strongly varying contributions (e.g., 24 ).
Cube bands are band-like features present in the as-deformed microstructure which contain a noticeable fraction of cube-oriented subgrains.26–30,37 According to the well-known Dillamore and Katoh mechanism, the cube bands are transition bands that form when an unstable divergent crystal orientation, including cube, tends to split off into two different orientations on deformation.55,56 The two parts of the initial cube-oriented grain rotate apart toward two symmetrically equivalent rolling texture orientations. The transition band then represents a band-like remnant of the splitting grain that still comprises its original orientation, viz., the cube orientation. In commercial Al sheet products cube bands may also be retained cube grains stemming from a previous step of recrystallisation along the upstream processing chain, including hot rolling, cooling of the coiled hot strip and/or inter-annealing.57,58
The prerequisite of large local misorientations and, therewith, sufficiently high grain boundary mobility is naturally given in the microstructure regions close to the pre-existing grain boundaries between the deformed grains. This gives rise to favourable conditions for recovery and, consequently, for successful nucleation events at the grain boundaries. Recrystallisation nuclei may form by bulging of a given grain boundary into a neighbour grain with a lower dislocation density (strain-induced boundary migration 26 ). In Al alloys, which usually comprise a recovered subgrain structure prior to the onset of recrystallisation, nucleation at a grain boundary will more likely proceed by the growth of a given subgrain on one side of the boundary into the deformed microstructure on the opposite side. Irrespective of the exact nucleation mechanism, the resulting recrystallised grains inherit orientations of the former deformation texture, including the characteristic R orientation.23,24,26–30,39,59 With increasing rolling strain, the pre-existing grain boundaries are pushed closer together, hence, the nucleus density will rise. Simultaneously, there is an increasing tendency for the cube bands to fade out. This readily explains the shift in the ratio of cube and R recrystallisation texture components towards the latter as observed at the higher rolling strain (Figure 9(a), (b), Table 3).
Turning now to the mechanism of PSN, the disturbed zones around large particles can also act as nucleation sites. According to Humphreys, 33 these so-called deformation zones are caused by the deformation incompatibilities at the matrix/particle interface, where very high dislocation densities and, consequently, strong lattice rotations are established during rolling. During the early stages of annealing, the dislocations recover rapidly into a fine network of subgrains which are substantially smaller than the subgrains in the matrix well away from the particle. In the next stages of annealing, the subgrains in this very fine local subgrain structure coarsen, until one or very few large subgrains have finally consumed the deformation zone and have formed high-angle grain boundaries to the surrounding matrix. Finally, if their size exceeds the critical nucleus size, the enlarged subgrains may be able to start growing into the deformed matrix. Because of the high local orientation scatter present in the original deformation zones, the textures of samples where recrystallisation is dominated by PSN are typically quite weak with a high fraction of randomly oriented grains.23,26,29,32 Subsequent (micro-)growth selection then leads to the characteristic weak PSN recrystallisation textures with intensities of an ND rotated cube orientation {001}<310 > and the P orientation {011}<233>.24,25,28,31,60
Thus, the efficiency of PSN strongly depends on the availability of suited particles that are large enough to accommodate a nucleus of critical size in the surrounding deformation zone. The critical size dcrit for nucleation of recrystallisation is generally expressed as
29
: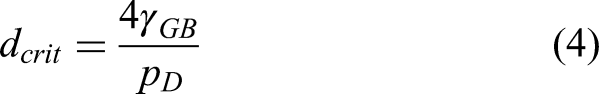
With regard to PSN, the maximum possible nucleus size is reached when the nucleus has consumed the entire deformation zone. If we assume that the size of the original deformation zone is related to that of the centre particle, dP, it follows that dcrit in equation (4) is proportional to dP.25,29,33 Consequently, since the stored energy pD in the matrix outside the deformation zone commonly increases with strain, there will be a strain-dependent particle size, below which PSN will not occur. Figure 10 shows the results of an experimental study on the effect of particle size and strain on the occurrence of PSN in cold rolled Al–Si single crystals, redrawn from the original paper by Humphreys. 33 The two rolling strains used in the present study, 75% and 90%, are marked. Clearly, for both strains large particles with sizes of almost 2 µm are required to initiate PSN.
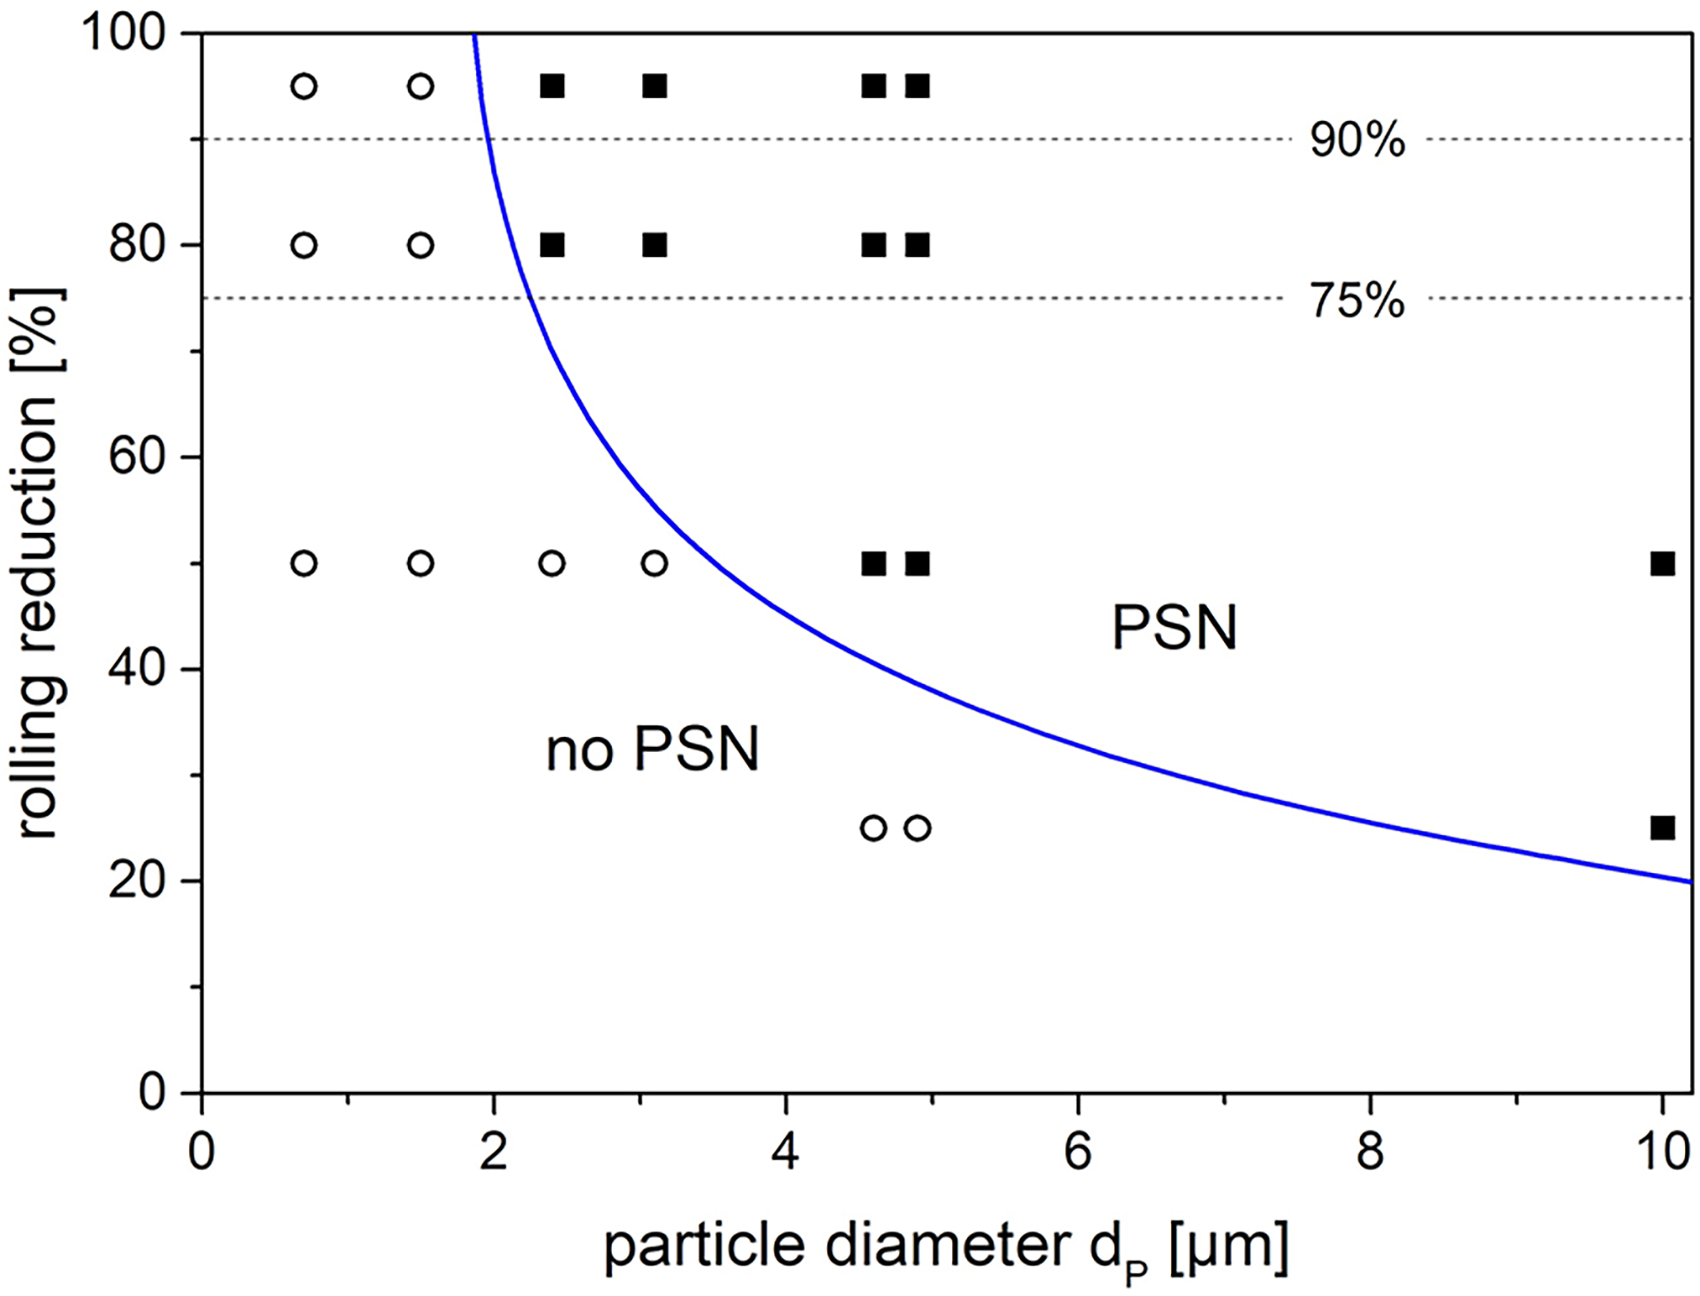
The effect of rolling reduction and particle size dP on the occurrence of PSN (redrawn from Ref. 33 ).
Thus, following the above discussion, for an assessment of the efficiency of PSN only particles greater that 2 µm are of interest. In the section “experimental results” we have analysed the particle size distributions of the constituent phases in the present AA 8xxx series alloys. From Table 2 it is clear that the mean sizes of the constituent phases in all of the present alloys are substantially smaller than the 2 µm threshold size, such that PSN is restricted to the large particles located in the tail of the respective size distributions (Figure 6). Conversely, all dispersoids as well as a large portion of the smaller constituents with sizes below the given threshold can be disregarded in the assessment of PSN. Accordingly, the binned values of the particle size distributions were accumulated, starting from the 2 µm threshold size necessary for evoking PSN (left) to the maximum particle sizes in the tail (right). 61 Figure 11 shows the resulting cumulative particle size distributions (CDF) for the present AA 8xxx alloys, where the accumulated particle densities nA provide a meaningful measure for the efficiency of PSN in the respective alloys.
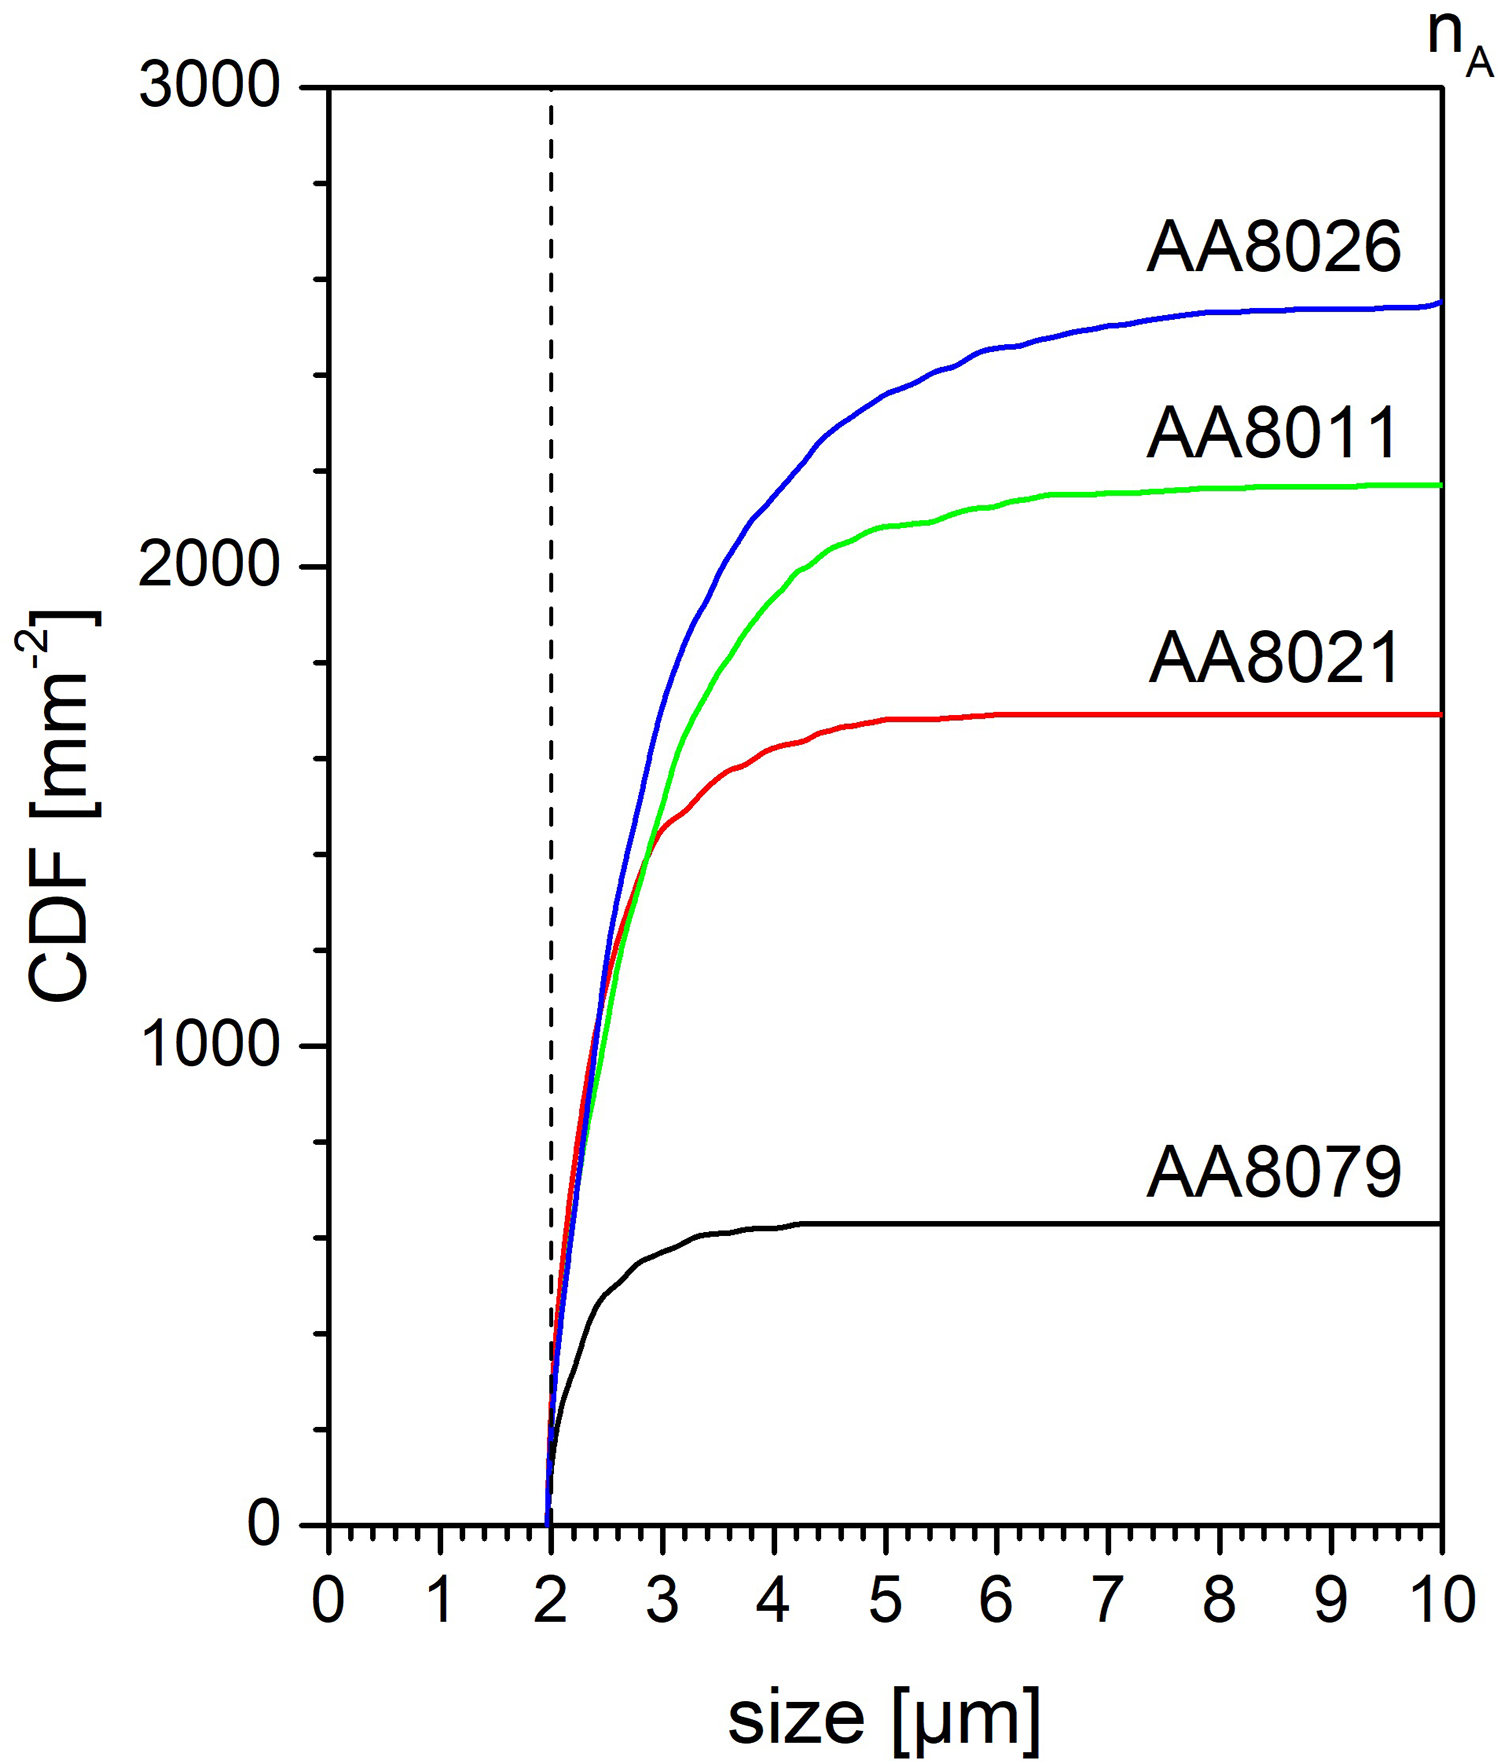
Cumulative particle size distribution (CDF) of the second-phase particles with sizes exceeding 2 µm in the AA 8xxx hot strip samples (bin size 0.1 µm, SEM feature analysis; see Figure 6).
Obviously, there are significant differences in the cumulative area density of particles with a size sufficiently large to initiate PSN, nA. The smallest value of some 600 particles per square mm is obtained in alloy AA 8079. Under the assumption that all of these particles would produce one nucleus and, in turn, one recrystallised grain, a cumulative area density nA of 600 mm−2 would relate to a final grain size
Indeed, there is a correlation of the sharpness of the recrystallisation textures, which is a rough measure of the efficiency of PSN, with the density of large particles. To illustrate this, Figure 12 shows the texture index, J, as a function of the cumulative area density nA (the dashed curve is only a guide for the eye). Despite considerable scatter the diagram discloses a tendency for the texture index J to decrease with the cumulative particle density nA, in the sequence AA 8079 → AA 8021 → AA 8011 → AA 8026. It is emphasised that this sequence does not correlate with the average particle features given in Table 2, viz. area fraction and, expressly, total particle density. Clearly, the texture indices for the condition 90% rolled and batch annealed (90% BA; blue symbols) were always significantly higher than the trend curve, which will be discussed in the next section.
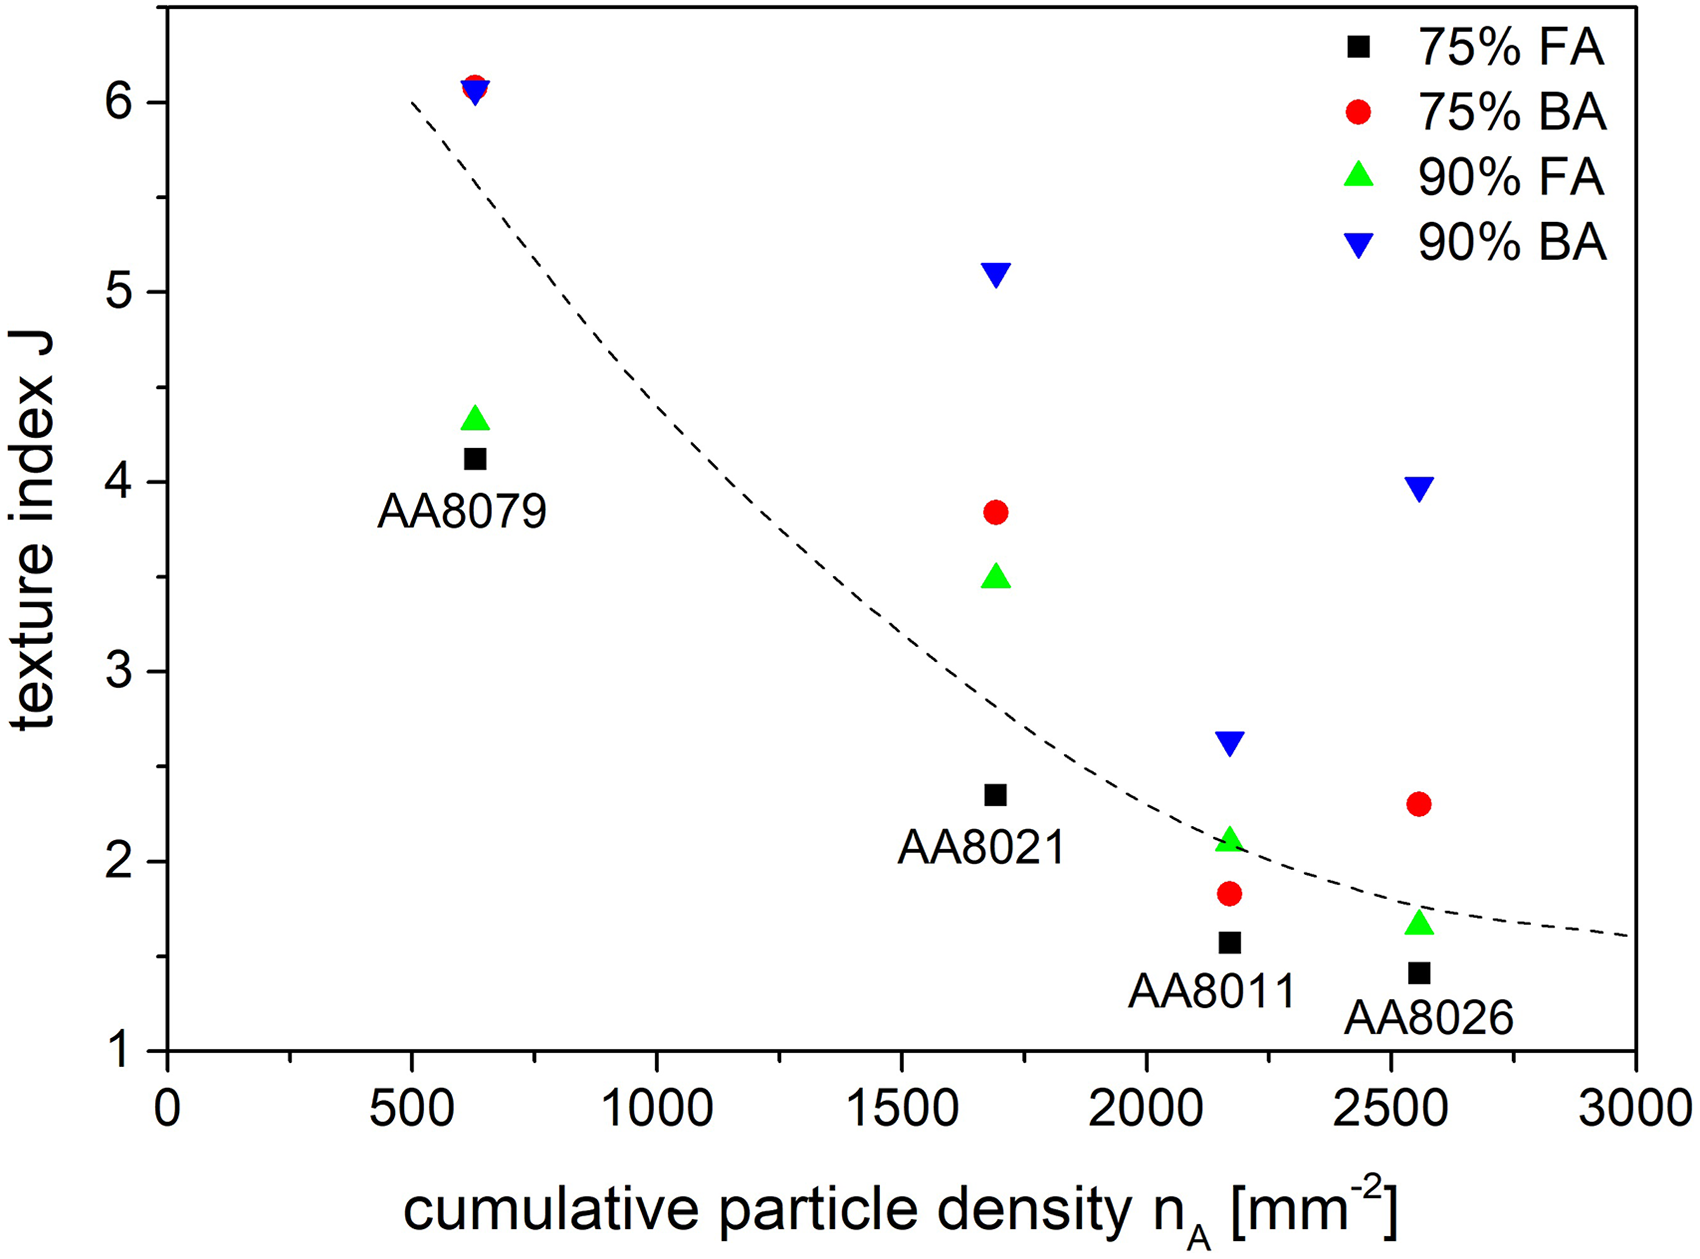
Texture index, J, as a function of the cumulative particle size distribution of particles with sizes exceeding 2 µm, nA, in the AA 8xxx hot strip samples.
The foregoing derivation was developed for a minimum particle size of 2 µm as a threshold to initiate PSN (Figure 10). A decrease in the threshold size will naturally lead to larger values of the cumulative area density nA which, for very small minimum sizes, will eventually approach the summed area densities given in Table 2. The above conclusions hold for threshold sizes exceeding about 1.5 µm, even though the absolute numbers of nA will clearly vary with the exact minimum value for PSN. For smaller threshold sizes below 1.5 µm the sequence AA 8079 → AA 8021 → AA 8011 → AA 8026 is altered, however. In reverse conclusion the latter finding validates the above argument that PSN in the present AA 8xxx series alloys is limited to the large constituent particles in the tail of the size distribution with sizes of about 2 µm and up.
Evidently, the present discussion is entirely based on indirect evidence of PSN via texture type and sharpness as well as grain size information. Because of the small size of both the underlying constituent particles and the recrystallisation nuclei, and the 3D nature of recrystallisation in general, direct metallographic proof of PSN is intricate. On the other hand, random texture and reduced grain size are widely accepted as indirect proof for PSN, see the large number of references on this topic.4,18,23–38,60,61 In the present study this indirect proof for PSN is correlated with the size distribution of the constituent particles, revealing a distinct correlation of the deduced efficiency of PSN with the cumulative number of second-phase particles greater than 2 µm (Figure 12).
In that context it is interesting to note that the values of mean particle size and area fraction found in the present study (Table 2) differ markedly from the results obtained for other non-age-hardenable alloys of the AA 3xxx and 5xxx series (compare data reported e.g., in Refs.16,49,52 with Refs.62,63). These more highly alloyed materials typically comprise coarser constituents of 1.5 … 5 µm with lower area densities well below 10·103 mm−2. Accordingly, although low alloyed AA 8xxx packaging sheet usually contains comparable volume fractions of suited second-phase particles, it follows from the above discussion that PSN will generally be less prevalent than in AA 5xxx and, most notably, AA 3xxx wrought alloys.
Effect of heating rate and dispersoids
A thorough assessment of the recrystallisation textures indicated that the batch-annealed material (BA) displayed some characteristic differences with regard to the flash-annealed sheets (FA). The textures of the batch-annealed samples were generally more pronounced than their flash-annealed counterparts, as indicated by larger values of texture sharpness f(g)max and texture index J (Table 3). This phenomenon was particularly pronounced in alloy AA 8026, where PSN seems to play the strongest role among the present alloys. Here, the two flash-annealed samples revealed weak typical PSN textures, whereas the textures of the batch-annealed ones comprised significantly higher cube and R orientations, while the characteristic P orientation remained weak (Figure A4, Table 3).
The observed differences point at a selective suppression of PSN, while the competing nucleation sites were less affected. These differences are attributed to the distinct geometrical features of the various nucleation sites. During recovery, the matrix driving force pD generally decreases which, according to equation (4), leads to an increase in the critical nucleus size dcrit. As discussed in the previous section, in the case of PSN the critical nucleus size will eventually exceed the maximum size of the deformation zones, so that PSN can no longer take place. In contrast, the subgrains within the cube bands or along the pre-existing grain boundaries are less constrained and can hence expand more easily during recovery, until reaching the critical nucleus size. Therewith, upon slow batch annealing, PSN is disfavoured to the benefit of the nucleation events at the cube bands and pre-existing grain boundaries.64–66 The reduction in the number of activated PSN nuclei goes along with an increase in the recrystallised grain size, which was indeed observed experimentally in the batch-annealed samples (Table 3).
Along the same lines, a similar selective retardation of PSN was repeatedly reported during recrystallisation of alloys containing a certain fraction of fine dispersoids besides the coarse constituent phases.67–69 The dispersoids are known to exert a back driving force on the grain boundaries, the so-called Zener drag pZ. Then, the driving force in equation (4) is replaced by a net driving force, pD – pZ,29,30 which again leads to an increase in the critical size for successful nucleus growth, dcrit. With regard to the present Mn-rich alloy AA 8026 it shall be emphasised however that the existing distribution of comparably coarse dispersoids results in a Zener drag pZ of less than 0.1 MPa, which is presumably too low to noticeably bias the active nucleation sites.
Summary and conclusions
In the present paper we have analysed the progress of recrystallisation and especially the evolution of recrystallisation textures during annealing of Al–Fe packaging sheet as a function of the distribution of second-phase intermetallic particles. Four commercial AA 8xxx series alloys were selected based on their chemical composition in terms of Fe and Si, where one alloy, AA 8026, additionally comprised significant additions of Mn. The main emphasis of the study was put on the efficiency of PSN at the large constituent phases. The following conclusions can be drawn.
The recrystallisation textures of the present AA 8xxx series alloys are composed of new grains emerging from three characteristic nucleation sites in the as-deformed microstructure, viz. cube bands, pre-existing grain boundaries, and PSN at the large constituent particles. The efficiency of each of these three nucleation mechanisms strongly depends on the details of the as-rolled microstructure, especially on the size distribution of second-phase particles. PSN is limited to the deformation zones around large constituent particles with sizes of about 2 µm and up. In the present AA 8xxx series alloys with comparably small constituent phases this pertains only to a minor fraction in the tail of the particle size distribution. Indeed, there is a good correlation of the cumulative number of second-phase particles greater than 2 µm with the efficiency of PSN. Among the present alloys, the Mn-rich variant AA 8026 featuring the largest constituent phases together with a broad particle size distribution showed the most distinct effects of PSN. Compared to more highly alloyed materials, the present low alloyed AA 8xxx packaging products comprised finer constituents with larger area densities. Accordingly – despite comparable volume fractions of suited second-phase particles – PSN in lean AA 8xxx alloys will generally be less pronounced than e.g., in AA 5xxx and, expressly, AA 3xxx sheets. In sheets subjected to a batch-anneal with a slow heating rate, PSN was less effective than in flash-annealed samples, leading to recrystallisation textures with stronger cube and R orientations and an enlarged grain size. The extended recovery during the slow heat-up is accompanied by an increase in the critical nucleus size. In the case of PSN, the critical nucleus size may exceed the maximum size provided by the deformation zones, while subgrains in the cube bands or at the pre-existing grain boundaries can expand more easily. This leads to a bias towards nuclei with cube and R orientations to the disadvantage of PSN.
Footnotes
Acknowledgements
The author wishes to thank his colleagues within the company for their support and advice, esp. Mr T. Schröter and Dr F. Landgraf.
Author contribution(s)
Funding
The author received no financial support for the research, authorship, and/or publication of this article.
Declaration of conflicting interests
The author declared no potential conflicts of interest with respect to the research, authorship, and/or publication of this article.