
Abstract
To investigate the heterogeneity induced by hot stamping deformation, the microstructure and mechanical properties of Fe-19Cr-10Ni-1Mn austenitic stainless steel were characterized at different locations of the formed curved part. The grain misorientation angle distribution, texture evolution and grain boundaries character distributions at typical positions were investigated. Microstructure analysis demonstrates pronounced inhomogeneity in both grain structure and microtexture evolution across distinct deformation zones of the component, and a limited amount of martensitic transformation was induced in specific locations due to the large strain and subsequent rapid cooling. The combined analysis of stress-strain curves and microstructure reveals that the properties primarily depend on the uniform grain structure and high fraction of Σ3 twin boundaries, with minor contributions from dislocations and martensitic transformation.
Introduction
Austenitic stainless steel, which is non-magnetic at room temperature with low yield ratio, excellent plasticity, remarkable intergranular corrosion resistance, high-temperature mechanical properties and good weldability, has been widely applied in chemical, marine and nuclear industries.1–3 As a typical face-centered cubic (FCC) metal with low to medium stacking fault energy (SFE), it maintains a highly stable single-phase austenitic structure at room temperature, endowing austenitic stainless steel with superior formability characterized by optimal work hardening rate and elongation.4,5 However, the cold formability exhibits an inverse correlation with tensile strength enhancement, accompanied by the widespread issues of cracking and springback.6–8 To combat the inherent limitations of conventional forming methodologies, hot stamping has emerged as a transformative solution for manufacturing ultra-high-strength components, which is an innovative sheet metal precision forming process combining traditional hot forging with cold stamping techniques.9,10 Extensive research has focused on finite element simulation, process optimization, and formability enhancement in hot stamping of high-strength steels,11–13 whereas studies on hot stamping of austenitic stainless steel remain relatively limited. 14 Besides, for large complex-shaped curved components, excessive localized strain during the hot stamping may still lead to crack initiation in the microstructure, ultimately resulting in component damage and fracture.15,16 Consequently, systematic investigation into the microstructural evolution and concomitant mechanical property variations during hot stamping processing of austenitic stainless steel is critical for optimizing hot-forming parameters and enhancing component service performance.
Many researchers have carried out a series of researches on the dynamic recrystallization (DRX) behavior, grain boundary characteristics and texture component evolution during hot deformation. In thermomechanical processing, superior mechanical properties are often attained through grain refinement, a process achieved by facilitating dynamic recrystallization (DRX) during hot deformation. 17 Arun Babu et al. 18 examined the effects of strain rate and initial grain size during the hot deformation of Super-304H austenitic stainless steel, and identified that the interplay between continuous (CDRX) and discontinuous (DDRX) dynamic recrystallization mechanisms results in substantial variations in the kinetics of grain refinement. These studies on the hot deformation of austenitic stainless steel all conducted through thermal simulation experiments, while research on the microstructure evolution during industrial hot stamping have been largely focused on high-strength steels.19,20 Moreover, grain boundary has been fundamentally recognized as a critical microstructural determinant governing multifunctional performance in advanced engineering applications.21,22 To enhance the resistance of grain boundary to corrosion and mechanical damage, grain boundary engineering (GBE) has been proposed to optimize the grain boundary character distribution (GBCD).23,24 In thermomechanical processing, the properties associated with grain boundaries are commonly enhanced through the introduction of coincidence site lattice (CSL). 25 The CSL model provides a rigorous framework for classifying grain boundaries into Low-ΣCSL boundaries (Σ≤29) and random boundaries (general high-angle boundaries and Σ>29 boundaries). 26 Numerous studies have shown that low-ΣCSL grain boundaries exhibit lower diffusion rates and milder grain boundary segregation compared to random grain boundaries, resulting in lower grain boundary sliding rates, higher resistance to intergranular cracking, lower grain boundary hardening rates and lower electrical resistivity.27,28 Kumar et al. 29 investigated GBCD and room temperature tensile properties in 304L stainless steel subjected to controlled thermomechanical processing, and revealed that the elongation and strain hardening index gradually increased with the increase of Σ3 grain boundary ratio, while the yield strength decreased linearly with equivalent Σ3 boundary elevation. Sinha et al. 30 also discovered in their study on the effects of GBE on the microstructure and mechanical properties of a copper-containing austenitic stainless steel that a high proportion of low-ΣCSL boundaries (Σ≤29) can significantly enhance the plasticity. Furthermore, the internal grains of austenitic stainless steel undergo crystallographic rotation and progressively align along specific orientations during plastic deformation, resulting in the formation of pronounced deformation texture, which fundamentally affects the mechanical properties. 31 Many researchers have reported the texture evolution of cold deformation in 316L stainless steel. For example, ZHANG et al. 32 characterized the microstructural evolution of 316L stainless steel cold rolled to reductions from 10 to 80 pct, found that the formation of both deformation twins and shear bands have a significant effect on the texture evolution. Majid et al. 33 demonstrated distinct crystallographic texture characteristics in deformed austenite under two rolling modes. The unidirectional rolled sample exhibited predominant Brass, Goss, and γ-fibre texture components, while Brass dominated as the primary texture in the cross-rolled sample. However, there are few studies on the texture components during thermoplastic deformation.
In this paper, Fe-19Cr-10Ni-1Mn austenitic stainless-steel component with curvature geometries was fabricated via die-assisted hot stamping. The microstructure evolution and deformation behavior at different regions of the curved surface structure were systematically investigated, revealing the dominant deformation mechanisms of twinning and dislocation slip during thermomechanical processing. Furthermore, the effects of grain boundary distribution and crystallographic texture on the microstructural evolution and mechanical properties were analyzed, providing theoretical guidance for optimizing manufacturing processes of high-performance curvature components.
Materials and methods
The material used in this study is 5 mm thick austenitic stainless-steel plate, with alloy composition (wt.%): 18.9Cr, 10.28Ni, 1.141Mn, 0.008Mo, 0.32Si, 0.036S, 0.014P and the balance of Fe. The sheet material was preheated to 1100°C and kept for 5 min to ensure cross-sectional thermal homogenization. Then, it was transferred to the mold cavity and the hydraulic press was activated to apply normal compressive stress to complete the hot stamping process. The schematic diagram of the hot stamping mold is shown in Figure 1(a). The mold temperature is 25°C, the hot processing speed is 150 mm/s, and the holding time is 5 s. The workpiece was water-cooled to room temperature, after which three specimens were cut along the rolling direction (RD) at four different locations conformed well to the standards specified in ISO 6892-1:2019. The wire cutting marks around the specimens were removed using sandpaper before conducting tensile tests. The tensile testing was displacement-controlled with a constant speed of 0.3 mm/min. The sampling locations and tensile specimen shape are shown in Figure 1(b) and (c), respectively.
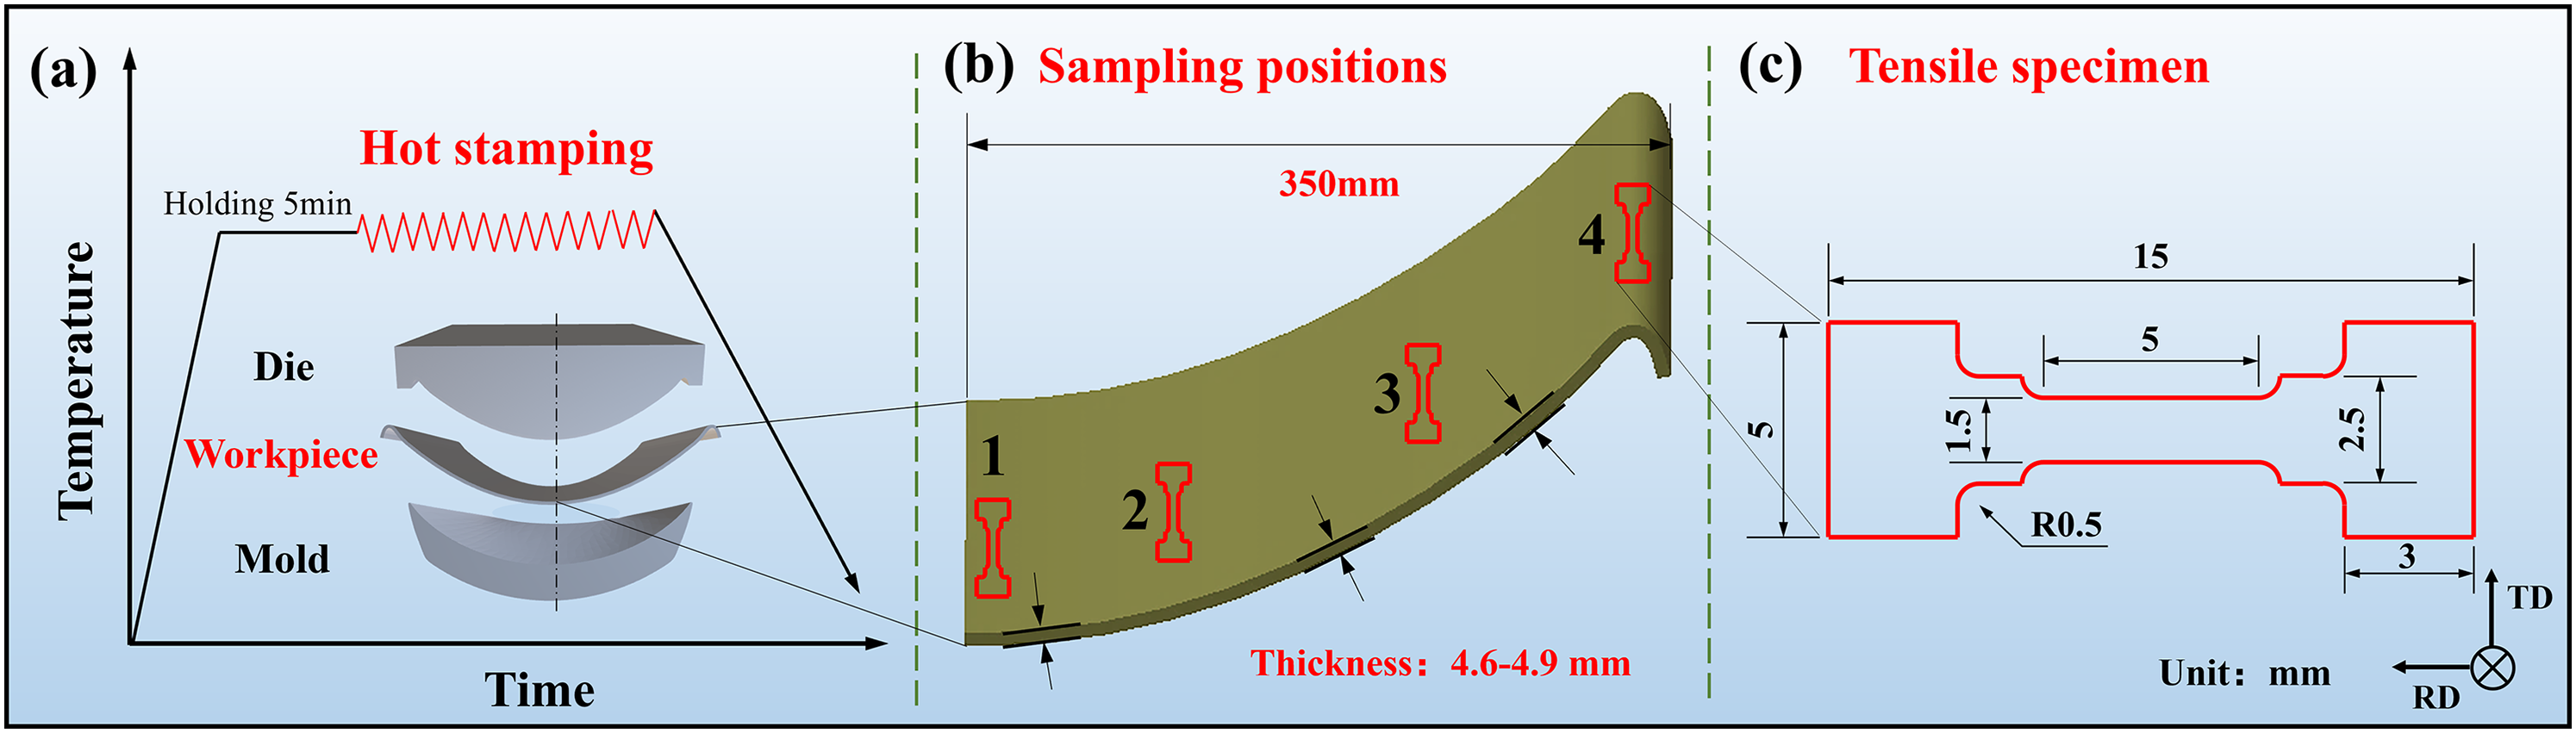
Schematic diagram of hot stamping and experimental process in this work.
The x-ray diffractometer (XRD) was employed for phase identification of the specimens with a step size of 2°, ranging from 30° to 100° (2θ). Electron backscatter diffraction (EBSD) characterization was conducted on the as-received and deformed samples to analyze the changes in grain orientation inside the material. The EBSD samples were ground using water sandpaper, followed by mechanical polishing and subsequent electropolishing. The polishing solution consisted of 10% perchloric acid in an ethanol mixture, with electrolysis performed at 25 V for 20 s under room temperature. All EBSD analyses were conducted on the RD-TD plane at the mid-thickness layer (1/2 thickness) of the component. The EBSD testing was conducted at an accelerating voltage of 20 kV with a scanning step size of 1.5μm, followed by analysis of the acquired data using HKL Channel 5 software.
The microstructure of the material before hot stamping was shown in Figure 2. It can be observed from the inverse pole figure (IPF) maps that the initial microstructure consists of numerous austenitic grains, and the grain size is relatively uniform with an average of 4.25 µm according to the statistical analysis (Figure 2(c)). The misorientation angle distribution indicates that many lamellar structures inside the grains should be corresponding to the annealing twins with the specific misorientation (60°). Moreover, the misorientation angle distribution of the initial specimen was relatively random, as evidenced by the absence of pronounced texture in the PF map (Figure 2(d)).
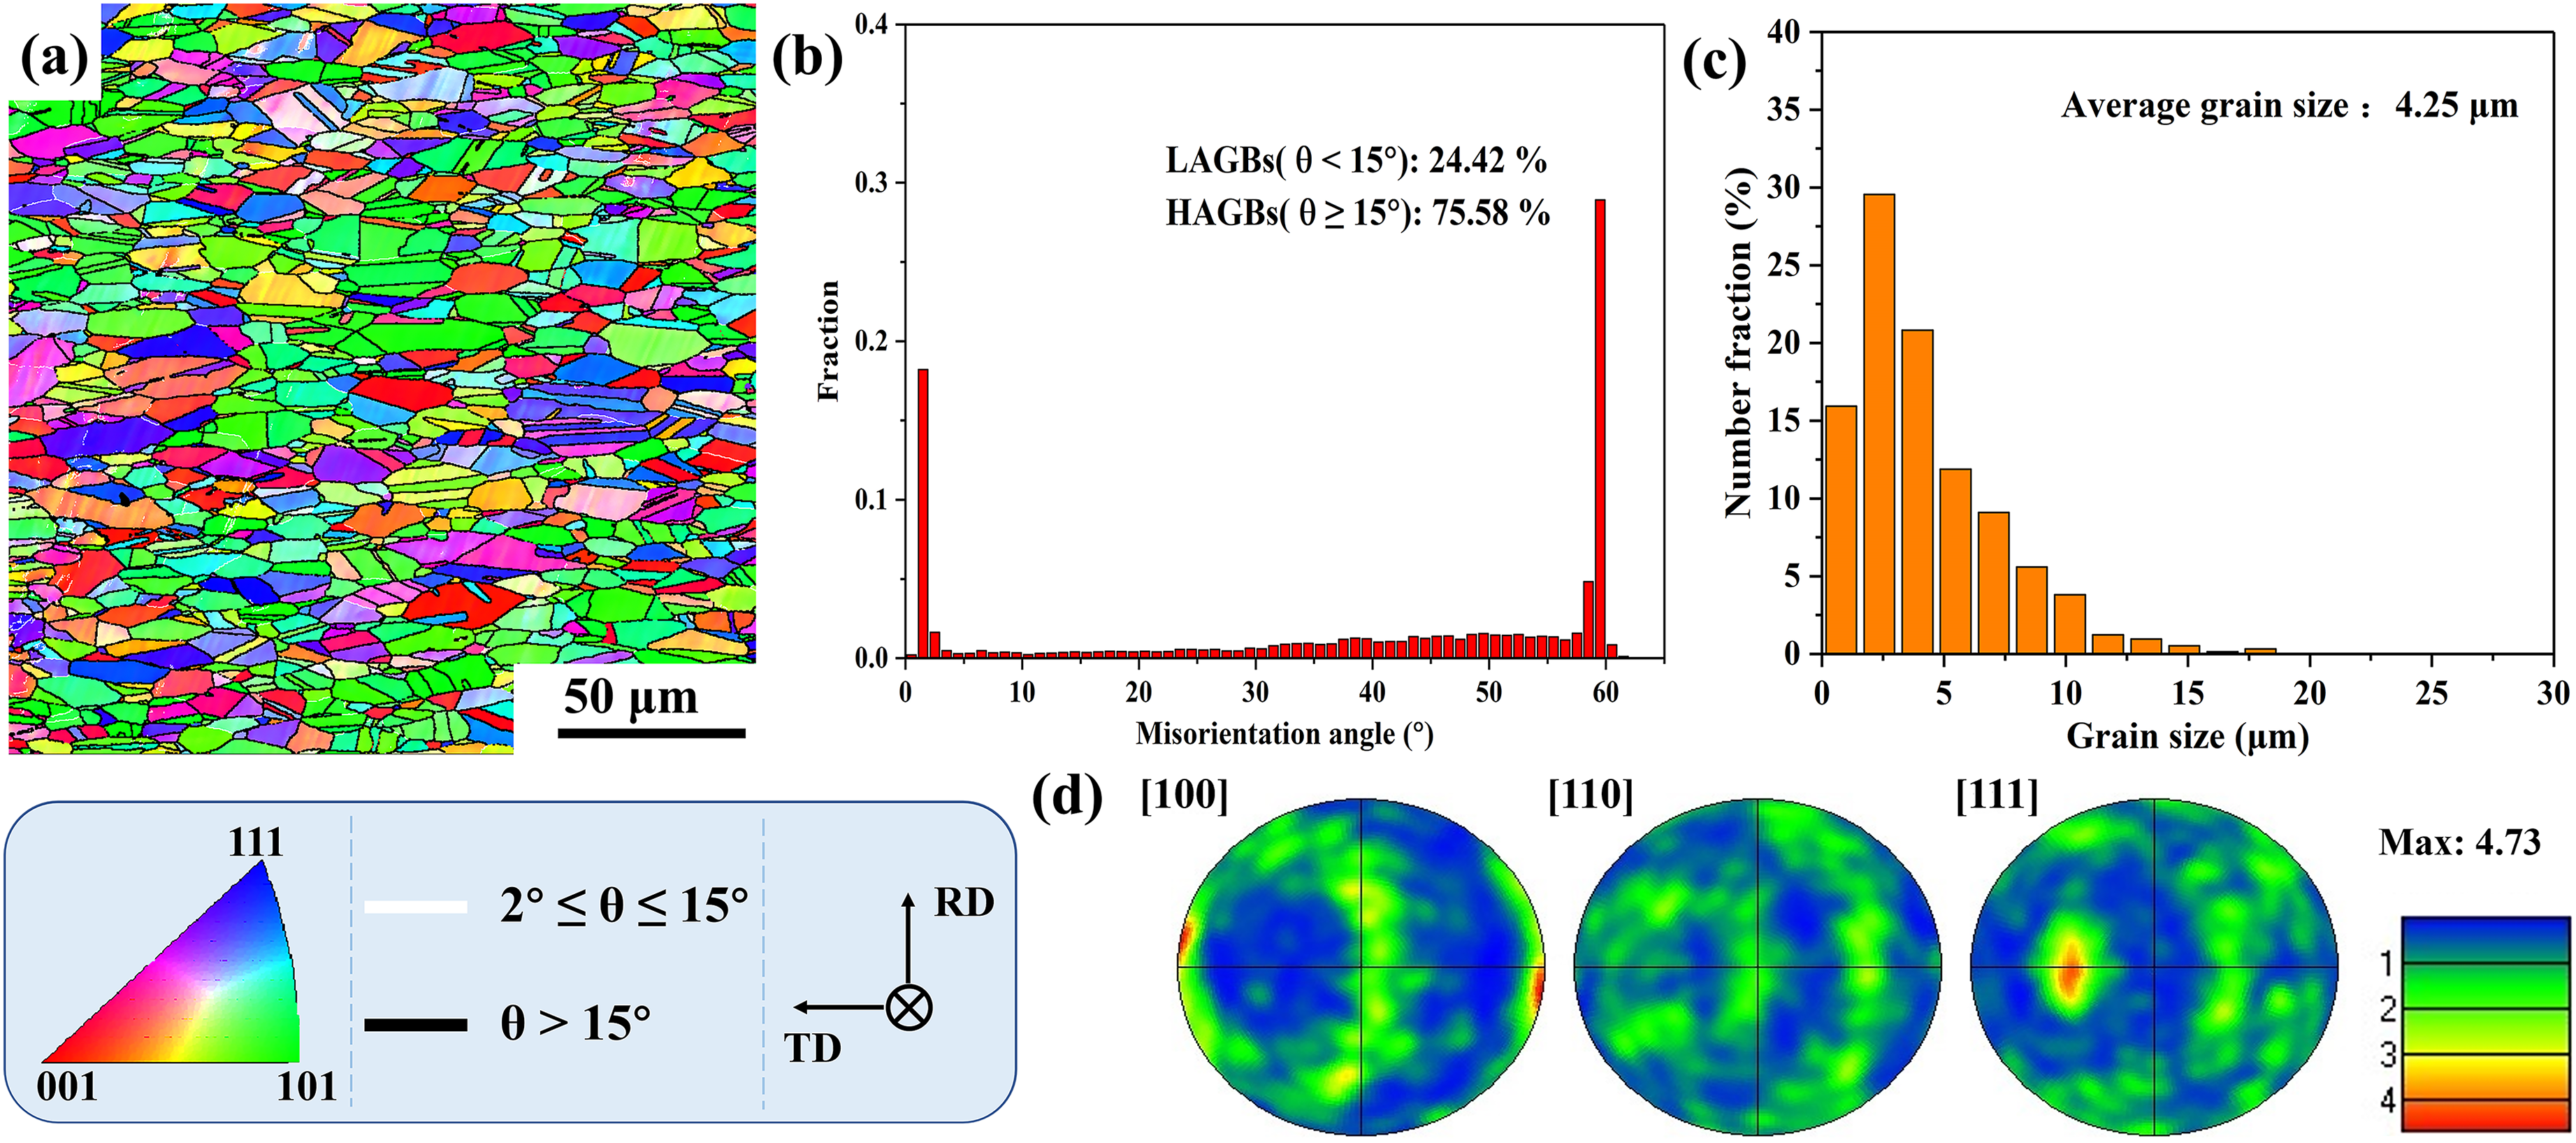
Initial microstructures of the austenitic stainless steel prior to deformation: (a) IPF map, (b) misorientation angle distribution, (c) grain size distribution and (d) PF map.
Results and discussion
Microstructure
Figure 3 shows the IPF maps, misorientation angle and grain size distributions at four positions of the formed workpiece. Compared with the initial structure before deformation, the grains have undergone significant growth during the hot deformation process. It can be seen from Figure 3(b) that the proportion of low-angle grain boundaries (LAGBs) is relatively high (82.34%), indicating extensive substructure formation and elevated stored deformation energy within the microstructure. Given that the LAGBs are fundamentally composed of aligned or entangled dislocation arrays, the significantly higher LAGB density observed in Position 1 quantitatively demonstrates an elevated dislocation density state within this region. This can be attributed to the fact that the specimen at Position 1 first comes into contact with the die and initiates deformation, while undergoing sustained deformation throughout the thermomechanical processing period. As revealed in Figure 3(d) and (g), Positions 2 and 3 exhibit uniform grain structures. Moreover, the predominant presence of high-angle grain boundaries (HAGBs) observed in Figure 3(e) and (h) suggests that a significant level of dynamic recrystallization (DRX) likely occurred during high-temperature deformation. Concurrently, a significantly intensified misorientation peak corresponding to twin boundaries suggests substantial formation of twins during recrystallization. Notably, numerous coherent and semi-coherent twin structures are distributed within specific grains. As illustrated in Figure 3(j), Position 4 exhibits coarse-grained structures with an average grain size of 66.23μm, which is inferred to be associated with the highest accumulated strain at Position 4 as determined by the curvature characteristics of component. During prolonged thermomechanical processing, the enhanced growth kinetics of grains in this region are driven by the coupled effects of external stress and elevated temperature.
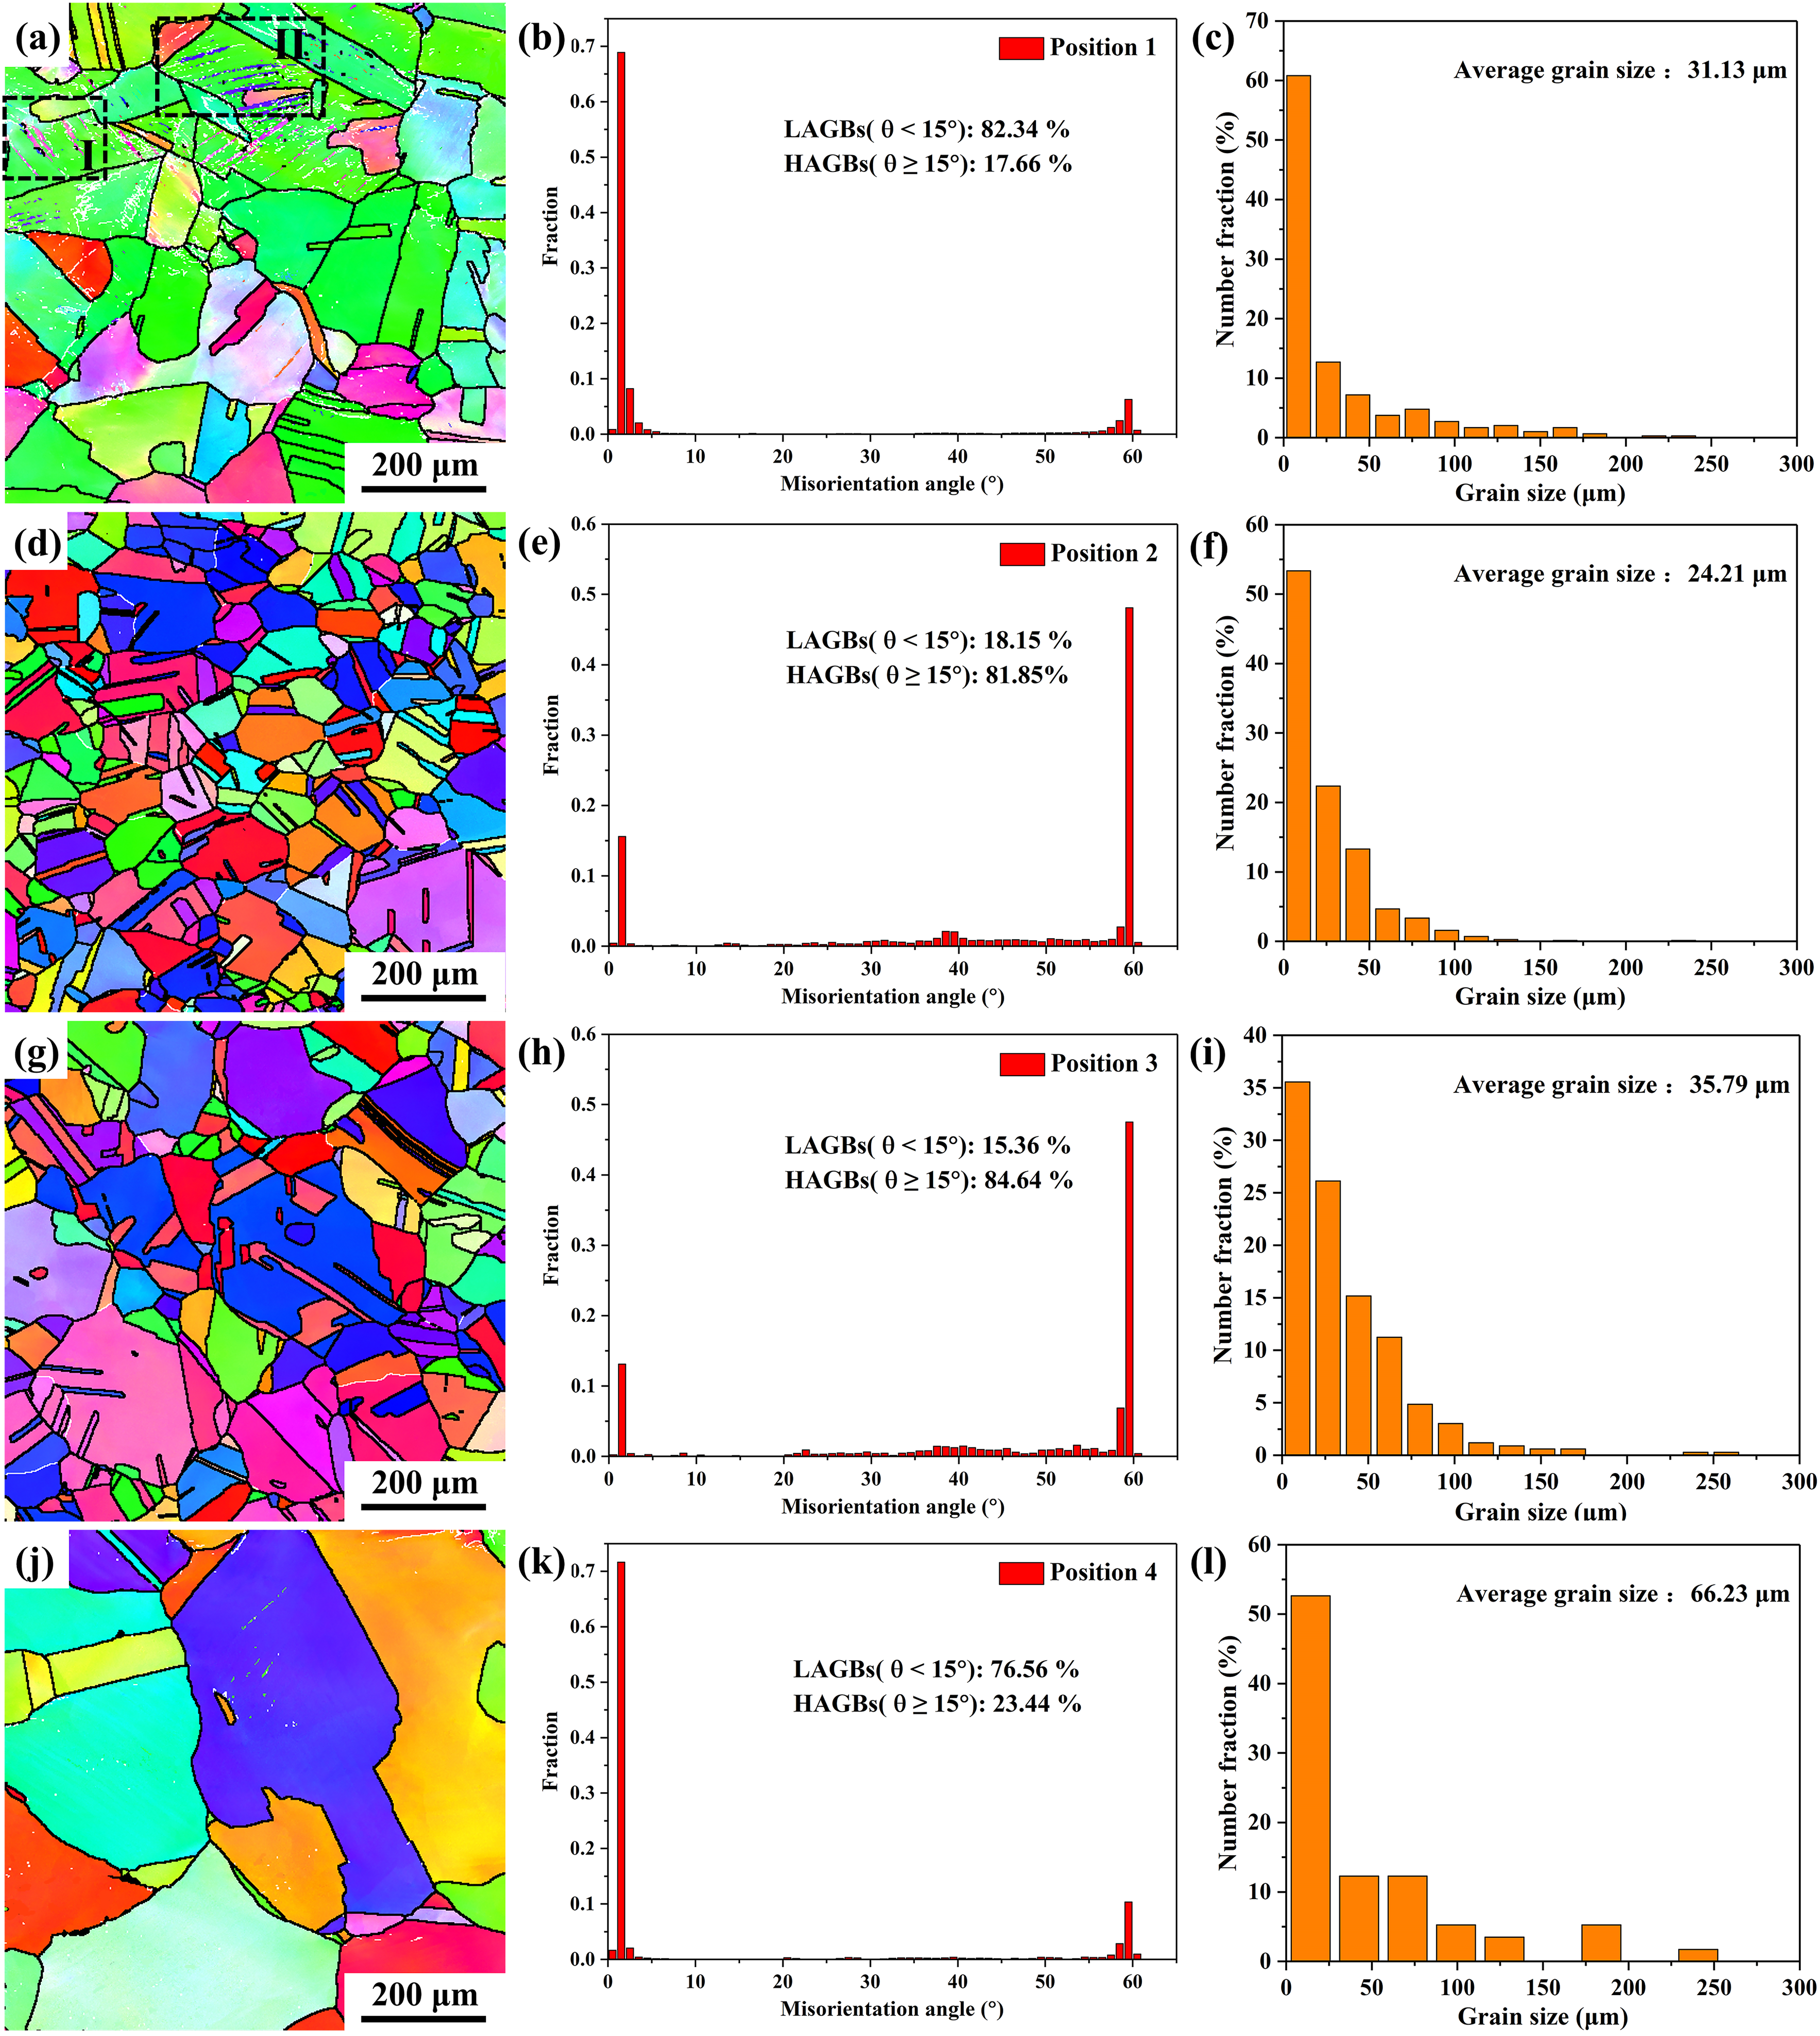
IPF maps, misorientation angle and grain size distributions of the deformed alloy: (a), (b) and (c) position 1; (d), (e) and (f) position 2; (g), (h) and (i) position 3; (j), (k) and (l) position 4.
Notably, as depicted in Figure 3(a), a small amount of lath structure was observed within the austenite grains at Position 1, which originating from the austenite grain boundaries and propagating parallelly into the grain interior in clustered arrays. Based on its morphology and distribution, it is suggested to be strain-induced martensite. To further verify the occurrence of martensitic transformation, XRD analysis was performed on samples from different positions, and the results are presented in Figure 4. It can be seen that the samples from Positions 1 and 4 show clear α'-martensite (211) diffraction peaks in addition to the characteristic austenite peaks. As revealed that the evolution of martensitic transformation in metastable ASS depends on multiple factors, such as chemical composition, deformation temperature, strain rate and stress state. 34 According to the JMatPro phase diagram calculation, the deformation martensite Md[50/30] temperature for the Fe-19Cr-10Ni-1Mn austenitic stainless steel was determined to be 44.2°C, and the strain-induced martensitic transformation is suppressed once the temperature exceeds this critical value. Therefore, the observed martensite can be attributed to the accumulation of strain and the subsequent rapid cooling process.
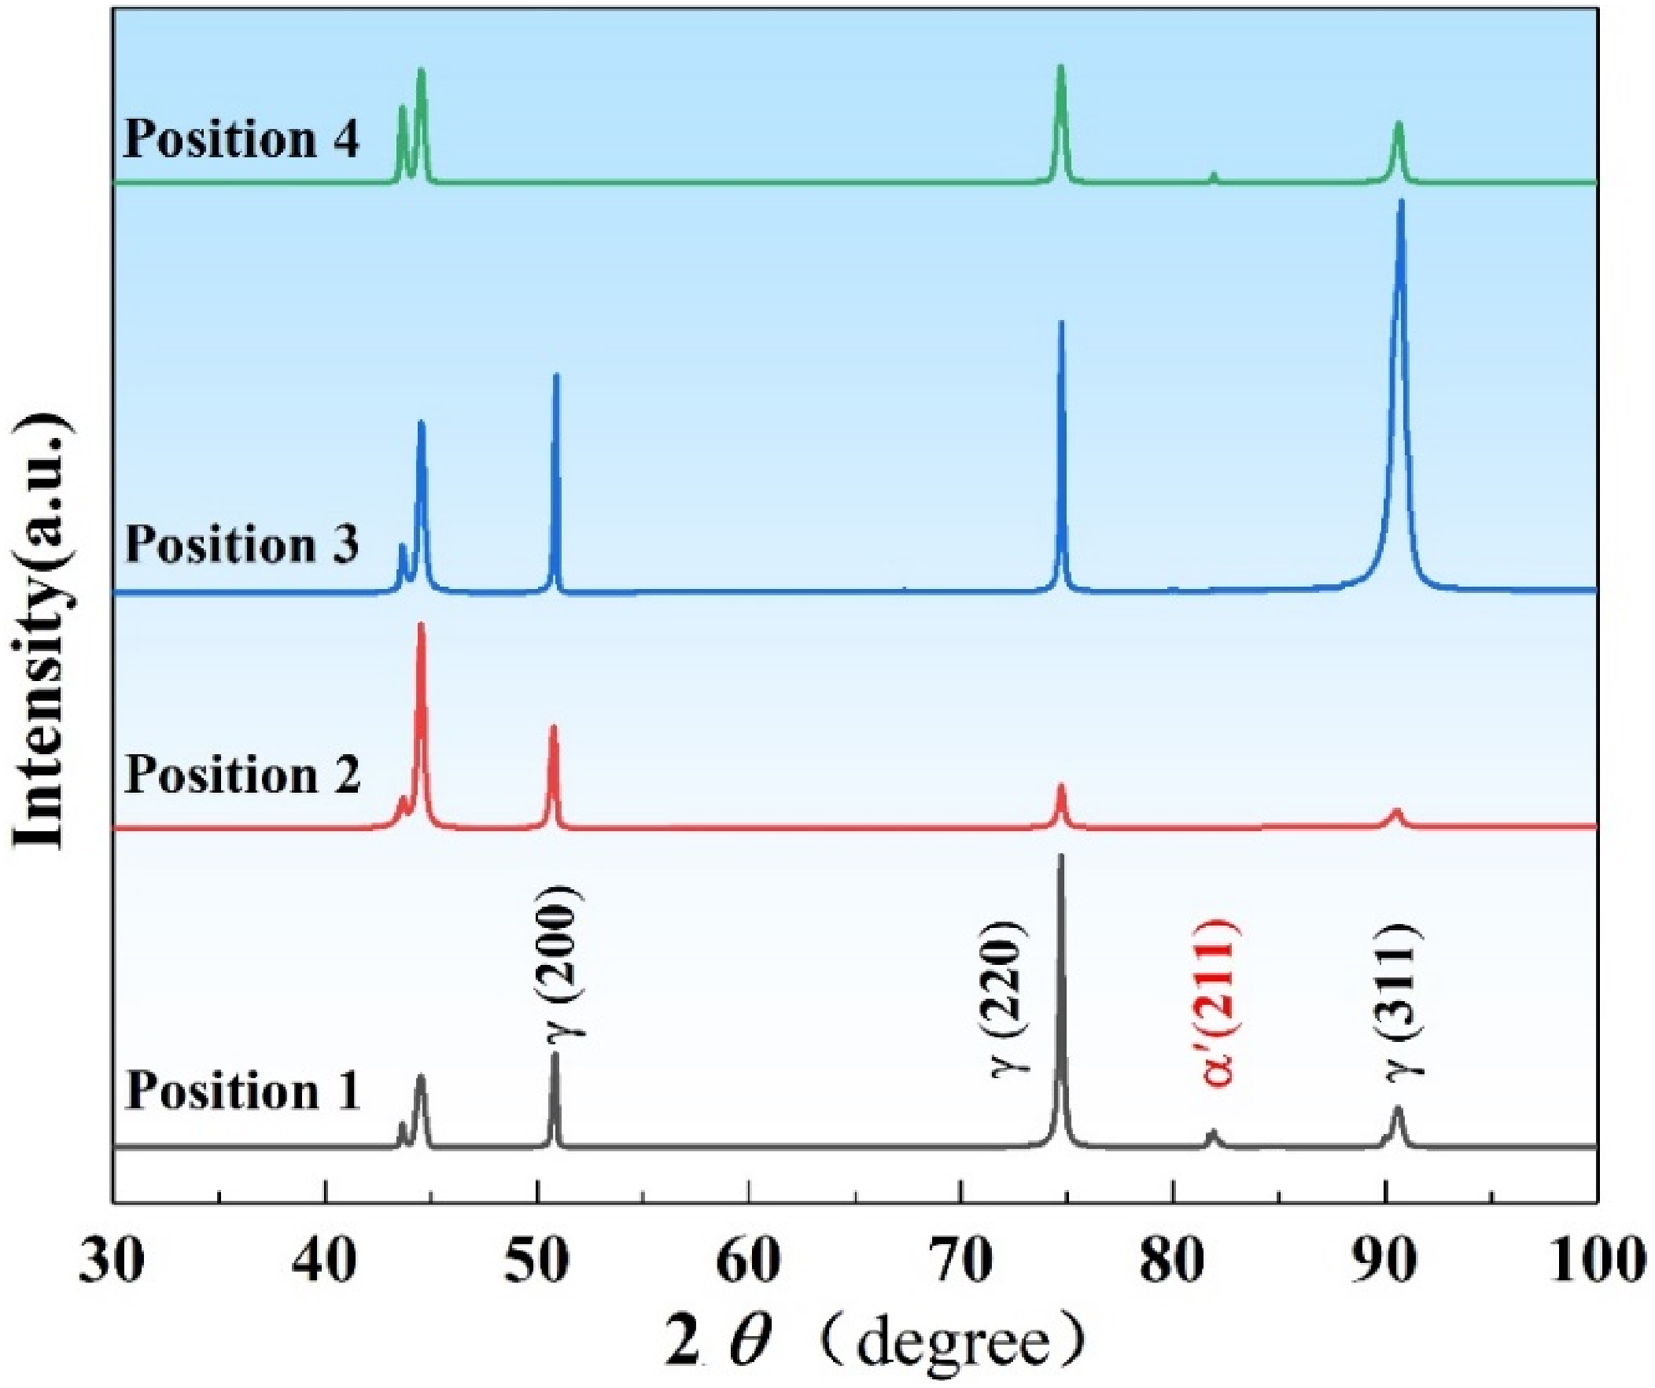
X-ray diffraction pattern of the samples at four positions.
To further explore the distribution of deformation defects such as dislocations and substructures in different deformed regions of the component, the kernel average misorientation (KAM) maps were plotted in this study, as KAM values are conventionally employed to characterize dislocation density within materials.35–37 As shown in Figure 5, elevated KAM values at Position 1 and 4 indicate relatively high dislocation densities within their respective microstructural regions, which can also be confirmed by the analysis of misorientation angle distributions. Meanwhile, the heightened dislocation densities were predominantly concentrated at austenite grain boundaries and austenite/martensite interfaces, where heterogeneous strain accumulation resulted in substantial concentrations of deformation defects including dislocations, dislocation cells/walls, and substructures. These defect-dense regions could provide abundant nucleation sites for martensitic transformation. It can be also observed from Figure 5(a) and (d) that martensite nucleation predominantly occurred at high-dislocation-density structures, followed by inward growth into austenite grains. Furthermore, specimens at Position 2 and 3 display diminished KAM values (Figure 5(b) and (c)), attributable to dynamic recrystallization consuming dislocations during deformation. Concurrently, stress concentration zones induced by strain accommodated deformation through twinning mechanisms, while insufficient driving forces suppressed martensitic shear transformation.

KAM maps and values of the studied alloy: (a) position 1; (b) position 2; (c) position 3; (d) position 4.
Figure 6 presents the IPF maps and relative and cumulative misorientation angle distributions of α′-martensite within region I and II marked in Figure 3(a). As shown in the IPF maps, the α′-martensite adopts characteristic lath morphologies within prior austenite grains. Notably, martensitic variants within individual transformation packets maintain identical crystallographic orientations, whereas significant orientation discrepancies are observed in the martensite within different austenite grains by colors according to the standard triangle. Besides, it can also be confirmed from the relative and cumulative misorientation angle along the black arrow inside two grains, although the cumulative misorientation angle of the adjacent α′-martensite laths progressively increases, the maintained low value (below 8°) suggests the predominant presence of LAGBs within individual transformation packets.
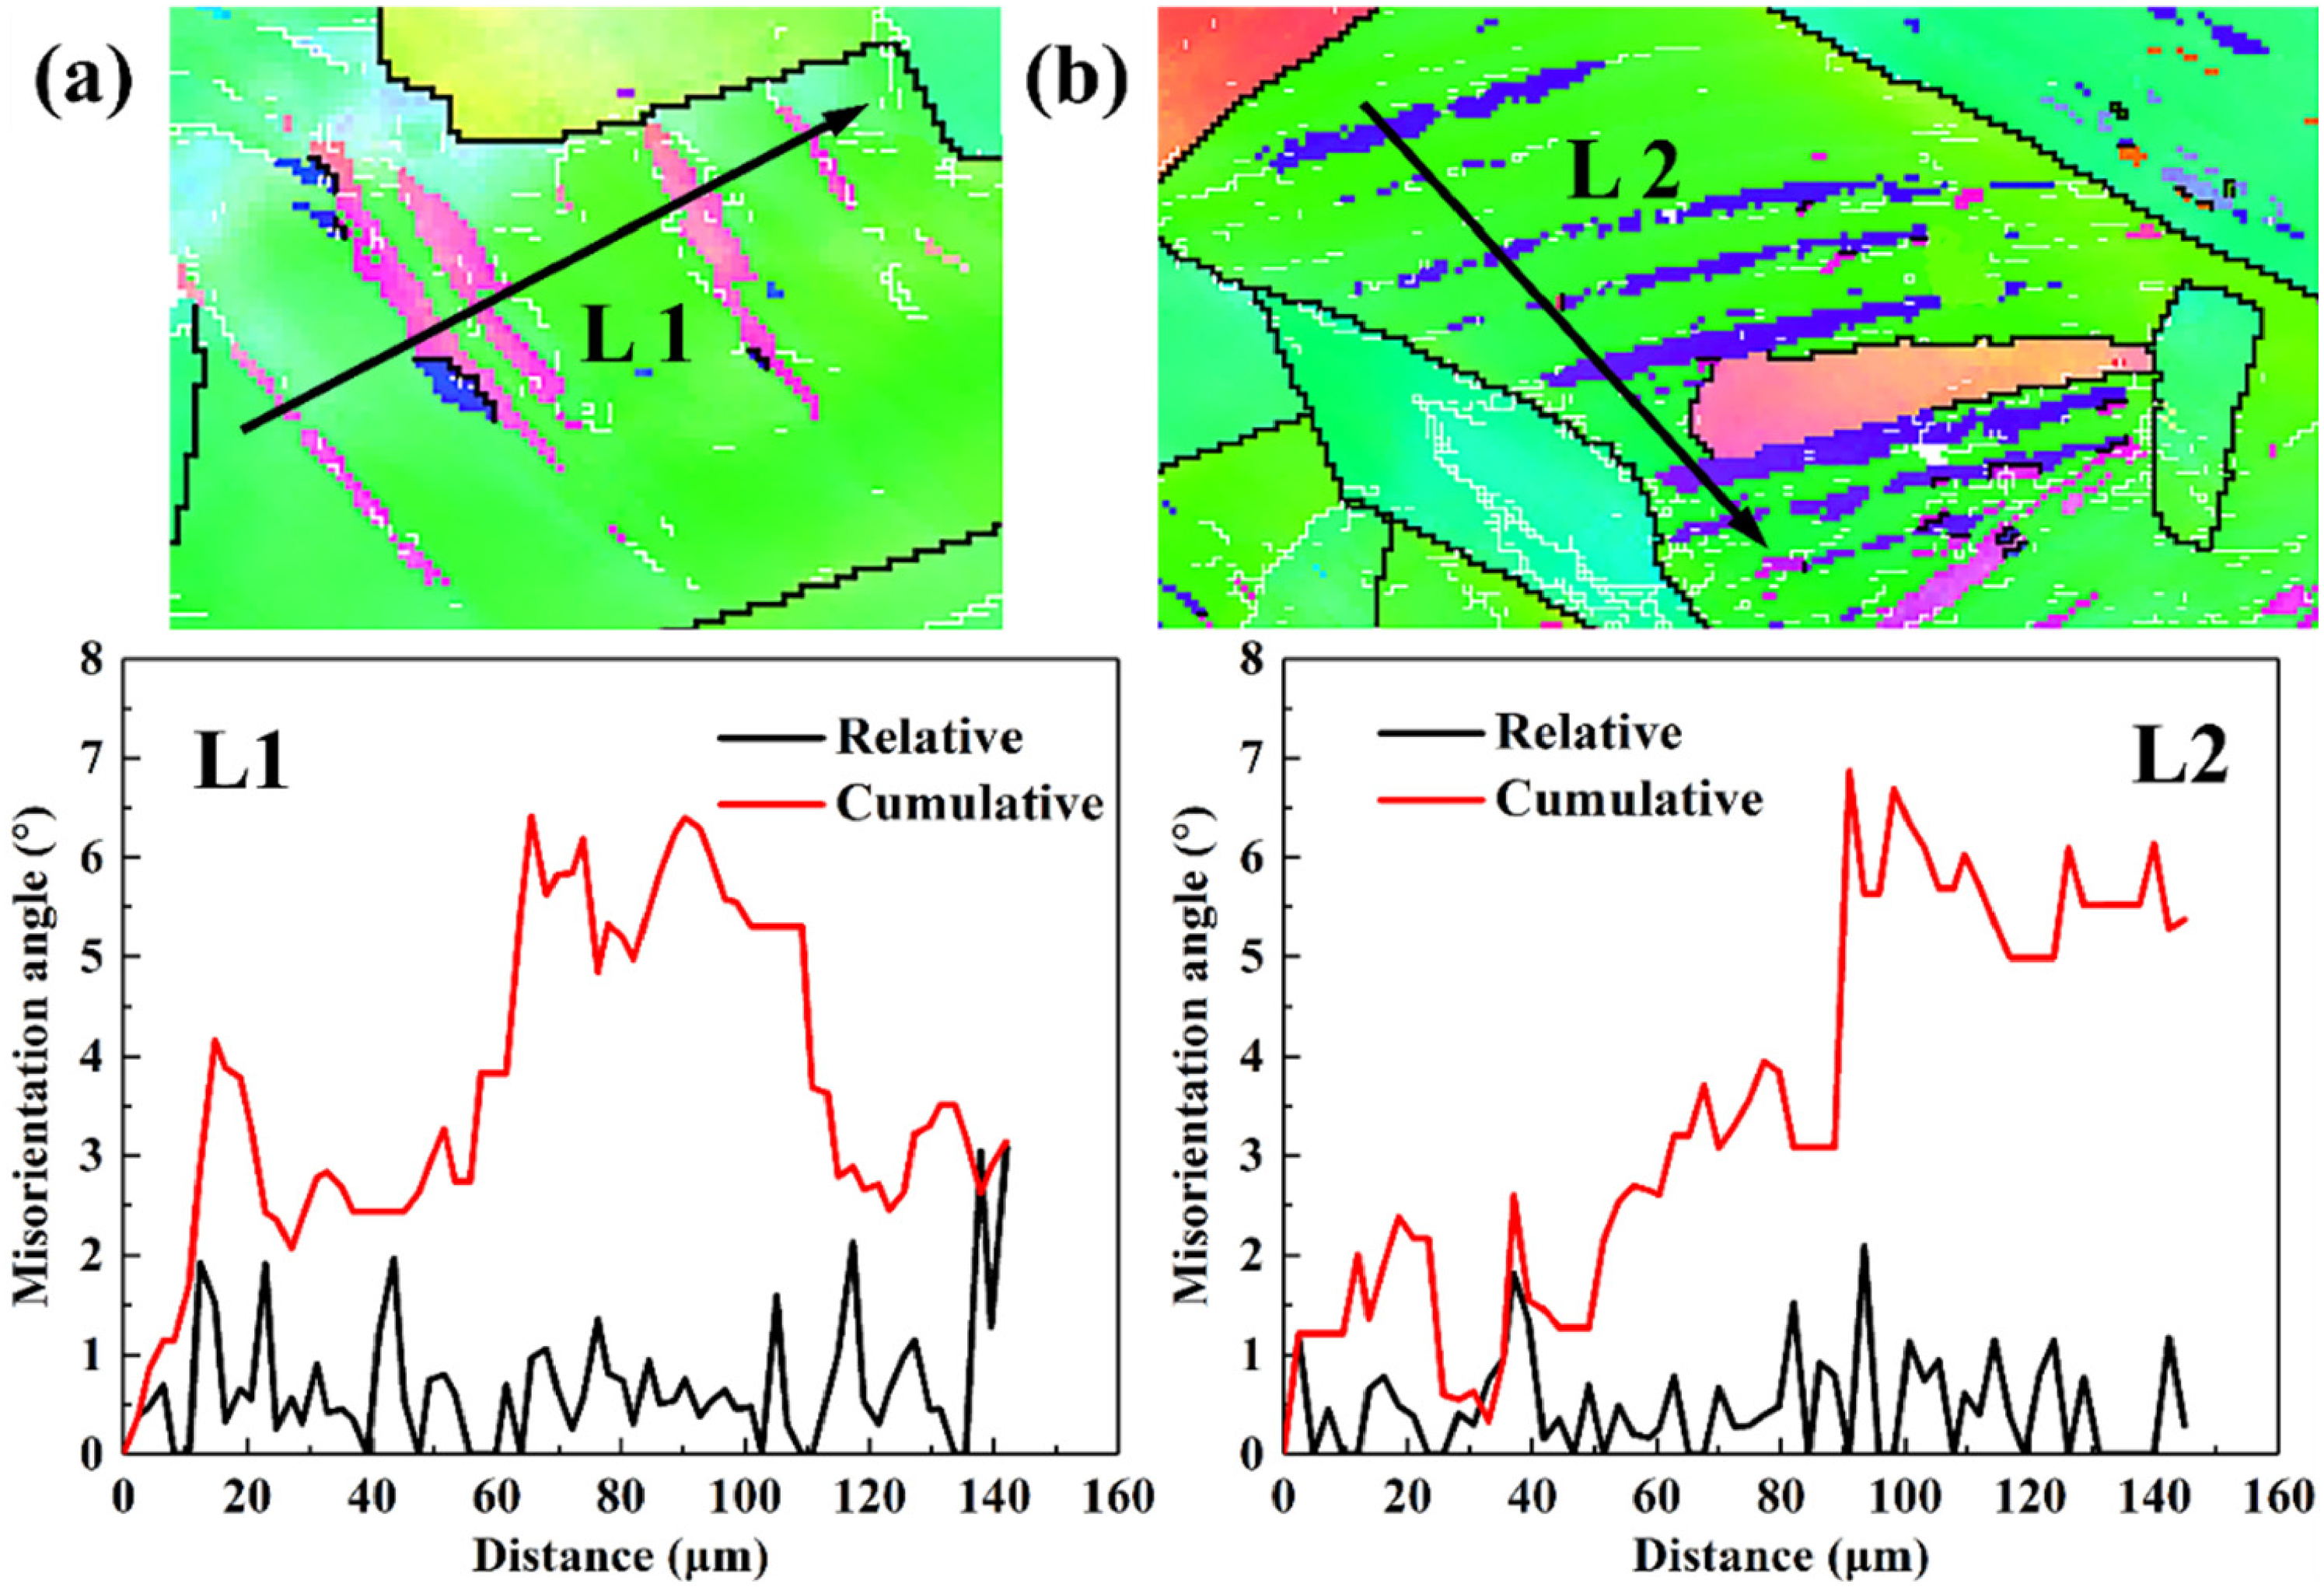
IPF maps, relative and cumulative misorientation angle of the areas marked in Figure3: (a) area I, (b) area II.
In addition to the grain size, crystallographic orientation and dislocation arrangements, the connectivity of random HAGBs network and subgrain boundaries (SBs) were also reported to be directly responsible for property modifications.38,39 Crucially, low-ΣCSL grain boundaries exhibit superior thermodynamic stability compared to random grain boundaries, owing to their reduced grain boundary energy that enhances resistance to grain boundary sliding (GBS) activation. Figure 7 illustrates the general grain boundaries character distribution of the CSL of studied stainless steel, mainly including the Σ3, Σ9, Σ27 and random boundaries, which were indicated by red, yellow, green and black lines, respectively. From Figure 7, it can be observed that the CSL grain boundary is dominated by Σ3 boundaries (60°/<111 > twinning relationships), and most of the Σ3 boundaries form straight or parallel linear pairs, which either run through the whole grain or initiate from random HAGBs and terminate inside the grains. As shown in Figure 7(b) and (c), the proportion of Σ3 grain boundaries is relatively high, which effectively fragment the connectivity of random HAGBs networks, resulting in a fundamental transition in strain accommodation mechanisms among adjacent grains. It has been established that engineered CSL grain boundaries significantly enhance material performance by promoting homogeneous plastic deformation through geometrically necessary dislocation (GND) redistribution, delaying crack propagation via grain boundary-induced deflection and optimizing high-temperature stress distribution through thermally-activated dislocation climb mechanisms. 40 Furthermore, the twin boundaries are predominantly Σ3 boundaries, with steps and islands twin structures observed in specimens at multiple positions, indicating that a significant number of twin crystals were activated, grew and underwent mutual interactions within the grains during deformation. As displayed in Figure 7(d), despite the high proportion of Σ3 boundaries, the total density of high-angle grain boundaries (HAGBs) in the sample of Position 4 is significantly reduced due to grain coarsening during recrystallization. In addition, studies have shown that texture evolution during the sheet metal forming is closely correlated with grain boundary characteristics. 41 Therefore, it is imperative to integrate texture evolution analysis with the aforementioned misorientation distributions to comprehensively investigate the microstructural evolution of the alloy at distinct processing locations.
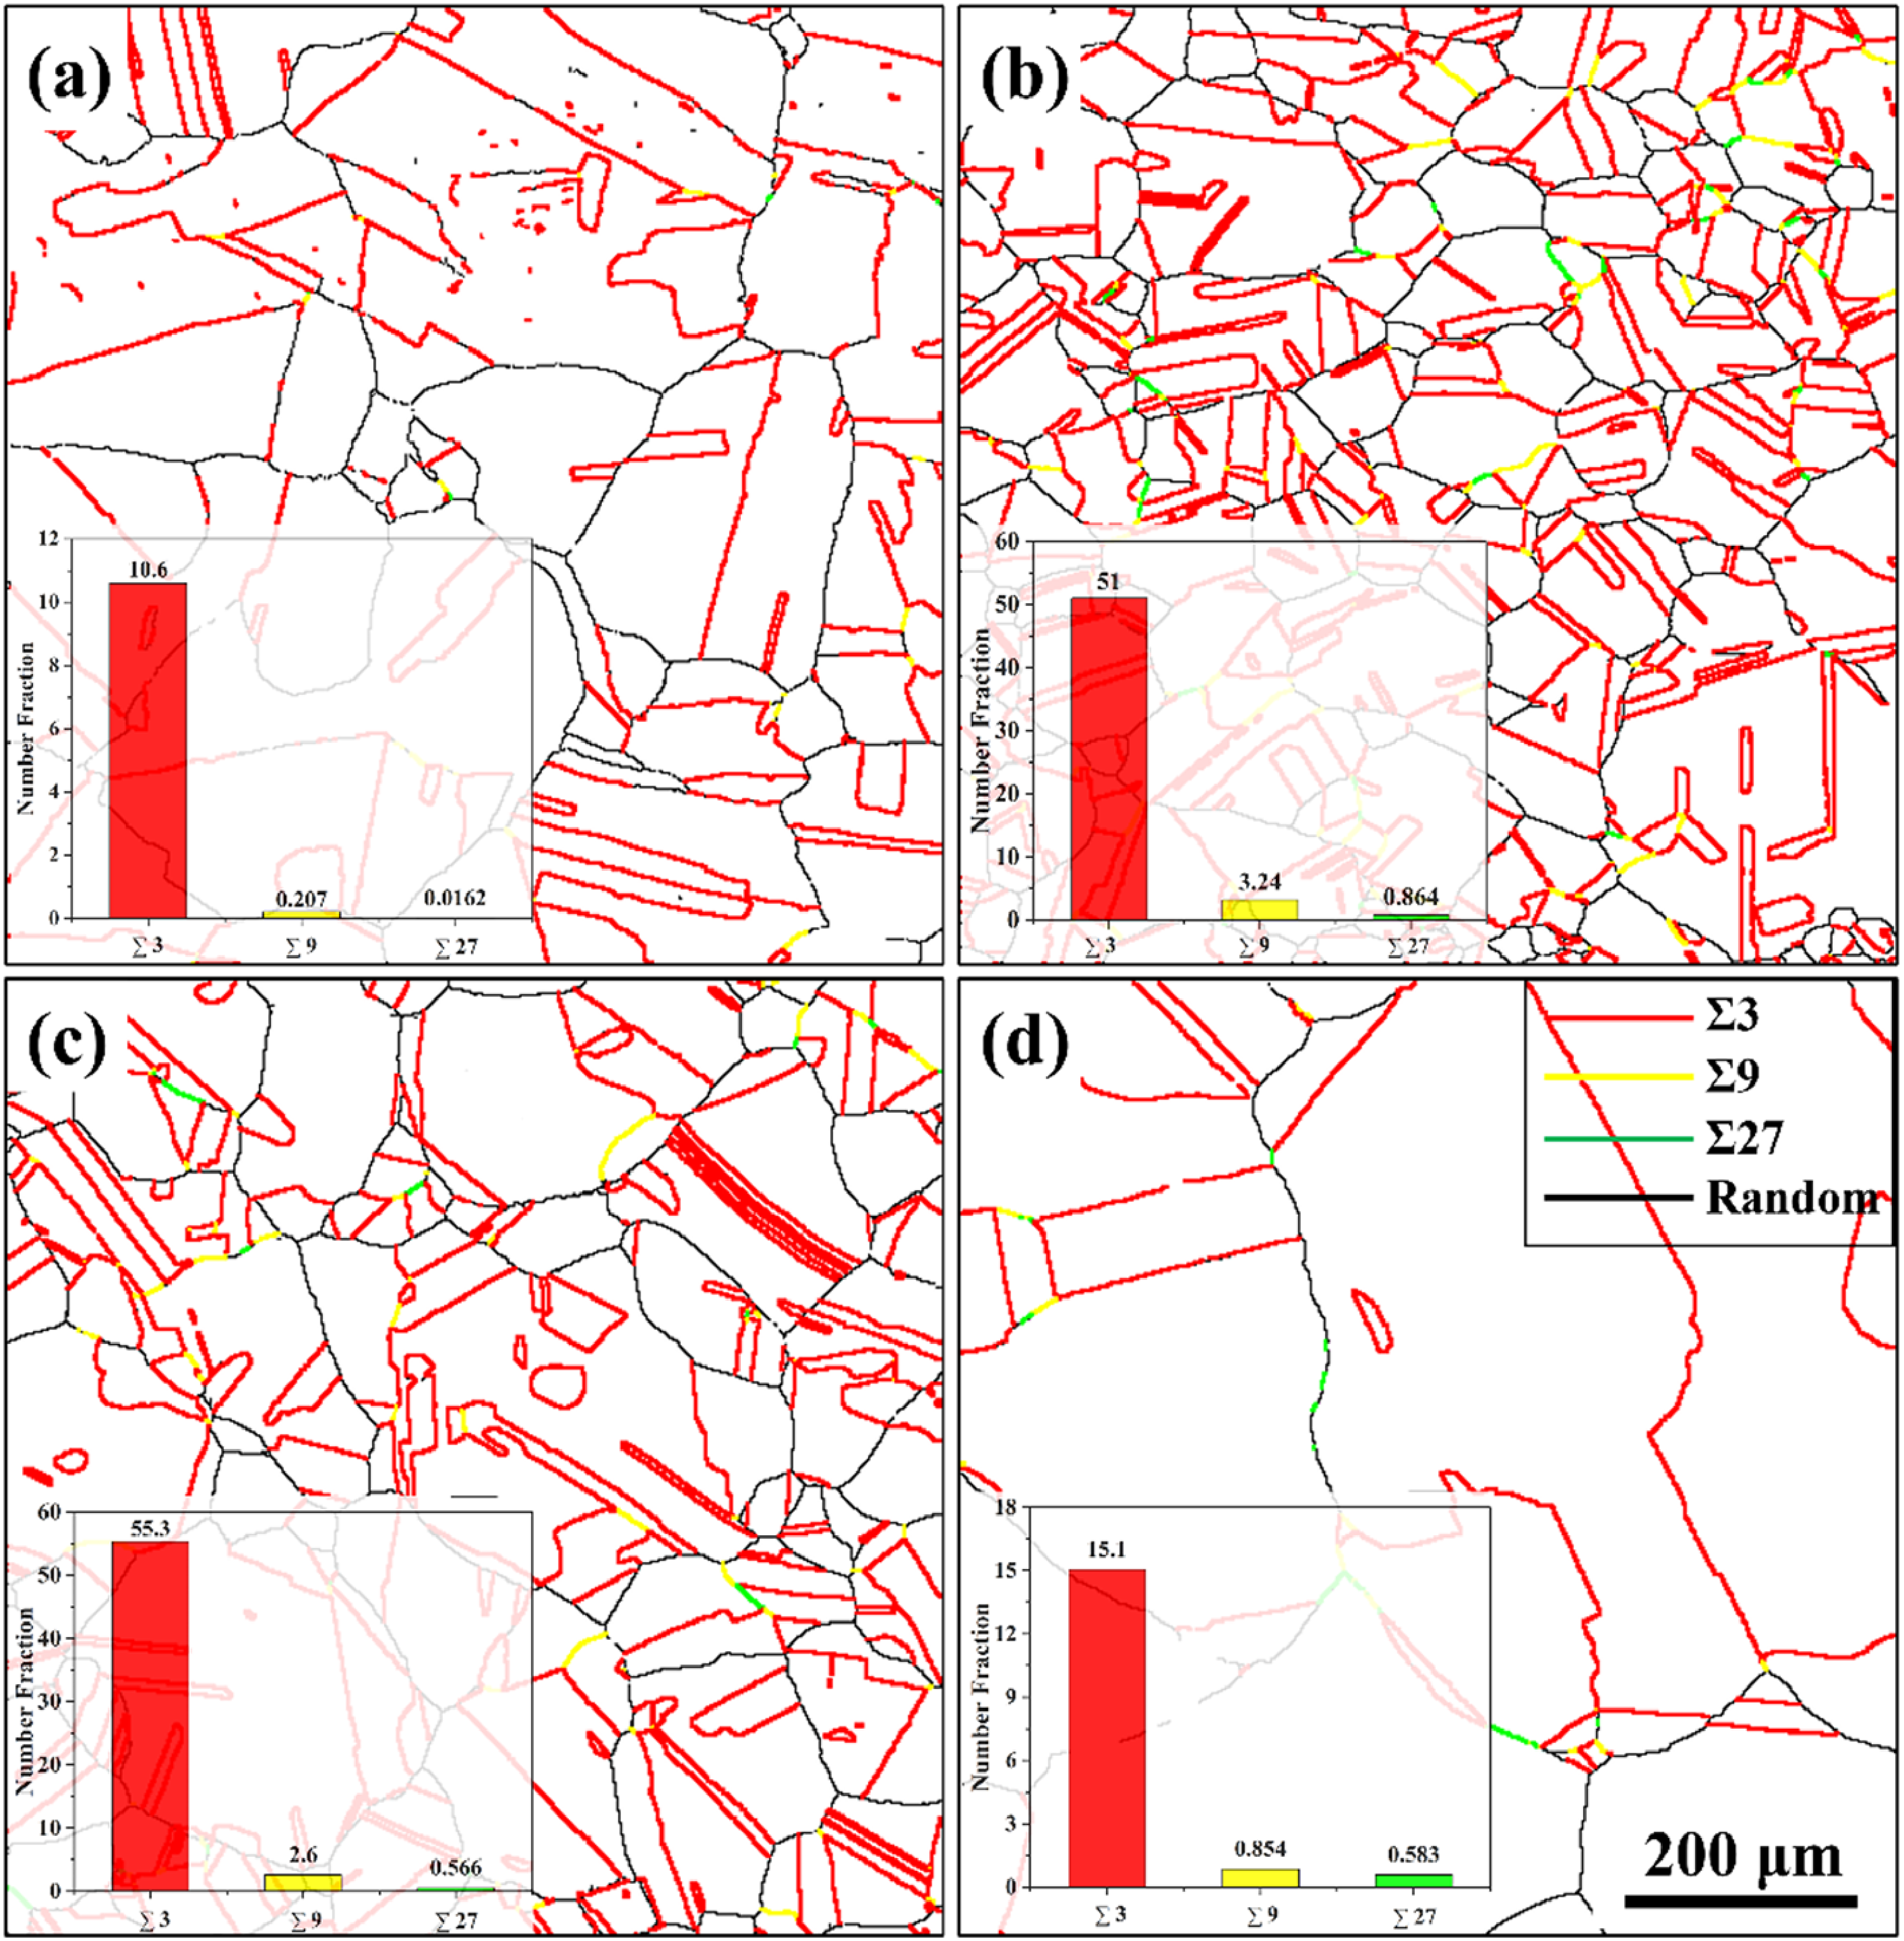
CSL grain boundary maps of the studied alloy: (a) position 1; (b) position 2; (c) position 3; (d) position 4.
Texture evolution
Figure 8 illustrates the evolution of crystallographic texture in specimens at different locations, represented through orientation distribution function (ODF) sections. The ODF is a robust method for the quantitative characterization of crystallographic texture, providing critical insights into the evolutionary behavior of texture during specific thermomechanical processes.42,43 It can be seen that there are significant orientation deviations between deformed and adjacent grains at Position 1 and 4. These locations are characterized by distinctly sharp Brass, Copper and S texture components, indicating a strong correlation between local strain heterogeneity and the development of a potent deformation texture. Meanwhile, due to the formation of a martensitic phase, the dominant texture components in these region are identified as {111}<112 > and {111}<110>, which strictly adhere to the Kurdjumov-Sachs (K-S) orientation relationship: {111} γ//{110} α´ and <110> γ//<111> α´. 44 In contrast, as shown in Figure 8(b) and (c), the crystallographic orientation distribution at Positions 2 and 3 is more diffuse, corresponding to a considerably lower degree of texture sharpness.
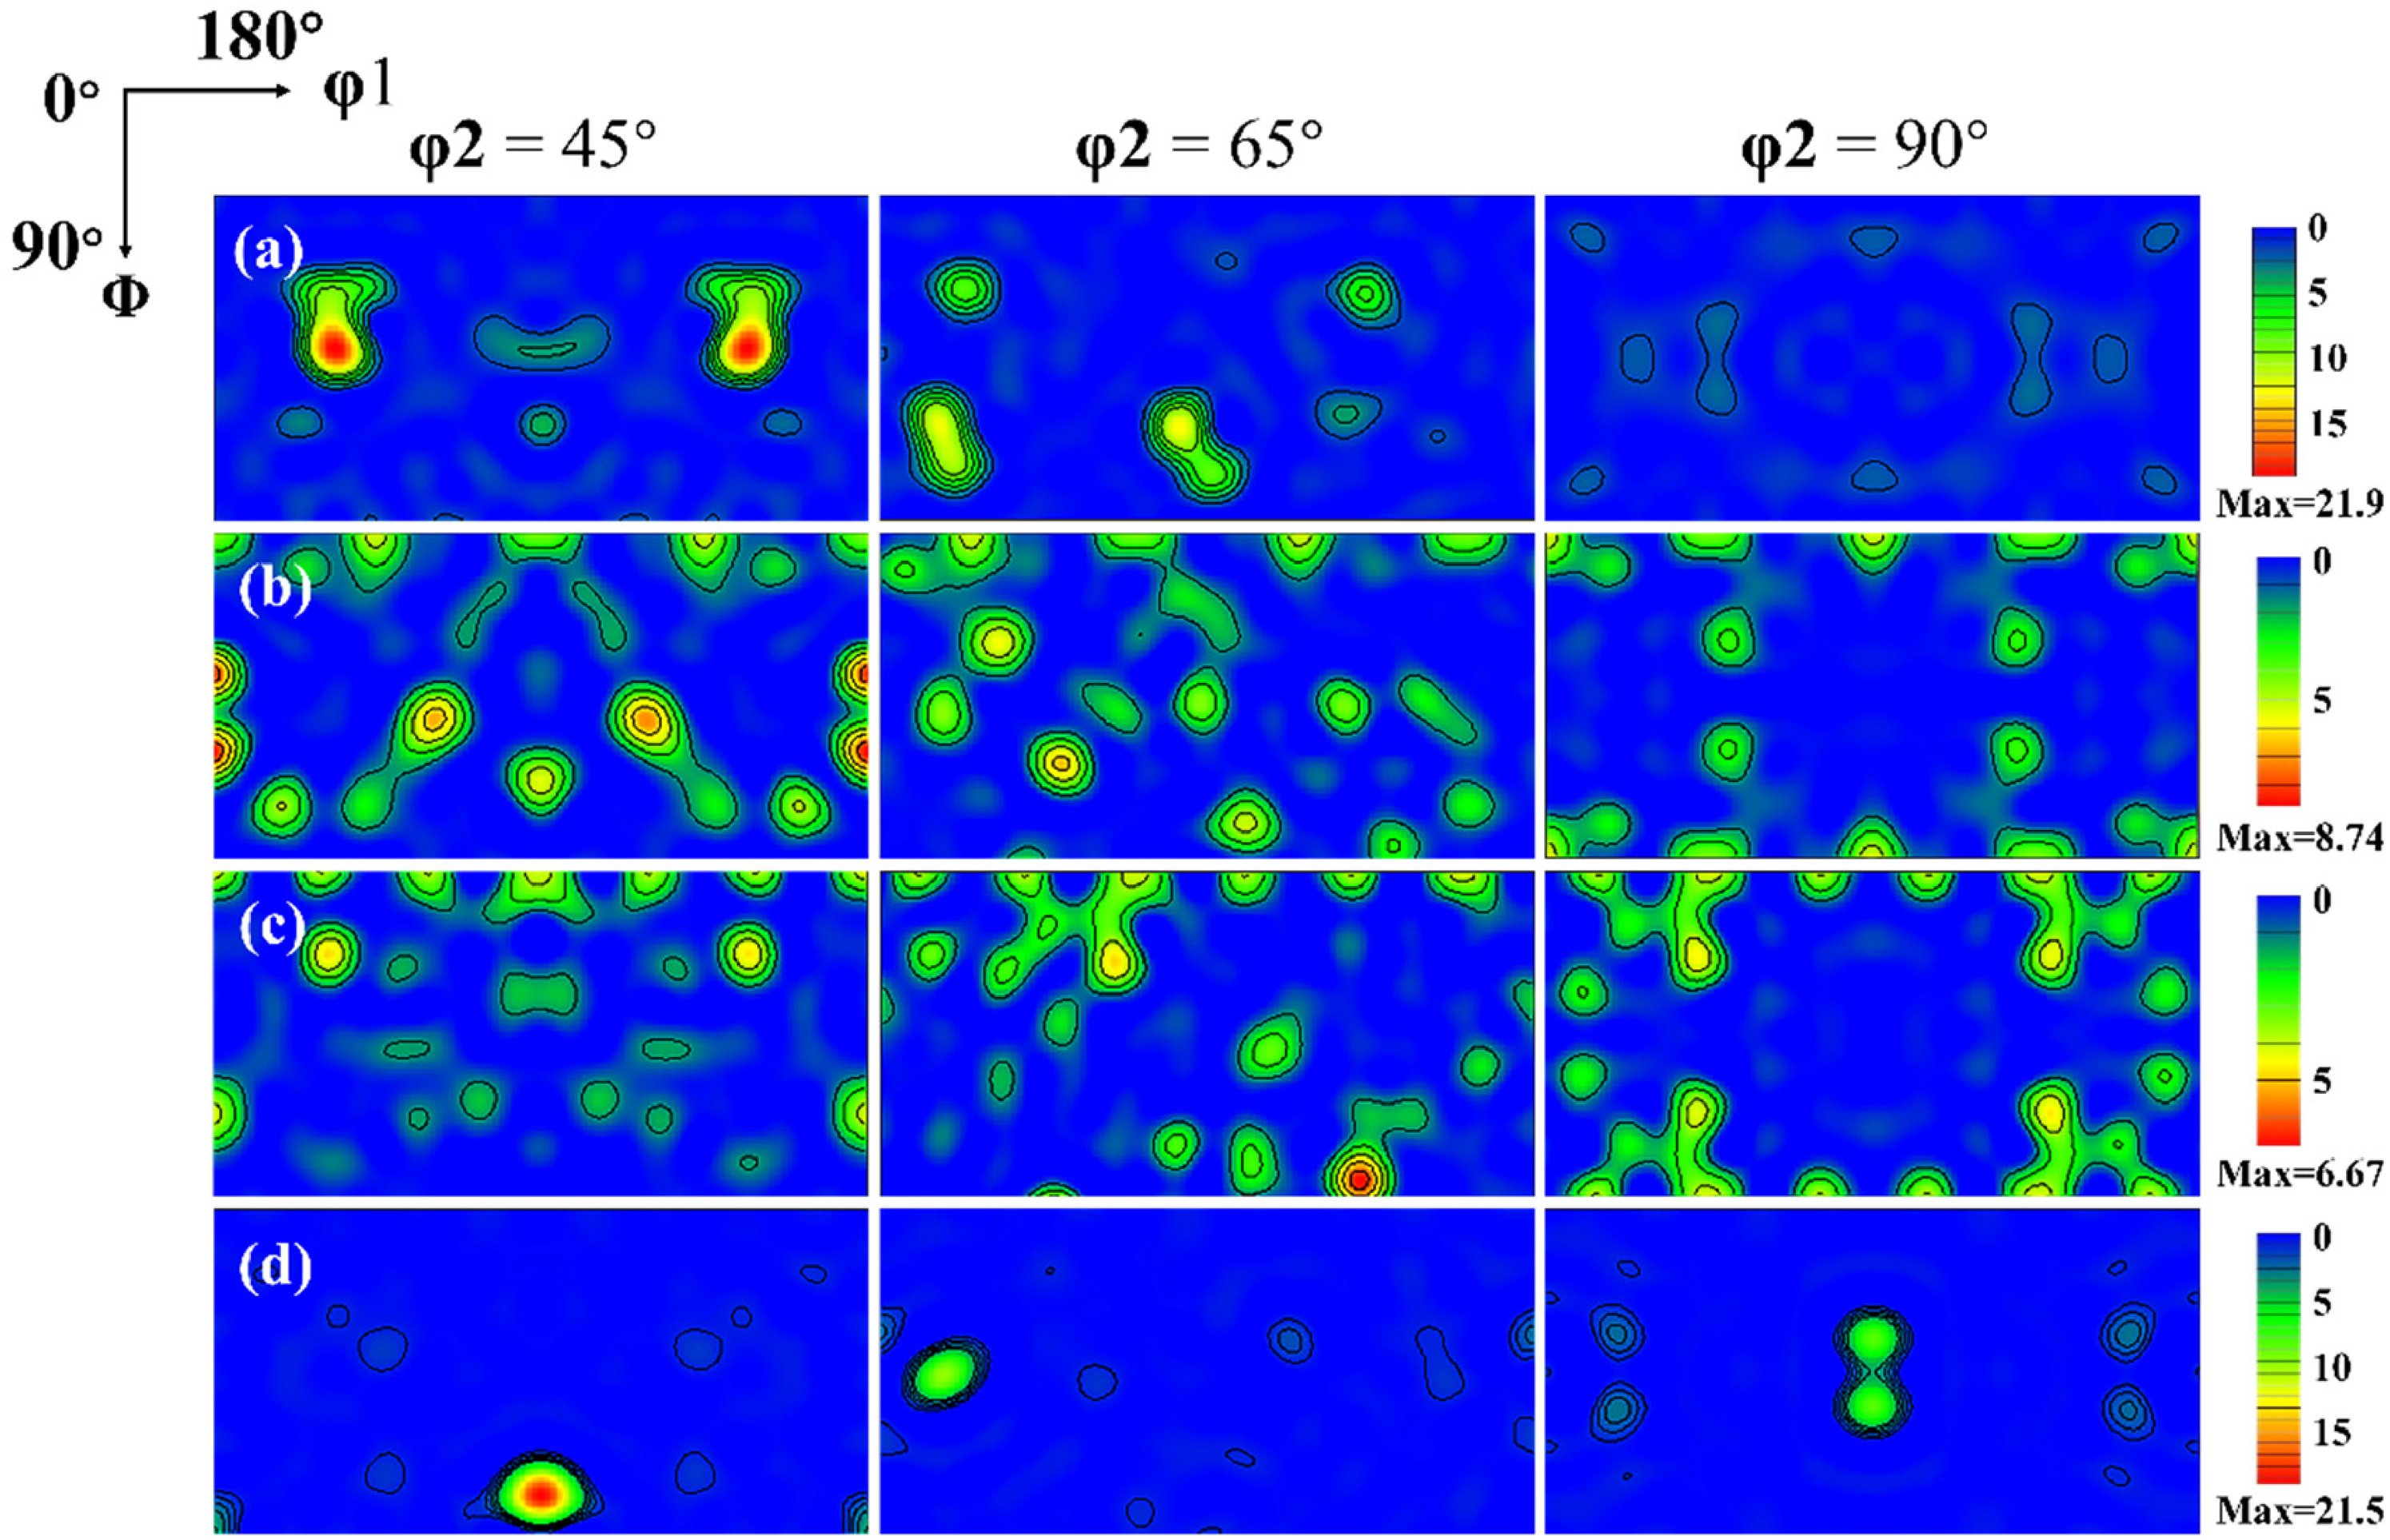
Φ2 = 45°, 65° and 90° sections of the orientation distribution function for the studied alloy:(a) position 1; (b) position 2; (c) position 3; (d) position 4.
The quantitative analysis of the texture components and their volume fractions, as determined by orientation distribution function (ODF) analysis, is summarized in Table 1. A disorientation threshold of 15° was applied to define the components. The data reveal a significant spatial heterogeneity in texture evolution across the sampled locations (Positions 1 to 4), indicating non-uniform microstructural evolution. Specifically, the microstructure at Position 1 is dominated by the Brass component ({110}<112>) with a high volume fraction of 21.4%, while other typical deformation texture components, such as Copper ({112}<111>) and S ({123}<634>), remain relatively weak. In stark contrast, a fundamental transition in the prevailing texture type is observed at Position 4, where the Copper (21.9%) and S (16.3%) components become dominant. Such a pronounced spatial gradient suggests the material underwent heterogeneous plastic deformation or localized recrystallization during processing. Furthermore, recrystallization textures like Cube ({001}<100>) and R-Cube ({001}<110>) also exhibit significant fluctuations across different positions. For instance, the Cube component reaches its maximum value of 3.21% at Position 2 but diminishes markedly to 0.47% at Position 4. Similarly, the R-Goss component ({110}<110>) registers a comparatively high value of 3.81% at Position 1 before decreasing sharply at other locations. The distinct distribution of these texture components provides critical insights for understanding the anisotropy of the studied alloy. Furthermore, since the thermal-mechanical deformation triggers martensitic transformation, it is essential to separately investigate the texture orientation of the austenite (γ-phase) and the martensite (α'-phase) to reveal the specific microstructural evolution.
The crystallographic orientations in the samples at four positions.
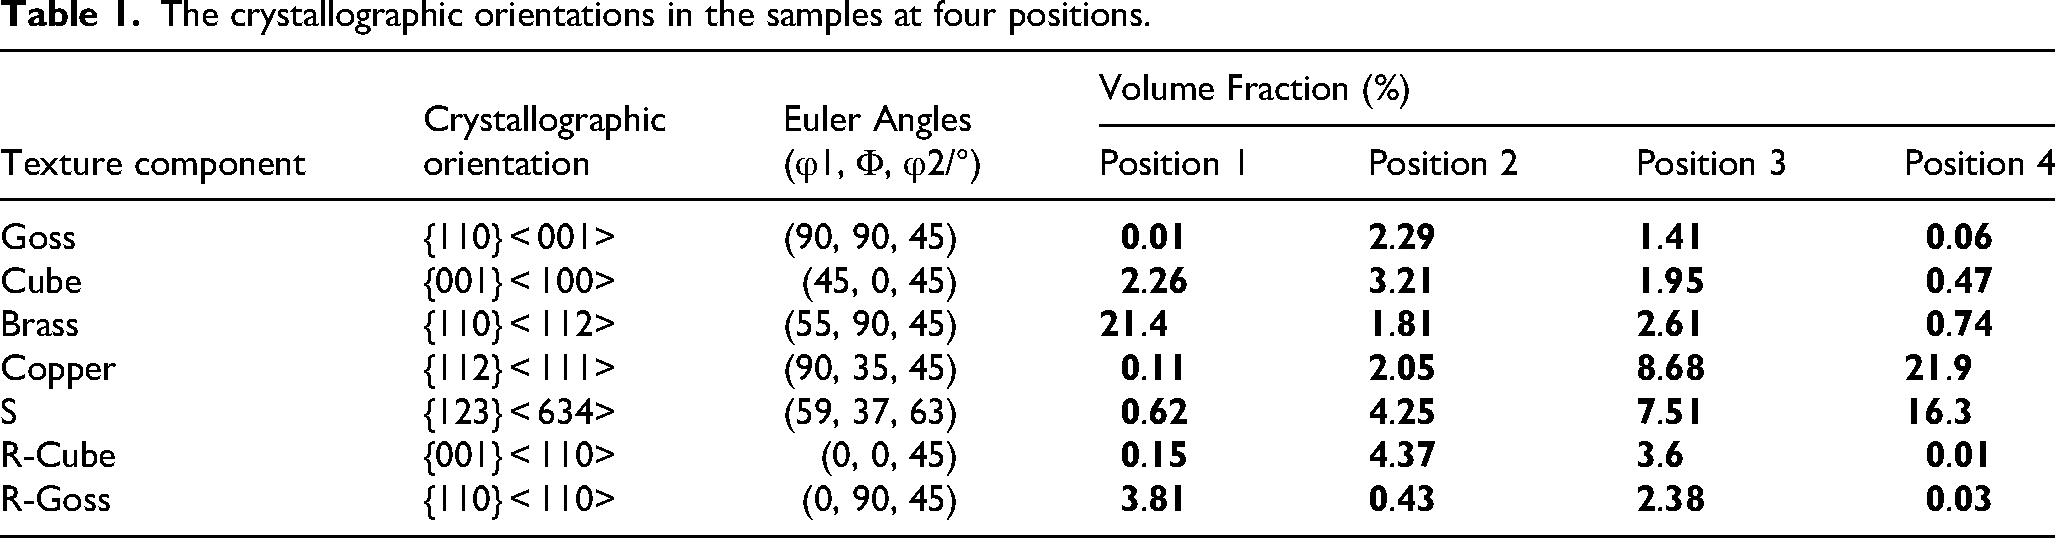
Figure 9 presents the phase distribution maps, PF maps and IPF maps of the deformed alloy specimens extracted from Position 1 and 4. As shown in Figure 9(a) and (c), minor martensitic phase formation is observed in both Position 1 and 4. Quantitative phase analysis reveals that the specimen from Position 1 consists of 98.04 vol.% face-centered cubic (FCC) phase and 1.96 vol.% body-centered cubic (BCC) phase, while the specimen from Position 4 exhibits a phase composition of 99.65 vol.% FCC and 0.35 vol.% BCC. As shown in Figure 9(b), the BCC phase in Position 1 exhibits the highest texture intensity of 6.39 with pronounced crystallographic orientation characteristics, whereas the FCC phase displays lower texture intensities (< 4.0) and lack distinct orientation preferences. In contrast, Figure 9(d) reveals that the martensitic phase in Position 4, despite its minimal volume fraction (0.35 vol.%), demonstrates the strongest texture intensity (7.39), which potentially linked to strain induced variant selection during phase transformation. 45 However, the FCC austenitic phase exhibits weaker texture intensities with no dominant orientation, except for a slight clustering along the [111] direction.
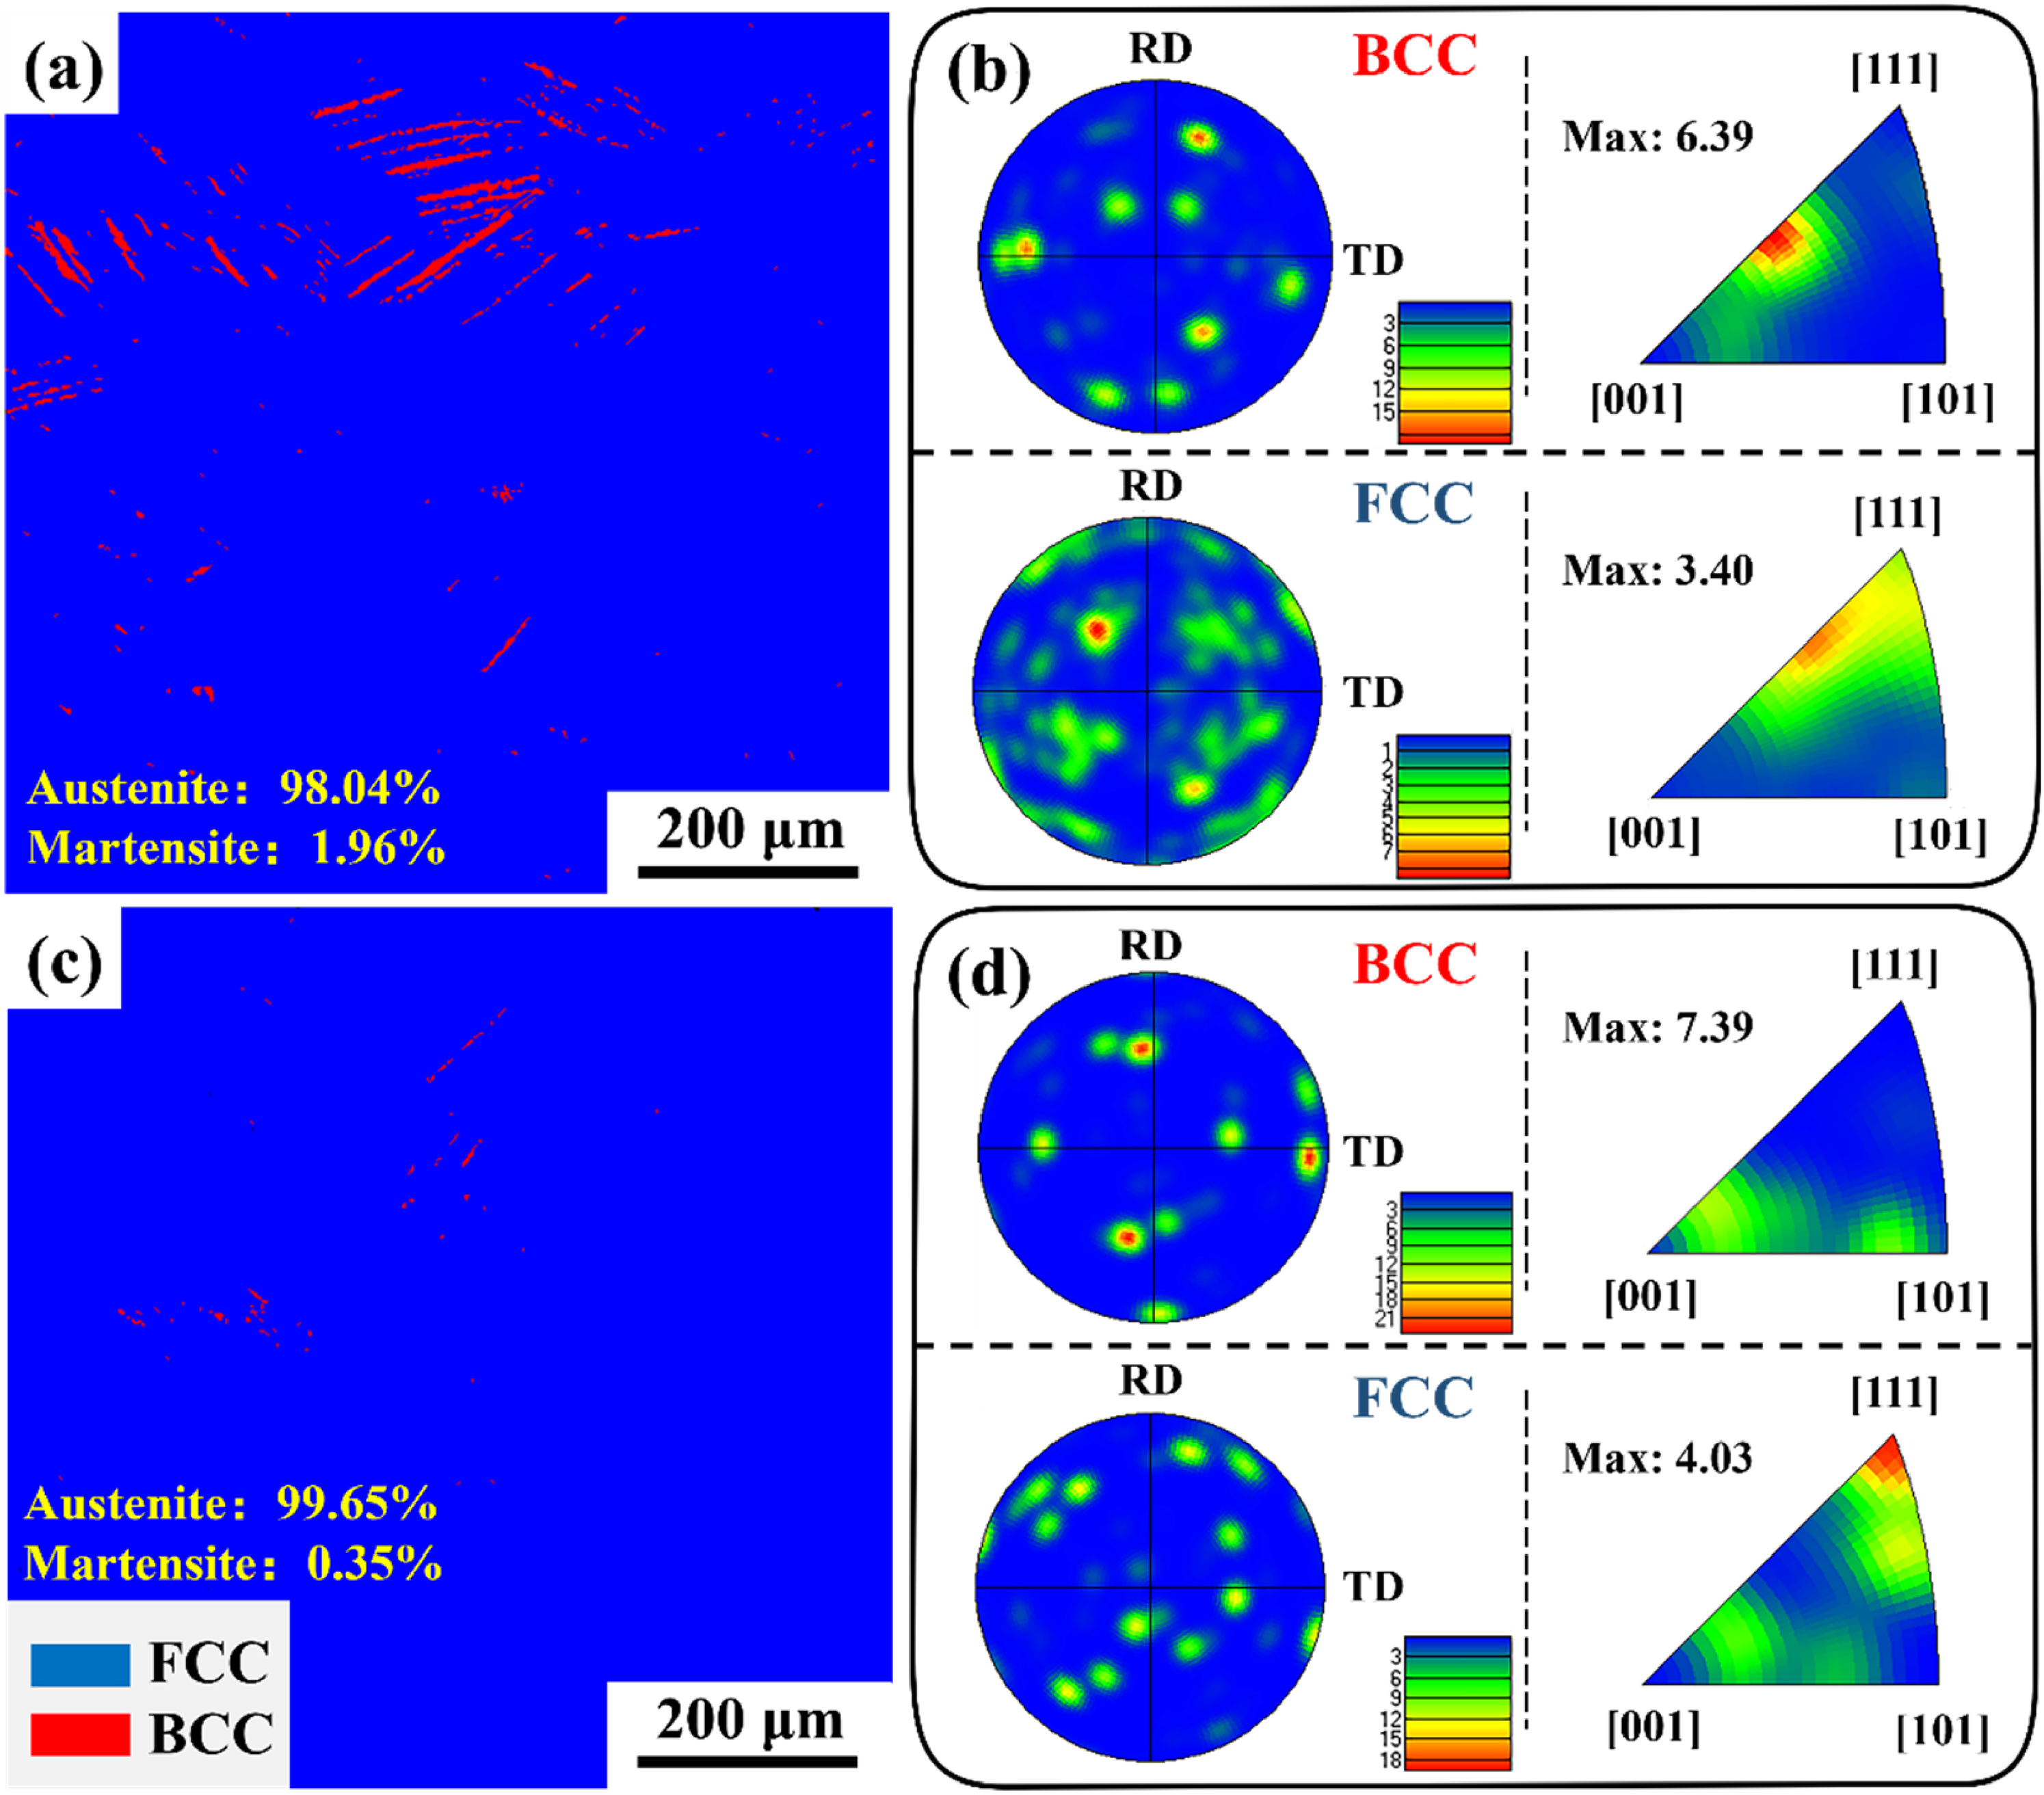
The phase maps, PF and IPF maps of the deformed alloy: (a), (b) position 1; (c), (d) position 4.
Mechanical properties
The typical tensile engineering stress–strain curves of the samples at four positions are present in Figure 10. As shown in Figure 10(a), the stress-strain curves of specimens from various positions all demonstrate a continuous increase in stress with progressive strain, with no apparent yield plateau observed. Moreover, as extensively documented in the literature, austenitic stainless steels demonstrate inherently restricted hardenability through conventional heat treatment protocols. 46 This intrinsic characteristic is morphologically substantiated by the absence of precipitation strengthening phases in the SEM micrograph shown in Figure 10(a). Under high-temperature deformation conditions, negligible distribution of secondary phase particles was observed. As illustrated in Figure 10(b), the sample from Position 4 exhibits significantly lower strength and elongation compared to samples from other positions, which is attributed to its coarser grain structure and lower proportion of Σ3 boundaries. According to the Hall-Petch relationship, the increase in grain size leads to a reduction in yield strength. Simultaneously, the decreased fraction of character boundaries weakens the ability of material to inhibit intergranular crack propagation. Σ3 grain boundaries exert a dual influence on the mechanical properties of materials as a typical low-energy coherent interface. 47 On one hand, they act as effective barriers to dislocations, contributing to grain boundary strengthening and thereby enhancing the ultimate tensile strength. 48 On the other hand, their high interfacial bonding energy suppresses grain boundary sliding and diffusion, making it difficult for cracks to nucleate and propagate along the boundaries. This promotes transgranular deformation and fracture, ultimately leading to a significant improvement in both uniform elongation and total elongation of the material. 49 Furthermore, it can be observed that the tensile strength and elongation of samples from Positions 1, 2 and 3 are relatively comparable. Notably, although the microstructure of the Position 1 specimen contains a relatively high dislocation density and some martensitic transformation—both of which theoretically contribute to increased strength—its yield strength remains notably low at only 197.2 MPa. This further corroborates that the high yield strength of the Fe-19Cr-10Ni-1Mn austenitic stainless steel in this study primarily originates from its uniform grain structure and high fraction of Σ3 twin boundaries. Additionally, to fundamentally elucidate the divergence in plastic deformation behavior between the two specimens, it is imperative to implement Schmid factor (m) analysis for investigating their slip system activation behavior, which can quantitatively evaluate the crystallographic slip system activation resistance through orientation-dependent Schmid law while addressing intergranular strain compatibility constraints in polycrystalline system. 50
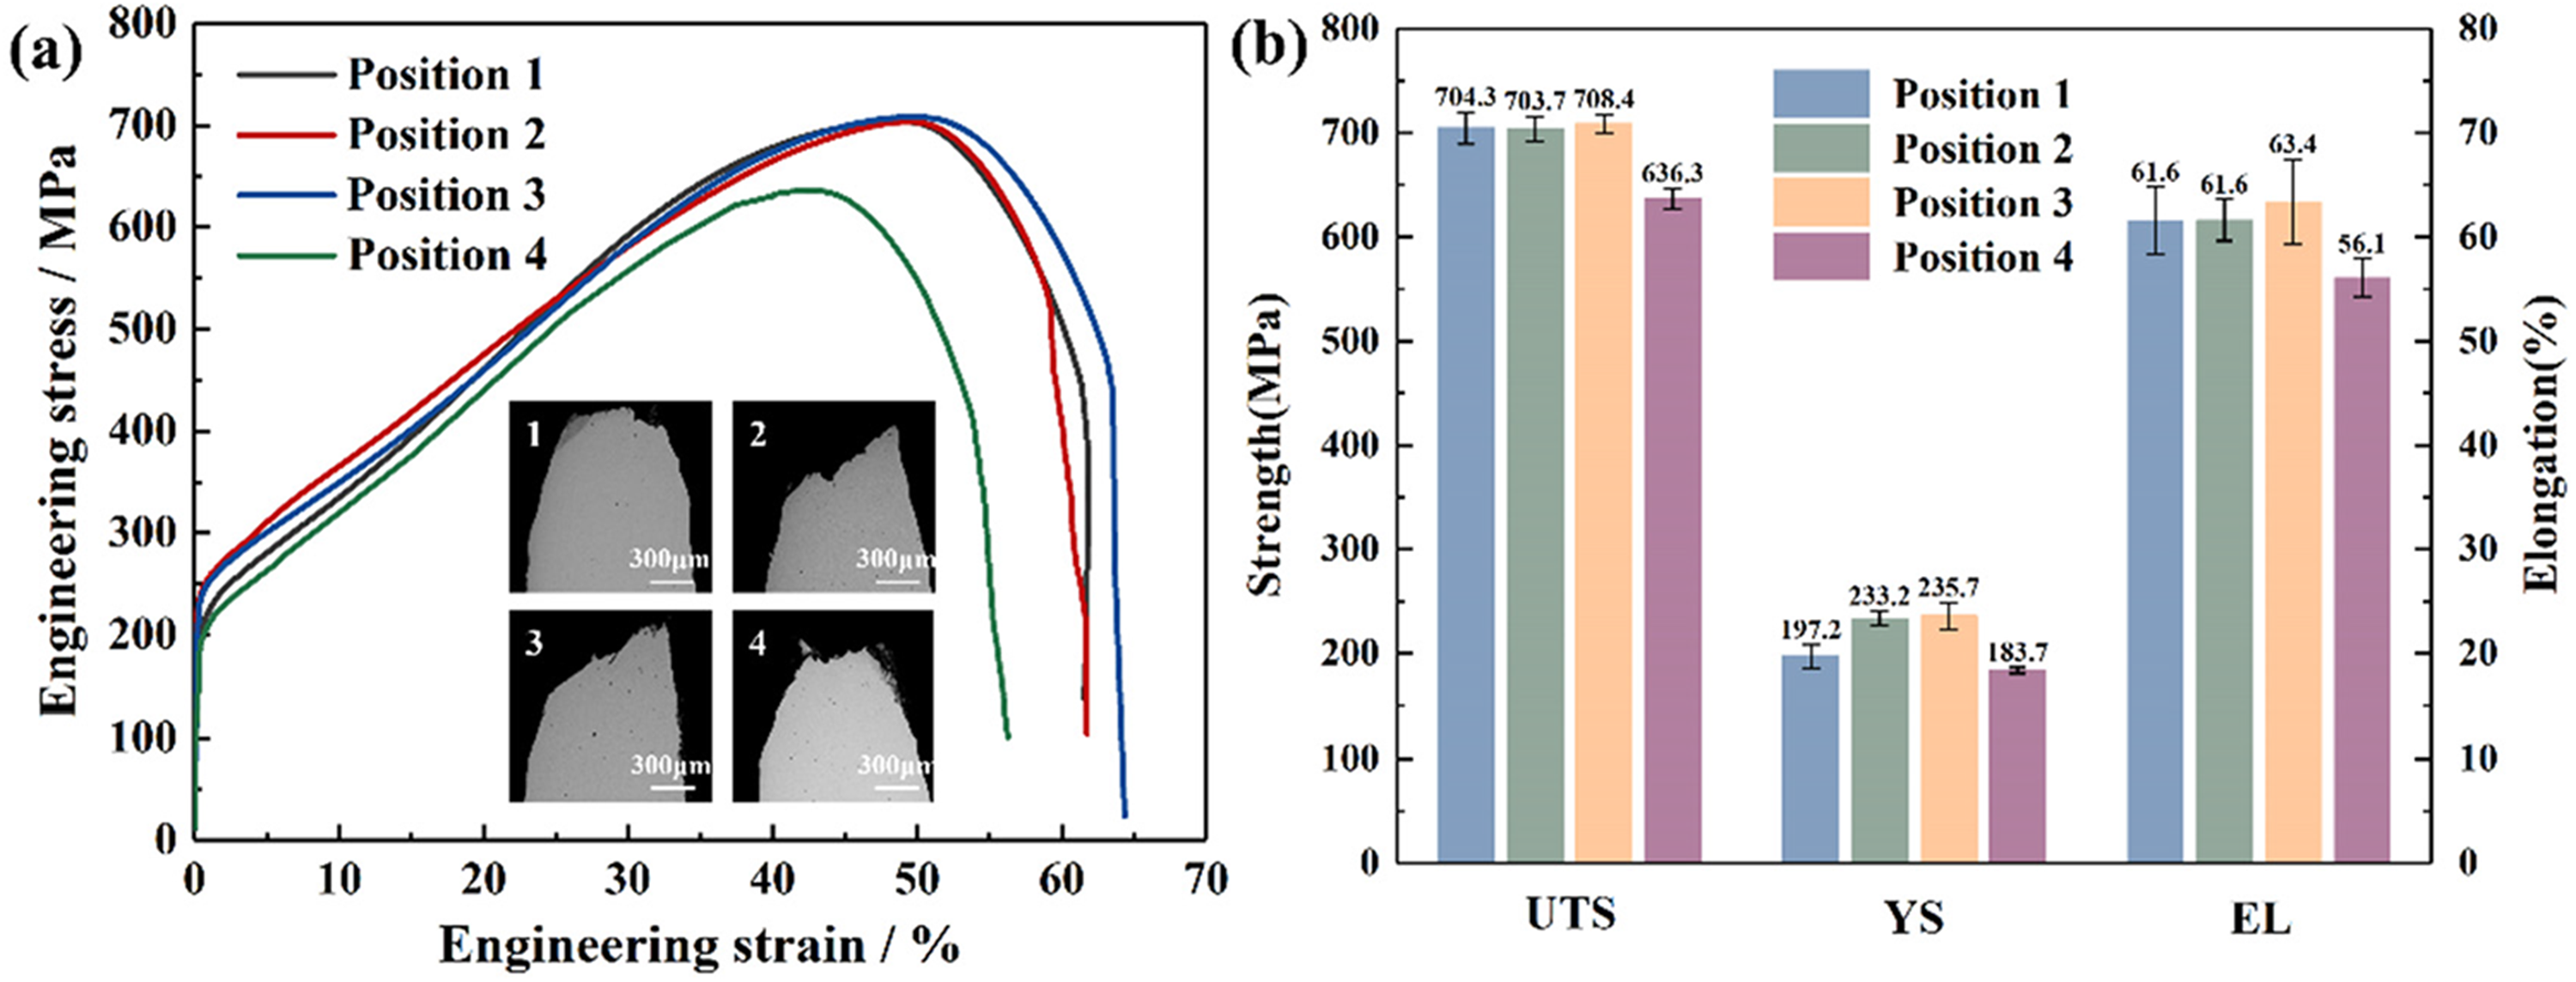
The room temperature tensile properties of the samples at four positions.
Figure 11 presents Schmid factor distribution maps for the specimens at four positions, with the orientation-dependent Schmid factor (m) quantitatively mapped through crystallographic orientation analysis. As revealed in Figure 11(a) and (d), the specimens at Position 1 and Position 4 exhibit significant phase-specific Schmid factor disparities between its austenite (FCC, m = 0.428) and martensite (BCC, m = 0.469) phases, and the interphase m-value disparity induces pronounced strain partitioning during deformation due to differential slip system activation energies, resulting in localized stress concentrations at phase boundaries that potentially initiate microcracks. In contrast, Figure 11(b) and (c) demonstrate that the monolithic austenitic (FCC) microstructure of Position 2 and 3 possess both a higher average Schmid factor (m = 0.457) and narrower distribution range, indicating enhanced slip system availability and homogenized plastic flow, which collectively contribute to its superior ductility through optimized stress redistribution and delayed plastic instability onset.
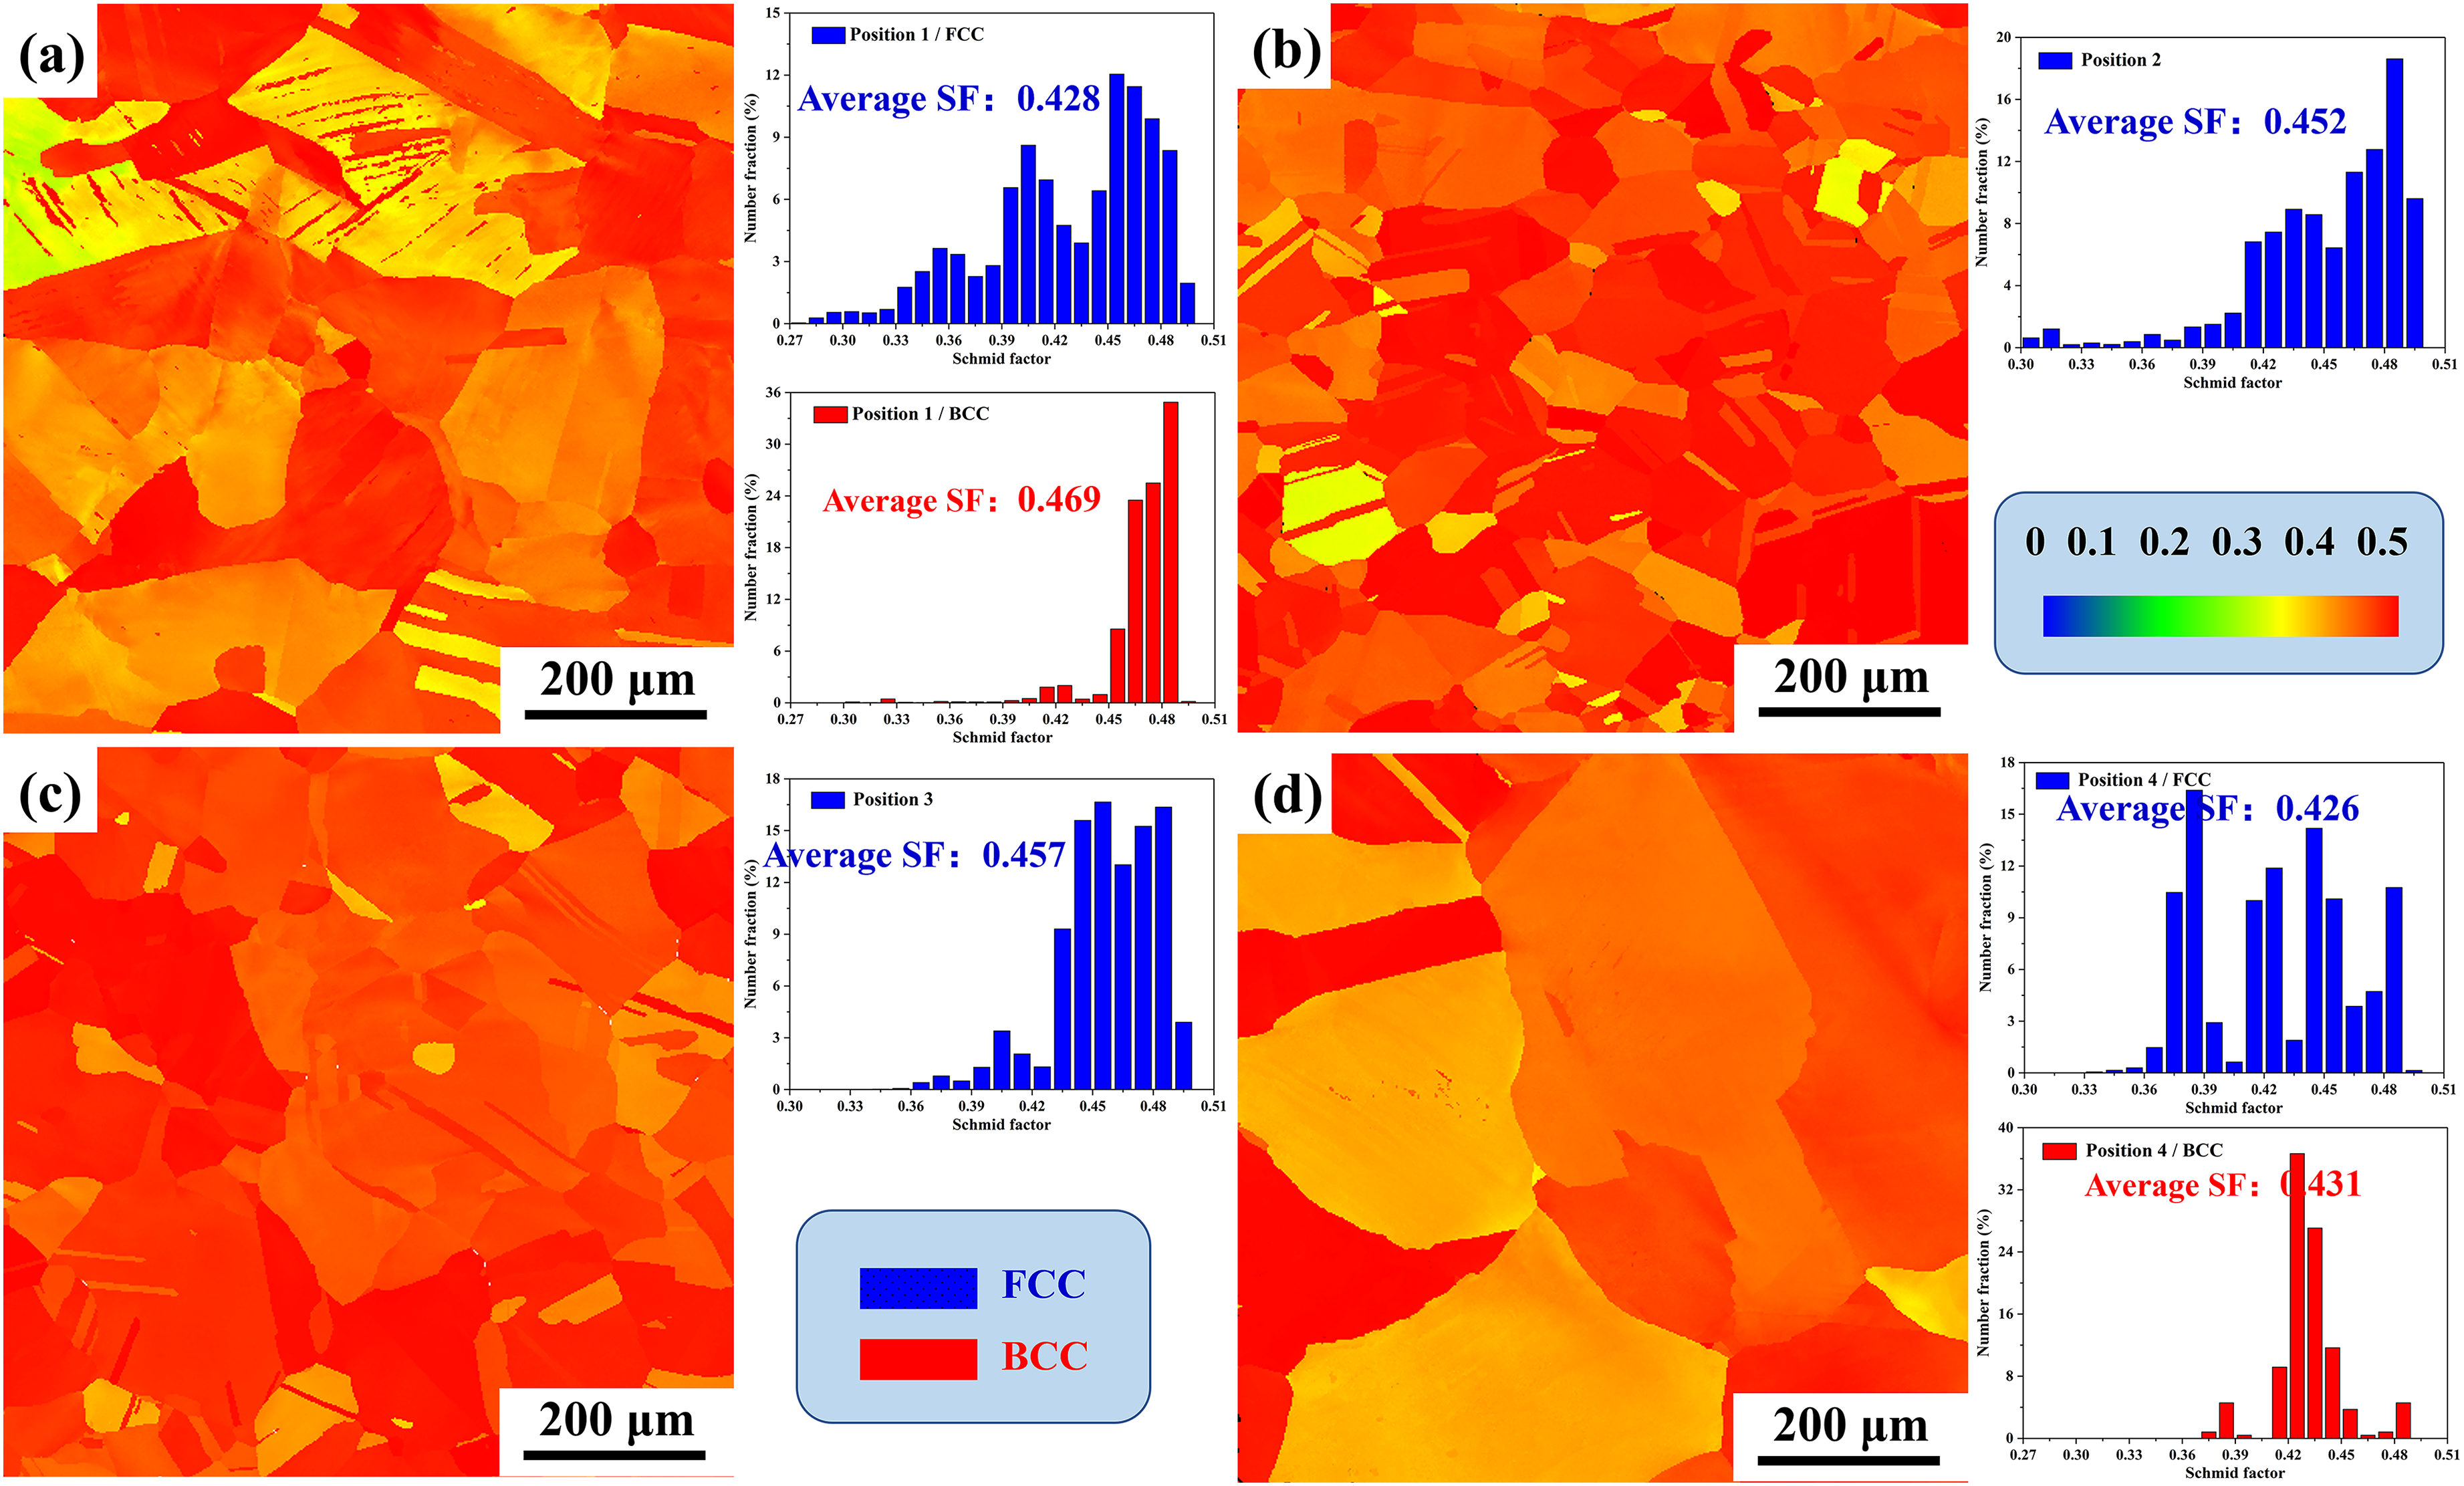
Schmid factor (SF) distribution of the samples at four positions.
Figure 12 shows SEM micrographs of the fracture surfaces across the specimens of different Positions, universally characterized by dimples of varying dimensions that conclusively evidence a ductile fracture mechanism dominated by microvoid nucleation and coalescence. As depicted in Figure 12(a), the fracture surface of specimen at Position 1 exhibits a bimodal dimple distribution, segregating into distinct zones of deep and shallow dimples, whereas Figure 12(b) reveals shallow dimples intermingled with serpentine glide features, indicating existence of localized shear banding under low stress triaxiality. Figure 12(c) further captures the void coalescence stage, where elongated micropores interconnect through tear ridges, demonstrating accelerated void growth kinetics and indicating significant plastic deformation in the alloy prior to fracture. In contrast, the fracture surfaces of specimens at Position 2 and 3 exhibit uniformly distributed fine equiaxed dimples. A higher dimple density generally indicates a greater number of microvoid nucleation sites and enhanced plastic deformation capacity prior to fracture, which is consistent with the observed higher uniform elongation. 51 Furthermore, this observation confirms the effective role of Σ3 grain boundaries in suppressing intergranular fracture. Specifically, alloys with a higher proportion of low-Σ CSL boundaries (51% and 55.3% Σ3 boundaries) demonstrate a markedly increased dimple density and a more homogeneous dimple distribution on the fracture surface. 52 Notably, Figure 12(j) exposes severe surface roughening and macro-crack propagation, with high-resolution SEM micrographs revealing extreme dimple size heterogeneity that directly correlates with degraded fracture toughness. This microstructural degradation mechanism, coupled with strain localization exceeding the critical void volume fraction, predisposes Position 4 to preferential crack initiation during processing, ultimately triggering premature ductile fracture.

The fracture morphologies of the deformed alloy: (a), (b) and (c) position 1; (d), (e) and (f) position 2; (g), (h) and (i) position 3; (j), (k) and (l) position 4.
Conclusions
The Fe-19Cr-10Ni-1Mn austenitic steel component with curvature geometries was obtained by hot stamping, and the microstructural evolution, textural development and mechanical properties across distinct regions were systematically characterized. The main conclusions are as follows:
The microstructure of the workpiece after hot stamping deformation exhibited pronounced heterogeneity across different locations. Samples from Positions 1 and 4 displayed a high dislocation density and the occurrence of martensitic transformation. In contrast, a higher proportion of Σ3 boundaries (60°/<111 > twinning relationships) in samples at Position 2 and 3 indicates enhanced thermally-activated dislocation climb within these regions, which contributed to a more uniform grain structure. Driven by the combined effects of heterogeneous plastic deformation and recrystallization, the specimens from different locations exhibit pronounced spatial heterogeneity in crystallographic texture, which aligns with the distribution of their microstructures. Samples from Positions 1 and 4 display exceptionally high texture intensities, characterized by strong Brass, Copper, and S deformation components, while the textures at Positions 2 and 3 are comparatively weak and comprised of a diffuse distribution of multiple components. The inferior strength and ductility at Position 4 are directly linked to its coarse grain structure and low density of Σ3 boundaries. In contrast, the enhanced yield strength observed at Positions 2 and 3 is primarily attributed to grain boundary strengthening resulting from a uniform grain structure and a high fraction of Σ3 twin boundaries, while the dislocation hardening and the limited martensitic transformation play a negligible role in comparison. Moreover, although all sampled locations exhibited typical ductile fracture characteristics, the presence of macroscopic cracks at Position 4 indicates a higher susceptibility to crack initiation during processing.
Footnotes
Acknowledgements
The work is supported by the National Key Research and Development Program of China (No. 2024YFB3411202).
Author contributions
Chang Liu involved in methodology, experimentation and data analysis, and drafted the first version of the manuscript; Hongbang Shao involved in data curation and writing—review and editing; Yuanchun Huang involved in conceptualization and funding acquisition; Zhengbing Xiao involved in formal analysis and supervision; Yu Liu involved in funding acquisition; Zhangxi Wu involved in discussion.
Author contribution(s)
Funding
The authors disclosed receipt of the following financial support for the research, authorship, and/or publication of this article: This work was supported by the National Key Research and Development Program of China, (grant number 2024YFB3411202).
Declaration of conflicting interests
The authors declared no potential conflicts of interest with respect to the research, authorship, and/or publication of this article.