
Abstract
This study examined the thermomechanical response and microstructural evolution of AA3003 aluminum alloy in the as-fabricated F-temper during compression from room temperature to 550°C at strain rates ranging from 5 × 10 − 5 s − 1 to 5 × 10 − 2 s − 1. The initially heterogeneously deformed microstructure of the F-temper alloy promoted recovery and recrystallization. For temperatures below 250°C, the flow curves exhibited moderate strain hardening followed by softening, whereas above 250°C, especially at low strain rates and near 350°C, the mechanical behavior was characterized by a stabilized flow stress and marked strain-rate sensitivity. Electron backscatter diffraction (EBSD) revealed that continuous dynamic recrystallization (CDRX), i.e., progressive subgrain rotation and boundary-misorientation increase leading to new grains, dominated at high strain rates, whereas a transition toward concurrent CDRX and discontinuous dynamic recrystallization (DDRX), i.e., nucleation and growth of new strain-free grains, occurred at lower strain rates, with an estimated transition Zener–Hollomon value around Z ≈ 2.92 × 10⁹ s − 1. These findings provided valuable insight into the interplay between deformation parameters, dynamic softening mechanisms, and microstructural refinement in AA3003-F.
Keywords
Introduction
AA3003 is a widely used wrought Al–Mn alloy, valued for its low density, medium strength, excellent formability and high corrosion resistance. 1 These properties make it suitable for a broad range of applications, including low- to medium-strength structural components in the aerospace and automotive industries, heat exchangers, consumer electronics housings, and food appliances.2–4 Aluminum alloys are designated by their major alloying element and their temper, which reflects the general thermomechanical processing history and resulting mechanical properties.5–7 In the annealed state (AA3003-O), typical mechanical properties are a yield strength of σy ≈ 42 MPa and an ultimate tensile strength (UTS) of ∼110 MPa. Because AA3003 is a non-heat-treatable alloy, it is commonly strengthened by strain hardening, a condition typically designated by the letter “H”. 1 The letter H is followed by a number indicating the degree of strain hardening introduced during processing, 8 with the mechanical properties increasing as this number increases. For example, the hardest temper conventionally produced is AA3003-H18, which is characterized by a yield strength of σy ≈ 185 MPa and UTS ≈ 200 MPa. Other common industrial tempers include “H112” (partially strain-hardened during elevated-temperature processing, with defined yield stress range, σy ≈ 40–70 MPa) and “F”.1,2,5
The F-temper corresponds to the “as-fabricated” condition. This designation is used for products obtained by shaping processes such as rolling, extrusion, forging, drawing, or casting, for which no particular control of thermal conditions or strain hardening is specified.1,6,7 Wrought aluminum alloys in the F-temper are not associated with specific mechanical property limits, and are generally regarded as “semi-finished” products, 1 intended to be further processed by subsequent shaping, finishing, and/or thermal processing to reach final component and/or temper requirements.
For example, AA3003 alloy bars are used in the F-temper for the fabrication of plate-fin heat exchangers,9,10 in order to obtain a microstructure with large grains to prevent the diffusion of the brazing material in the grain boundaries. These exchangers are assembled by vacuum furnace brazing, during which thermal gradients and heterogeneous contact conditions can induce stresses and slow stress relaxation. AA3003 bars in the F-temper typically exhibit a highly deformed initial microstructure with high internal misorientation and significant stored strain energy, owing to the absence of controlled thermomechanical processing, which leads to marked scatter in yield strength values. 11 Consequently, this pre-existing condition inherently favors restorative processes such as dynamic recovery and dynamic recrystallization under subsequent thermomechanical loading,12–17 as experienced by the bars during the brazing thermal cycle. Therefore, investigating the deformation response of AA3003 in the F-temper over the room-temperature-to-hot-deformation range is essential to better understand and control the alloy behavior during subsequent processing.
Processes of microstructural transformation, such as recovery and recrystallization, have been extensively studied.18–22 Both recovery and recrystallization are thermally activated phenomena driven by the strain energy stored in deformed grains. Recovery is characterized by changes within deformed grains through dislocation rearrangement and annihilation. In contrast, recrystallization involves the formation and growth of new, strain-free grains through the displacement of high-angle grain boundaries (HAGB).18,23,24 Under mechanical straining, dynamic softening—encompassing both dynamic recovery and dynamic recrystallization—may occur depending on the deformation conditions.20,25 Dynamic recrystallization is commonly associated with warm and hot deformation. The former is generally linked to temperatures between ∼0.3Tm and 0.5Tm, whereas the latter is related to temperatures above ∼0.5Tm, where Tm denotes the melting temperature on an absolute scale. 26 Dynamic recovery, which is also influenced by temperature, is strongly favored in high stacking fault energy (SFE) materials such as aluminum 21 and can account for softening even at temperatures in the cold deformation range (below ∼0.3Tm). 27
Two main dynamic recrystallization mechanisms are generally distinguished in metallic materials, depending on the SFE: discontinuous dynamic recrystallization (DDRX) and continuous dynamic recrystallization (CDRX). 28 DDRX follows a classical “nucleation and growth” mechanism, where new grains bounded by HAGBs nucleate—typically at pre-existing HAGBs such as original grain boundaries—and grow into the deformed matrix as detailed in the review by Huang and Logé. 29 This process often involves grain-boundary bulging and subsequent strain-induced boundary migration.25,27 However, DDRX is rarely observed as the sole mechanism in high SFE metals and alloys such as aluminum, and it more commonly occurs under specific conditions or in conjunction with other processes.30,31
In contrast, CDRX is frequently the predominant dynamic recrystallization mechanism in high-SFE materials such as aluminum. 30 Unlike DDRX, CDRX does not involve a distinct nucleation event; rather, it corresponds to a progressive evolution of the deformed microstructure. 21 New grains form within deformed parent grains through the rearrangement of dislocations into cells and the gradual increase in boundary misorientation, leading to the transition from dislocation-cell walls to subgrain boundaries (SGBs), low-angle grain boundaries (LAGBs), and finally high-angle grain boundaries (HAGBs).21,27 In EBSD-based studies, HAGBs are commonly defined as boundaries with misorientation angles greater than 15°, while LAGBs correspond to lower values of misorientation angle.19,21 By contrast, the lower-angle threshold used to distinguish subgrain boundaries from more developed low-angle boundaries is not universal. Although boundaries below about 5° are frequently treated as subgrain boundaries in EBSD studies, the exact subdivision is method-dependent and should be interpreted in light of the analytical approach and the recovery or recrystallization mechanism being discussed.27,28
CDRX can thus be viewed as the combined outcome of strain hardening, dynamic recovery, and boundary evolution, leading to microstructural refinement. Although CDRX is typically dominant in high-SFE metals, transitions toward DDRX can occur under specific conditions. For instance, Montheillet et al., in their review on DRX, reported a strain-rate-dependent transition observed in AA6060 tested under compressive loading at 400°C 31 for strain rates in the range of 1 × 10 − 3 s − 1 and 3 s − 1.
To characterize thermomechanical conditions during temperature-dependent deformation and their influence on microstructural evolution, researchers often use a single temperature-compensated strain-rate quantity, named the Zener–Hollomon parameter (Z).
32
This term combines the effects of strain rate (
Beyond macroscopic parameters, microstructural features can strongly influence recrystallization mechanisms. AA3003 contains two main types of second-phase particles: α-Al(Mn,Fe)Si and Al6(Mn,Fe),37,38 which form by precipitation in the matrix during cooling and/or subsequent exposure to high temperature. 39 These particles are commonly observed in two size ranges: coarse particles (> 1 µm), which can be either α-Al(Mn,Fe)Si or Al6(Mn,Fe), and finer particles (dispersoids), typically of type α-Al(Mn,Fe)Si. 37 Dispersoids, often numerous, can pin grain boundaries and hinder their migration during recrystallization, thereby limiting grain growth (Zener pinning).17,40,41 This effect varies with the size, number density, as well as the coherence of dispersoids of the Al alloy, and can influence both recovery and recrystallization. In their study of Zr-bearing dispersoids in an Al–0.8%Mg–1.0%Si alloy, Elasheri et al. 42 showed that a large and uniform density of small (∼ 10 nm) coherent dispersoids increased the hot-deformation flow stress by 20% compared to the Zr-free base alloy. In that case, strong Zener pinning of dislocations was also observed, leading to a marked inhibition of dynamic recovery. By contrast, the effect was reduced to a minimal impact on flow stress with only a moderate delay of dynamic recovery for a low density of coarser (100–200 nm) coherent dispersoids. Xu et al. 43 reported that, for AA3003 cold rolled to 70% thickness reduction and annealed at 425°C, particle-stimulated nucleation (PSN) was facilitated by an increased fraction of second-phase particles larger than 1 µm, making coarse particles a controlling factor for recrystallization at this temperature. The deformed zones surrounding these particles, with distorted and rotated lattices, provide regions of high stored energy suitable for nucleation events, as is shown by Park and Muraishi, 17 in their work on static recrystallization of AA3003.
Previous studies on aluminum alloys commonly report mechanical behavior characterized by an initial strain-hardening stage followed by dynamic softening, with strong dependence of the response on temperature and strain rate. Different works on the compression behavior of AA3003 have shown flow softening after peak stress during hot compression, 44 as well as pronounced dependence of plastic flow on temperature and strain rate. 45 In the previously mentioned study on AA3003 by Xu et al., 43 these authors found that during annealing between 350°C and 375°C the dominant microstructural change is static recrystallization. Similar trends have been reported for other alloys: AA7075-T6 exhibits strain hardening at lower temperatures and transitions to stress saturation or softening at higher temperatures, 46 while AA7050 can display an initial peak followed by a steady state or a gradual decrease in flow stress. 47 Softening in AA6069, attributed to dynamic recovery at relatively low temperatures, has also been reported. 48
Building on this understanding of the as-fabricated state and the fundamental mechanisms of dynamic softening, the present study investigates the thermomechanical behavior of AA3003 in the F-temper over a broad range of temperatures and strain rates. Given the material's highly deformed initial microstructure, particular emphasis is placed on the roles of dynamic recovery and recrystallization. Accordingly, the strain-rate dependence of the stress–strain response is analyzed, with special attention to behavior near 350°C, where restorative mechanisms are expected to be most active. To clarify the underlying transformations in the present work, samples deformed under various conditions were characterized by electron back-scattered diffraction, enabling direct correlation between the mechanical response and microstructural evolution.
Experimental
Material and sample preparation
AA3003 bars in the F-temper, produced by drawing and having a rectangular cross-section of 18 × 9.63 mm2, were used in this study. The chemical composition provided by the manufacturer was (wt. %): 0.11 Si, 0.52 Fe, 0.059 Cu, 1.003 Mn, 0.012 Mg, 0.004 Cr, 0.024 Zn, 0.043 Ti, with the balance Al.
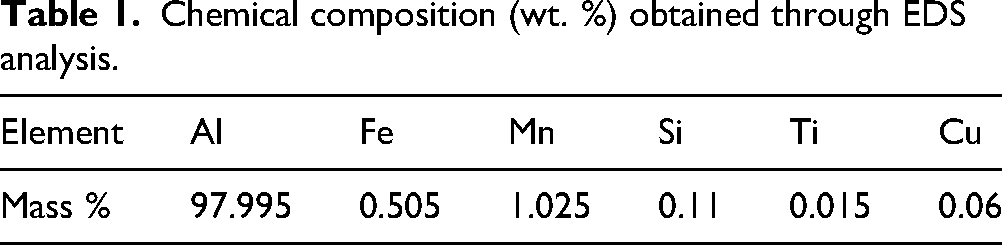
A chemical analysis was performed on the bars upon reception using Energy Dispersive X-ray Spectroscopy (EDS). Measurements were carried out in a Zeiss Supra-40 Scanning Electron Microscope (SEM) at a working distance of 9 mm, an accelerating voltage of 15 kV, and a probe current of 4 nA, using a Bruker EDS system and acquisition software. The resulting composition (wt. %) for the detected elements is reported in Table 1. Note that EDS provides a semi-quantitative composition; the present measurements are used to confirm the alloy chemistry and identify the main alloying elements.
Chemical composition (wt. %) obtained through EDS analysis.
Thermomechanical tests
Cylindrical compression specimens were machined by electrical discharge machining (EDM) from the bars along the Normal Direction (ND), the Transverse Direction (TD), and the Drawing Direction (DD), as shown in Figure 1. The resulting specimens had a length of 9.63 mm for ND and 9 mm for DD and TD, a diameter of 6 mm in all cases, and a nominal surface roughness of 1.6 µm Ra. Specimen dimensions and testing conditions were selected following the measurement good practice guide for hot axisymmetric compression by Roebuck et al., 49 which provides practical recommendations to minimize uncertainty in hot flow stress measurements, in accordance with the general practices for compression testing of metallic materials in ASTM E9–19 50 and elevated-temperature compression practice in ASTM E209-00. 51
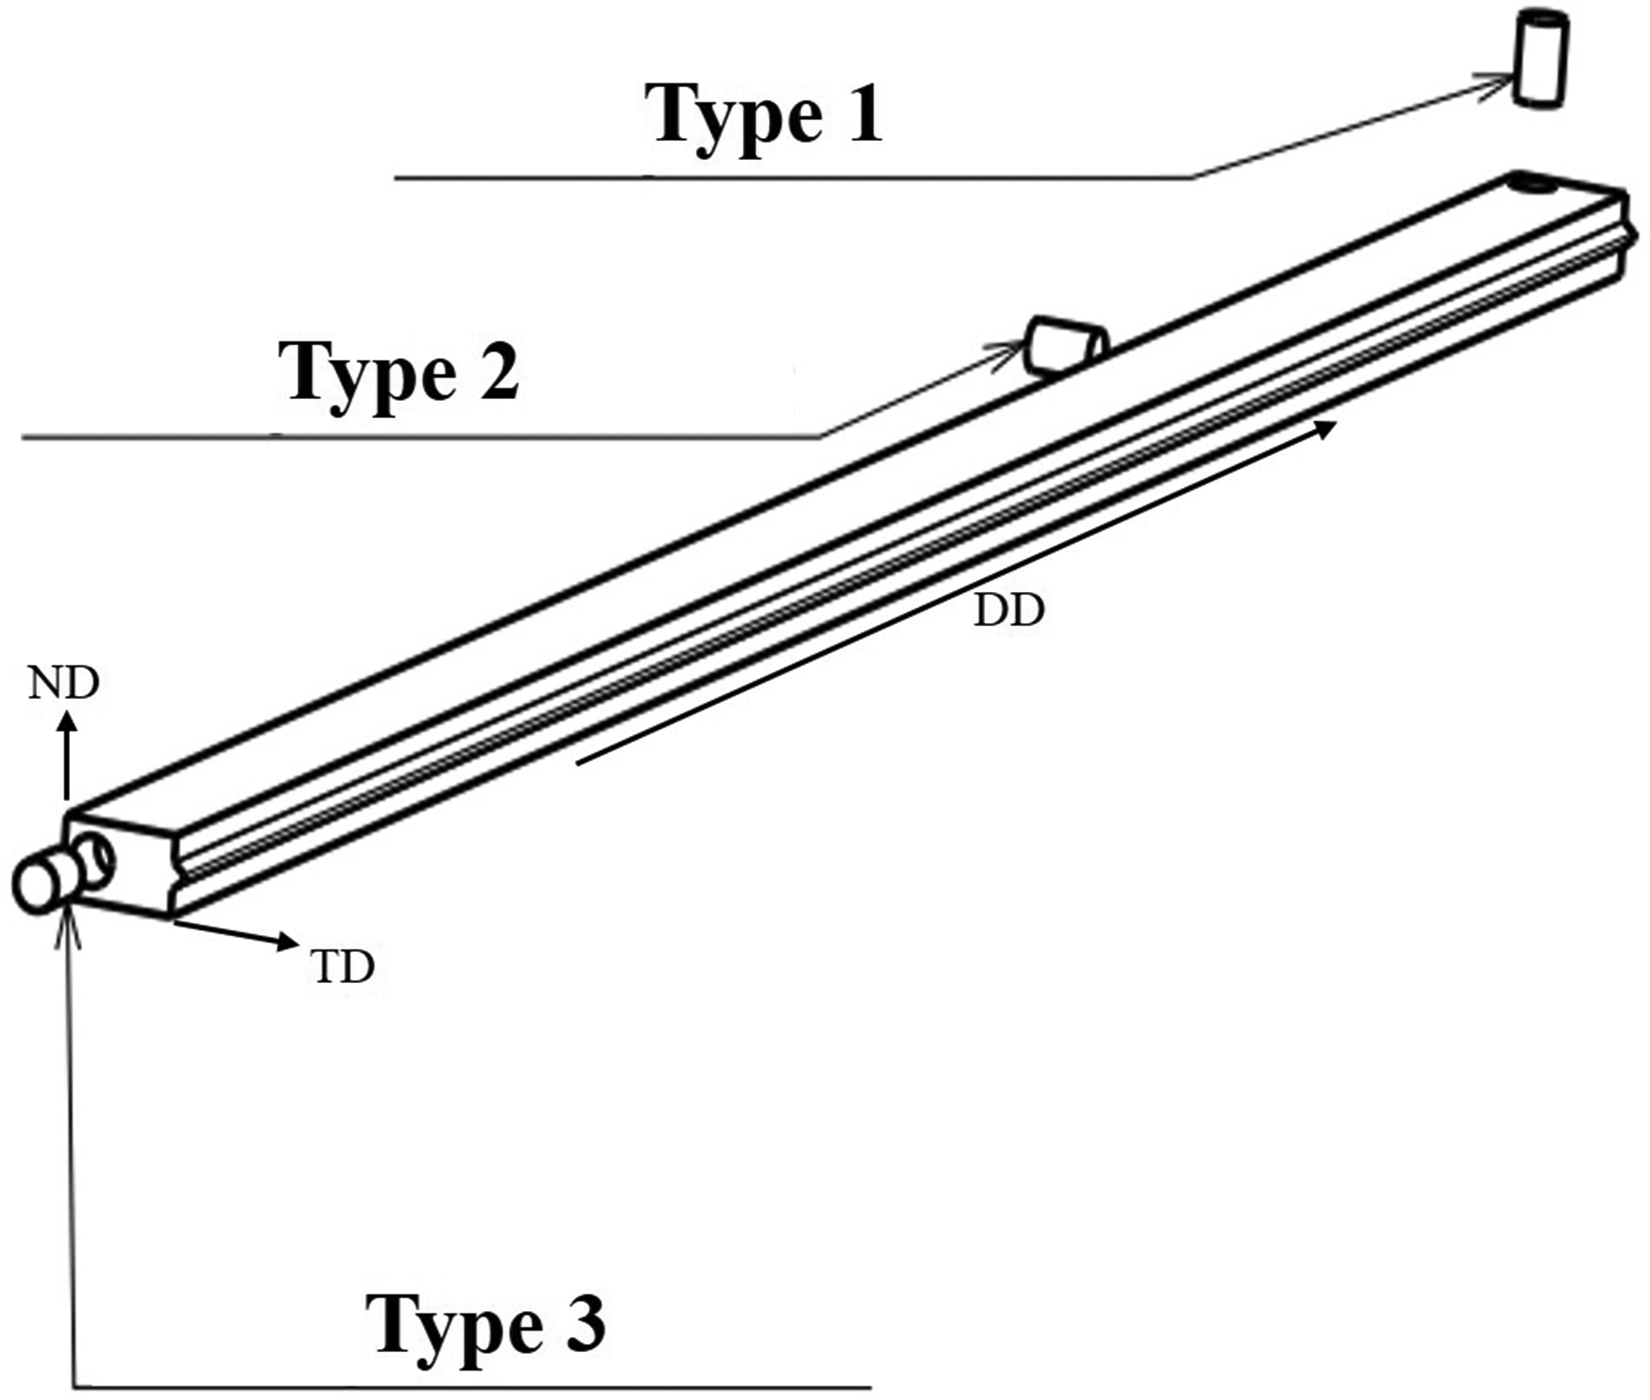
Schematic of the orientation of the samples regarding the bars.
Compression tests were performed on a Zwick Z1200 uniaxial testing machine equipped with a 10 kN load cell. Prior to testing, the anvils were coated with a thin layer of boron nitride (BN) to reduce friction at the specimen–anvil interface and to minimize barreling. Each temperature–strain-rate condition was tested at least twice to assess repeatability, and the results are reported as mean true stress–true strain curves.
The machine was equipped with a cylindrical furnace enclosing the specimen and part of the compression anvils to maintain thermal isolation of the anvil–specimen region. The furnace control system used three internal thermocouples located in close proximity to the anvils and specimen to limit temperature gradients in the set-up. Tests were conducted from room temperature up to 550°C using a heating rate of 15°C/min, followed by a 10 min temperature homogenization hold prior to loading. The deformation temperatures were selected to cover the typical thermomechanical processing window of AA3003 and the thermal exposure range relevant to forming and brazing operations used in plate-fin heat exchanger industry. 37
To assess the level of anisotropy, stress-strain curves of tests performed on specimens extracted along the three directions, in the same thermomechanical conditions, were compared. The resulting flow responses exhibited only limited directional variation, with differences remaining small relative to the experimental scatter and the absolute flow stress levels in the analyzed strain range (see Fig. A1 and Supplemental material A).
Although a few tests were performed to a total strain of ∼50%, most compression tests were stopped after ∼10%, as the study focuses primarily on the early stages of the mechanical response. Assuming uniform axial shortening, the specimen height during compression was taken as h(t) = h0 − v0t, where h0 is the initial height and v0 the constant crosshead speed. The instantaneous true strain rate is thus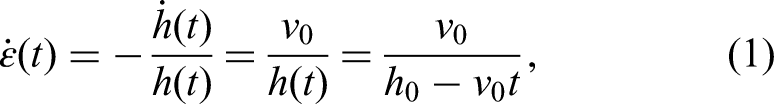
The crosshead displacement, d, was recorded and used to compute the nominal strain,
Microstructural analyses
An initial characterization of the microstructure of the bars received in the F-temper condition was performed by Electron Backscatter Diffraction (EBSD) at several locations. EBSD was carried out in a Scanning Electron Microscope (JEOL F100 SEM) equipped with an Oxford Symmetry S1 detector, using a step size of 0.2 µm. Three scans were acquired at bar mid-height across the width, namely near one edge (M1), at mid-width (M2), and near the opposite edge (M3). The scan positions and corresponding results are presented in the Supplemental material C.
For metallographic preparation, samples were cut using a Struers Secotom-15 with a 200 mm cut-off wheel, a rotation speed of 2400 rpm, and a feed rate below 0.05 mm/s to limit surface deformation during cutting. Surfaces were then sequentially ground using FEPA P 500, 1200, 2000, and 4000 papers, followed by electrolytic polishing with a Struers LectroPol using Struers electrolyte A2, a 2 cm2 mask, an applied potential of 20 V, with a flow rate setting of 10 (LectroPol internal setting), during 15 s. Specimens were subsequently cleaned and mounted for EBSD acquisition. This preparation protocol was applied to both the as-fabricated bars and selected compression samples, prepared at mid-height after deformation.
To evaluate static recrystallization and distinguish thermal from mechanical contributions to restorative mechanisms, three control samples (HT1, HT2, HT3) were heat-treated at 350°C for 10, 40, and 130 min, respectively, and then quenched in water. These durations provide a reference for comparison with the total thermal exposures (including the 10 min homogenization hold) experienced by some of the deformed samples. The heat-treated specimens were prepared following the same metallographic protocol. EBSD scans were acquired on the prepared surfaces using the same SEM equipment and conditions as for the as-received bars. All maps were collected at an accelerating voltage of 15 kV and a probe current of 7 nA, and were analyzed using ATEX 52 and Aztec Crystal.
Results
Microstructure of the as-received AA3003 F-temper bars
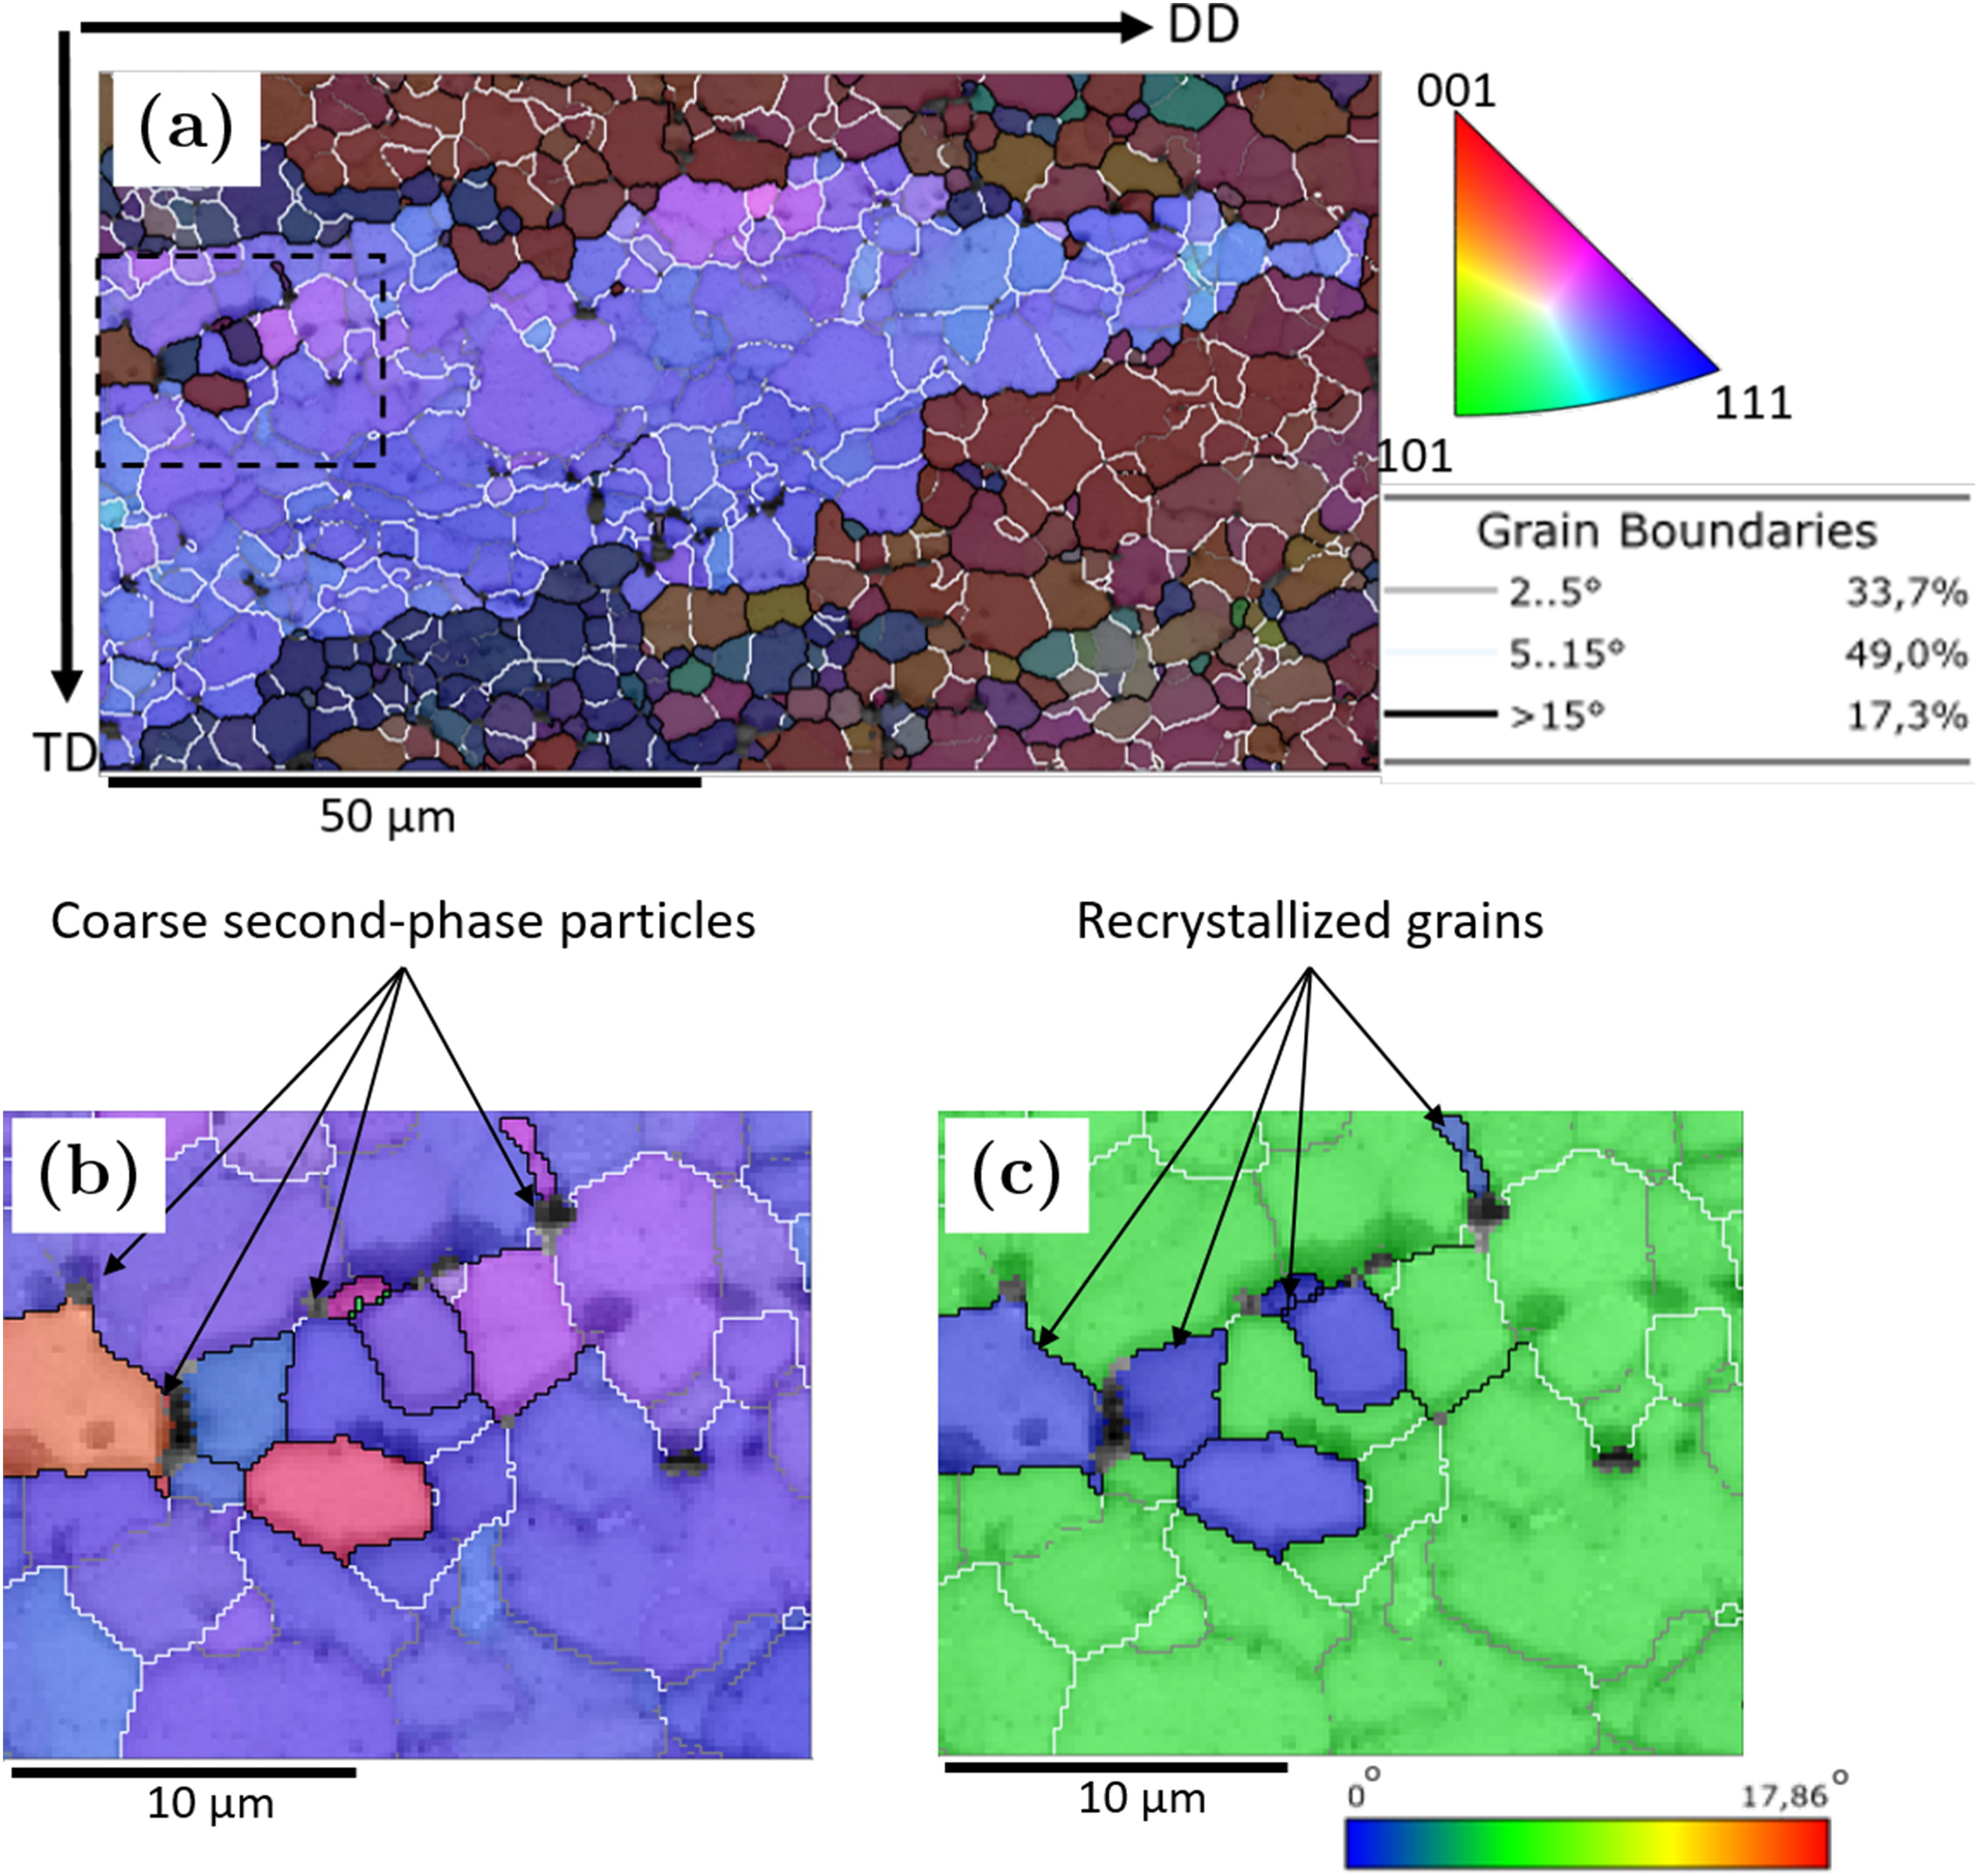
The EBSD map along the drawing direction (DD) of the as-received F-temper bar is shown in Figure 2(a). The dominant crystallographic orientations were ⟨111⟩||DD and ⟨001⟩||DD, which are typical fiber components produced during drawing of FCC metals. These components may appear not only in axisymmetric wire drawing but also in drawing of bars with non-circular cross-sections, and their intensity often varies across the bar section. 53

(a) EBSD maps of the as-fabricated bars at mid-height and mid-width of the bar (position M2 in Supplemental material A), with the proportion of SGBs (48.4%), LAGBs (32.6%) and HAGBs (19.1%), (b) sub-region of the previous EBSD maps showing in detail the deformation substructures in some grains, (c) Kernel Average Misorientation of the same region shown in the first image, and (d) probability density distribution of the local misorientation of the as-fabricated material and of an Annealed sample of the same material, both obtained from KAM maps.
Because similarity in the grain orientations along DD could give the visual impression of a weakly deformed microstructure in the EBSD maps, the grain boundaries were classified according to their misorientation angles. Three types of boundaries were distinguished in Figure 2(a) and throughout this study: SGBs (2°–5°), LAGBs (5°–15°), and HAGBs (> 15°). Very low-angle misorientations and SGBs are typically associated with the rearrangement of dislocations introduced during deformation into substructures such as dislocation cells and subgrains, especially in high-SFE alloys. In contrast, HAGBs may correspond either to pre-existing boundaries from the initial microstructure or to boundaries associated with recrystallized grains.
The distribution of boundary types in Figure 2(a) indicates that the material retains a significantly deformed substructure, as SGBs (shown in grey) represent approximately 50% of the identified boundaries. A magnified view of a representative subregion is shown in Figure 2(b). To improve visibility, SGBs are highlighted in blue.
Figure 2(c) shows the Kernel Average Misorientation (KAM) map corresponding to the region presented in Figure 2(a). The KAM represents the average misorientation between each pixel and its neighboring pixels and therefore provides a measure of local orientation gradients associated with geometrically necessary dislocations. 54
To better assess the level of local misorientation associated with the deformation state of the material, the probability density function of the KAM distribution obtained from the data in Figure 2(c) was compared with that of the sample annealed at 350°C for 130 min (HT3) in Figure 2(d). In the annealed condition, the KAM distribution indicates that local misorientations rarely exceed 0.5°, which is characteristic of a recrystallized microstructure. In contrast, in the as-fabricated material the majority of the local misorientations lie between 0.5° and 2°, providing strong evidence that the material retains a significant deformation substructure while showing indications of partial recovery resulting from its prior thermomechanical processing.
Strain rate and temperature dependence of the mechanical behavior of AA3003 F-temper
The mean true stress–true strain curves for tests stopped at ∼10% total strain are shown in Figure 3(a) for room temperature, 250°C, and 450°C, and in Figure 3(b) for 150°C, 350°C, and 550°C. Solid and dashed lines represent mean curves, while the shaded bands indicate the experimental scatter.
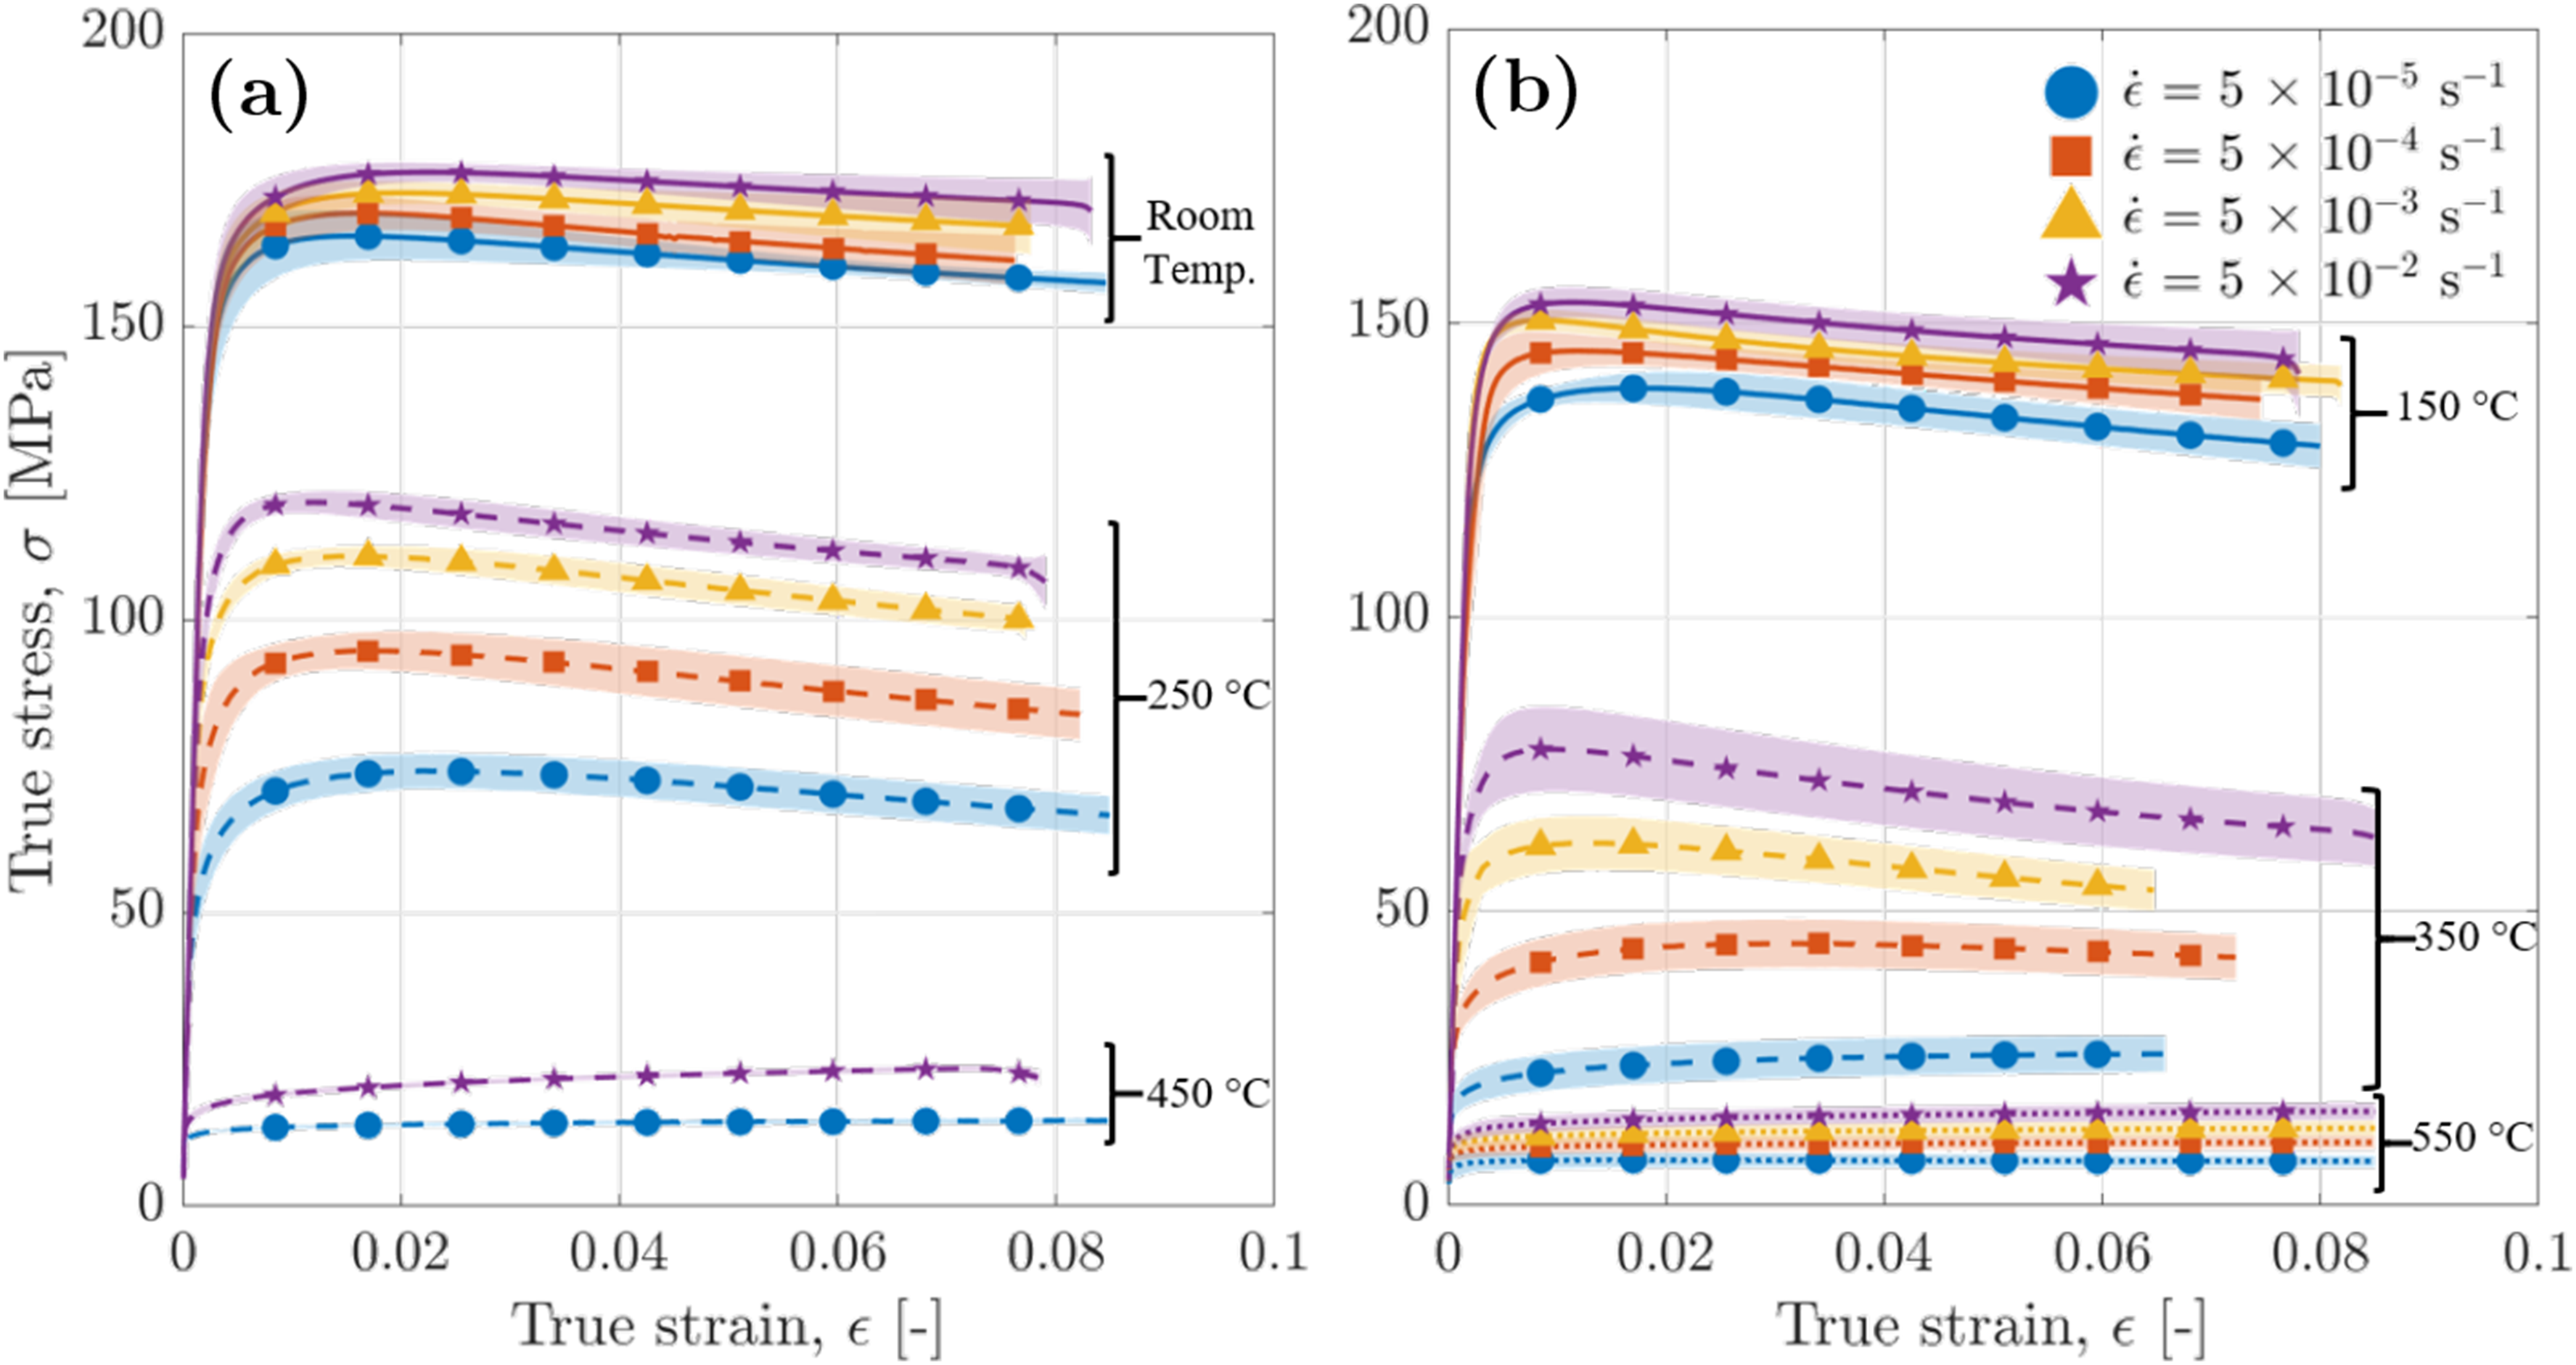
Mean true strain-true stress curves showing standard deviation (shaded areas) for various temperatures and strain rates. (a) Room temperature, 250°C, and 450°C. (b) 150°C, 350°C, and 550°C.
For each temperature, the strain-rate sensitivity parameter m was determined from the relationship between flow stress and strain rate at a fixed strain of 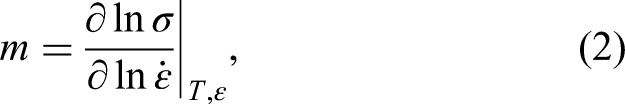

Strain rate sensitivity parameter m. (a) ln σ|
The mechanical softening rate (defined as Δσ/Δ
At 350°C, both the yield strength and the peak flow stress decrease further; the yield strength increases from 20 MPa to 72 MPa as the strain rate rises from 5 × 10 − 5 s − 1 to 5 × 10 − 2 s − 1. The strain-rate sensitivity reaches m = 0.19 at this temperature, with the large error bars indicating substantial variability, likely associated with the heightened sensitivity of the flow stress to strain rate under this condition. The hardening/softening sequence persists for strain rates of 5 × 10 − 4 s − 1, 5 × 10 − 3 s − 1, and 5 × 10 − 2 s − 1, with the transition shifting from ∼3% to ∼1% total strain as strain rate increases, and with mechanical softening rates of −0.54, −1.7, and −1.96 MPa/%, respectively. For a strain rate of 5 × 10 − 5 s − 1, softening is no longer observed; instead, the response shows a moderate hardening of ∼0.3 MPa/%, approaching near-perfect plastic behavior rather than significant hardening.
At 450°C and 550°C, the curves exhibit only mild strain hardening, which decreases slightly with strain and increases slightly with strain rate. At 450°C, the yield strength is 12.6 MPa and 16.7 MPa at 5 × 10 − 5 s − 1 and 5 × 10 − 2 s − 1, respectively, while at 550°C it increases from 7.3 MPa to 12.4 MPa over the same strain-rate range. Overall hardening remains very small, and the response approaches near-perfect plasticity. The strain-rate sensitivity decreases to m = 0.04 at 450°C and m = 0.08 at 550°C.
These results revealed a distinctive mechanical behavior at 350°C, characterized by a marked strain rate sensitivity and a modification of the mechanical behavior from solely hardening to hardening followed by softening as the strain rate increased from 5 × 10 − 5 s − 1 to 5 × 10 − 2 s − 1. This particular temperature proved crucial for understanding the overall mechanical behavior of AA3003 in the F-temper condition. To better understand the mechanisms operating at this temperature, the following section presents the results of complementary analyses.
Variation of the compression behavior at 350°C with the strain rate and strain
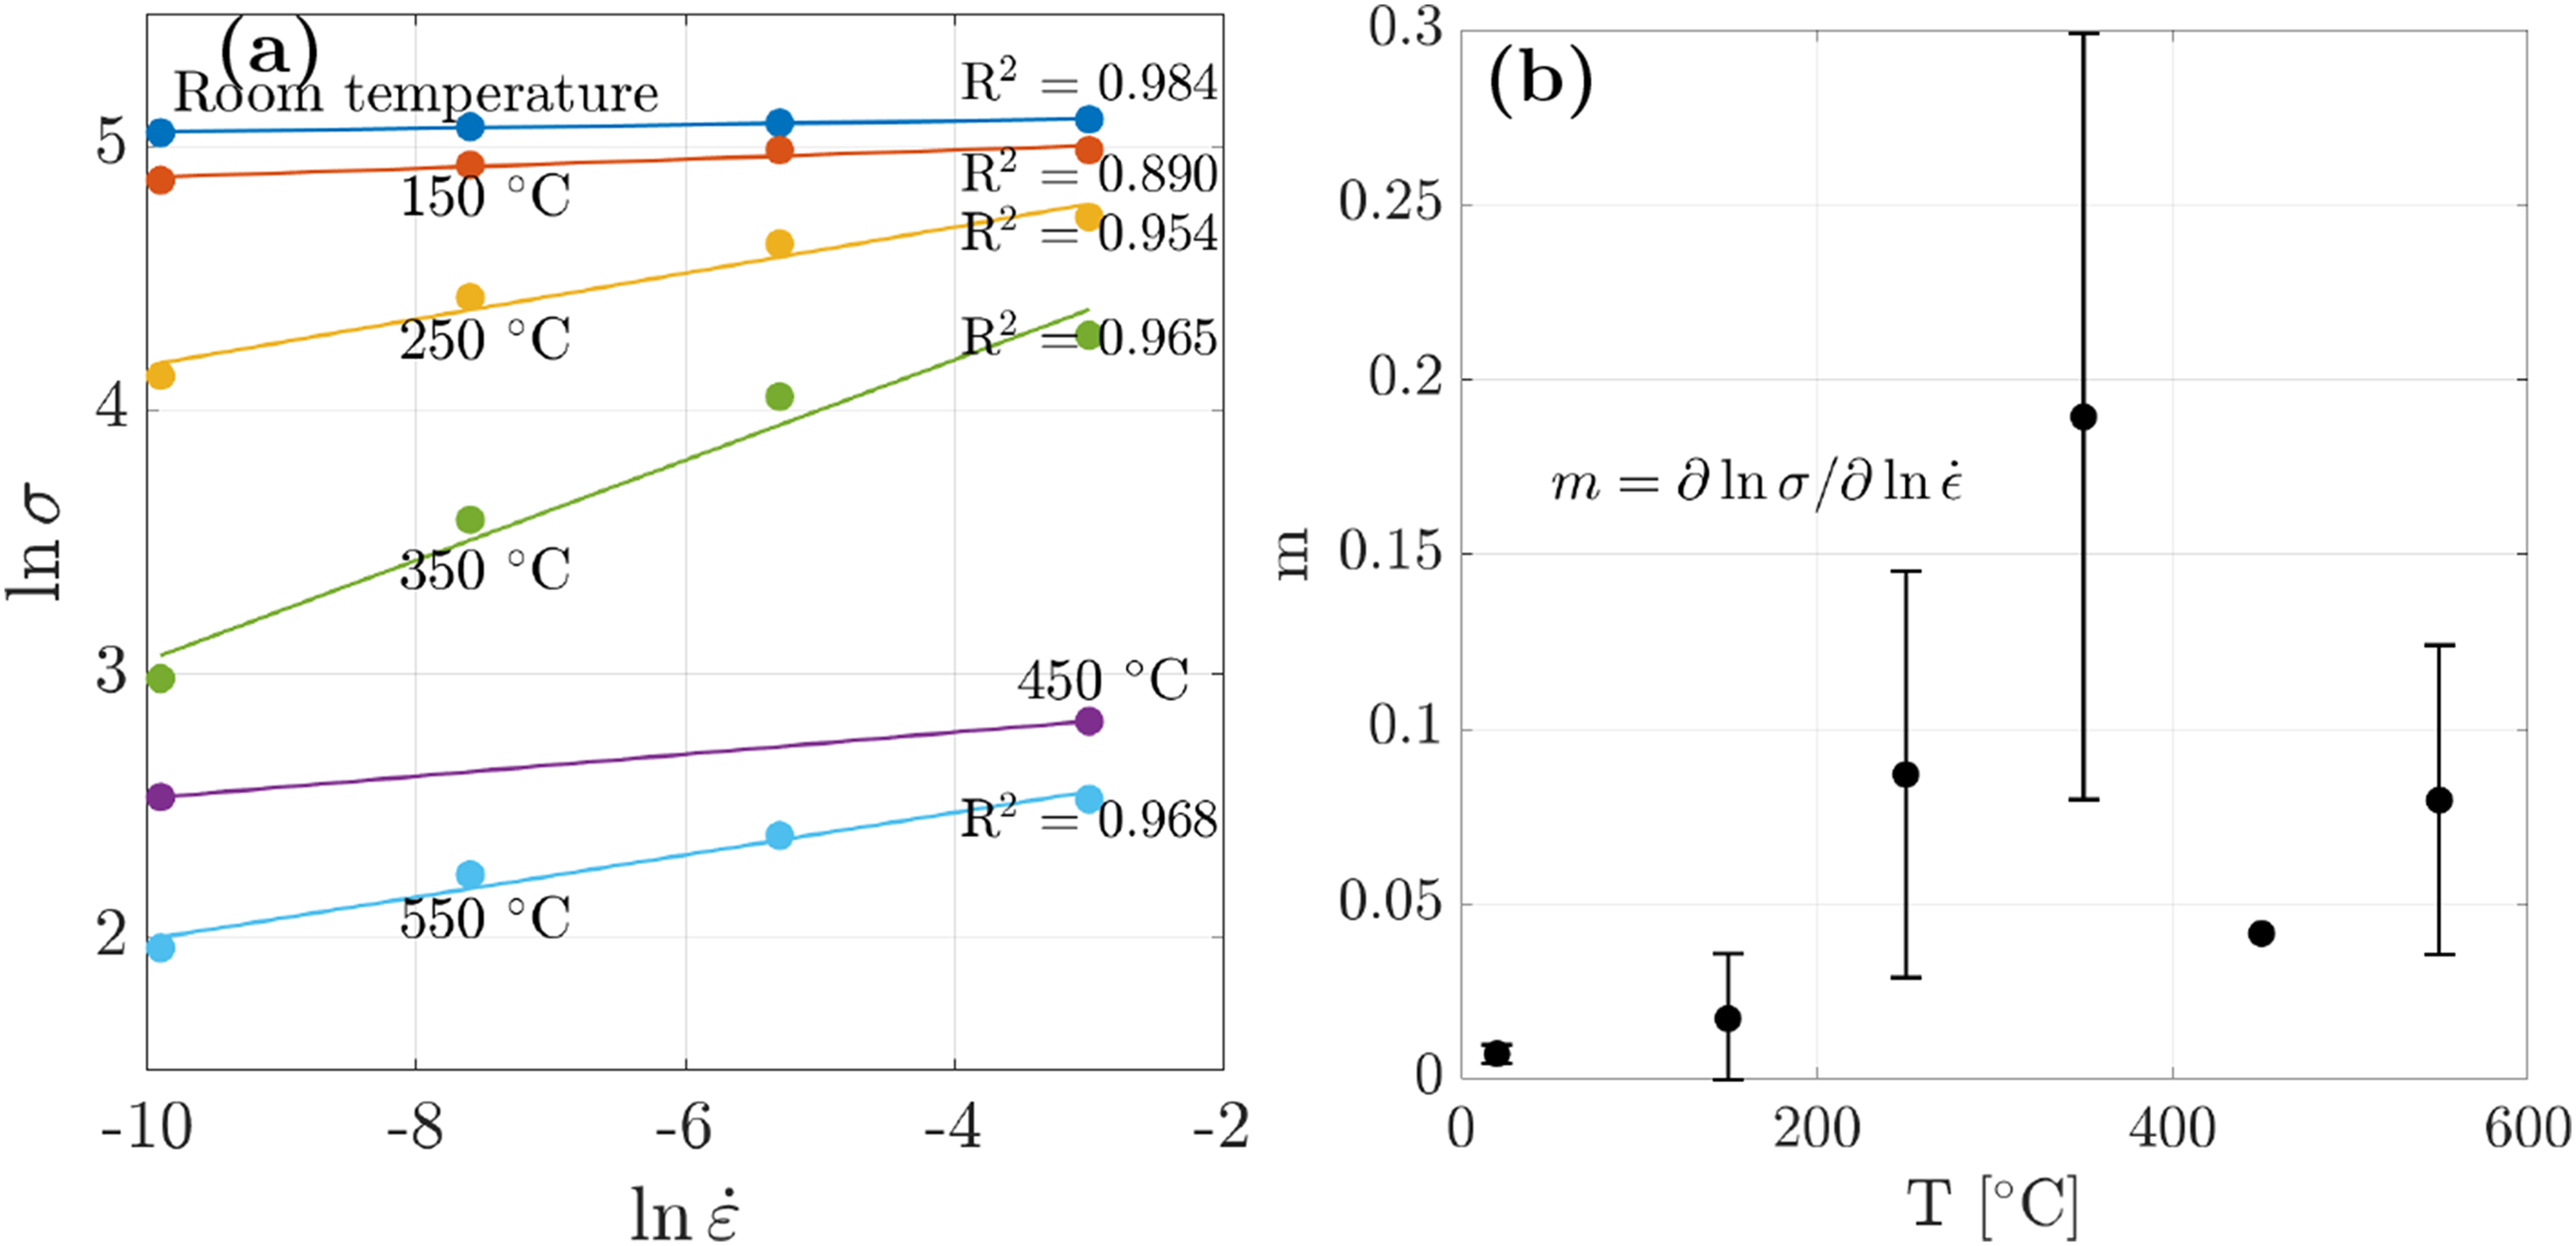
Supplementary tests at 350°C were performed at both 5 × 10 − 2 s − 1 and 5 × 10 − 5 s − 1 strain-rates. Compression curves obtained up to total strains of ∼2%, ∼10%, and ∼50% were denoted h1, h2, and h3 for the high strain-rate condition, and l1, l2, and l3 for the low strain-rate condition, respectively. These deformed samples, together with the heat-treated controls HT1, HT2, and HT3, provide a basis to compare static (HT1–HT3) and dynamic (h1–h3, l1–l3) recovery and recrystallization processes at 350°C.
The stress-strain curves at 350°C (Figure 5) confirm the behavior identified in Figure 3(b) for AA3003 in the F-temper condition: at the high strain rate, the response is characterized by strain hardening followed by softening, whereas at the low strain rate it shows mild hardening approaching a steady-flow regime. For both strain rates, an approximately stationary flow stress is reached by ∼50% strain. Apart from one test at the higher strain rate, the stress–strain curves are reproducible; the observed discrepancy is attributed to microstructural inhomogeneities across the bar cross-section, as documented in the Supplemental material C.
True strain - true stress curves for tests performed at 350°C, with strain rates of 5 × 10⁻² s−1:
A parameter that is not directly visible in the stress–strain curves is the deformation time. In the F-temper condition, the prior drawing process introduces a highly deformed and thus relatively unstable microstructure. Observations made on the microstructure evolution of samples HT1, HT2 and HT3 allowed to characterize the kinetics of SRX. The EBSD characterization of the deformed samples, h1–h3 and l1–l3, was carried to study the dynamic restorative mechanisms taking place at 350°C.
Microstructural analyses of samples deformed at 350°C
Microstructural analyses of deformed samples at the strain rate 5 × 10⁻² s−1
The EBSD maps along the drawing direction (DD) for samples HT1, h1, h2, and h3 are presented in Figure 6. Because HT1 experienced the same thermal history as the compressed specimens up to the onset of loading, it was used as the reference state for comparison with the microstructural evolution of the deformed samples. As shown in the Supplemental material D, static recrystallization is very limited after 10 min at 350°C. Moreover, aside from limited static recovery—evidenced by a reduction in very low-angle misorientations (θ < 2°)—the microstructure of HT1 remains close to the as-fabricated state presented in Figure 2(a) and detailed in the Supplemental material C. The microstructure is dominated by elongated grains grouped in regions of similar crystallographic orientation, with elongated subgrains visible within some grains. Since the HT1 map was acquired at the bar center, this elongated morphology is consistent with the principal strain imposed during drawing.

EBSD maps of the samples loaded at
A detailed inspection of Figure 6(a) shows that the crystallographic orientations of most grains are close to either ⟨111⟩ ∥ DD (55%) or ⟨001⟩ ∥ DD (24%), with intermediate orientations between these two components. This predominance is largely maintained in the compressed samples (Figures 6(b)–(d)), although the relative fractions evolve. In addition, a mild but sustained increase in orientations close to ⟨101⟩ ∥ DD is observed from h1 to h3. As compression proceeds in the direction perpendicular to DD, the grain and subgrain aspect ratios decrease, and the grains become progressively more equiaxed.
Microstructural analyses of deformed samples at the strain rate 5 × 10⁻⁵ s−1
Similar to the high strain-rate series, EBSD orientation maps along the DD for the low strain-rate samples l1, l2, and l3 (

Evolution of microstructure for the samples loaded at
In Figure 7A, the predominant orientations are ⟨111⟩ ∥ DD together with several grains oriented close to ⟨001⟩ ∥ DD. Compared to Figure 7(a), Figure 7(b) (sample deformed to 1.24% total strain) exhibits a higher fraction of grains with orientations close to ⟨111⟩ ∥ DD; this predominance, although evolving, remains apparent in Figure 7(c). In Figure 7(d) (sample deformed to 46.4%), a larger area fraction of orientations close to ⟨101⟩ ∥ DD is observed compared with the earlier states, together with a higher number of grains surrounded by neighbors of heterogeneous orientations. Regarding grain-shape evolution, the microstructure follows the same general trend as in the high strain-rate tests, namely a progressive increase in the fraction of grains with aspect ratios approaching unity. However, this tendency is less pronounced at low strain rate than at high strain rate.
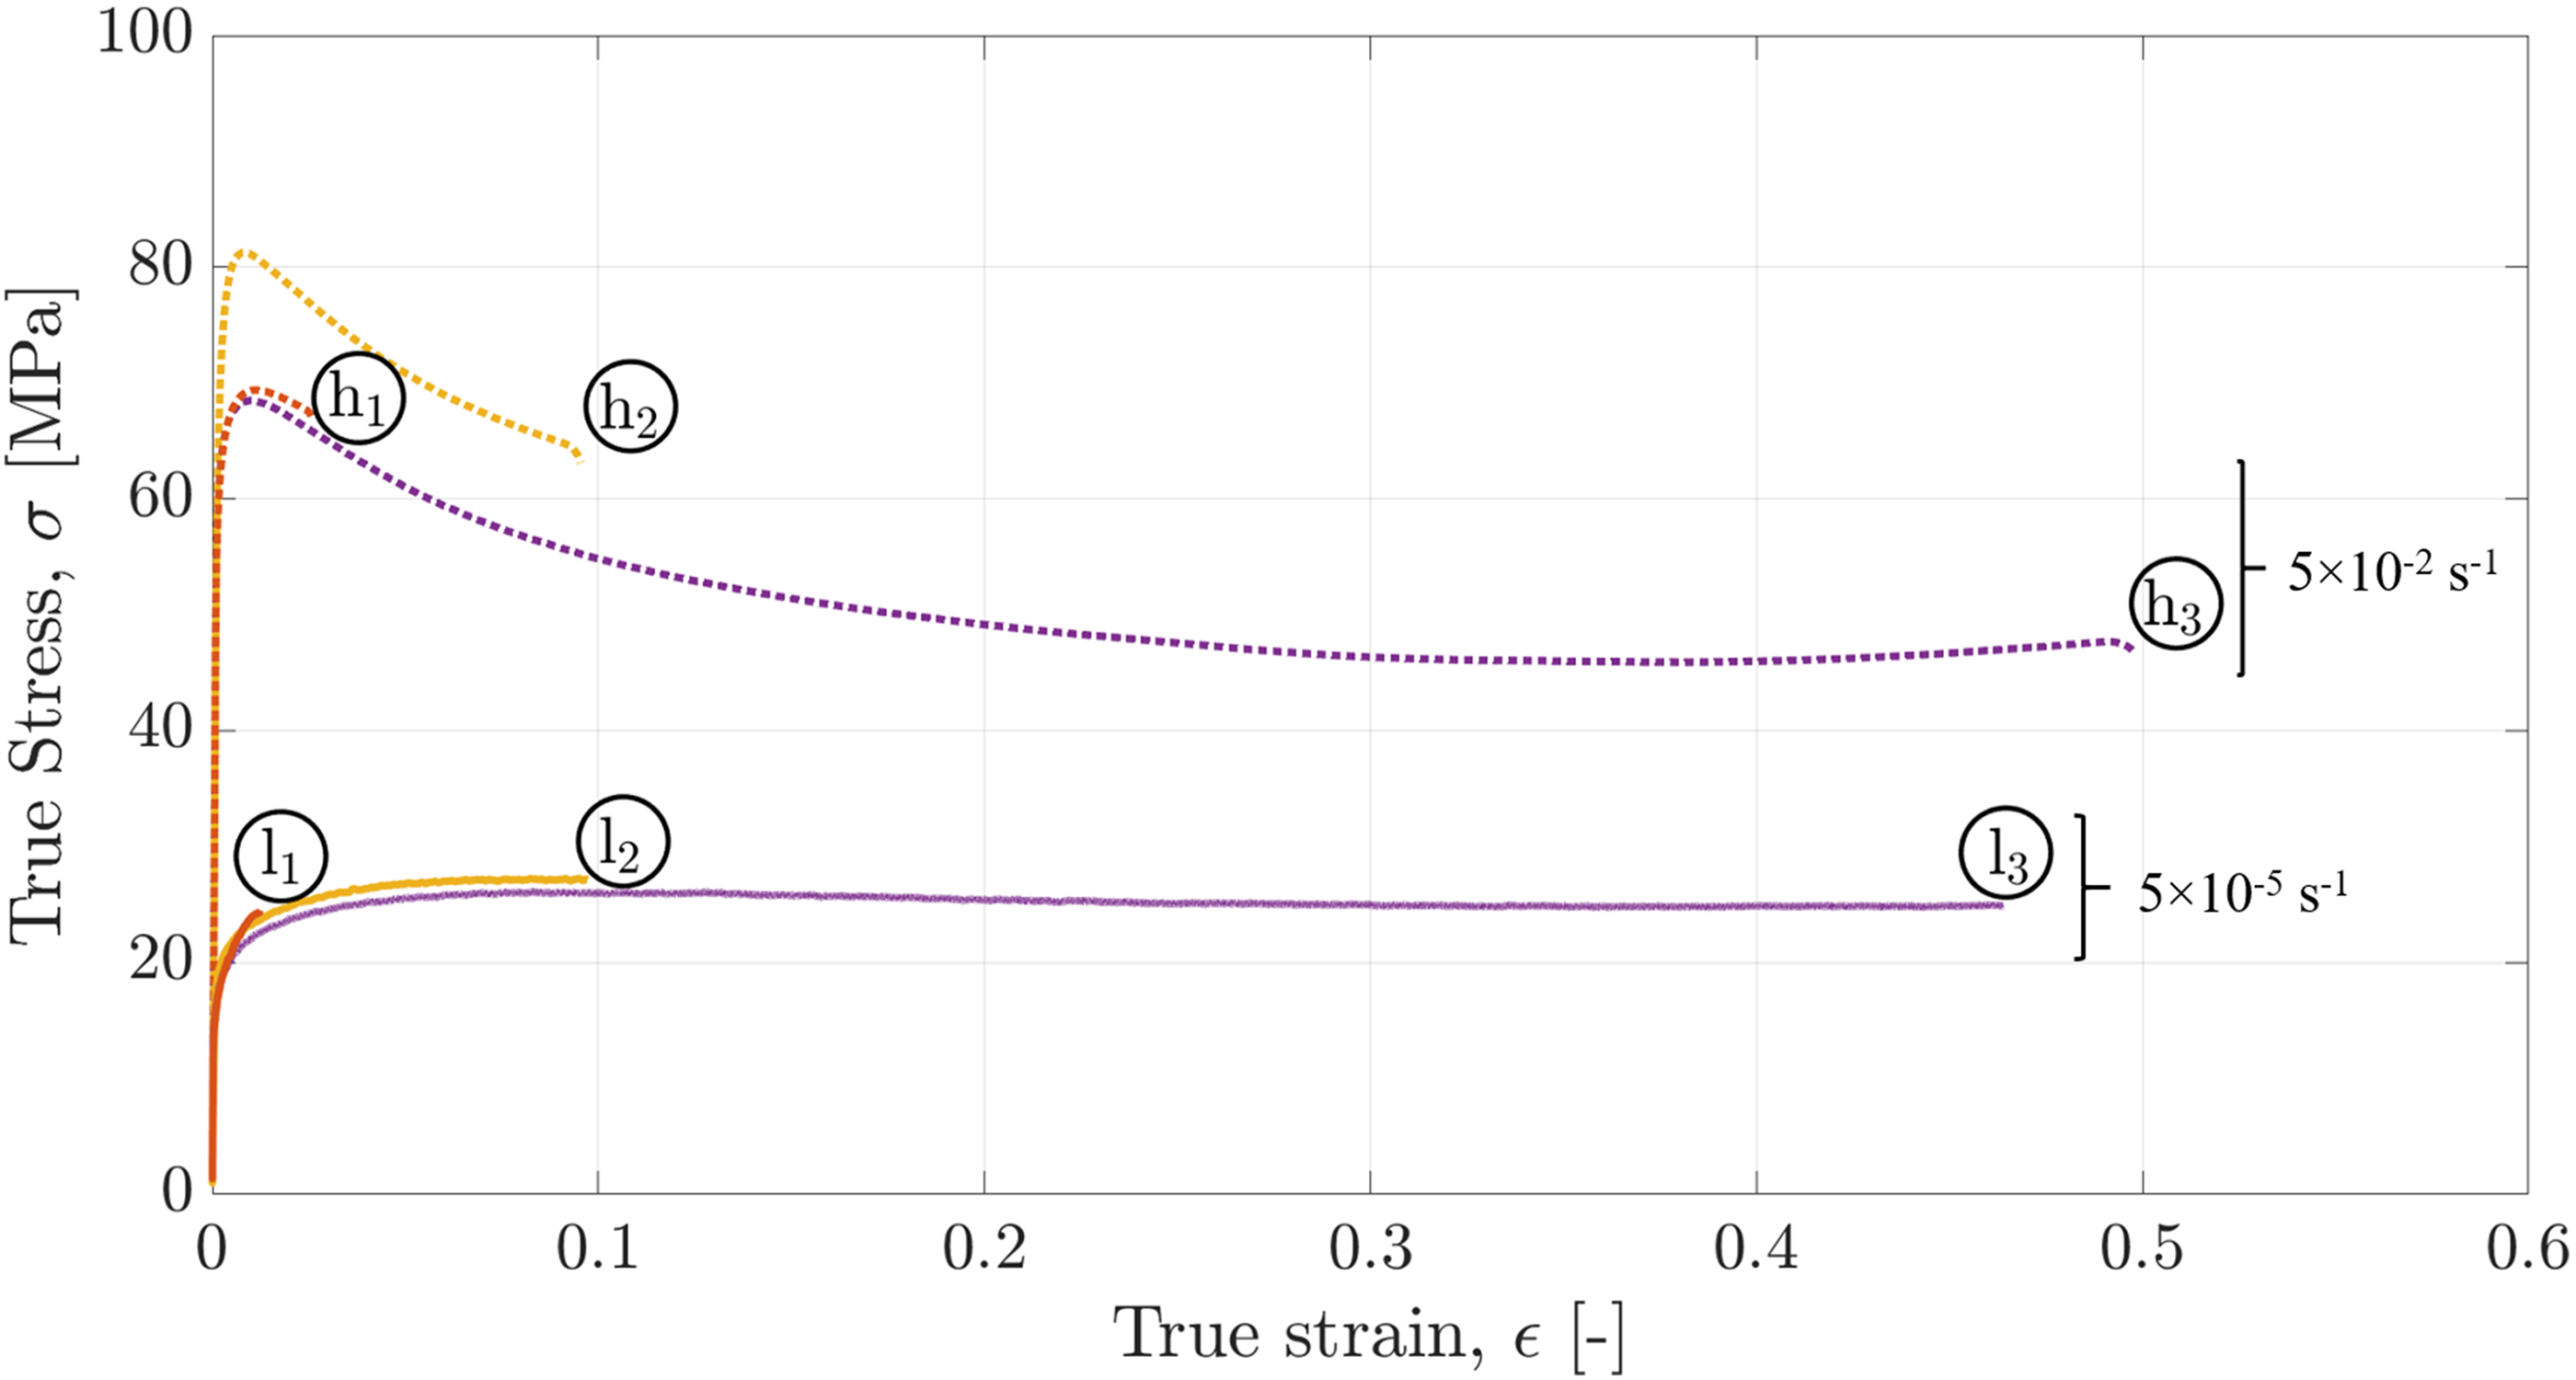
Grain-size distributions obtained from EBSD data are often represented as histograms. However, histogram shape depends on the selected bin width, which can complicate comparisons between conditions. To reduce this dependence, probability density functions (PDFs), also referred to as normalized density functions, 57 were used here to represent the grain-size distributions. In Figure 8(a), PDF of the maximum diameter of the adjusted ellipses (MDAE) were used to describe the evolution of grain size. The PDF peaks for samples M2 (as-fabricated), HT1 (held for 10 min at 350°C), and h1 (compressed to 1.24% strain at 350°C) were similar: 0.036, 0.045, and 0.044, occurring at MDAE values of 7.76, 8.2, and 5.03 µm, respectively. The PDF of h2 then showed a higher peak and a shift toward smaller MDAE, with a peak value of 0.07 at 4.83 µm. The highest peak was obtained for h3, with 0.122 at 4.4 µm.
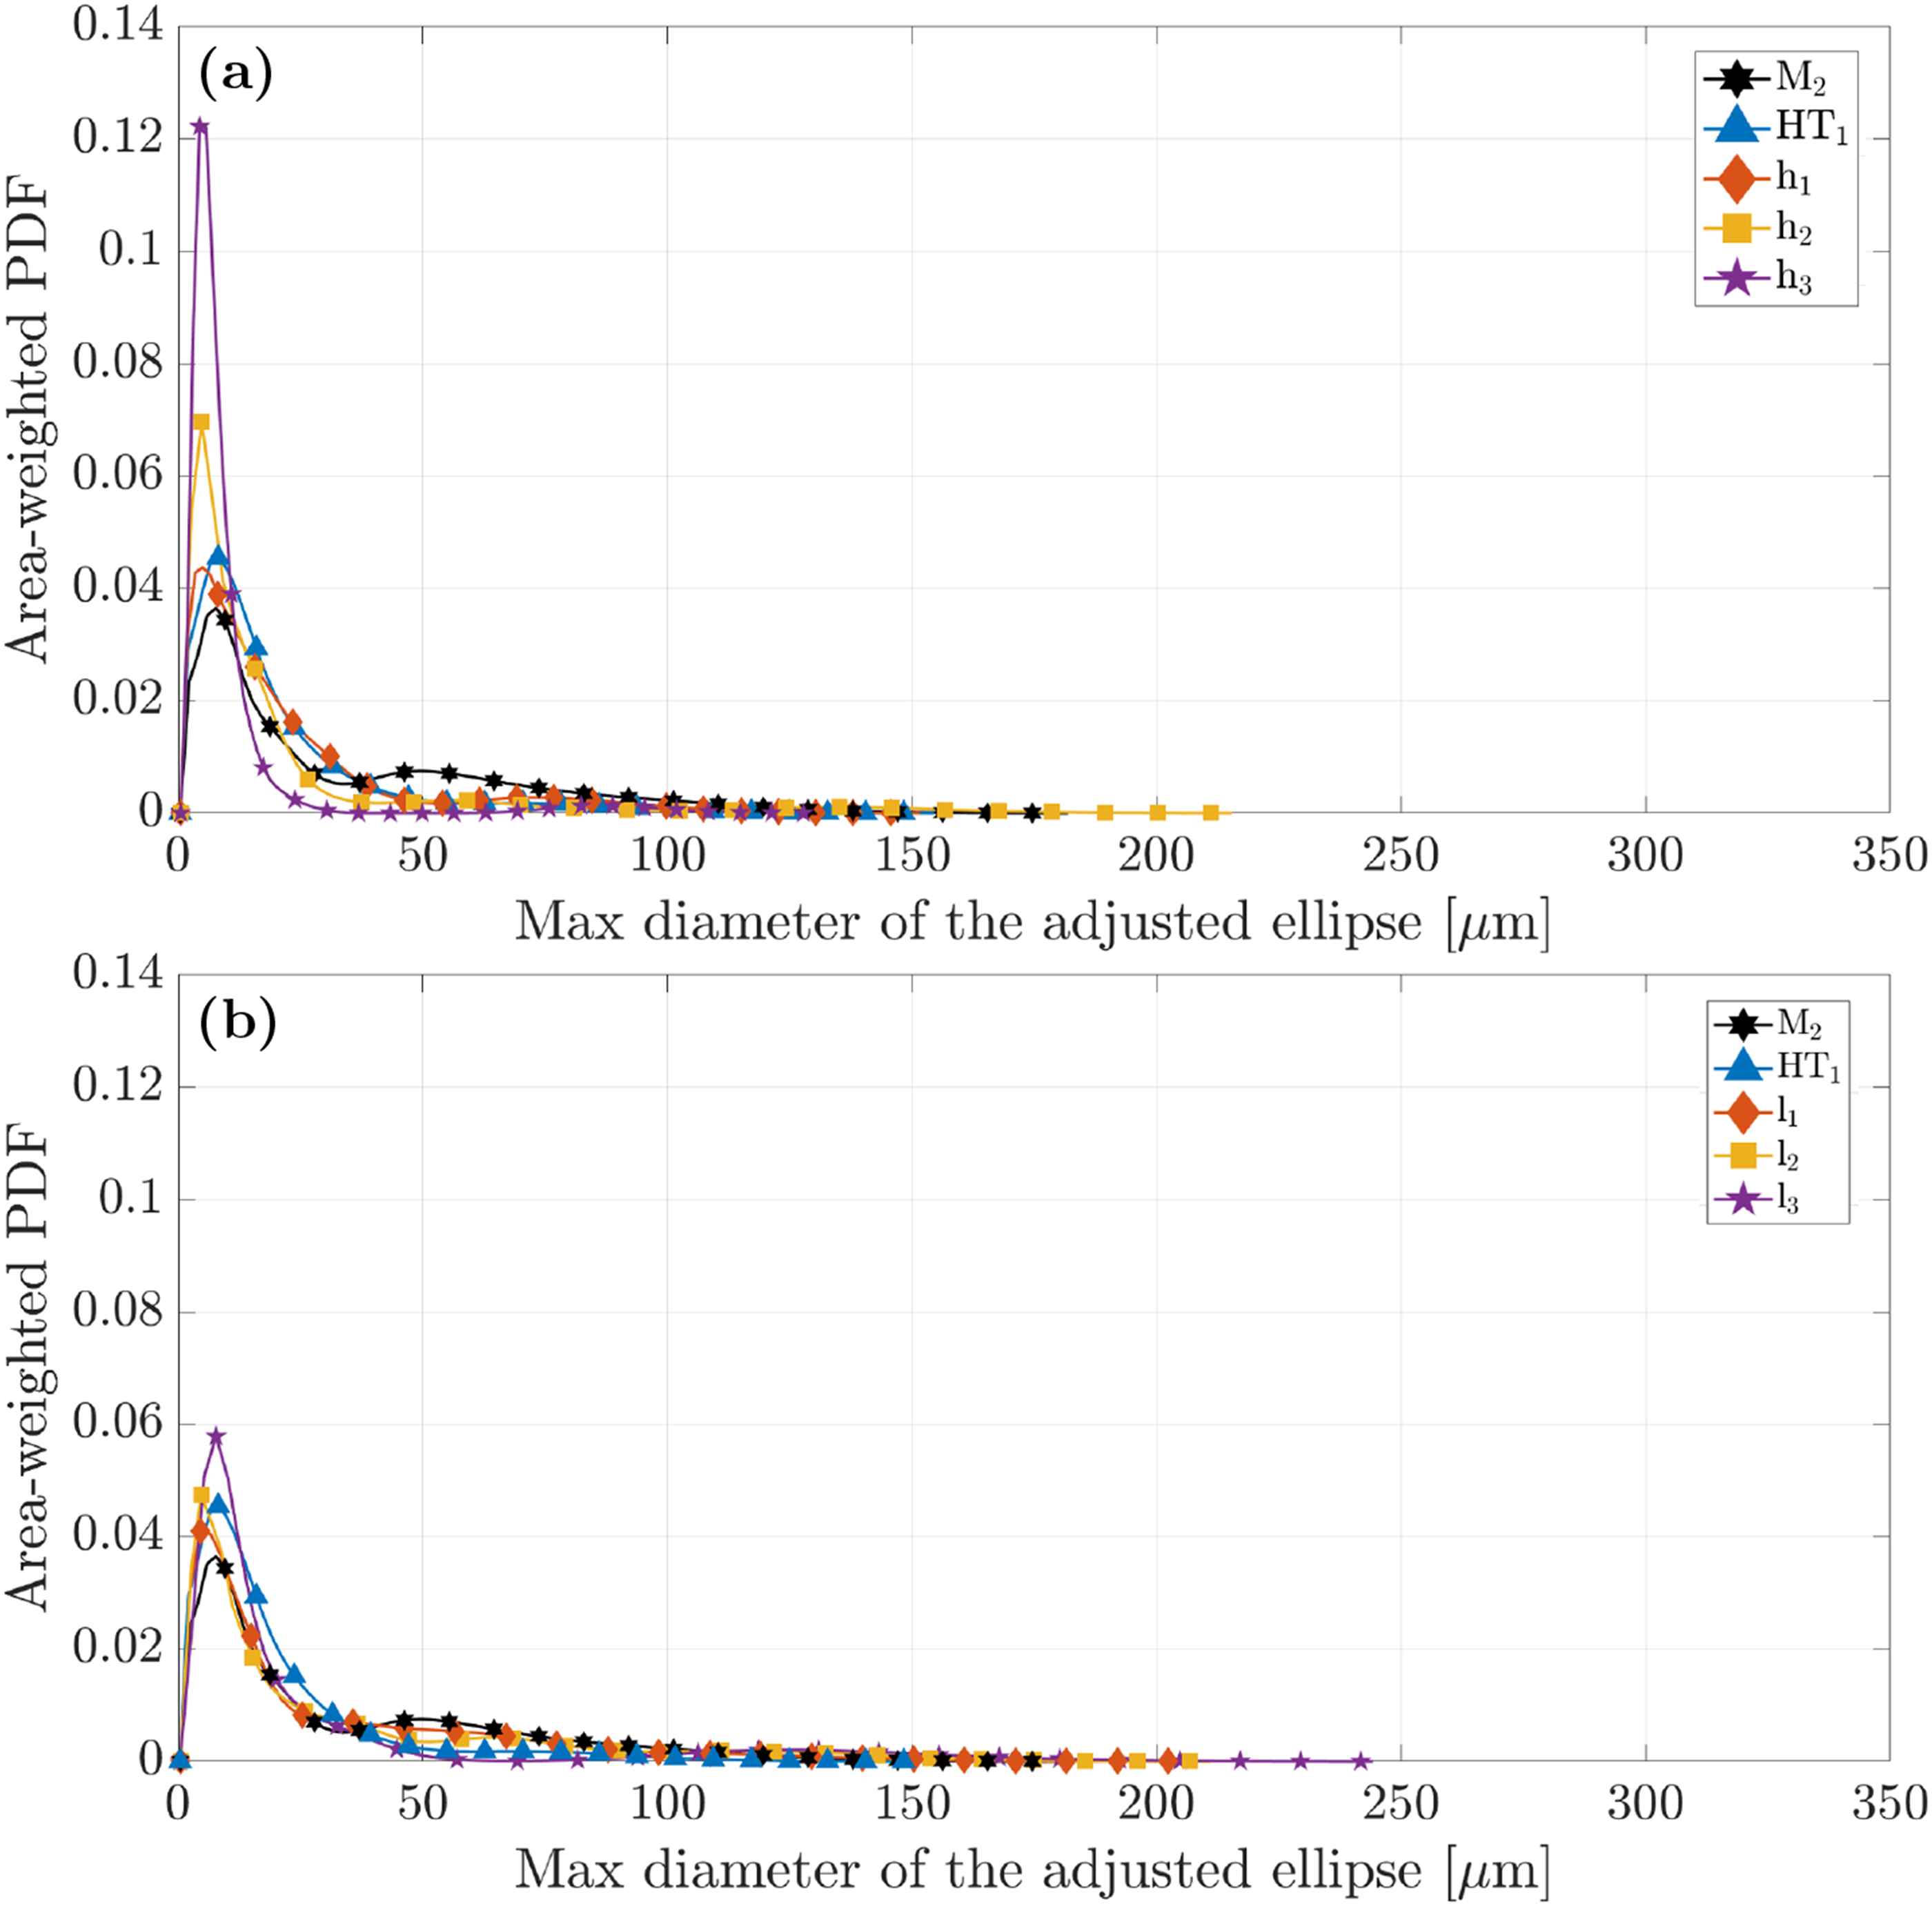
Distribution of the maximum diameter of the adjusted ellipse (MDAE) for tests performed with strain rates (a) 5 × 10⁻² s−1 and (b) 5 × 10⁻⁵ s−1.
In Figure 8(b), the same analysis was presented for samples M2, HT1, l1, l2, and l3. The peak values for l1 and l2 remained close to those of M2 and HT1, reaching 0.041 and 0.047 at 4.6 and 4.71 µm, respectively. The maximum peak value in this series was observed for l3, with 0.058 at 7.8 µm. Overall, these results indicated a faster grain refinement at high strain rate (5 × 10 − 2 s − 1), particularly when comparing h2 with l2 and h3 with l3.
A direct comparison of h3 and l3 further highlights differences in the grain-size distributions: in addition to the ∼50% difference in peak magnitude, the full width at half maximum is 6.167 µm for h3 and 11.3 µm for l3. The upper limit of the distribution is 129 µm for h3, whereas it extends to 244 µm for l3. These metrics reflect a broader grain-size distribution (i.e., greater heterogeneity) for the low strain-rate condition compared with the high strain-rate condition.
Crystallographic texture analyses of samples deformed at 350°C
Figure 9(a) presents the inverse pole figures (IPFs) of the as-fabricated sample at positions M1 and M2, illustrating the texture gradient induced by drawing along the bar width. Figures 9(b)–(h) present the corresponding IPFs for samples HT1, h1, l1, h2, l2, h3, and l3. Each plot shows the alignment intensity of the principal FCC crystallographic directions, ⟨111⟩, ⟨101⟩, and ⟨001⟩, relative to the specimen directions DD, TD, and ND (the latter corresponding to the compression direction, CD). Figure 9(a) indicated that, in position M1, ⟨111⟩ and ⟨001⟩ were the most strongly aligned with the drawing direction, with peak intensities of approximately 9.28 and 4.1, respectively. Position M2 exhibited less intense fiber textures with only mild intensities of orientations ⟨111⟩ closely aligned with the DD, with a peak intensity of 5.18. This is consistent with the well-established observation that uniaxial processes such as wire drawing or extrusion produce double-fiber textures in FCC metals, characterized with ⟨111⟩ and ⟨100⟩ orientations parallel to the drawing direction, with relative intensities that vary across the cross-section. 53 In high-SFE materials such as Al (SFE ≈ 166 mJ m − 2), the ⟨100⟩ component is typically weaker than the ⟨111⟩ component. Compared with position M1, HT1 whose orientations are presented in Figure 9(b), showed only a slight change in the intensities after holding for 10 min at 350°C, consistent with the limited microstructural evolution observed under this thermal condition (Supplemental material D).
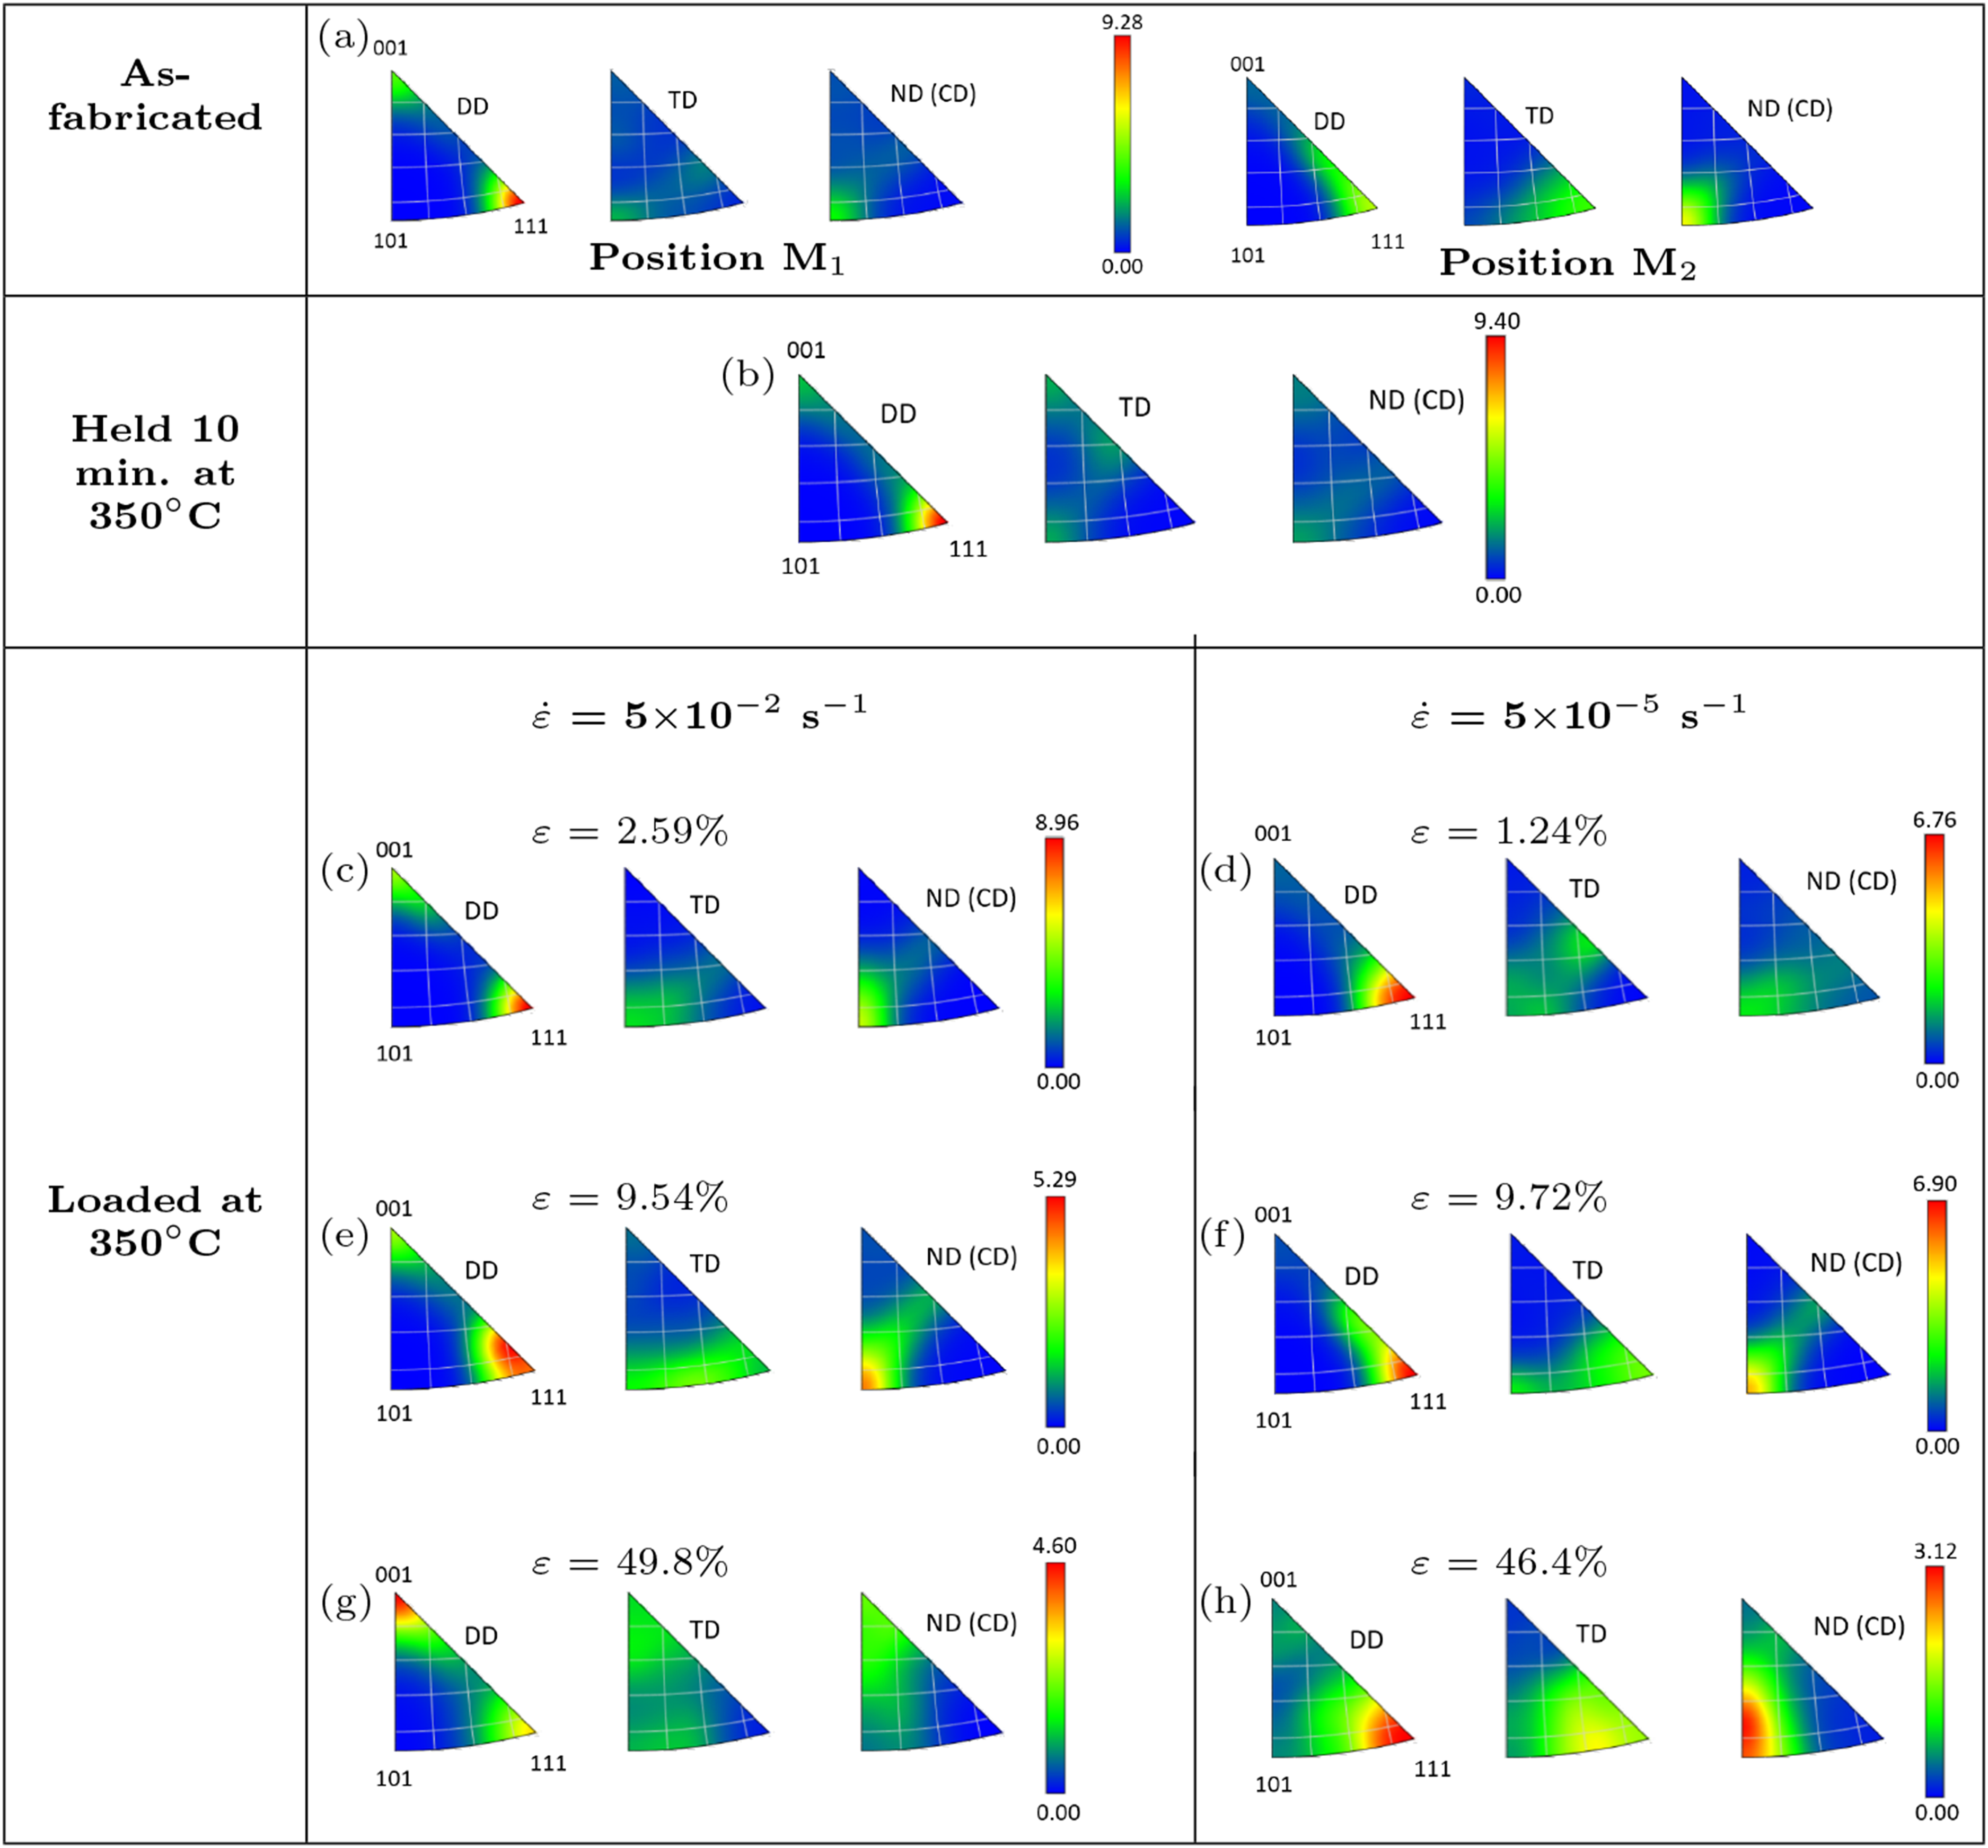
Inverse pole figures of (a) positions M1 and M2 in the as-fabricated sample, (b) sample HT1 (held for 10 min at 350°C), and samples tested at 350°C: (c)–(h) samples compressed at 350°C.
Figure 9(c) (sample h1) showed that the double fiber texture along the DD was largely retained relative to Figure 9(b), with only a slight decrease in the maximum intensity and a modest increase of ⟨101⟩ poles along the compression direction. Figure 9(d) (sample l1) exhibited a similar tendency, but with more dispersed poles and a lower maximum intensity. At the intermediate strain level, h2 and l2 still showed broadly comparable crystallographic orientation distributions in TD and ND (CD), whereas along DD the contrast became clearer: h2 retained a marked double fiber, while l2 was more strongly dominated by the ⟨111⟩ component.
At the highest strain levels, the two strain-rate routes exhibited distinct texture evolutions. For h3 (Figure 9(g)), the double fiber texture aligned with the original drawing direction was largely retained, although with altered proportions, as the ⟨001⟩ component became approximately twice as intense as the ⟨111⟩ component. In the transverse and normal (compression) directions, the poles shifted from regions near ⟨101⟩ and ⟨111⟩ toward higher intensities closer to ⟨001⟩, with some spread toward ⟨101⟩. This behavior is congruent with the texture evolution commonly associated with CDRX-type pathways, in which the inherited deformation texture remains largely preserved. 53 In the present case, the already-deformed initial state, containing a pre-existing cell/subgrain structure, likely contributed to the relative stability of the inherited drawing texture during subsequent compression.
By contrast, l3 (Figure 9(h)) showed a more pronounced departure from the initial drawing texture. Along the DD, the distribution remained closer to l1 and l2, with a stronger ⟨111⟩ component, while the TD and the ND (CD) IPFs continued the shifts toward ⟨111⟩ and ⟨101⟩ already observed in l2. Relative to h3, this condition displayed a much stronger modification of the initial texture, together with the development of a pronounced ⟨101⟩ ∥ CD peak. Overall, the IPF intensities decreased with strain for both strain-rate conditions.
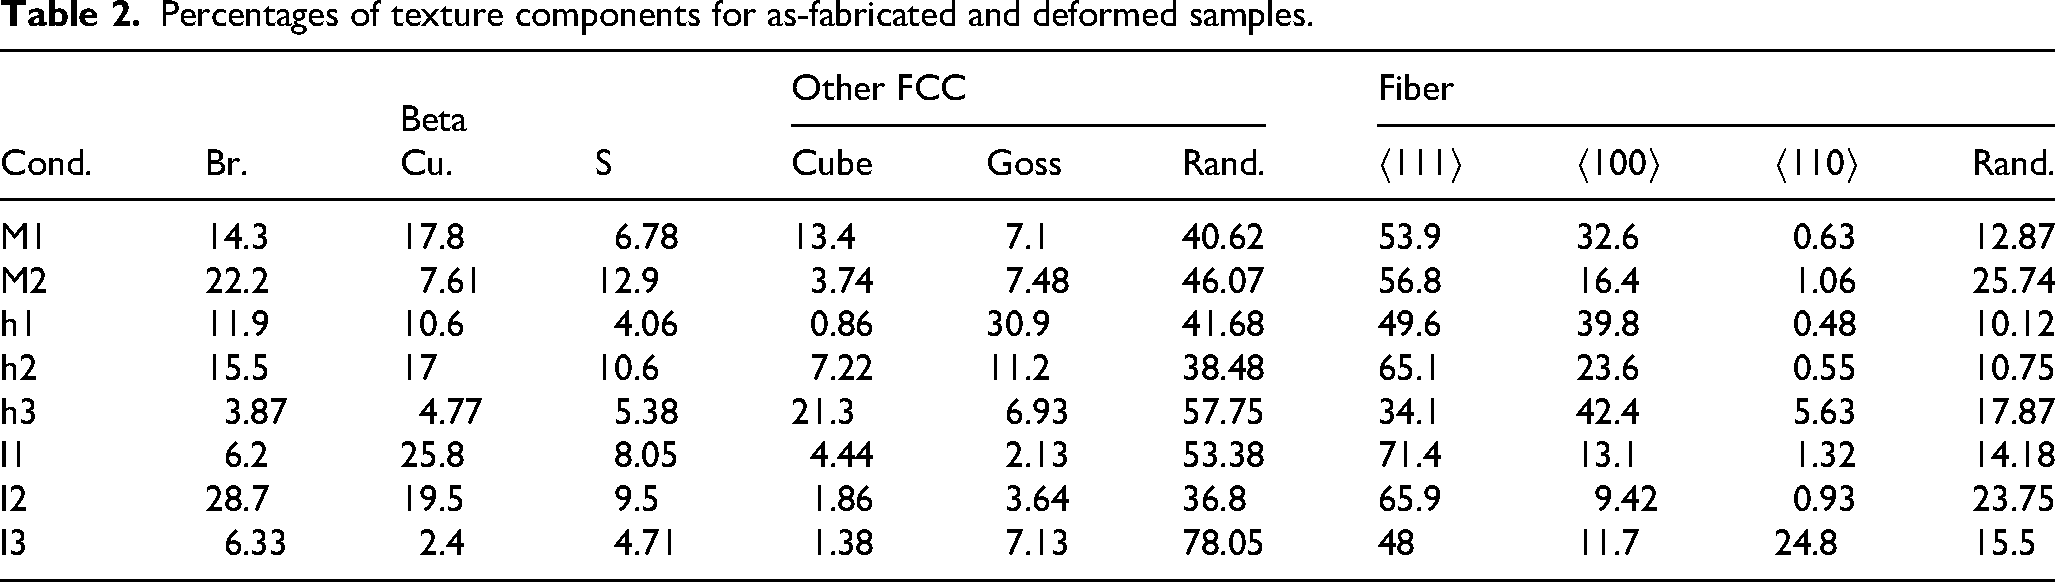
These visual trends are supported by the relative fractions of the DD-aligned texture components reported in Table 2. In the high strain-rate series, ⟨111⟩ ∥ DD and ⟨001⟩ ∥ DD remained dominant, while ⟨110⟩ ∥ DD stayed minor, reaching only about 5% in h3. In the low strain-rate series, by contrast, the ⟨001⟩ ∥ DD component had already decreased to about half of its HT1 value at l1 and remained at a similar level thereafter, whereas ⟨110⟩ ∥ DD increased sharply between l2 and l3, reaching 23%.
Percentages of texture components for as-fabricated and deformed samples.
The discussed texture differences become most apparent at the highest strain level (∼50%) and are consistent with a predominantly CDRX-type pathway in the high strain-rate route and a stronger contribution of boundary-migration-assisted mechanisms in the low strain-rate route. To assess whether additional microstructural factors may also contribute to this contrast, the role of second-phase particles was examined.
Analyses of the second-phase particles
In AA3003, the relevant second-phase features are coarse intermetallic constituent particles and fine dispersoids. Coarse particles can promote particle-stimulated nucleation (PSN), whereas fine dispersoids can retard boundary migration through Zener pinning. 53 In this alloy, the coarse constituent particles inherited from casting are commonly reported as Al6(Mn,Fe) and α-Al(Mn,Fe)Si, whereas subsequent thermal treatments promote the precipitation of fine Mn-rich dispersoids, typically in the micrometer size range, often reported as α-Al(Mn,Fe)Si.16,38,39,58,59
To evaluate possible particle evolution and estimate its influence on the mechanical response, back-scattered electron detector (BSED) images were acquired for h3 (highest strain in the high strain-rate series), l3 (highest strain in the low strain-rate series), and HT3 (longest holding time at 350°C annealing), the latter being thermally comparable to the low strain-rate route. Particle size and distribution were quantified using ImageJ. The corresponding images are shown in Figures 10(a)–(c), and the probability density functions of particle size (major axis of fitted ellipses) are plotted in Figure 10(d). The distribution peaks are located at 0.10 µm, 0.07 µm, and 0.13 µm for h3, HT3, and l3, respectively.
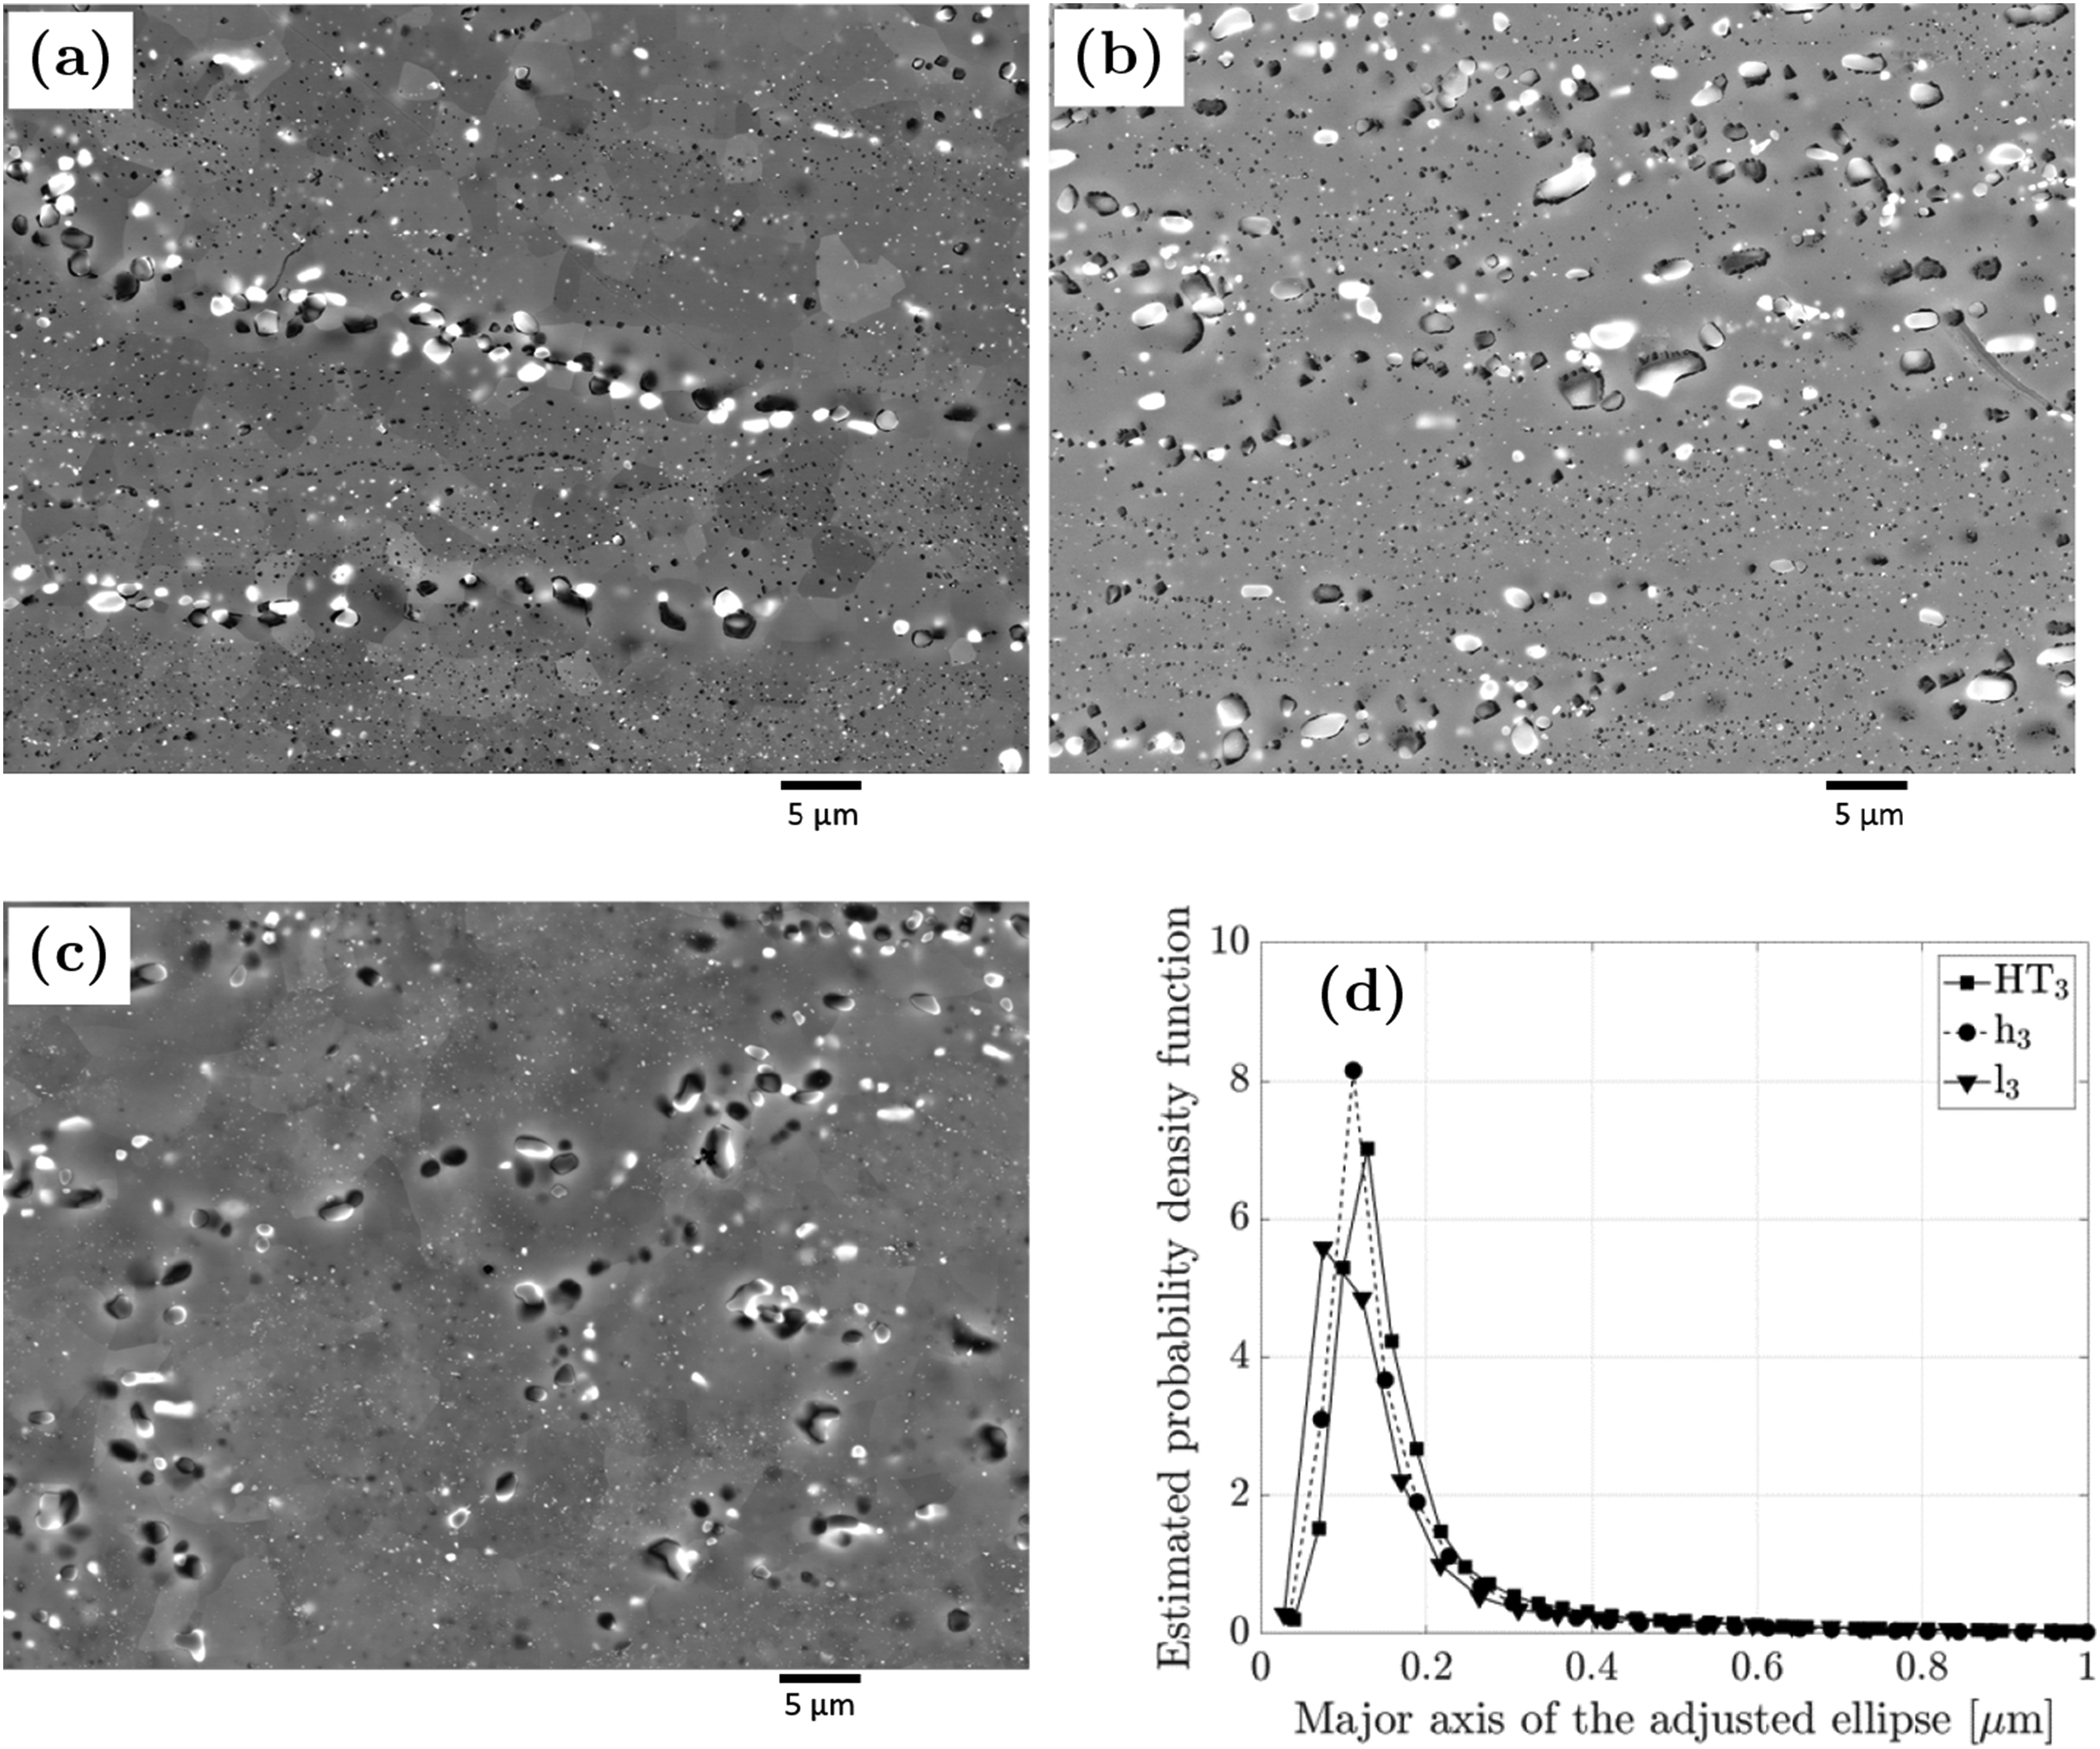
BSED images of samples (a) h3, (b) HT3, and (c) l3. (d) probability density functions of particle size.
Visual inspection did not reveal major changes in particle morphology, characteristic size, or surface fraction across the three conditions. In all cases, two particle populations were observed, namely coarse constituent particles and fine dispersoids. A qualitative difference is nevertheless apparent between Figures 10(a) and 10(c), which correspond to similar macroscopic strains (∼0.5) imposed at markedly different strain rates. In h3, the coarse constituents remain apparently aligned with the inherited drawing direction, whereas this alignment is less evident in l3. Since the final strain is similar in both conditions, this difference is more likely related to the longer deformation time at low strain rate than to strain level alone.
The calculated precipitate surface fractions were 8.16% in HT3, 6.21% in h3, and 6.83% in l3, with primary particles accounting for 1.36%, 2.24%, and 2.33%, and dispersoids for 6.8%, 3.97%, and 4.5%, respectively. An ANOVA performed on the particle populations yielded an F-value of 8.33 and a p-value of 0.00024, indicating statistically significant differences between the distributions at the 99% confidence level. Nevertheless, these differences are mechanistically minor, since the variations in mean particle size and area fraction remain small compared with the pronounced differences in mechanical response between the high and low strain-rate tests. The particle populations are therefore unlikely to be the primary origin of the observed mechanical contrast. This interpretation is consistent with the observations of Bernardi et al. for AA3003, who reported that constituent intermetallic phases remain virtually unchanged up to annealing temperatures of 570°C. 37
Subregions of the EBSD scans for samples h3 and l3 were further examined to identify recrystallized grains adjacent to coarse second-phase particles, as expected for PSN. Figures 11(a)–(c) show representative orientation and GOS (grain orientation spread) maps for sample h3, and Figures 12(a) and 12(b) show analogous features for sample l3. In both conditions, recrystallized grains are observed adjacent to coarse particles. These observations suggest that, although the global particle populations are unlikely to control the macroscopic mechanical contrast, coarse second-phase particles can still promote PSN locally in both strain-rate routes.
(a) EBSD maps of a subregion of sample h3 showing the three types of boundaries defined, (b) subregion of map (a) showing the coarse precipitates and the recrystallized regions adjacent to them, and (c) GOS map of the same subregion as in (b) showing the recrystallized grains.
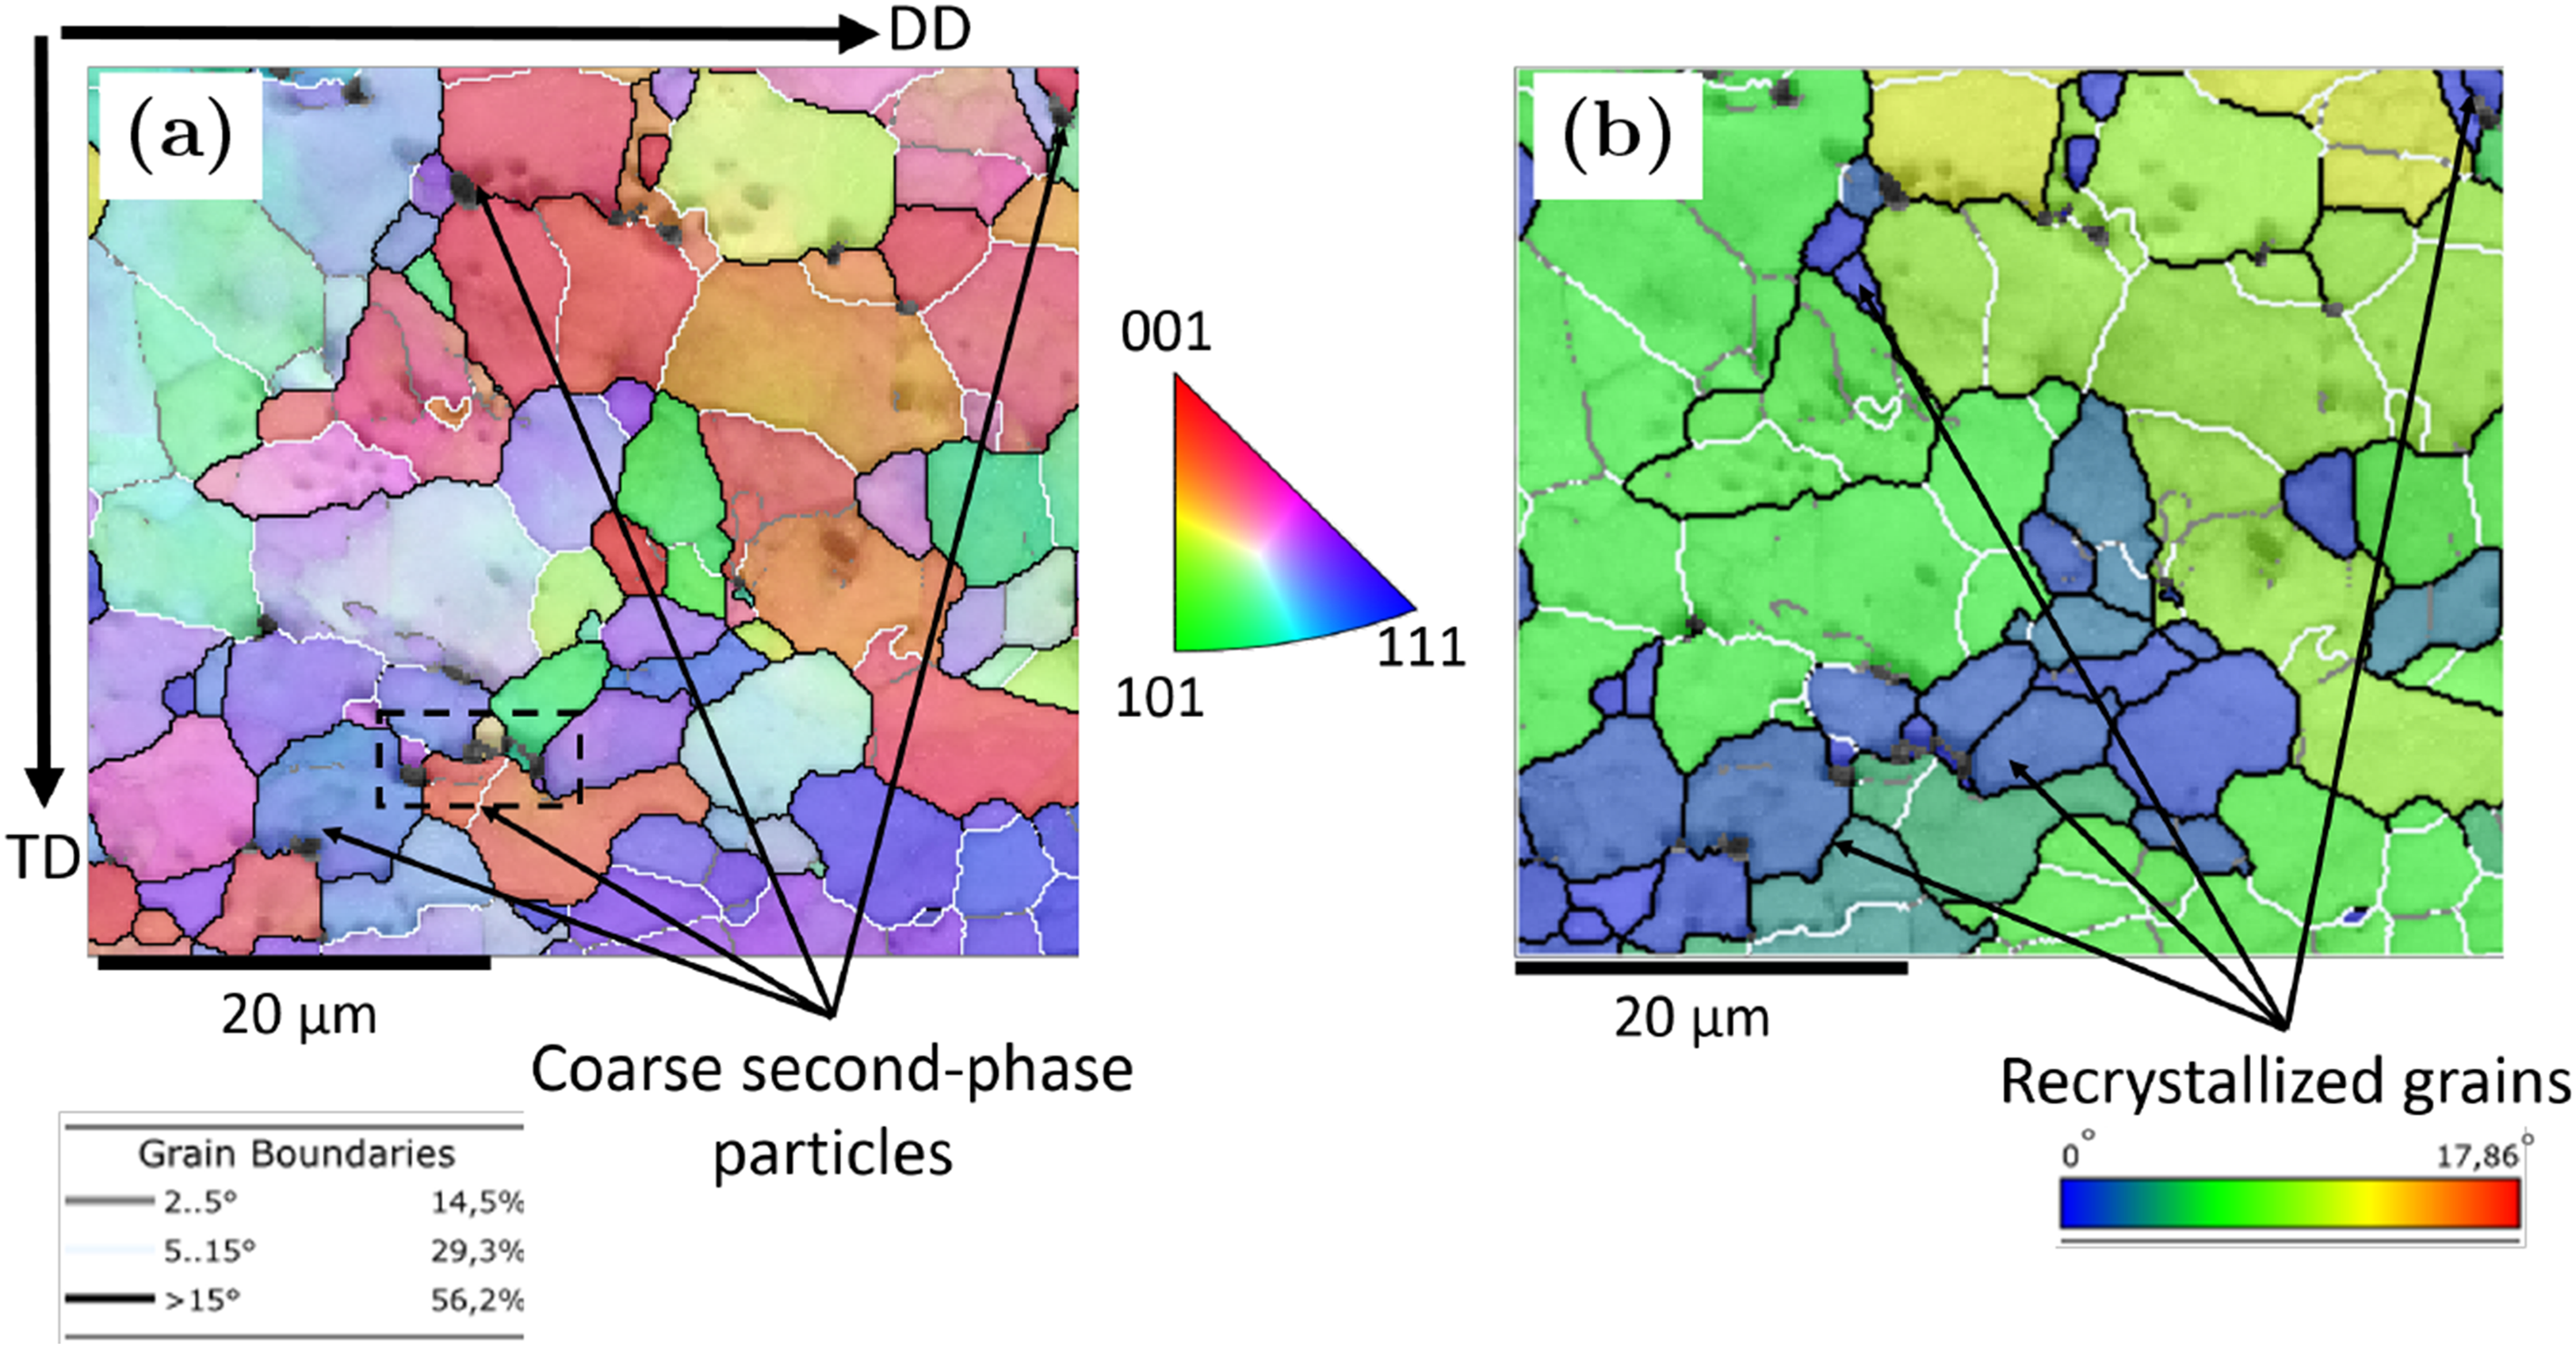
(a) EBSD maps of a subregion of sample l3 with a high proportion of recrystallized grains, and (b) some recrystallized grains identified through their very low grain orientation spread (GOS) adjacent to coarse second-phase particles,.
Discussion
Three temperature-dependent regimes were identified in the mechanical response of the AA3003 in the F-temper condition. At low temperature (room temperature and 150°C), the flow curves exhibit initial hardening followed by moderate softening, with negligible strain-rate sensitivity. Considering the highly deformed microstructure of the as-received AA3003 in the F-temper condition, and its associated stored energy, this softening is attributed primarily to dynamic recovery (DRV), as expected in high-SFE alloys such as AA3003. 27 At 250°C, strain-rate sensitivity increases markedly, although the overall hardening–softening character remains similar. At 350°C, strain-rate sensitivity reaches a maximum and the flow response becomes strongly strain-rate dependent: pronounced hardening followed by softening at 5 × 10 − 2 and 5 × 10 − 3 s − 1, hardening with only mild softening at 5 × 10 − 4 s − 1, and mild hardening approaching near-steady flow at 5 × 10 − 5 s − 1. Near-steady mechanical behavior is also observed at 450°C and 550°C for all strain rates. Overall, the marked transition at 350°C indicates a shift in the balance between work hardening and restoration and highlights the increasing importance of deformation time at this temperature.
The microstructural observations support this transition and reveal a marked contrast between the high- and low-strain-rate routes. The high strain-rate route produces a more homogeneous grain-size distribution and wider regions with grains of similar crystallographic orientations, whereas the low strain-rate route results in a broader grain-size distribution and more randomized orientations, especially among fine recrystallized grains. For example, the grain-size distributions in Figure 8 show that, for h3, 92.8% of the grains fall within 1–25 µm (MDAE) (Figure 8(a)), compared with 67.8% for l3 (Figure 8(b)); conversely, the fraction of grains with MDAE >50 µm is 3.9% in h3 and 14.1% in l3. Thus, although both h3 and l3 display near-steady macroscopic flow in Figure 5, they do so through different microstructural pathways. Similar steady-flow responses during hot compression have been reported for other aluminum alloys like AA7175, 27 AA7075 60 and AA6069. 48
Texture evolution provides further evidence for distinguishing between the microstructural pathways analyzed here. In the high strain-rate series (5 × 10 − 2 s − 1), the inherited drawing components, ⟨111⟩ ∥ DD and ⟨001⟩ ∥DD, remain dominant, with only changes in their relative fractions. After approximately 50% strain, the texture of h3 still reflects these inherited components (Figure 9(g)). By contrast, in the low strain-rate series (5 × 10 − 5 s − 1), the initial double fiber texture is more clearly and progressively modified from l1 (Figure 9(d)) to l3. The IPFs of l3 (Figure 9(h)) show dominant ⟨111⟩ ∥ DD, ⟨111⟩ ∥ TD, and ⟨101⟩ ∥ND (CD) components, together with much sparser distributions, indicating a markedly stronger texture randomization than in h3. This contrast is in line with Gourdet and Montheillet, who reported that high strain rates favor CDRX with retention of deformation texture, whereas lower strain rates promote texture randomization and can involve grain-boundary sliding contributions. 21
Grain-boundary character evolution and mechanistic interpretation
To further clarify the restoration mechanisms, the grain-boundary character distribution was evaluated from EBSD maps. Figure 13(a) shows that, in the high strain-rate route, the fraction of very low misorientation angles decreases progressively with strain, while the distribution shifts toward higher values of grain misorientation angles. This is consistent with progressive boundary-misorientation increase during CDRX, i.e., DRV promotes the formation of subgrains, while continued straining leads to progressive LAGB→HAGB conversion.61–63
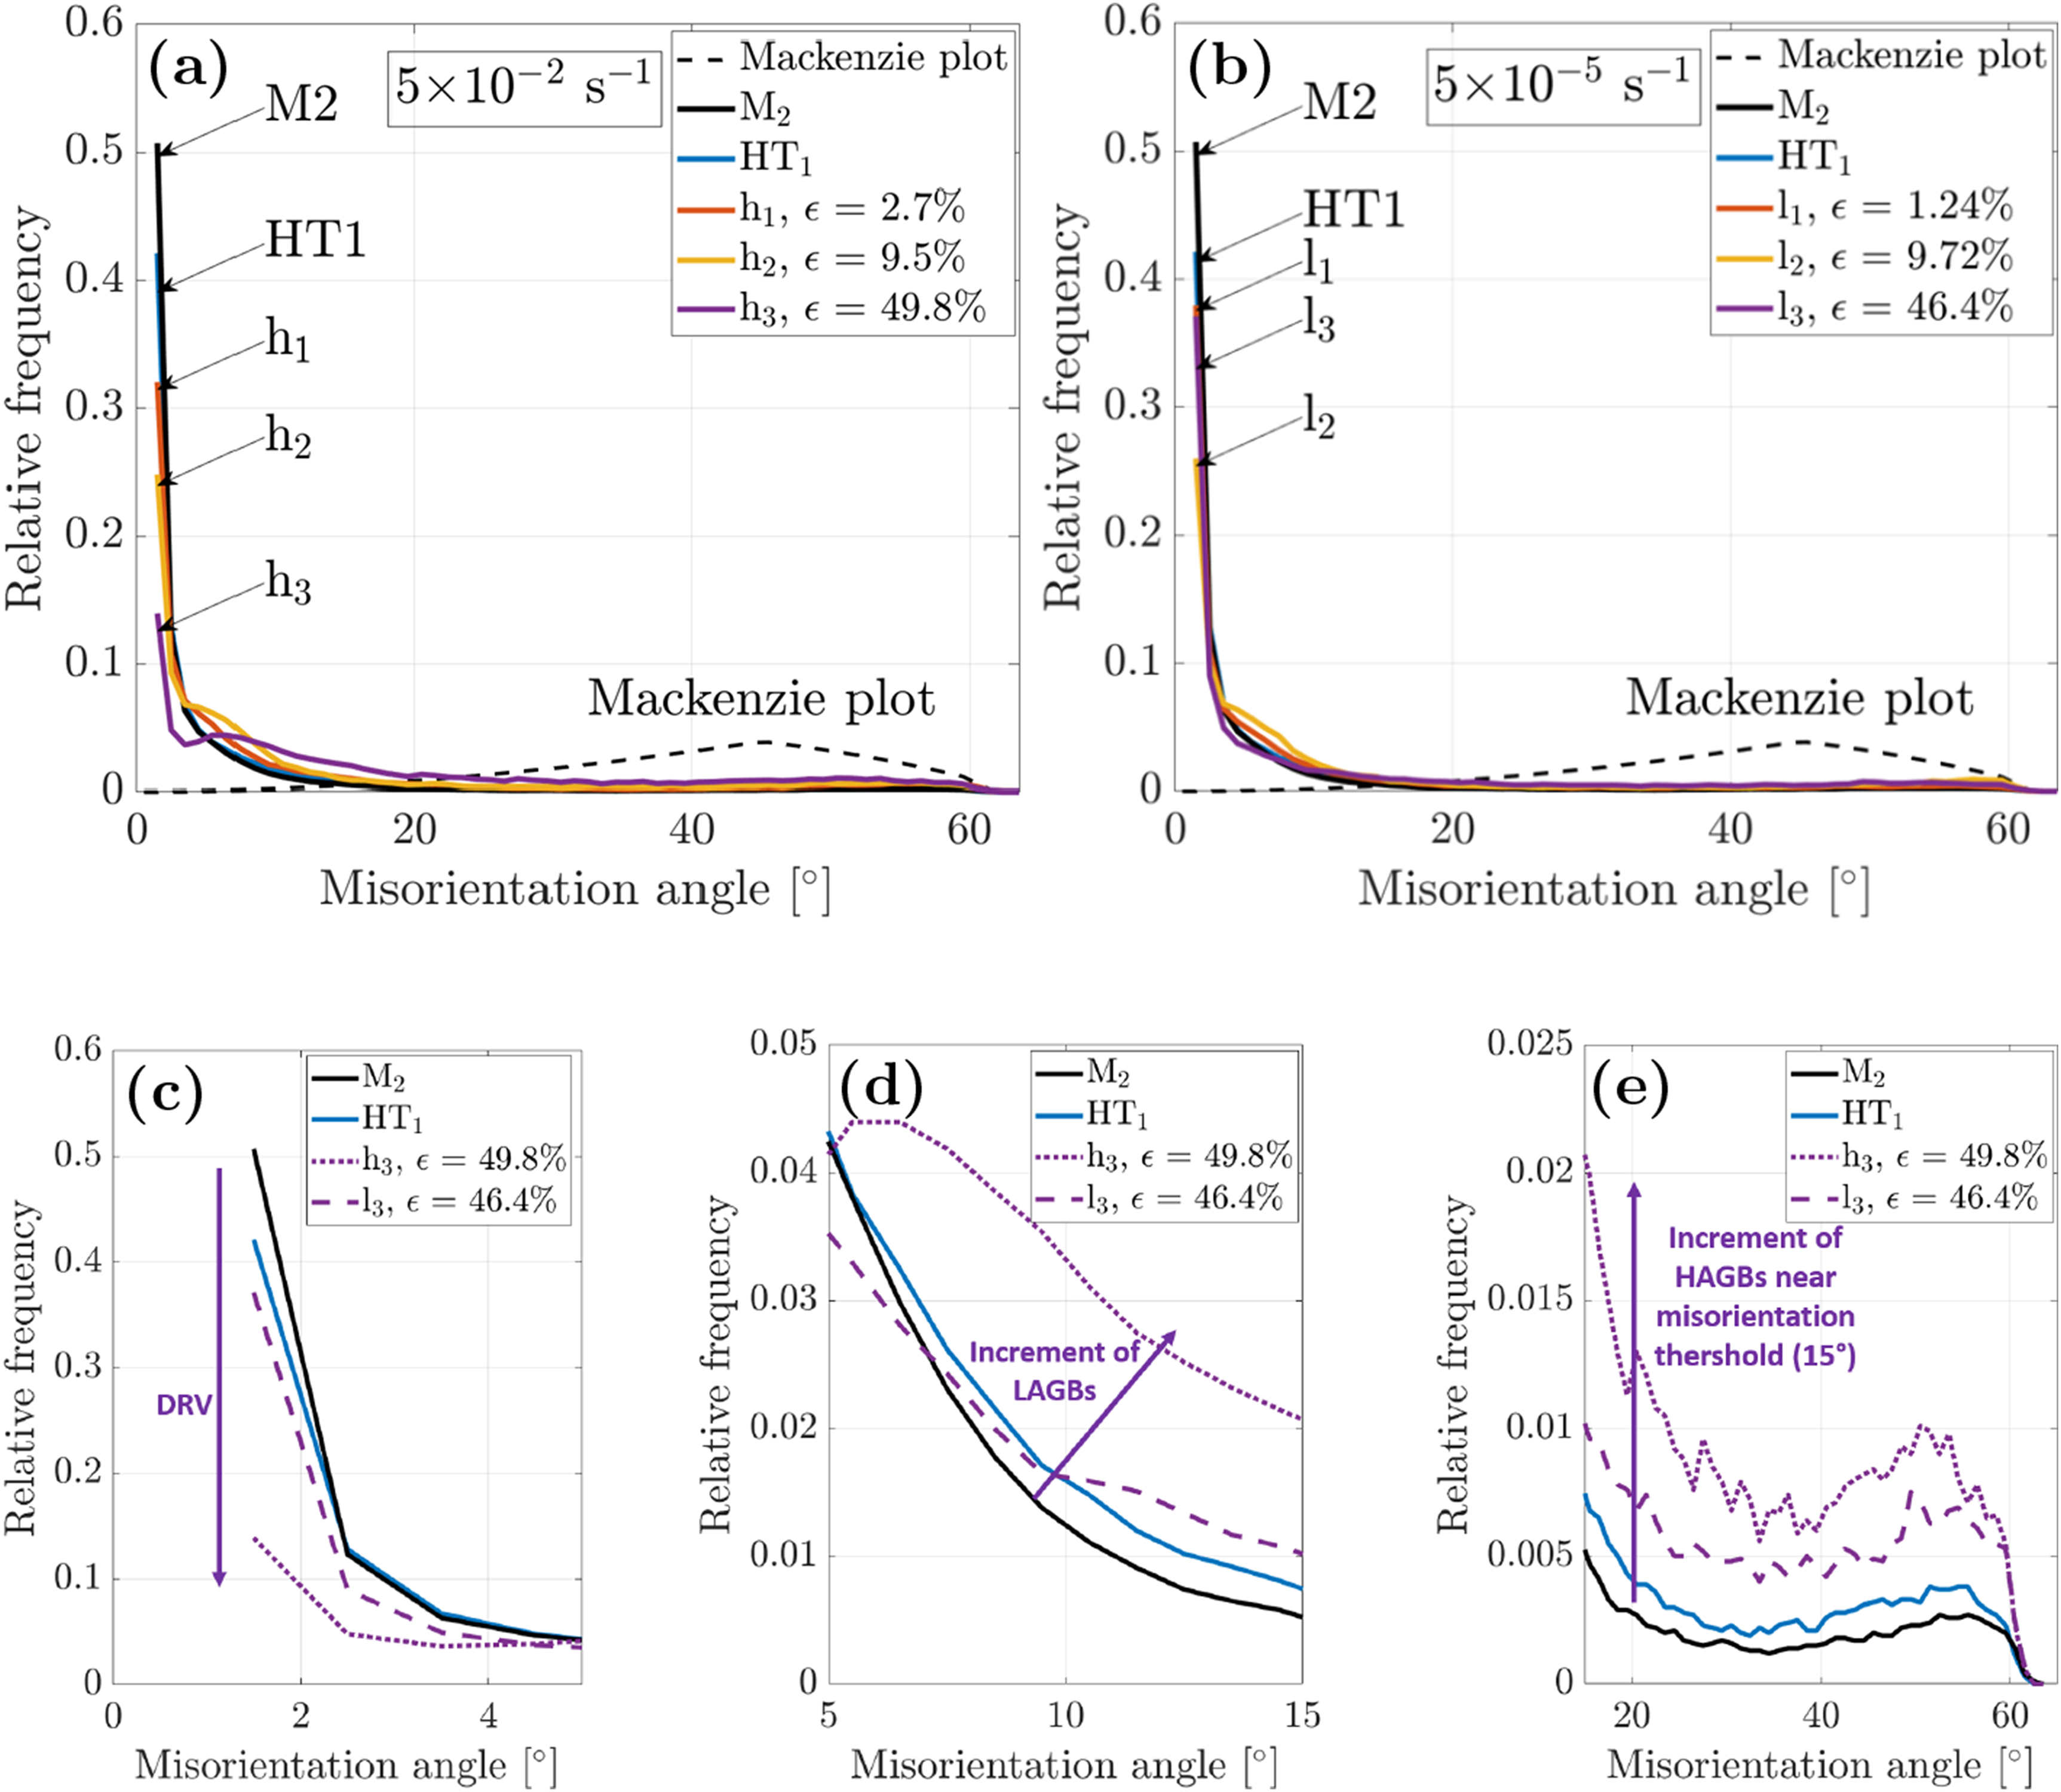
Evolution of misorientation distributions during hot compression. (a) Misorientation distributions for the high strain-rate route. (b) Misorientation distributions for the low strain-rate route. (c) Comparison of the very-low-angle and SGB regime for HT1, h3, and l3. (d) Comparison of the LAGB regime for HT1, h3, and l3. (e) Comparison of the HAGB regime for HT1, h3, and l3.
Figure 13(b) shows that, in the low strain-rate route, the evolution initially follows a trend similar to that observed at high strain-rate, but departs from it between l2 and l3. Indeed, sample l3 exhibits a distribution closer to the initial state, with an increase in the proportion of very low misorientation angles and a reduction in the fractions of SGBs and LAGBs, while the HAGB fraction continues to increase slightly. This combination is consistent with a stronger contribution of HAGB migration and the consumption of LAGB-rich regions, while low-misorientation zones persist in the remaining deformed regions, suggesting a larger DDRX contribution.
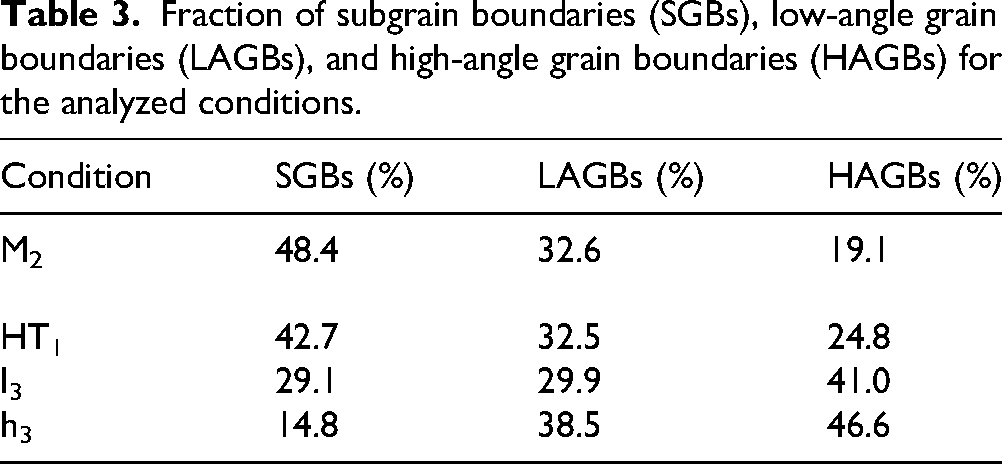
The common evolution of both strain-rate routes regarding misorientation distributions up to the intermediate strain level (h2 and l2), both showing a decrease in very low misorientation angles and an increase in LAGBs, is consistent with the strong tendency for DRV in this alloy. The main divergence, appearing only at the highest strain level, is presented in more detail in Figures 13(c)–(e). It is indeed notable that h3 exhibits the strongest depletion of very low misorientation angles and the strongest enrichment in the LAGB range, with a pronounced increase near the lower HAGB range. By contrast, l3 remains much closer to the initial state suggesting a marked effect of deformation time on the dominance of restoration mechanisms. These trends are summarized in Table 3, which reports the fractions of the established boundary classes in the initial as-fabricated state (M2), the pre-compression state (HT1), and samples h3 and l3.
Fraction of subgrain boundaries (SGBs), low-angle grain boundaries (LAGBs), and high-angle grain boundaries (HAGBs) for the analyzed conditions.
A detailed examination of the EBSD maps of samples h3 and l3 allows a more local interpretation of these distributions. Figure 14(a) shows a subregion of the EBSD maps presented in Figure 6(d) for sample h3. Figure 14(b) highlights the internal boundary network within this region, where SGBs are shown by thin black lines, LAGBs by thin white lines, and HAGBs by thick black lines; selected arrows indicate representative examples. LAGBs are clearly more frequent than SGBs, as confirmed by the distributions discussed above, indicating that the deformation substructure has evolved beyond incipient dislocation-cell formation toward more developed subgrain boundaries.
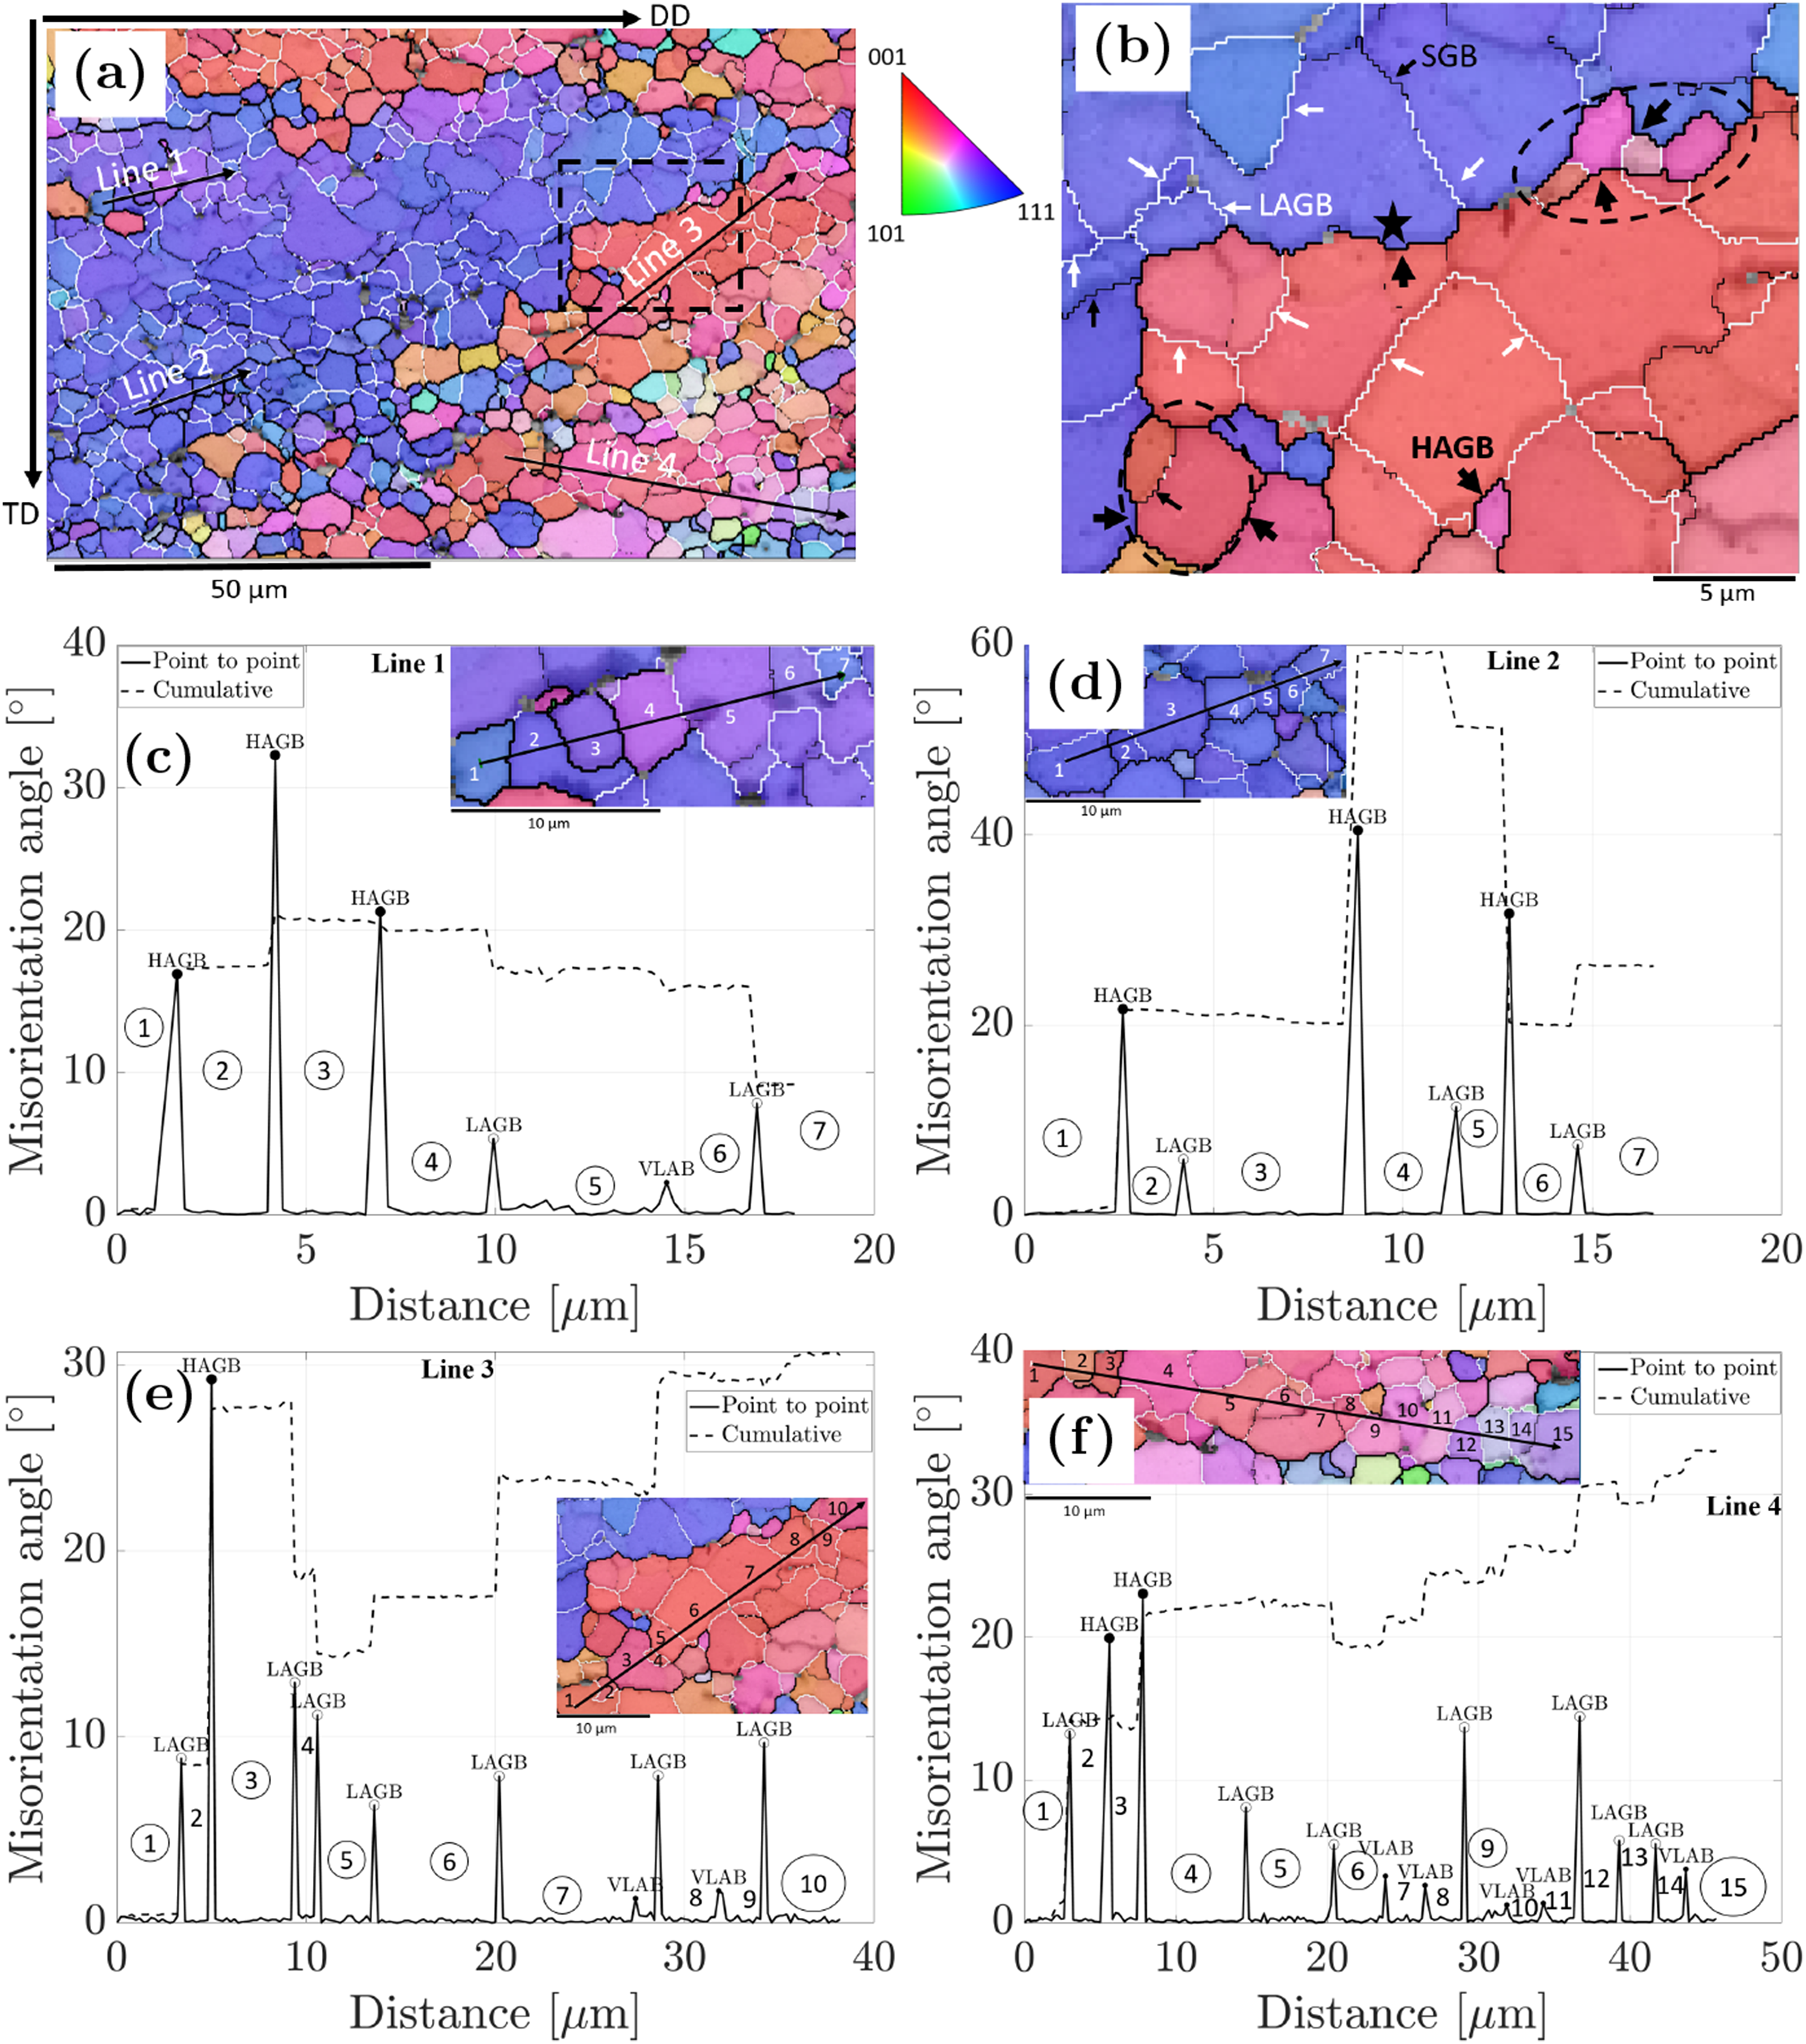
Local EBSD analysis of sample h3. Selected contours/arrows identify representative types of grain boundaries illustrating progressive subgrain-boundary evolution. (a) EBSD maps of a representative subregion of sample h3 showing selected measurement lines and the crystallographic-orientations. (b) Magnified view of the same region highlighting the network of subgrain boundaries, LAGBs, and HAGBs within the deformed parent-grain fragment. (c–f) Point-to-point and cumulative misorientation profiles measured along representative lines in (a), showing the coexistence of SGBs, developed LAGBs, near-HAGBs, and HAGBs.
The misorientation profiles in Figures 14(c)–(f) provide local evidence of this progressive evolution along the paths indicated in Figure 14(a). In Figure 14(c), the profile intersects three HAGBs with misorientations of 16.9°, 32.3°, and 21.3°; notably, two of these are only slightly above the conventional HAGB threshold of 15°, while subsequent boundaries along the same profile remain in the LAGB and SGB ranges. Similar features are observed in Figures 14(d)–(f), where HAGBs just above 15°–20° coexist with multiple LAGBs approaching the HAGB threshold and numerous SGBs. Taken together, these observations reveal, within the same deformed parent-grain regions, a hierarchy of SGBs, developed LAGBs, near-HAGBs, and HAGBs at comparable length scales. This hierarchy is consistent with progressive subgrain-boundary evolution from dislocation cells to subgrains and, locally, to grains fully delimited by HAGBs. Accordingly, grains such as those encircled in Figure 14(b) are interpreted as CDRX-derived grains, although they still contain internal SGBs and LAGBs resulting from the continuous accommodation of deformation. The cumulative-misorientation curves, shown by dashed lines in Figures 14(d)–(f), exhibit mostly small incremental changes in orientation relative to the first point, indicating a progressive relative rotation of adjacent substructures. Because the present EBSD analyses is post-mortem, the temporal evolution of individual boundaries cannot be followed directly; therefore, this interpretation is presented as the most consistent one rather than as direct proof of the underlying kinetic pathway. Although subgrain coalescence cannot be excluded a priori from a post-mortem EBSD map, the retained hierarchy of boundary misorientations observed here is more consistent with progressive LAGB-to-HAGB evolution than with boundary elimination by coalescence.
Figure 15(a) presents a subregion of the EBSD maps in Figure 7(d) for sample l3. In this region, some adjacent substructures with similar orientations were separated by a succession of LAGBs and HAGBs close to the HAGB threshold. This was exemplified by the misorientation profile of line 1 (Figure 15(b)), which exhibited features similar to those observed in h3, suggesting that CDRX-type substructure evolution also occurred locally in l3.
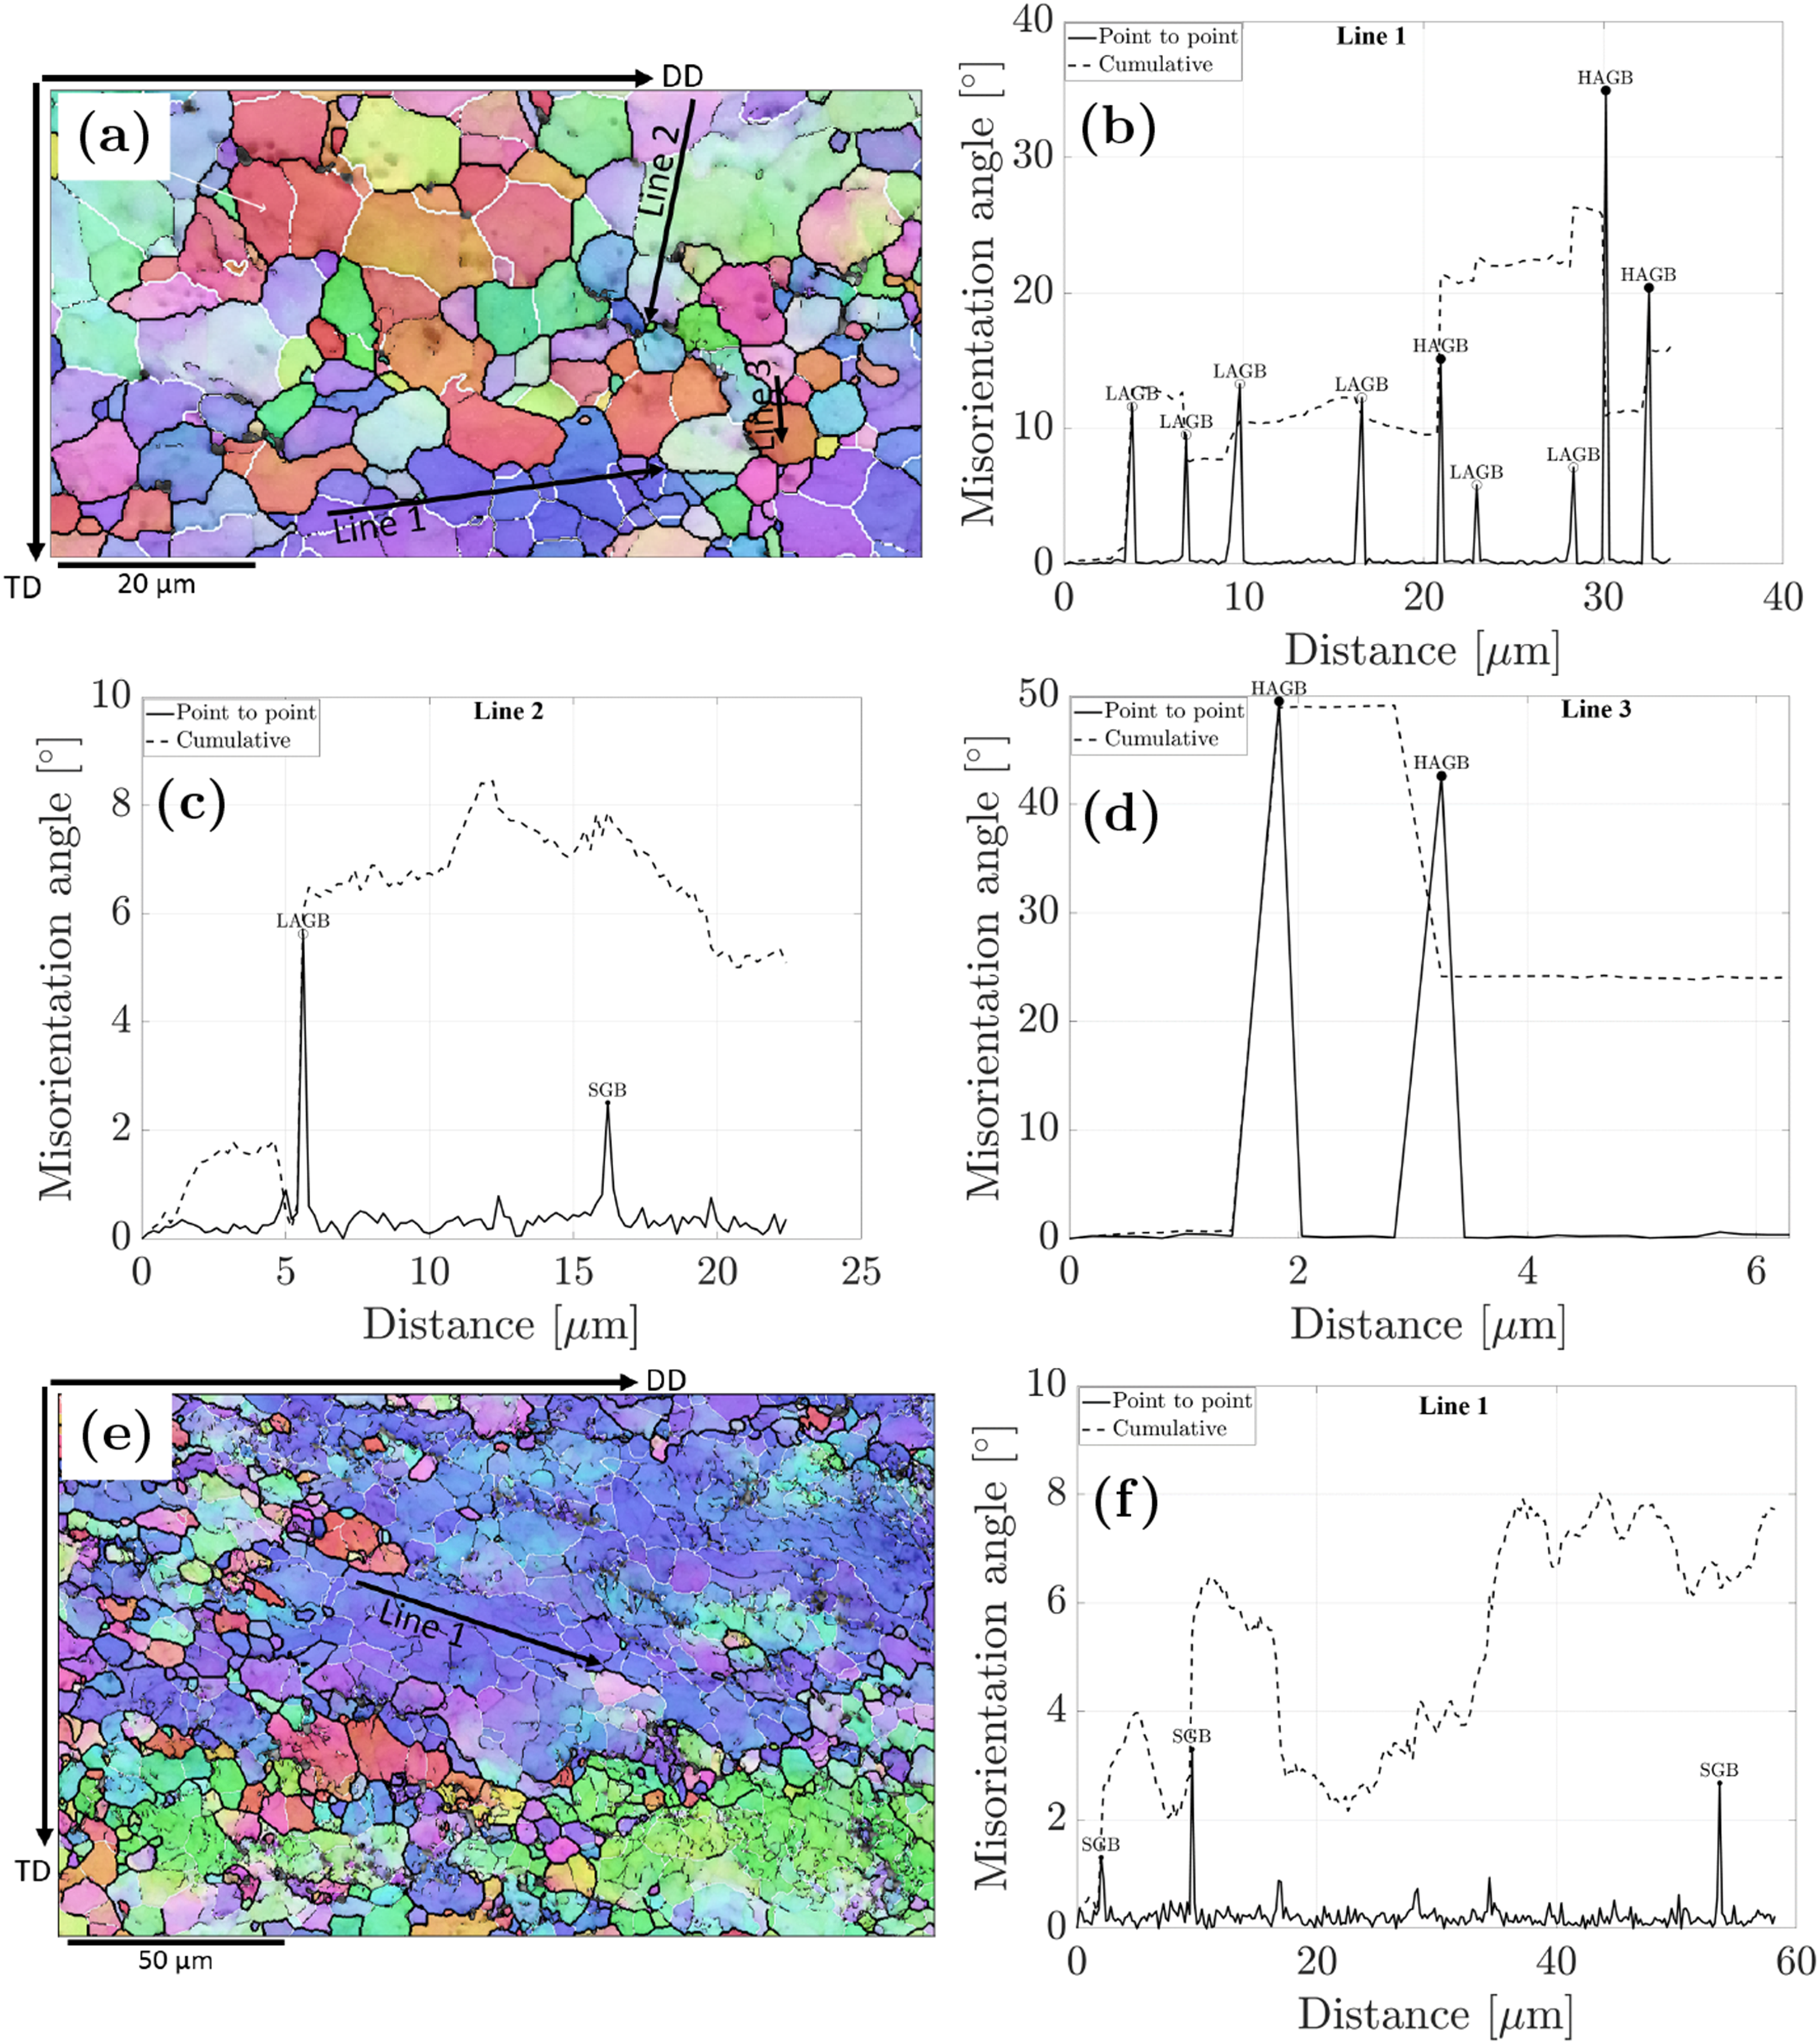
Local EBSD analysis of sample l3. (a) EBSD maps of a representative subregion showing adjacent regions with different levels of substructure development. (b) Misorientation profile along line 1 in (a), showing local subgrain-boundary evolution. (c) Misorientation profile along line 2 in (a), illustrating a region with very limited substructure development. (d) Misorientation profile along line 3 in (a), showing a fine grain bounded by very high-angle interfaces. (e) EBSD maps of another representative subregion containing a coarse grain with weakly structured internal misorientations. (f) Misorientation profile measured in (e), showing sparse SGB development and limited internal accommodation.
At the same time, such regions coexisted with others that exhibited very limited substructure development. This was illustrated by line 2 in Figure 15(a), whose profile (Figure 15(c)) showed very low misorientations, producing only one LAGB and one SGB near the lower threshold of their respective classifications. Line 3 in Figure 15(a) highlighted a third type of microstructure, whose profile (Figure 15(d)) revealed a small grain bounded by very high-angle boundaries (> 40°), more consistent with a DDRX-type feature than with a purely continuous mechanism. The higher fraction of very low misorientation angles in l3, relative to h3, was consistent with the presence of larger grains that retained broad internally misoriented regions but only weakly developed substructure. This was illustrated in Figure 15(e), which presents another subregion containing a coarse grain with weakly structured internal misorientations, and in the corresponding profile in Figure 15(f), again showing sparse SGB development and limited internal accommodation.
Taken together, these observations suggested lower CDRX activity in l3 than in h3, as well as stronger local heterogeneity in the accommodation of deformation. The coexistence of these contrasting local configurations within the same specimen indicated that the low-strain-rate route could not be described by a single homogeneous restoration pathway. These features supported the interpretation that, at low strain rate, longer deformation times enabled local grain-boundary migration and bulging-type nucleation/growth in addition to progressive subgrain-boundary evolution.63,64 Owing to the limitations of post-mortem EBSD resolution, these observations were presented as mechanistically consistent indicators rather than direct in-situ proof of boundary bulging or migration.
Overall, the results suggested that the highly deformed AA3003-F microstructure underwent predominantly DRV/CDRX from room temperature up to 350°C under the high strain-rate route, whereas at 350°C and low strain rate the restoration behavior shifted toward concurrent CDRX and DDRX. More specifically, the high strain-rate series followed a predominantly CDRX-type pathway throughout the investigated strain path, whereas the low strain-rate series appeared to follow CDRX up to l2 and then evolve toward a concurrent CDRX/DDRX regime between l2 and l3.
Zener–hollomon characterization of the deformation conditions
To summarize the combined effect of temperature and strain rate on these restoration pathways, the deformation conditions can be conveniently parametrized through the Zener–Hollomon parameter Z:
The parameters (A0, Q, K) were obtained by nonlinear least-squares fitting of Eq. (5) over the full (T,
The fit quality is shown in Figure 16. This value differs from that reported by Chen et al. for AA3003 (174.62 kJ/mol), 66 which is consistent with the known sensitivity of such values to the experimental window, prior microstructural state, and data-reduction methodology.67,68
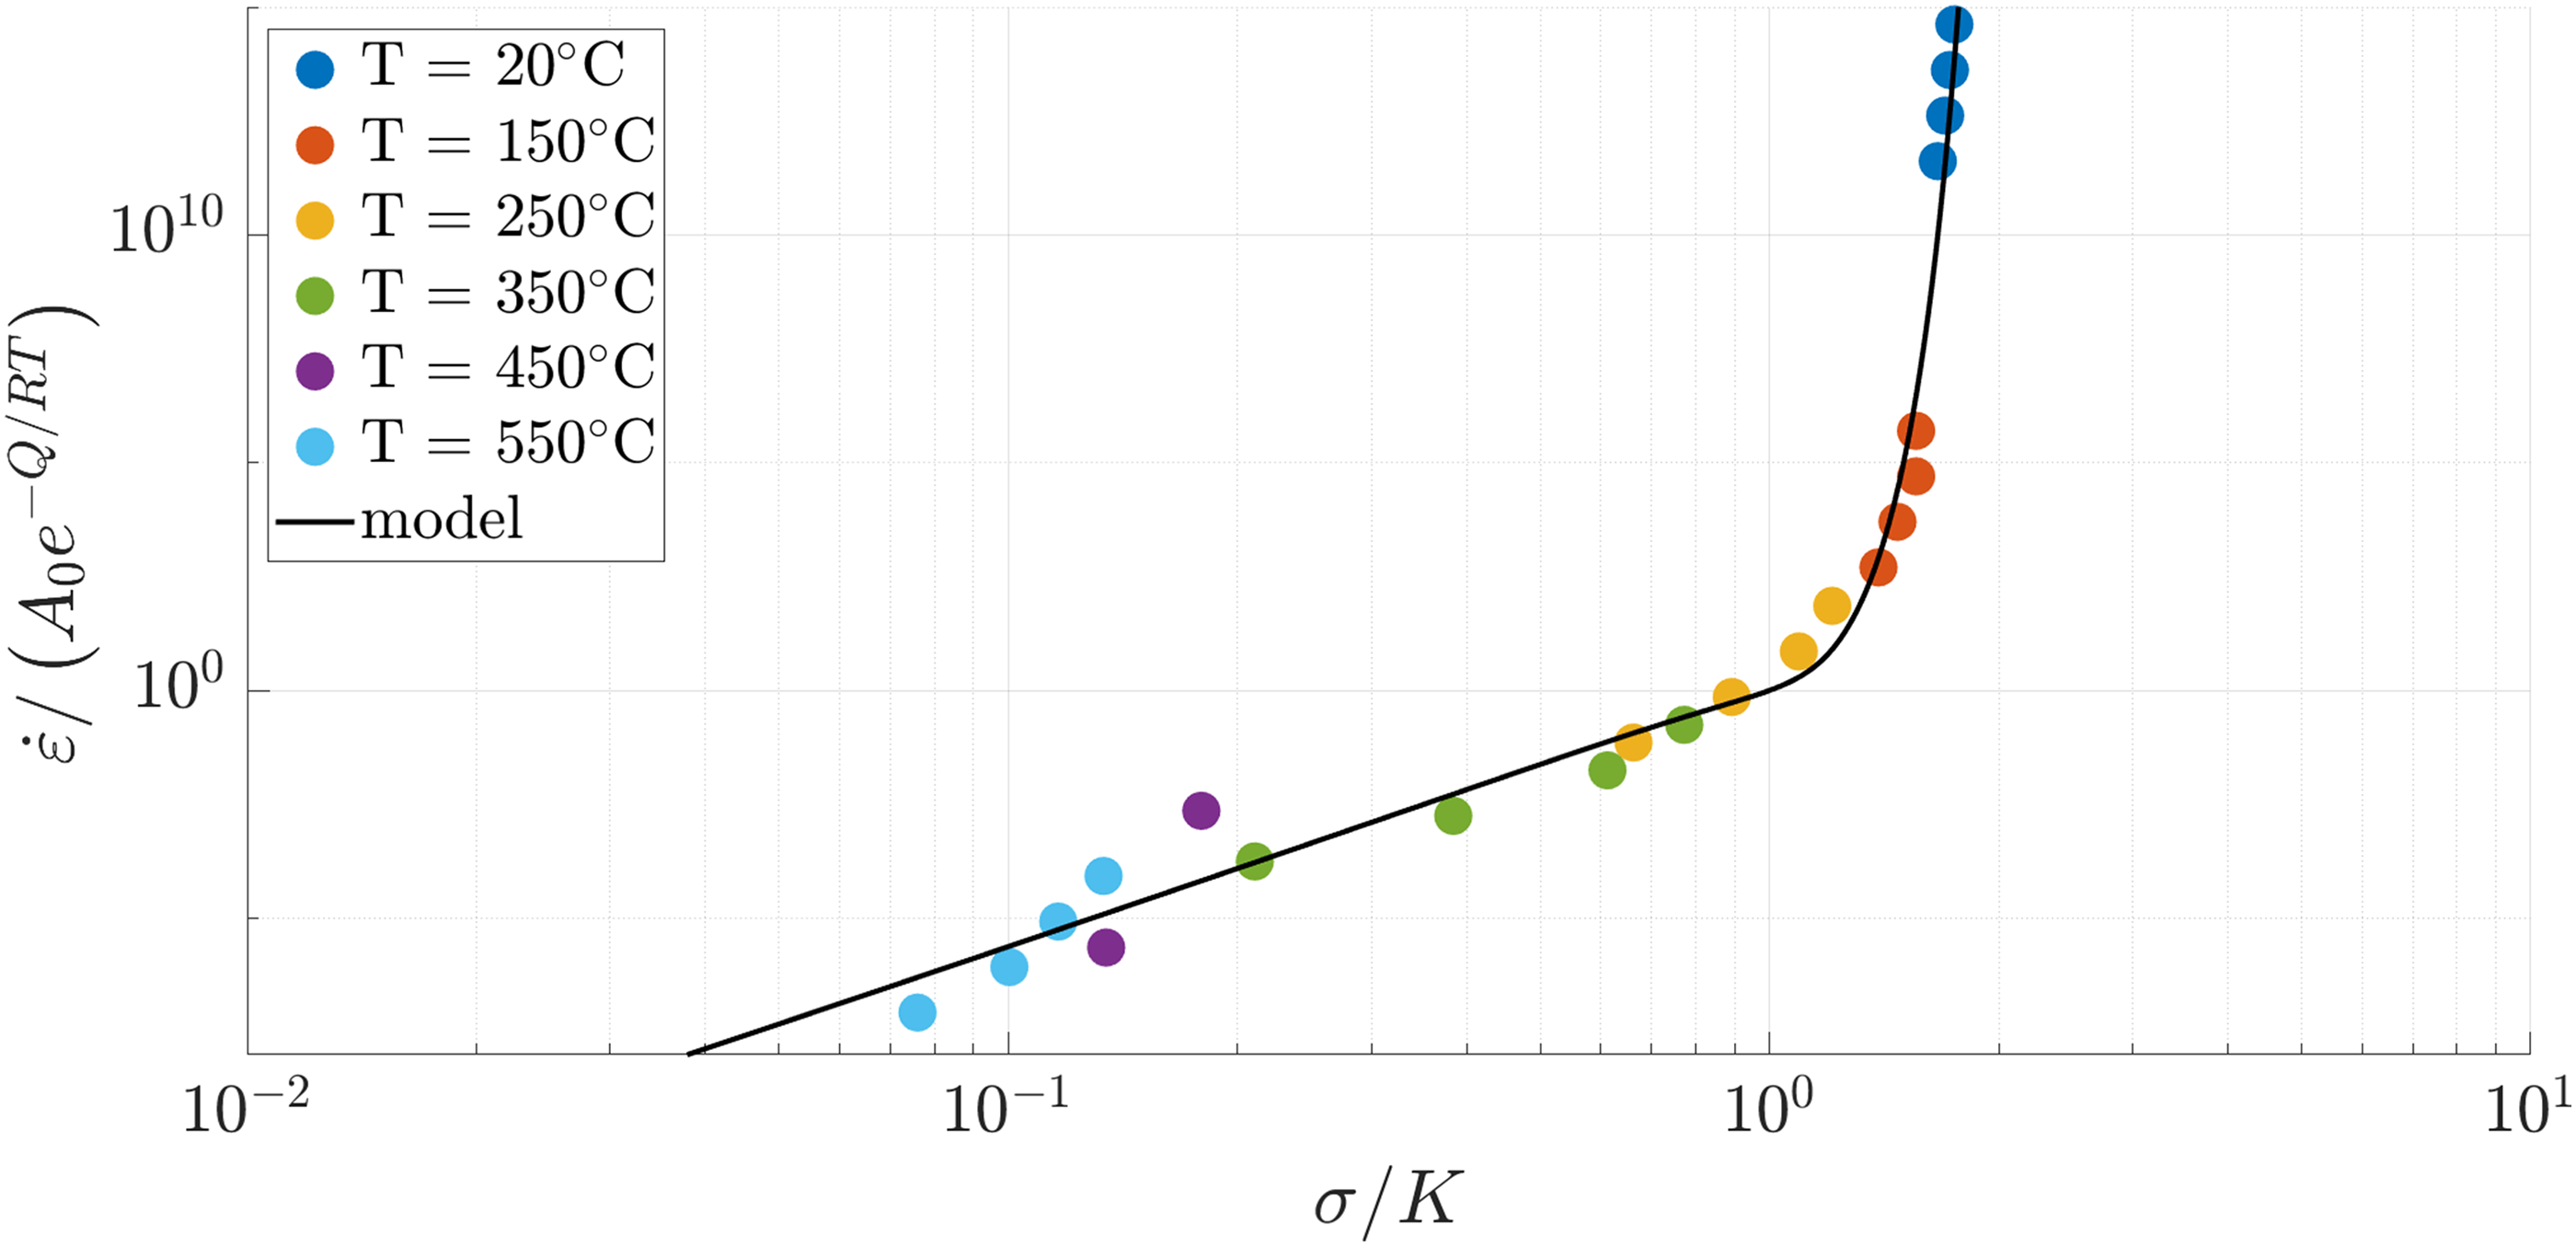
Normalized representation of the Arrhenius-type Slavik–Sehitoglu fit (Eq. (5)) across all temperatures. Symbols correspond to experimental data and the solid line to the fitted model response.
The fitted Q value was then used to compute Z =
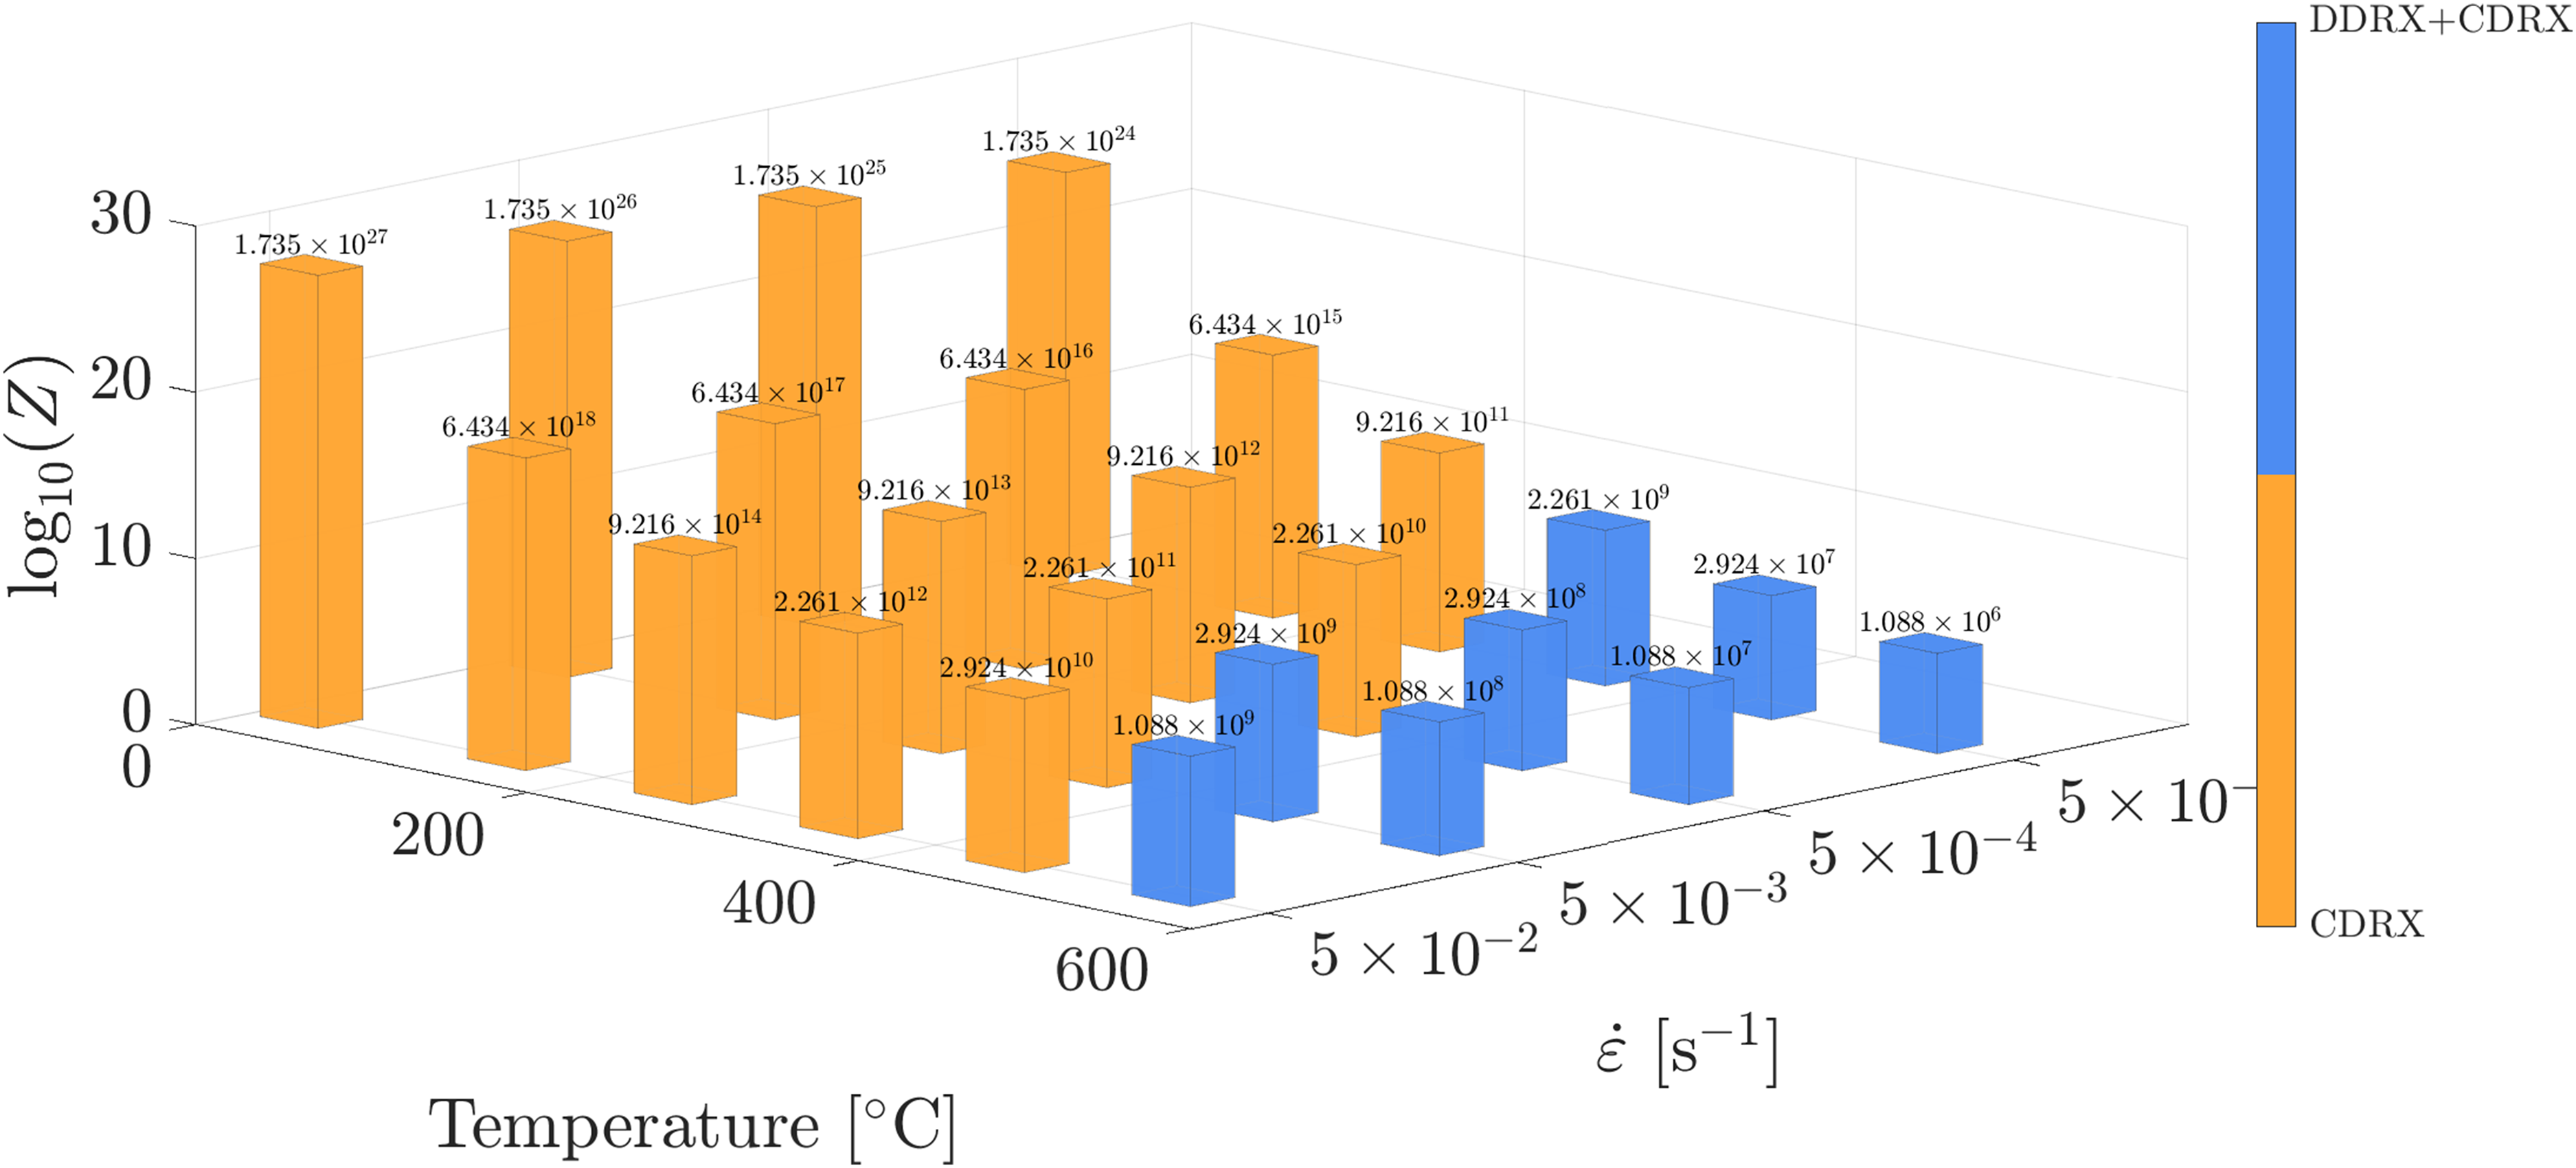
Logarithm of the Zener–Hollomon parameter for the hot-compression conditions investigated for the as-fabricated AA3003-F material.
Finally, the pronounced flow-stress differences observed at 350°C between 5 × 10 − 5 and 5 × 10 − 2 s − 1 can be interpreted within the same restoration framework developed above. In warm and hot deformation conditions, strain-rate effects are commonly described as the result of competition between work hardening and dynamic restoration. In high-stacking-fault-energy FCC materials such as aluminum, this restoration is strongly favored by thermally activated dislocation processes and is commonly expressed through dynamic recovery, progressive subgrain evolution, and, at sufficiently low Z values, increasing contributions from grain-boundary migration and DDRX.21,53
In the present case, the higher flow stress at 5 × 10 − 2 s − 1 is consistent with a predominantly CDRX-type response in which work hardening outpaces dynamic restoration, leading to the retention of a pronounced deformation substructure composed of SGBs, LAGBs, near-HAGBs, and HAGBs. In high-SFE aluminum alloys, such behavior is commonly associated with the limited time available for thermally activated recovery processes to offset dislocation storage during deformation.21,53 By contrast, the lower flow stress at 5 × 10 − 5 s − 1 is more consistently interpreted as the result of more effective net restoration during the longer time available during deformation. In this condition, restoration appears to be expressed heterogeneously, through the coexistence of regions showing CDRX-type subgrain evolution, weakly subdivided retained parent-grain regions, and local DDRX-type recrystallized grains, which is congruent with the mixed restoration behavior reported in aluminum alloys at lower Zener–Hollomon parameter values.21,28,30,69
Conclusion
This study investigated the thermomechanical behavior and microstructural evolution of AA3003 bars in the F-temper condition over a wide range of temperatures and strain rates, providing insights into the interplay between deformation conditions, dynamic restoration mechanisms, and microstructural development in this alloy. The main findings were summarized as follows:
The highly deformed initial microstructure associated with the F-temper led to a characteristic mechanical response featuring strain hardening, followed (or not) by softening depending on temperature and strain rate. A transition in the overall behavior was observed around 350°C, where the strain-rate sensitivity increased markedly. At 350°C and within the investigated thermal exposure/holding times, the intermetallic particle population showed no evident change in characteristic size or surface fraction, and no direct influence of particle evolution on the recrystallization mechanism was identified. Grain-size and morphology analyses indicated refinement and a tendency toward more equiaxed grains at both investigated strain rates; however, this evolution was modest at low strain rate and more pronounced at high strain rate. Under these same temperature conditions, a strain-rate-dependent transition in dynamic recrystallization mechanisms was identified, highlighting the role of deformation time at this critical temperature. Specifically, deformation at 5×10
−
2 s
−
1 was consistent with a CDRX-dominated evolution, whereas deformation at 5 × 10
−
5 s
−
1 showed an initially CDRX-like evolution followed by a transition toward concurrent CDRX/DDRX. The Zener–Hollomon parameter Z was proposed as a useful indicator of the transition between dynamic recrystallization regimes in AA3003-F. A transition was estimated around Z ≈ 2.92 × 10⁹ s
−
1, with lower values associated with concurrent CDRX/DDRX and higher values associated with predominantly CDRX.
Supplemental Material
sj-docx-1-mst-10.1177_02670836261443767 - Supplemental material for Effect of strain rate and temperature on the compression behavior and dynamic recrystallization of AA3003-F aluminum alloy
Supplemental material, sj-docx-1-mst-10.1177_02670836261443767 for Effect of strain rate and temperature on the compression behavior and dynamic recrystallization of AA3003-F aluminum alloy by Daniel Bedoya, Jérôme Serri, Thierry Mazet, Gaëtan Bergin and Eric Fleury in Materials Science and Technology
Supplemental Material
sj-docx-2-mst-10.1177_02670836261443767 - Supplemental material for Effect of strain rate and temperature on the compression behavior and dynamic recrystallization of AA3003-F aluminum alloy
Supplemental material, sj-docx-2-mst-10.1177_02670836261443767 for Effect of strain rate and temperature on the compression behavior and dynamic recrystallization of AA3003-F aluminum alloy by Daniel Bedoya, Jérôme Serri, Thierry Mazet, Gaëtan Bergin and Eric Fleury in Materials Science and Technology
Supplemental Material
sj-docx-3-mst-10.1177_02670836261443767 - Supplemental material for Effect of strain rate and temperature on the compression behavior and dynamic recrystallization of AA3003-F aluminum alloy
Supplemental material, sj-docx-3-mst-10.1177_02670836261443767 for Effect of strain rate and temperature on the compression behavior and dynamic recrystallization of AA3003-F aluminum alloy by Daniel Bedoya, Jérôme Serri, Thierry Mazet, Gaëtan Bergin and Eric Fleury in Materials Science and Technology
Supplemental Material
sj-docx-4-mst-10.1177_02670836261443767 - Supplemental material for Effect of strain rate and temperature on the compression behavior and dynamic recrystallization of AA3003-F aluminum alloy
Supplemental material, sj-docx-4-mst-10.1177_02670836261443767 for Effect of strain rate and temperature on the compression behavior and dynamic recrystallization of AA3003-F aluminum alloy by Daniel Bedoya, Jérôme Serri, Thierry Mazet, Gaëtan Bergin and Eric Fleury in Materials Science and Technology
Footnotes
Acknowledgements
The authors acknowledge the experimental facilities (MicroMat and MécaRhéo) from LEM3 (Université de Lorraine - CNRS UMR 7239). The AA3003-F bars were generously provided by Alfa Laval Golbey.
Ethical considerations
Not applicable
Consent to participate
Not applicable
Consent for publication
Not applicable
Author contribution(s)
Funding
The authors disclosed receipt of the following financial support for the research, authorship, and/or publication of this article: This material is based upon work supported by the ANRT (Association Nationale de la Recherche et de la Technologie) n°2020/1358 with a CIFRE fellowship granted to Daniel Bedoya.
ANRT, (grant number CIFRE 2020/1358).
Declaration of conflicting interests
The authors declared no potential conflicts of interest with respect to the research, authorship, and/or publication of this article.
Data availability
Not applicable
Supplemental material
Supplemental material for this article is available online.
References
Supplementary Material
Please find the following supplemental material available below.
For Open Access articles published under a Creative Commons License, all supplemental material carries the same license as the article it is associated with.
For non-Open Access articles published, all supplemental material carries a non-exclusive license, and permission requests for re-use of supplemental material or any part of supplemental material shall be sent directly to the copyright owner as specified in the copyright notice associated with the article.