
Abstract
Rare earth can simultaneously enhance mechanical properties and corrosion resistance of Al-Mg-Mn alloys. Among them, yttrium (Y) possesses the advantages of lower cost and high crust abundance. Effect of Y content (0.1, 0.2, 0.3 wt.%) on microstructure and corrosion resistance of as-cast Al-Mg-Mn alloys was examined. With increasing Y content, the number of Al3Mg2 and Al6(Fe, Mn) is gradually decreased, and the number of Y-containing precipitates is increased. After 0.3 wt.% Y addition, Al6(Fe, Mn) disappears and the Y-containing phases dominate. Galvanic corrosion is reduced since the potential difference between the α-Al and Y-containing phases is lower than that of the Al6(Fe, Mn) phase. Furthermore, after Y addition, volume fraction of Al3Mg2 is reduced, which improves intergranular corrosion resistance.
Introduction
Al-Mg series aluminum alloys are widely used in aircraft (such as the fuselage skins and welded structural components), automobiles (such as bumper beams and energy-absorbing boxes), shipbuilding (such as structural components of hulls, yachts, warships, and offshore platforms), and architectural structures (such as pressure vessels, mechanical structural components) due to their excellent mechanical properties and corrosion resistance.1–6 With the growing demand for high-performance aluminum alloys in fields such as aerospace and marine engineering, the strength and corrosion resistance of the conventional Al-Mg alloys are still unsatisfactory. In particular, when the Mg content is higher than 3.5 wt.%, the continuous β phase (Al3Mg2) tends to form along the grain boundaries. For Al-Mg series alloys, β phase will be preferentially dissolved in corrosive environments, consequently decreasing corrosion resistance and mechanical properties, which ultimately limits the applicability of Al-Mg alloys under harsh service conditions.7,8
In recent years, microalloying with rare earth (RE) elements has been considered an effective method to modify the microstructure and enhance the properties of aluminum alloys. Among them, Sc is one of the most commonly used and effective microalloying rare earth elements in Al-Mg alloys. The addition of Sc promotes the formation of numerous fine Al3Sc precipitates. Al3Sc is coherent with the matrix and can serve as nucleation cores to promote grain refinement.9–11 The addition of Sc can significantly enhance the mechanical properties of Al-Mg alloys by grain refinement strengthening and precipitation strengthening. Algendy et al. 12 found that the strength of 5454 alloy can be enhanced by approximately 50 MPa after adding 0.1 wt.% Sc. In addition, Sc addition can promote the formation of AlMn dispersoids in 5454 alloy. Al3Sc precipitates and AlMn dispersoids can inhibit subgrain boundary migration and hinder dislocation motion, which leads to the improvement of the yield strength from 187 MPa to 239 MPa. Meanwhile, Sc also significantly affects the corrosion behavior of Al-Mg alloy. Liang et al. 13 demonstrated that the intergranular corrosion resistance of the 5182 alloy can be significantly enhanced by the addition of 0.1 wt.% Sc. The decrease of intergranular corrosion depth is attributed to the inhibition of recrystallization due to the formation of Al3(Sc, Zr) phase. According to the report of Gao et al., 14 the stress corrosion resistance of Al-Mg alloys can be enhanced with the addition of 0.5 wt.%Sc and 0.1 wt.%Zr, as evidenced by the decrease of the corrosion current density from 3.7 × 10⁻⁶ to 1.3 × 10⁻⁶ A/cm-2. The main reason is that the grain refinement by the addition of Sc promotes the formation of a passivation film.
However, the high cost of Sc limits its application in aluminum alloys. Yttrium (Y), as a rare earth element in the same group as Sc, has the advantages of lower cost and higher chemical activity. Y can also form stable intermetallic compounds with Al (e.g., Al3Y intermetallic), which can serve as nucleation cores, promote grain refinement, and reduce the size of harmful precipitates.15,16 In Al-Si alloys, Y can significantly reduce the secondary dendrite arm spacing (SDAS) and modify the eutectic Si from flake or needle-like to fibrous or even spheroidized, which can significantly improve tensile properties.17–19 In Al-Mg-Si alloys, the microalloying with Y refines the grains and inhibits the growth of the β-AlFeSi and MgxSi phases, 20 which is beneficial to improve the mechanical properties and corrosion resistance. Wang et al. 21 demonstrated that Icorr, Ecorr-Eprot, Epit-Ecorr, and Eptp (Icorr is corrosion current density; Ecorr is corrosion potential;Eprot is repassivation/protection potential; Epit is pitting potential and Eptp is pit transition potential) in the cyclic polarization tests were significantly improved after the addition of Y. For Al-Zn-Mg alloys, Y addition promotes the formation of precipitates such as Al8Cu4Y and (Al, Cu)11Y3, and accelerated the dissolution of the Mg2Si phase,22,23 which improved the mechanical properties and corrosion resistance. Ru et al. 24 found that the L12-type Al3Y phase formed after the addition of Y and Zr in Al-Mg alloys, which inhibited the enrichment of Mg atoms at grain boundaries and hindered the precipitation and coarsening of the β phase along the grain boundaries, thereby reducing the susceptibility of intergranular corrosion (IGC).
In summary, Y has demonstrated considerable strengthening effects in various aluminum alloy systems. However, for Al-Mg-Mn alloys, only the effect of Y on the IGC has been investigated. The effect of Y on microstructure and corrosion resistance of the as-cast Al-Mg-Mn alloys needs further investigation. In this work, corrosion resistance was evaluated using a combination of potentiodynamic polarization, salt spray, weight loss tests, X-ray photoelectron spectroscopy (XPS), and Kelvin probe force microscopy (KPFM). The role of Y in regulating the microstructure, mechanical properties and corrosion behavior of Al-Mg-Mn alloy was discussed, which provides a theoretical foundation and technical support for the performance optimization of Al-Mg-Mn alloys toward practical applications.
Materials and experimental procedure
In order to facilitate the understanding of the layout of the present work, the experimental design and technical flowchart are presented. Figure 1 summarizes the entire process, including alloy preparation, microstructure analysis (EBSD, DSC, EMPA and SEM), corrosion resistance evaluation (electrochemical tests, salt spray tests, weight loss tests, and KPFM tests), and mechanism analysis.
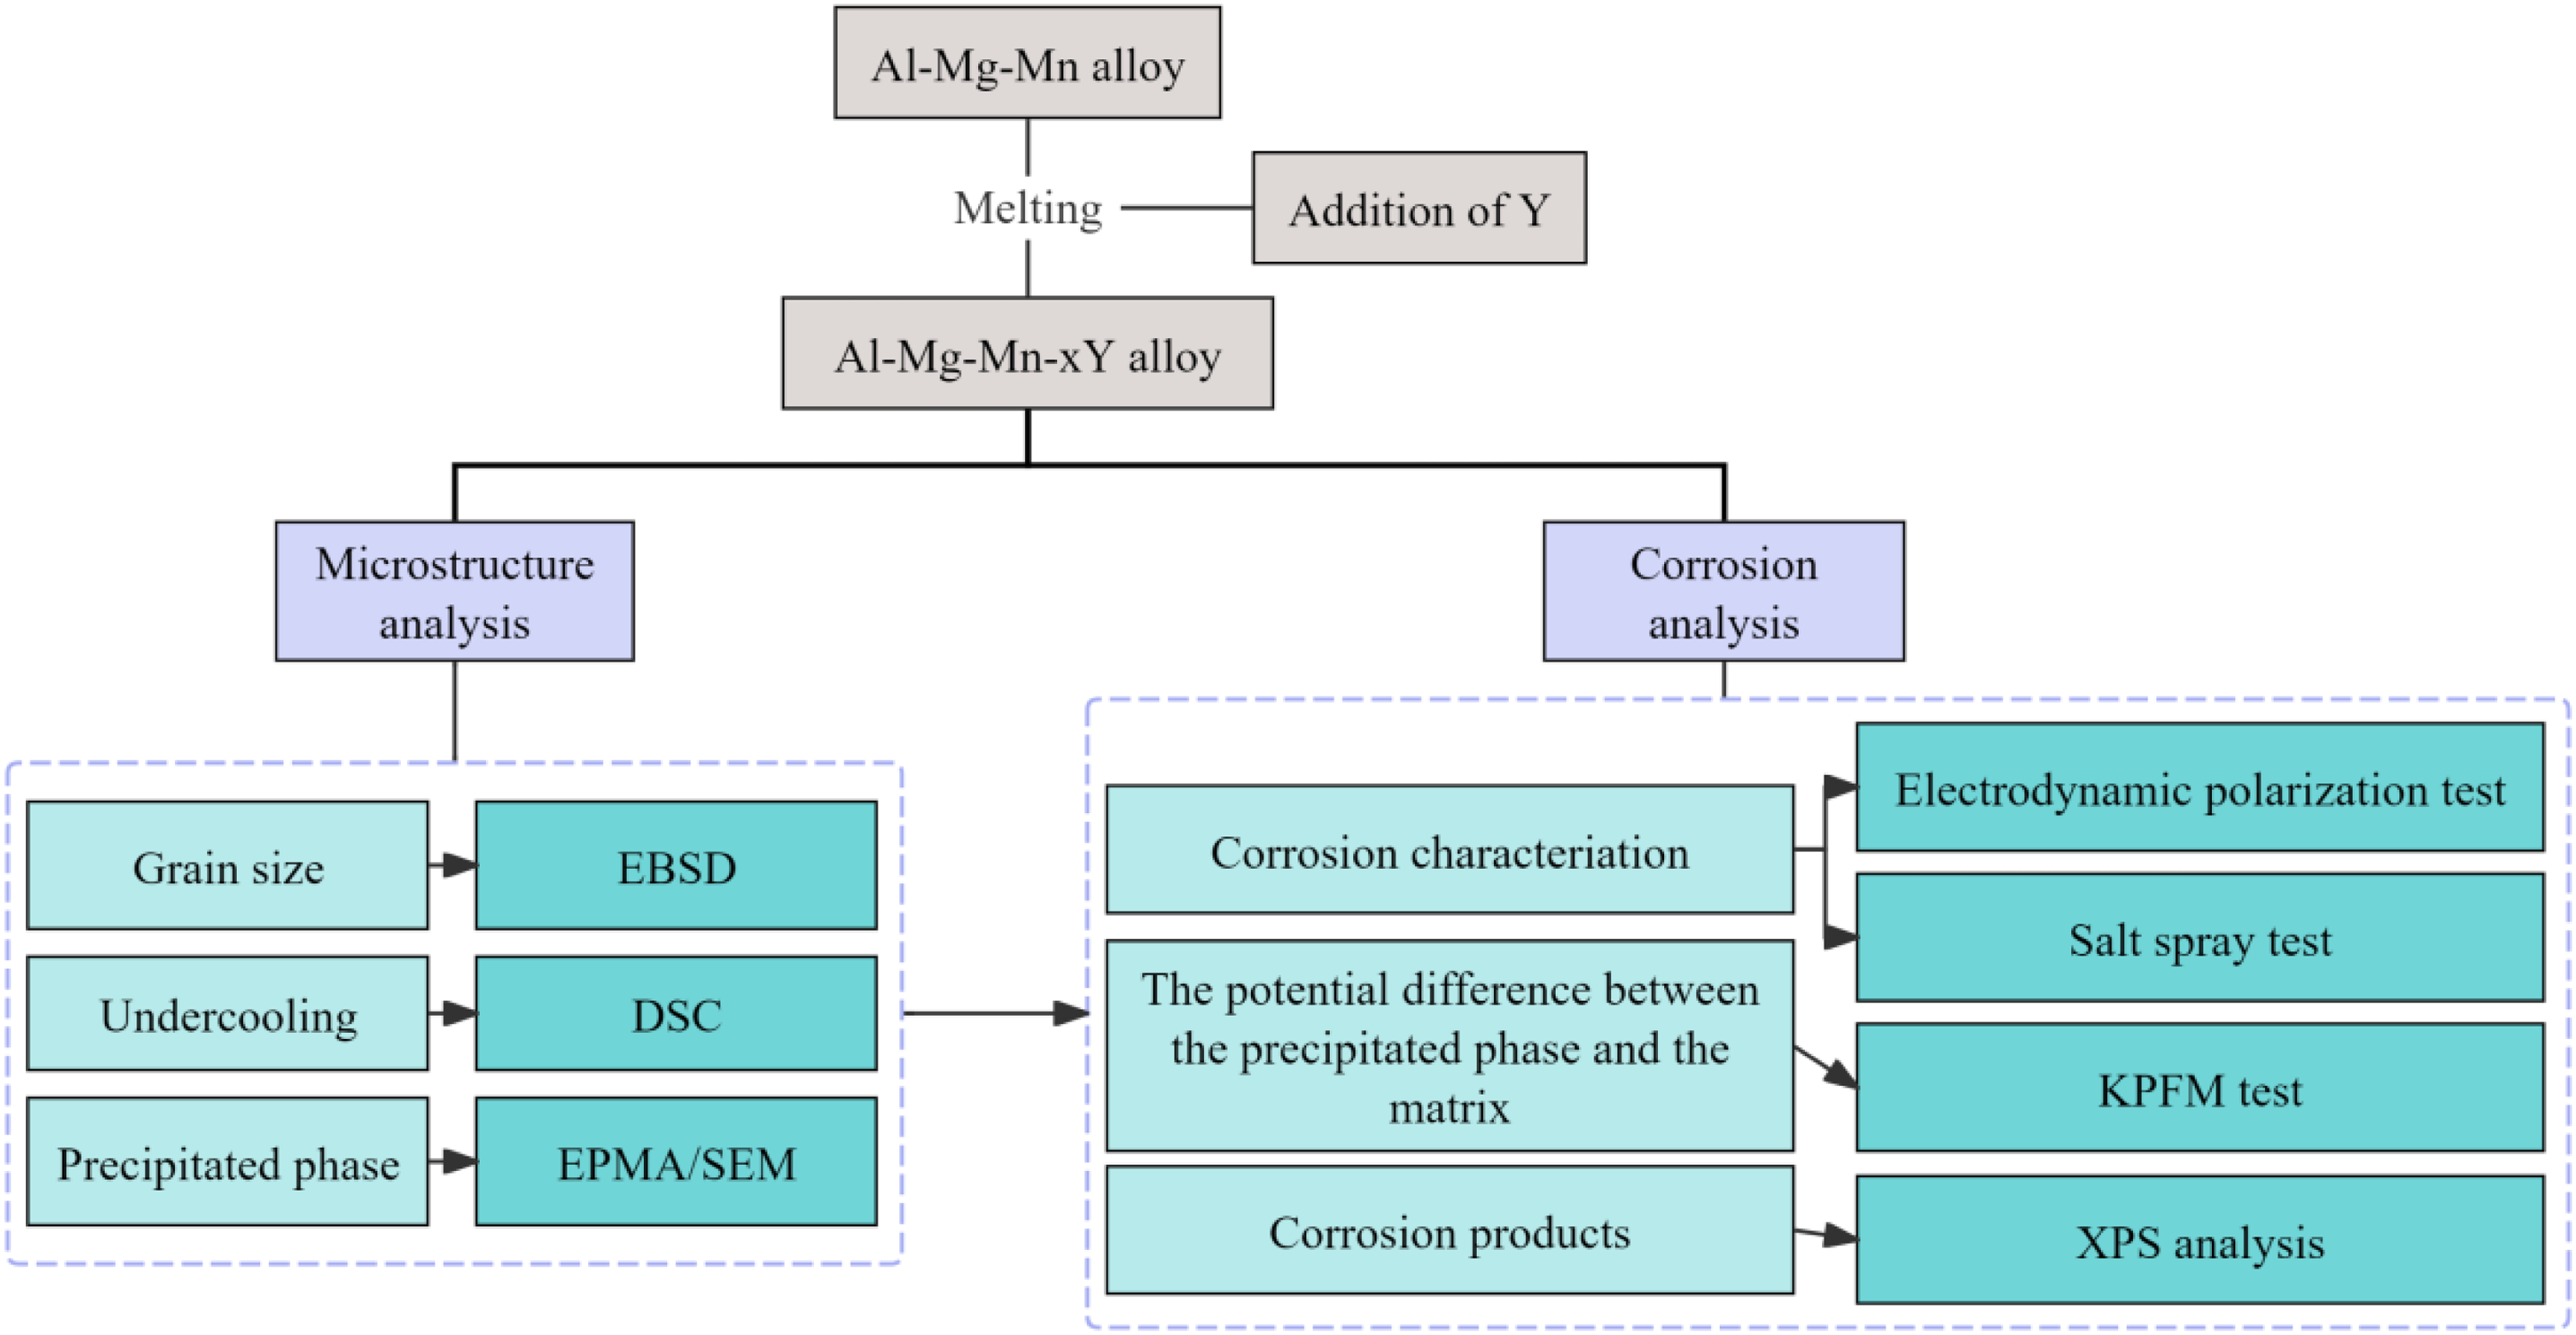
Schematic diagram of the experimental procedure in this work.
Sample preparation
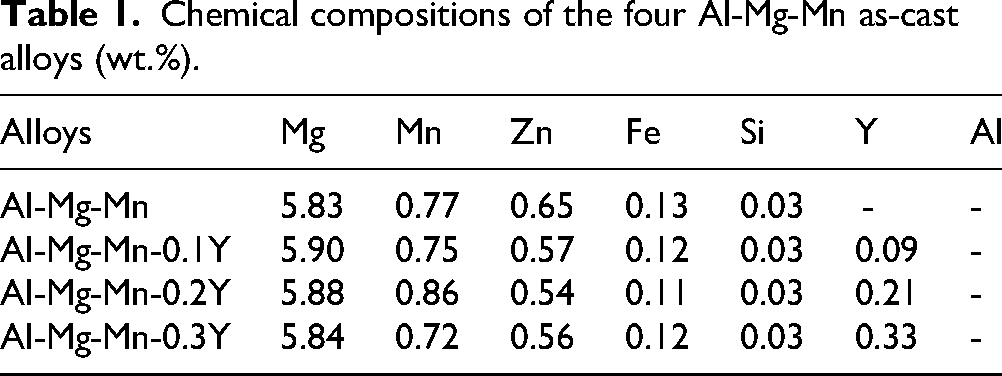
According to the work of Ru et al., 24 after the addition of 0.1 wt.% Y and 0.1 wt.% Zr, the grains of the Al-Mg-Mn alloy were refined and the IGC resistance was enhanced. Additionally, Wei et al. 17 designed a Y content gradient of 0.1, 0.2 and 0.3 wt.% in the A356 alloy. It was found that when the Y content was 0.2 wt.%, the dendrites were markedly refined and mechanical properties was significantly enhanced. Thus, in this work, we designed the Y content gradient as 0.1, 0.2 and 0.3 wt.%. The alloys used in this work were prepared by using Al-5.8Mg-0.7Mn alloy, Al-10Y master alloys, Al-10Mn master alloys, pure Mg, and pure Zn in a pit furnace (JSL 1400) to produce as-cast Al-Mg-Mn-xY alloys (x = 0, 0.1, 0.2, 0.3 wt.%). The detailed steps are as follows: Firstly, the Al-5.8Mg-0.7Mn alloy was placed in a graphene crucible and heated to 760 °C in the pit furnace, and then held for 5-10 minutes to ensure complete melting of the alloy. Subsequently, Al-10Y and Al-10Mn master alloys were added to the melt, and after complete melting the mixture was thoroughly stirred to ensure uniform composition distribution. Then, the first skimming was performed to remove the oxidized dross on the melt surface, after which the temperature was raised to 760 °C and held for 5 minutes. Pure Mg and pure Zn were wrapped in aluminum foil and placed at the bottom of the melt using crucible tongs, followed by thorough stirring. Then, refining agents (0.2% of the total weight) were added to the melt, and the mixture was stirred thoroughly before undergoing the second skimming. The temperature was maintained at 760 °C for 10 min to ensure complete melting and thorough mixing. Finally, the melt temperature was lowered to 710 °C, and the melt was poured into a preheated graphene mold (200 °C) to form rectangular ingots. The chemical composition of the as-cast aluminum alloy ingots was determined by Inductively Coupled Plasma Atomic Emission Spectrometry (ICP-AES), and the compositions were listed in Table 1.
Chemical compositions of the four Al-Mg-Mn as-cast alloys (wt.%).
Microstructural characterization
The effect of Y content on grain size was investigated by electron backscatter diffraction (EBSD, ZEISS Sigma 300, Germany). EBSD specimens were prepared by mechanical grinding and electropolishing, with an acceleration voltage of 20 kV, a sample tilt of 70°, and a scanning step size of 4 μm. The thermal behavior during the cooling process was evaluated using thermogravimetric-differential scanning calorimetry (TG-DSC, Netzsch STA409PC, Germany). Prior to the TG-DSC tests, the samples were dried to eliminate surface moisture. During the TG-DSC tests, cylindrical specimens (Φ3 × 2 mm) were placed in a crucible under a flowing argon atmosphere to prevent oxidation. The cooling rate during the TG-DSC tests was set as 5 °C/min, and the tested temperature ranged from 300 to 700 °C.
To determine the composition of the precipitates in the alloys, the chemical composition of the precipitated phases was determined using an electron probe microanalyzer (EPMA, JEOL JXA-iHP200F, Japan). Statistics of the number of the precipitates in the alloys were performed using a scan electron microscope (SEM, ZEISS Sigma 360, Germany).
Potentiodynamic polarization tests
For potentiodynamic polarization tests, specimens with dimensions of 10 × 10 × 3 mm were used. The specimens were ultrasonically cleaned in a solution of anhydrous ethanol and detergent to remove oil, grease, and other impurities. The specimens were then cold-mounted in epoxy resin and subjected to mechanical grinding and polishing after solidification. Potentiodynamic polarization tests were conducted using a CHI760E electrochemical workstation in a 3.5 wt.% NaCl solution at room temperature with a scan range of –0.5 V to 0.5 V (vs. SCE) and a scan rate of 0.00167 V/s. All the measurements were carried out inside a Faraday cage to minimize external electromagnetic interference. A standard three-electrode system was used, where the sample served as the working electrode, the platinum electrode as the counter electrode, and the saturated calomel electrode (SCE) as the reference electrode. Before the tests, the samples were soaked in solution for about 20 h, and then the open circuit potential (OCP) for 600 s to ensure that a relatively stable state can be reached before potentiodynamic polarization tests. The key electrochemical parameters such as corrosion current density (icorr), corrosion potential (Ecorr) and polarization resistance (RP) were derived by fitting the data using instrument software (CHI760E). To ensure data reliability, tests were conducted on three replicate specimens for each alloy composition.
Salt fog tests
Salt spray tests were conducted in a small neutral salt spray chamber according to GB/T 10125-2021, using a 3.5 wt.% NaCl solution as the corrosive medium. The tested temperature was controlled at 35 ± 1 °C, and the spray method was continuous spray. The sample size was 10 × 10 × 3 mm, and the exposed surface was polished after being ground with 400#, 800#, 1500#, 3000#, and 4000# sandpapers, then cleaned with deionized water and anhydrous ethanol and dried. The samples were placed on the sample holder at an inclination angle of 45° to ensure uniform coverage of the exposed surface by the spray, and were periodically taken out for overall corrosion observation using an optical microscope (OM). To examine the change in corrosion progress over time, corrosion durations of 0 h, 24 h, and 48 h were set. After 48 hours of salt spray testing, the corrosion products on the sample surfaces were analyzed by X-ray photoelectron spectroscopy (XPS, Thermo Scientific K-Alpha, USA). Using a monochromatic Al Kα X-ray source, all the peaks were calibrated using C1 s peak with 284.8 eV binding energy at 100 W under vacuum condition, with an energy and steps of 50 and 0.1 eV, respectively. The Avantage software was used to fit the response peaks.
Weight loss tests
Prior to the weight loss measurements, the specimens were ultrasonically cleaned and dried to remove surface oils and particulate debris. After cleaning, the specimens were dried with a stream of warm air and stored for subsequent tests. The overall corrosion rate was determined using the weight loss method. A pretreatment, including sequential immersion in a 50 g/L NaOH solution at 80 °C for 1 min, followed by rinsing and drying, was applied to the specimens. Subsequently, the specimens were immersed in a concentrated HNO3 solution (1.4 g/ml) for 30 s to achieve a bright surface, before a final rinse with distilled water and drying. The corrosive medium was a HNO3 solution, the corrosion temperature was controlled at 30.0 ± 0.1 °C, and the corrosion time was 24 h. The initial weight (W1) and final weight (W2) of the specimens were measured using a precision electronic balance with an accuracy of 0.01 g. The total exposed surface area for corrosion was 3.2 cm2.
KPFM characterization
Atomic force microscopy (AFM) was used to characterize the three-dimensional morphologies of microstructures. The Volta potential, measured by Kelvin probe force microscopy (KPFM), serve as a key indicator for evaluating the corrosion tendency of metallic materials. To investigate the influence of different precipitates on the corrosion resistance of the Al-Mg-Mn alloys, the Volta potentials of the Al3Mg2, Al6(Fe, Mn), and Y-containing phase were measured using KPFM. Prior to the KPFM measurements, the specimens were ground, polished, rinsed with anhydrous ethanol, and dried. All the measurements were conducted at room temperature with a scan resolution of 256 × 256 pixels and a scan rate of 1.0 Hz.
Results and discussion
Microstructure
To further confirm the effect of Y on the grain size of the as-cast Al-Mg-Mn alloys with different Y contents, electron backscatter diffraction (EBSD) was employed. Figure 2 shows that the grain sizes of the four alloys with 0, 0.1, 0.2, and 0.3 wt.% Y addition are 222.6 μm, 243.5 μm, 236.1 μm, and 307.8 μm, respectively. Thus, within the range of 0∼0.3 wt.%, the addition of Y promotes grains coarsening for the as-cast Al-Mg-Mn alloys. The coarsening of grain size is closely related to the degree of undercooling during solidification

IPF-Z orientation maps of the as-cast Al-Mg-Mn alloys with different Y contents. (a)Al-Mg-Mn; (b) Al-Mg-Mn-0.1Y; (c) Al-Mg-Mn-0.2Y; (d) Al-Mg-Mn-0.3Y.
To determine the degree of undercooling, the TG-DSC cooling tests were conducted on the alloys with different Y contents. The TG-DSC results of the alloys with different Y additions are shown in Figure 3. TG-DSC curves exhibit only one α-Al exothermic peak, with no other peaks detected, as shown in Figure 3. This indicates that the phase transformation of α-Al dominates the majority of the thermal effects during solidification. It is known that nucleation of α-Al from the liquid requires a certain degree of undercooling (ΔT), which can be expressed as
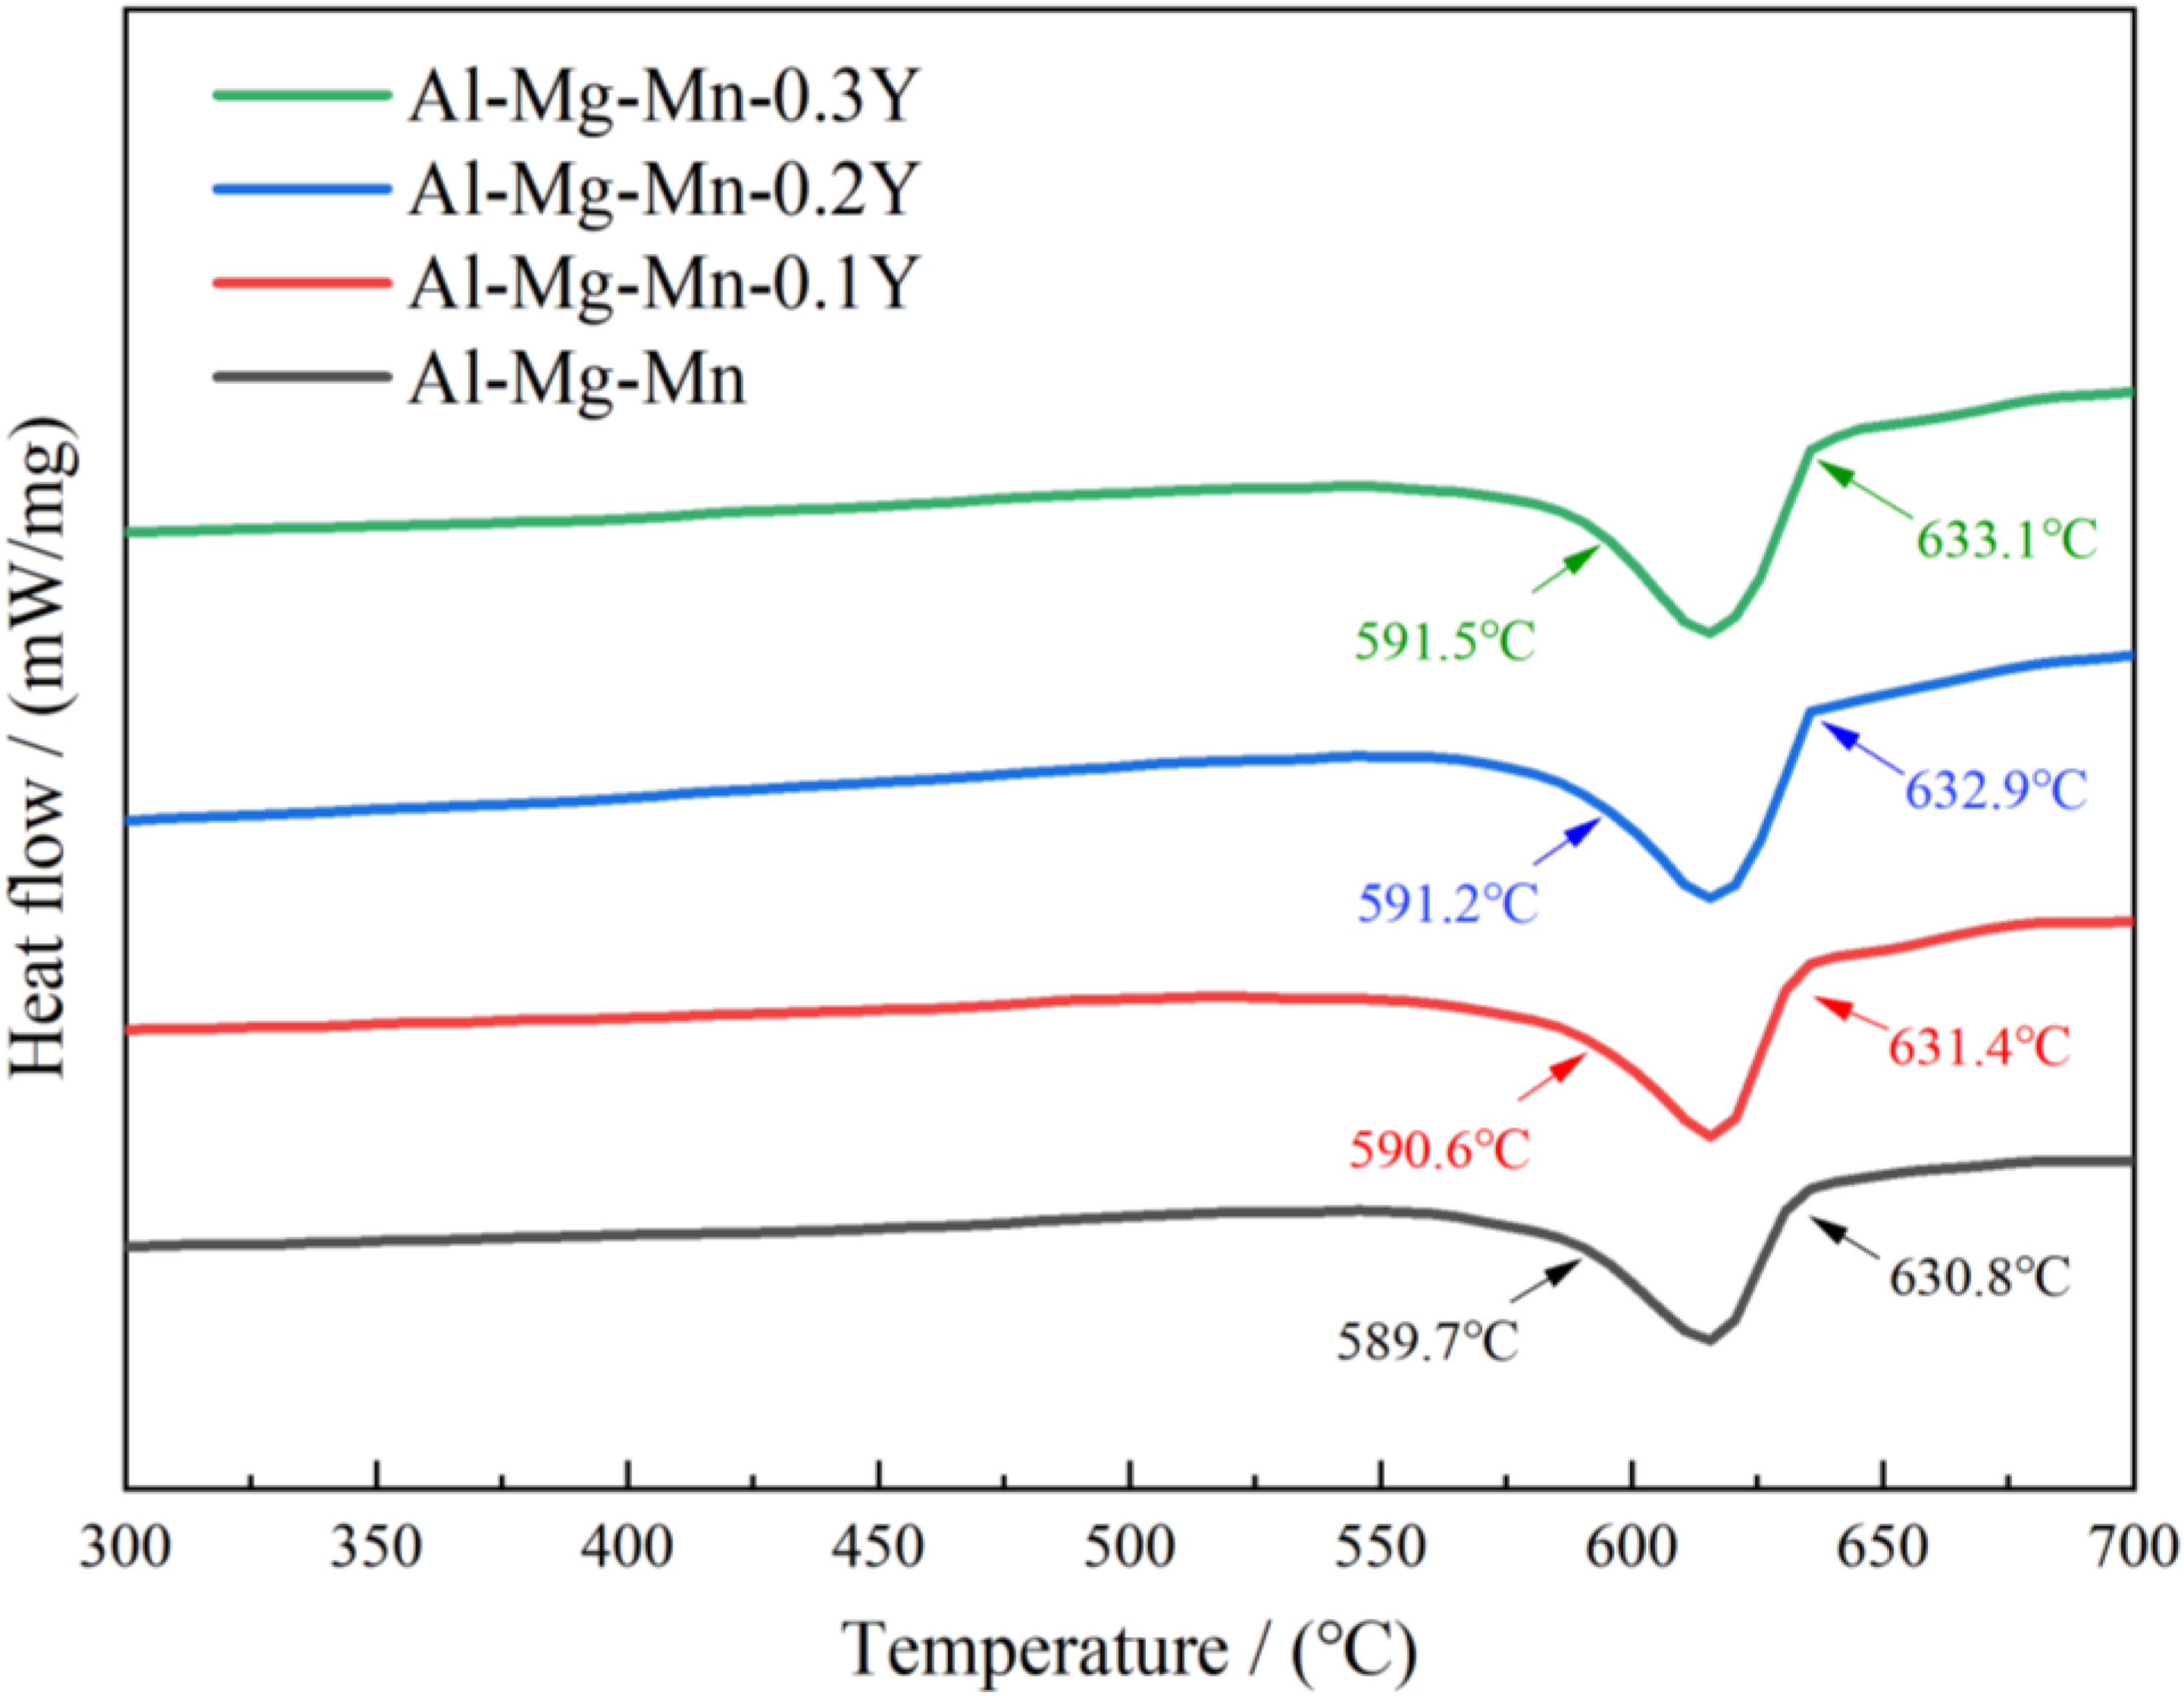
DSC cooling curves of the as-cast Al-Mg-Mn-xY alloys (x = 0, 0.1, 0.2, 0.3 wt.%).
To further elucidate the effect of Y content on the precipitates in the as-cast Al-Mg-Mn alloys, Figure 4 presents the morphology and distribution of the precipitates in the alloys with different Y contents. Table 2 lists the corresponding chemical compositions of these precipitates. By analyzing the compositions of multiple representative precipitates (A-G), the influence of Y on the types and compositional evolution of precipitates in the alloy can be discussed. Previous studies 25 indicated that β phase (Al3Mg2) and network-like Al-Mn-Fe intermetallic compounds are commonly present in the as-cast Al-Mg-Mn alloys, with Zn enrichment often observed within the β phase. Figure 4 indicates that phase A is enriched in Al, Mg, and Zn. According to the Al-Mg-Zn ternary phase diagram, no stable ternary phase with a comparable atomic ratio is documented. Therefore, this region is likely a phase formed by Zn dissolving into an Al-Mg phase. Given that the atomic radius of Zn (1.33 Å) is close to those of Al (1.43 Å) and Mg (1.60 Å), Zn atoms can dissolve into the Al-Mg phase via substitutional solid solution. The results of EPMA further show that the sum of atomic percentage ratio of Al and Zn to that of Mg is approximately 3:2, which is consistent with the stoichiometry of the β phase and also indicates that Zn partially replaces Al in the phase. 26 Therefore, this region can be identified as a (Al, Zn)3Mg2-type phase with a grayish-white color, and usually precipitated at grain boundaries. 27 In contrast, phase B exhibits a skeleton-like or blocky morphology. Its atomic percentage ratio of Al to (Fe + Mn) is approximately 4.7:1, which is close to the composition of the Al6(Fe, Mn) phase. Thus, phase B can be determined as a typical solid-solution intermetallic compound, the Al6(Fe, Mn) phase, which presents as a bright white precipitate. During the solidification of Al-Mg-Mn alloys, metastable α-Al solid solutions with varying Mg solubility typically form, and these can subsequently transform into β-phase precipitates during heating. 28 Phase C is primarily composed of Al, Fe, Mn and a small amount of Mg. Research work has shown that in aluminum alloys containing Fe and Mn, phases with similar elemental compositions are identified as the Al6(Fe, Mn) phase. 29 Consequently, this phase is confirmed to be Al6(Fe, Mn) phase.
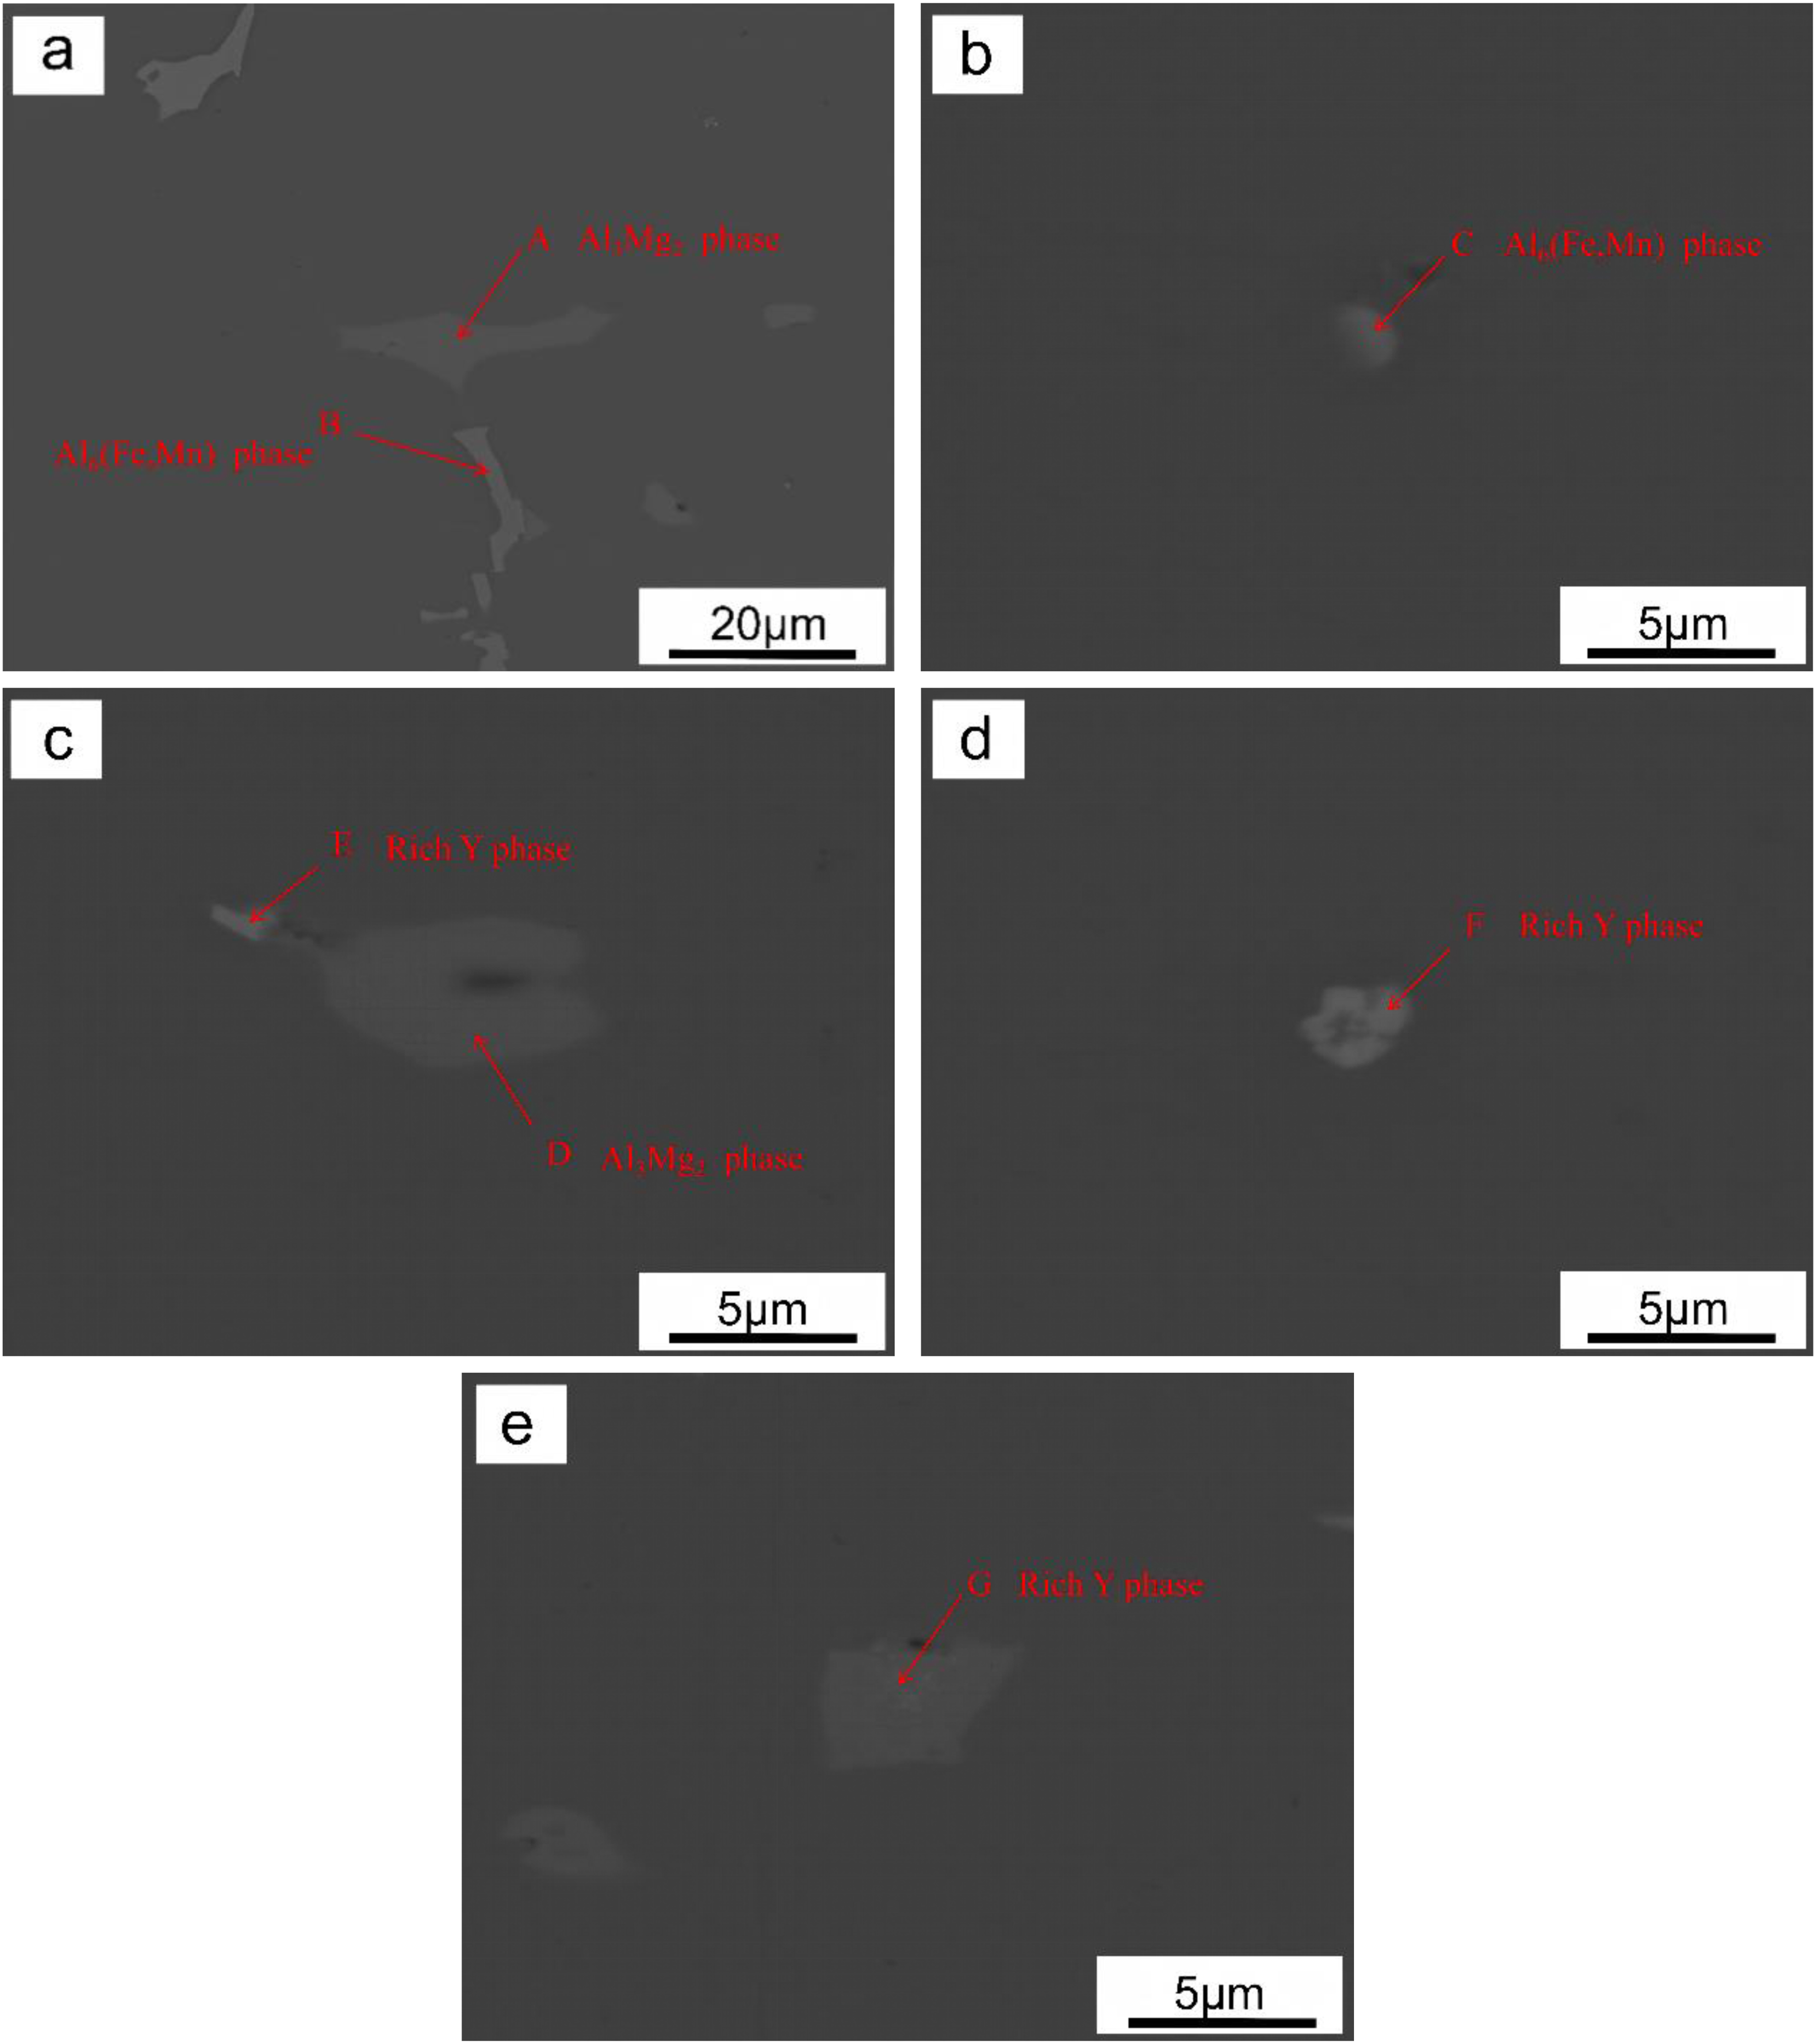
SEM images of the precipitates and determined by EPMA in the as-cast Al-Mg-Mn alloys without and with Y addition. (a) - (b) Y-free alloy; (c) - (e) Y-modified alloys.
Composition of the precipitates in the alloys with different Y contents (at%).
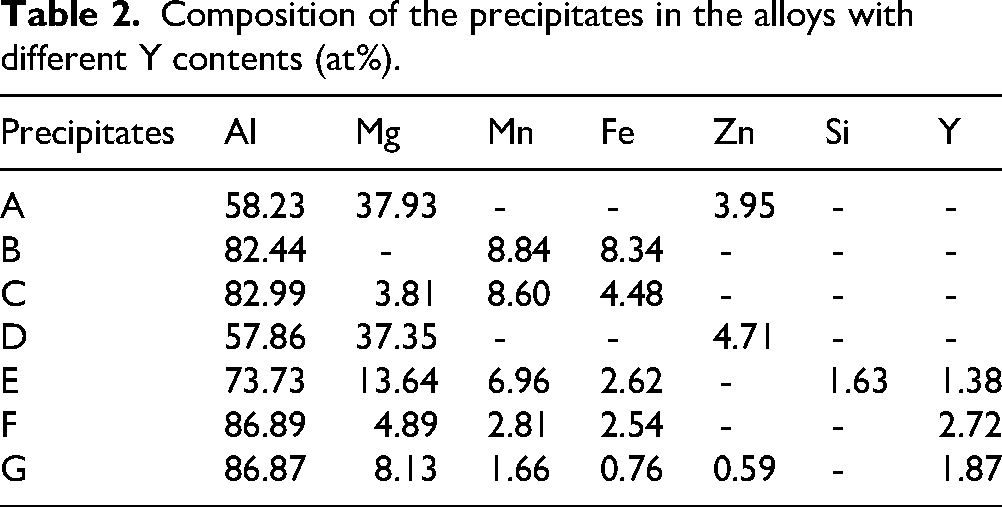
In alloys with difference Y contents (0.1, 0.2, and 0.3 wt.%), the composition of phase D is similar to that of phase A, which is the β phase (Al3Mg2 phase with dissolved Zn). In addition, phase E is enriched in Al (73.73%), Mg (13.64%), Mn (6.96%), Fe (2.62%), Si (1.63%), and Y (1.38%). Phase F is similar to phase E, but contain no Si. Due to the strong segregation tendency of Y during solidification in the alloys, it is more likely to form precipitated phases with other elements. Therefore, the aforementioned phases E, F, and G are all referred as Y-containing multi-component phases.
Furthermore, the variation in the number and size of Al3Mg2 phase with Y content is shown in Figure 5. Statistical analyses were performed using 3-5 images for each alloy to evaluate the number of Al3Mg2 phase to ensure the reliability of the data. The number of Al3Mg2 phase in the Figure 5 represents the median of the statistical counts. In the Y-free alloy (Figure 5(a)), the Al3Mg2 phase is densely distributed, with a counted number of 26 particles and exhibiting a size predominantly ranging from several tens to one hundred micrometers. After the addition of Y, both the number and size of the Al3Mg2 phase are decreased. As shown in Figure 5(b) to (d), the number of Al3Mg2 phase is reduced to 22, 13, and 9, respectively. When the addition of Y content is 0.1 wt.%, the volume fraction and size of Al3Mg2 phase almost does not exhibit a significant decrease. When the Y addition comes to 0.2 wt.%, the number of Al3Mg2 phase is markedly decreased, and its size is not significantly decreased. When Y addition is further increased to 0.3 wt.%, the number of larger Al3Mg2 phase diminishes significantly, and the size is significantly reduced.
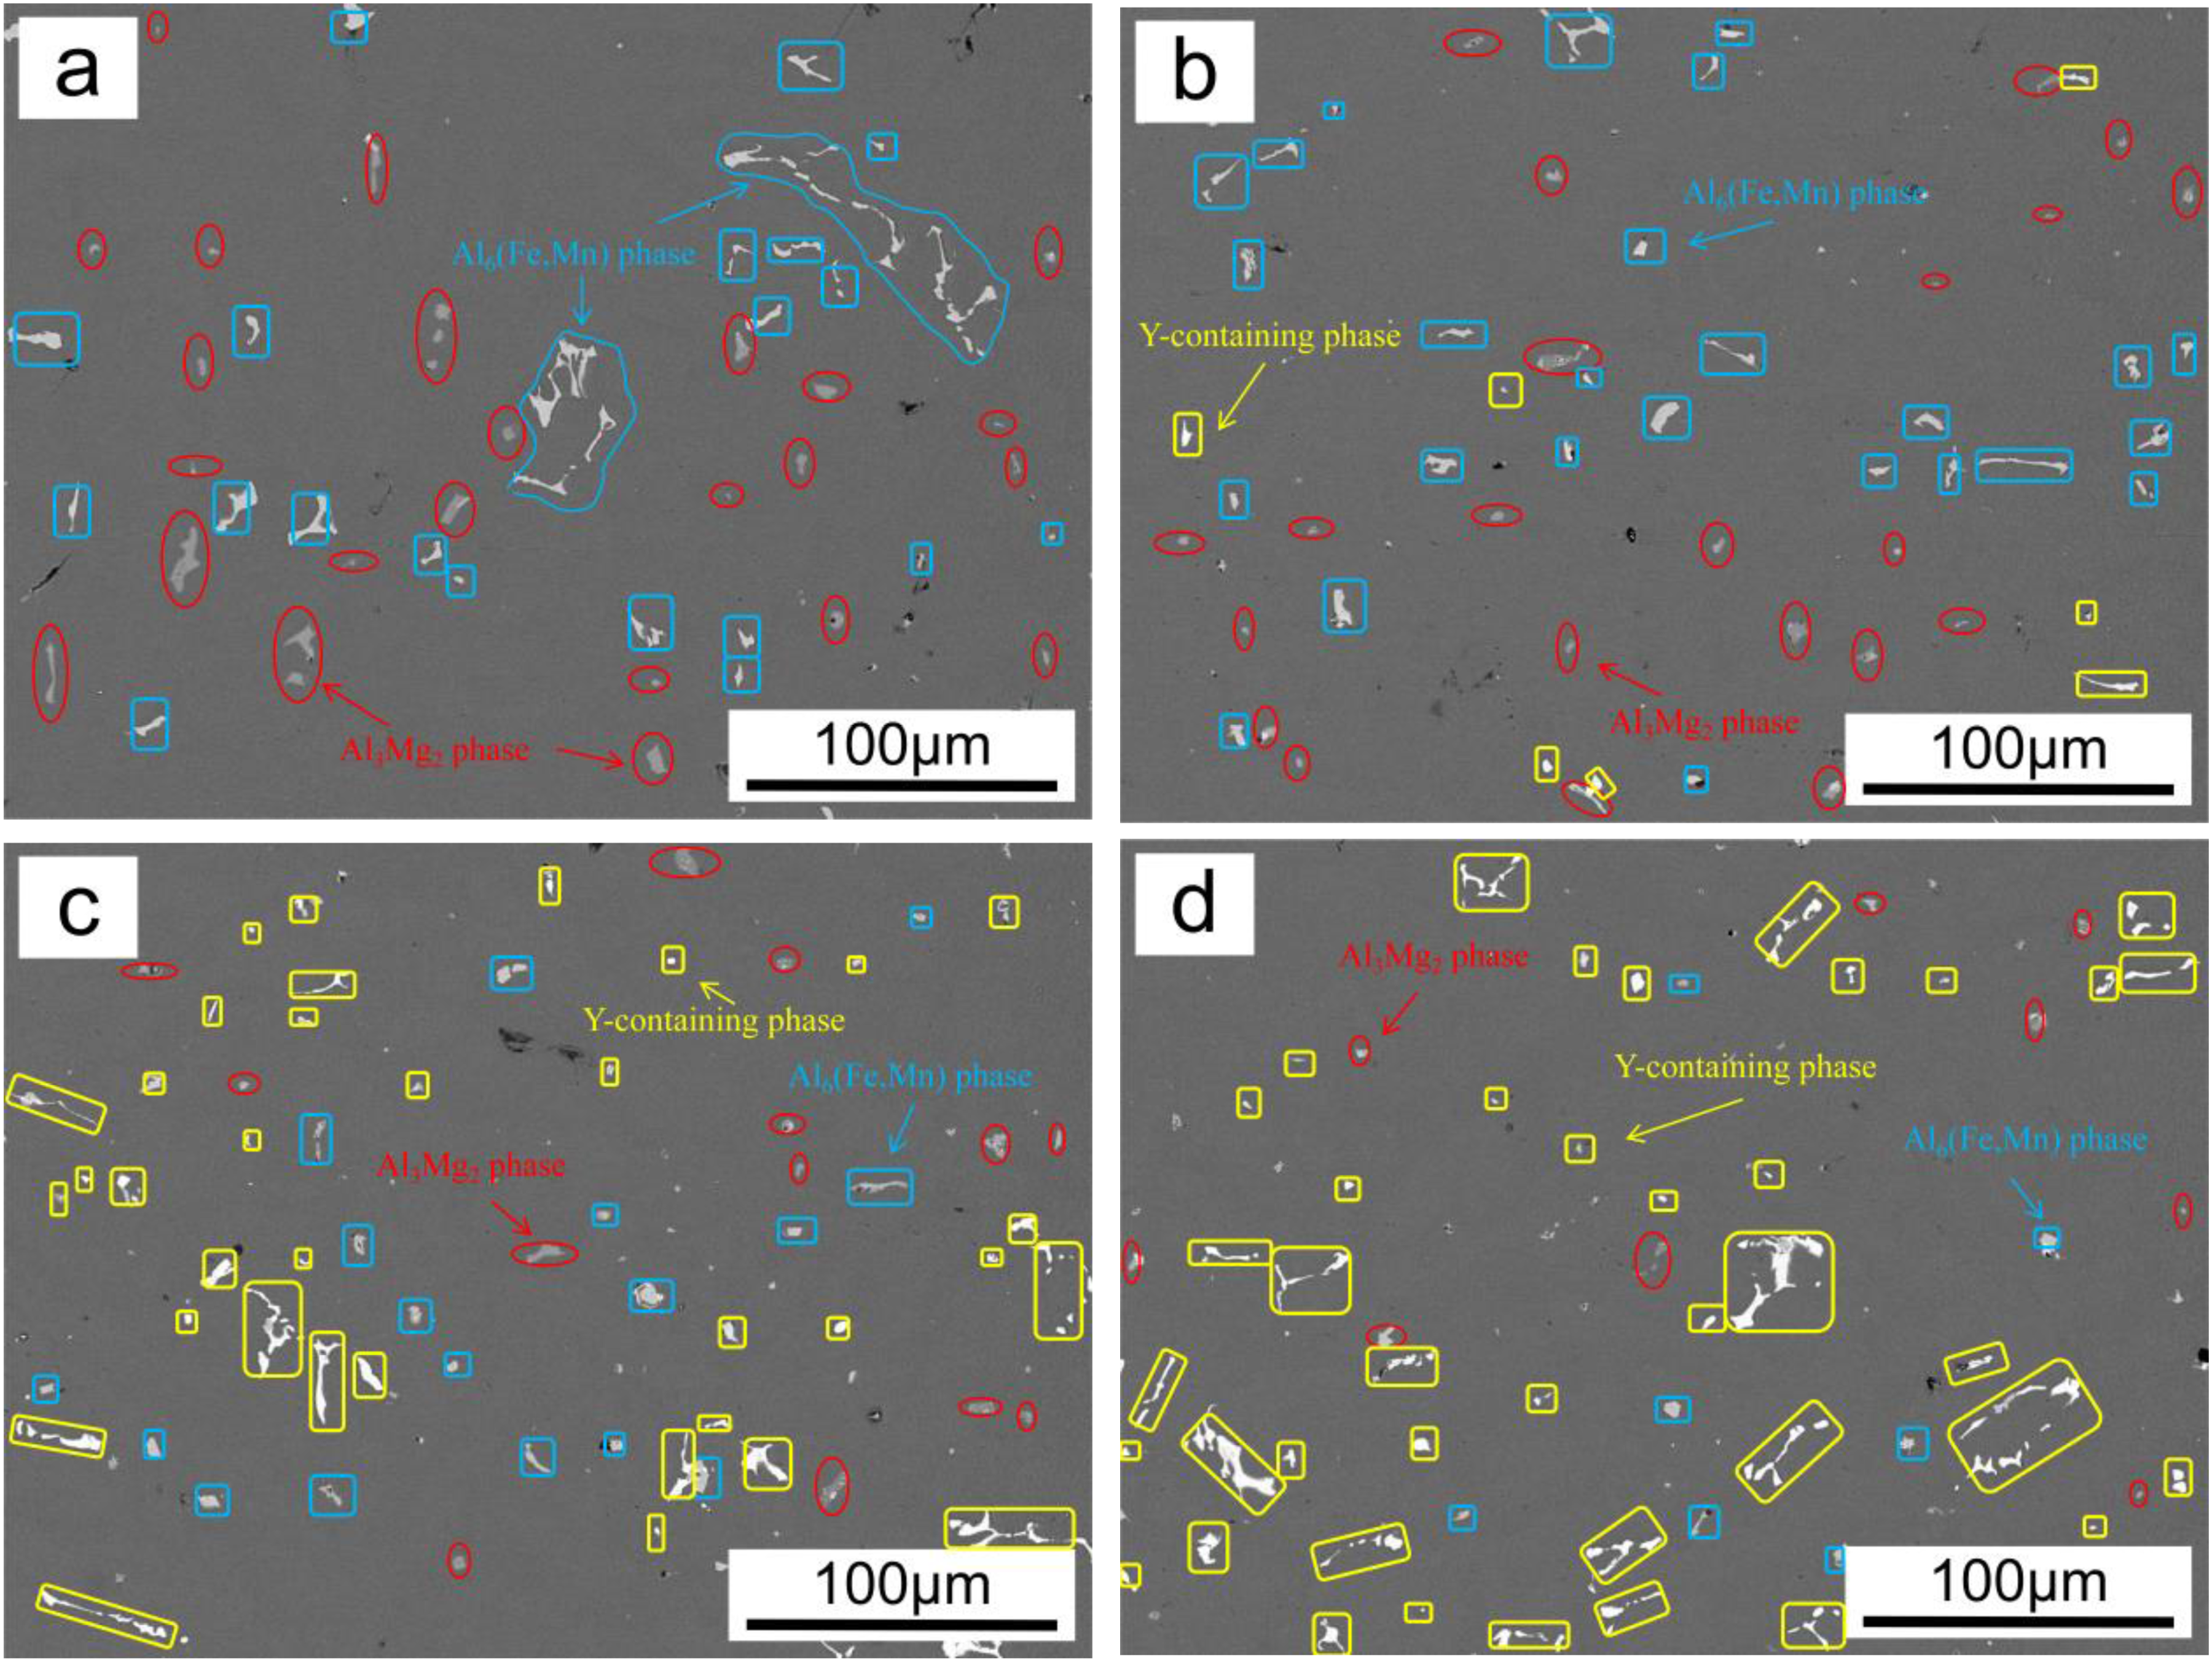
SEM images of Al3Mg2 phase distribution in the as-cast Al-Mg-Mn alloys with different Y contents. Red circle: Al3Mg2 phase; Blue circle: Al6(Fe, Mn) phase; Yellow circle: Y-containing phase. (a) Al-Mg-Mn; (b) Al-Mg-Mn-0.1Y; (c) Al-Mg-Mn-0.2Y; (d) Al-Mg-Mn-0.3Y.
In addition, the number and size of Al6(Fe, Mn) phase are also decreased with the increase of Y content. When no Y is added, the number of Al6(Fe, Mn) phase is 27 as shown in Figure 5(a), and the size of Al6(Fe, Mn) phase is relatively large about a few tens of microns. For the alloys with 0.1, 0.2, and 0.3 wt.% Y addition, the number of Al6(Fe, Mn) phase are gradually decreased to 26, 18 and 7, respectively, and the size is reduced, as shown in Figure 5(b) to (d). Meanwhile, for the alloys with 0.1, 0.2, and 0.3 wt.% Y addition, the number of Y-containing phase (bright white precipitated phase) is increased to about 7, 39, and 50, respectively.
In conclusion, the above results demonstrate that the addition of Y changes the solidification path of the alloy, so that Al6(Fe, Mn) phase and Al3Mg2 phase translate to the more stable Y-containing phase. Y, as a rare earth with high chemical activity and strong tendency to segregate, has a strong chemical affinity with Mg, Fe, and Si elements.30,31 During solidification, Y is preferentially enriched in the liquid phase at the solid-liquid interface, and preferentially reacts with impurity elements such as Fe and Si to form more stable Y-containing metallic compounds more stable than Al6(Fe, Mn) phase and Al3Mg2 phase. 32 Therefore, the formed Y-containing phases consume the Mg, Fe, and Si elements, thereby decreasing the number of Al6(Fe, Mn) and Al3Mg2 phases.
Effect of Y content on the corrosion resistance
Figure 6 presents the potentiodynamic polarization curves of as-cast Al-Mg-Mn-xY alloys (x = 0, 0.1, 0.2, and 0.3) in the 3.5 wt.% NaCl solution, with the corresponding electrochemical parameters listed in Table 3. The corrosion current density (icorr) reflects the corrosion rate, and a higher icorr indicates more severe corrosion. The corrosion potential (Ecorr) evaluates the corrosion susceptibility, with more negative Ecorr values suggesting higher corrosion susceptibility. Meanwhile, a higher polarization resistance (Rp) signifies better corrosion resistance. As observed in Figure 6, the polarization curves of the four alloys exhibit similar shapes, and none show distinct passivation plateaus. Thus, the as-cast Al-Mg-Mn alloys do not form a dense passivation film in 3.5 wt.% NaCl solution. With the increase of Y content, the icorr is first increased from 2.633 × 10⁻⁶A·cm-2 to 4.716 × 10⁻⁶A·cm-2 and then is decreased to 1.597 × 10⁻⁷A·cm-2. When the Y content is 0.1 wt.%, the increase in icorr may be due to the increase in the number of phases as cathodes. In contrast, the sharp decrease in icorr in the alloy with 0.3 wt.% Y indicates significant suppression of corrosion activity. Furthermore, the Ecorr reaches its most negative value at 0.2 wt.% Y, indicating the highest corrosion susceptibility, while the alloy with 0.3 wt.% Y exhibits the most positive Ecorr. Combined with its lowest icorr and highest Rp, the alloy with 0.3 wt.% Y demonstrates the best overall corrosion resistance among the tested four alloys.
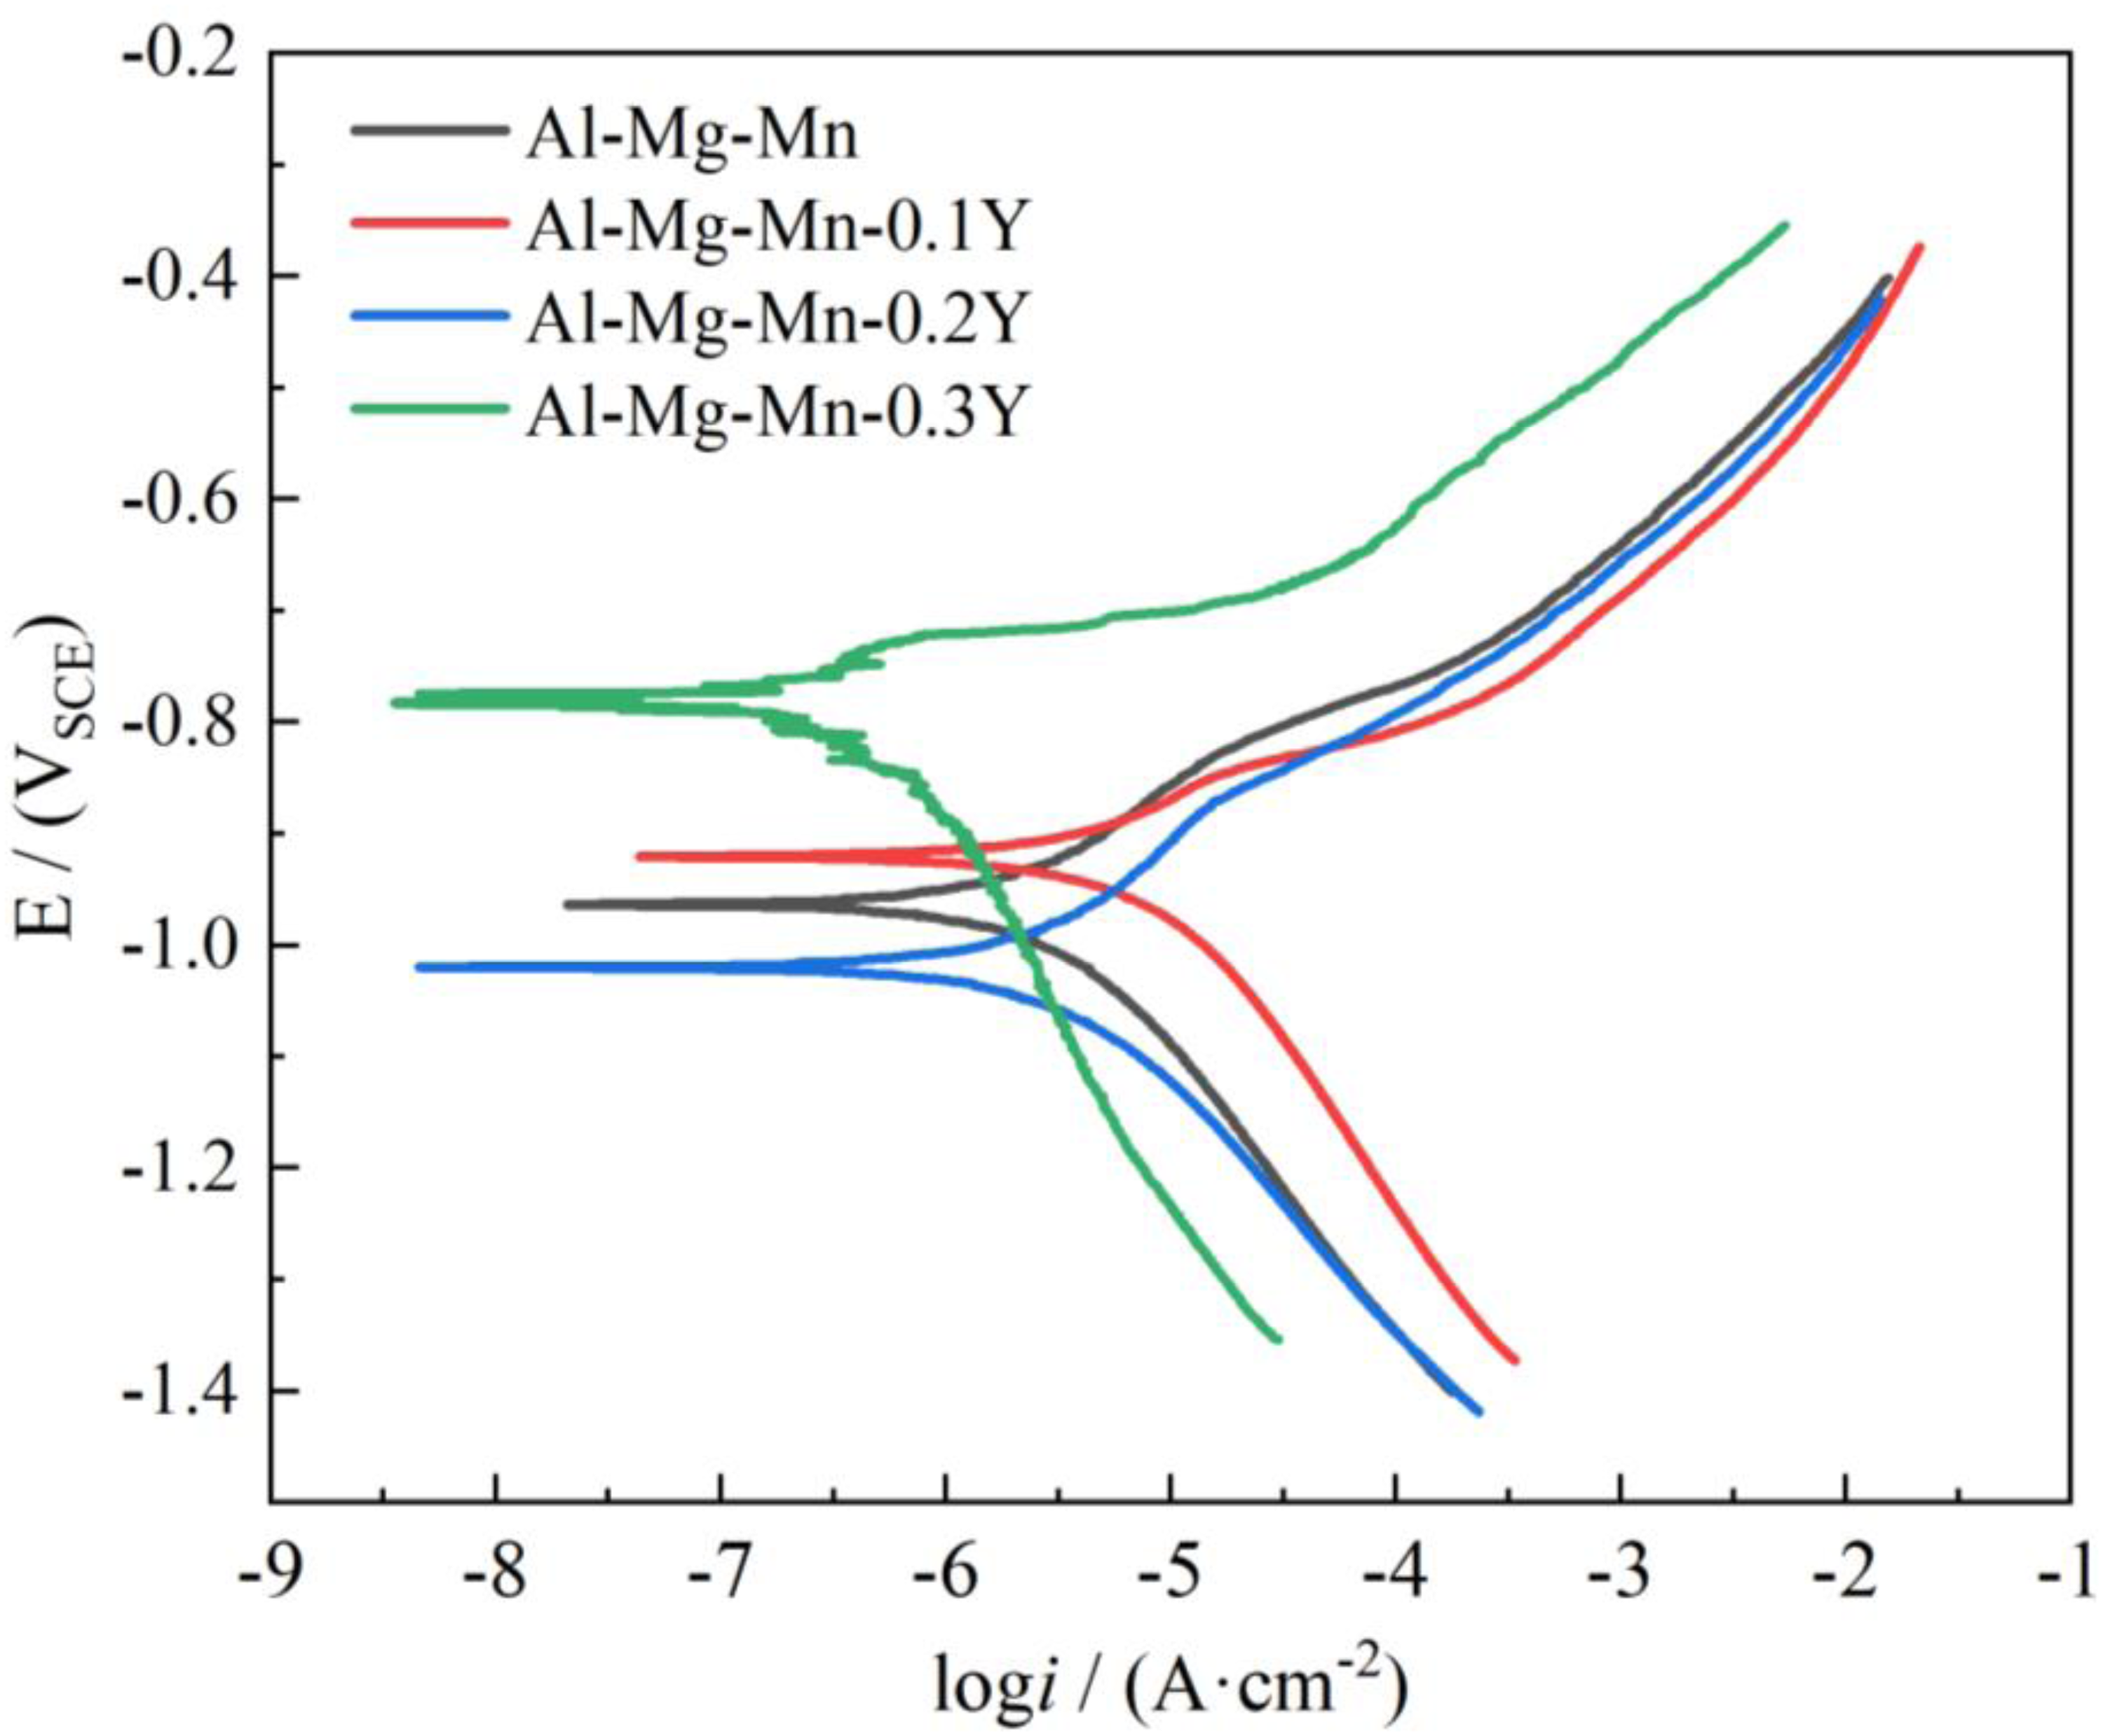
Potentiodynamic polarization curves of the as-cast Al-Mg-Mn-xY (x = 0, 0.1, 0.2, 0.3) alloys in 3.5 wt.% NaCl solution.
Electrochemical parameters derived from the potentiodynamic polarization curves.
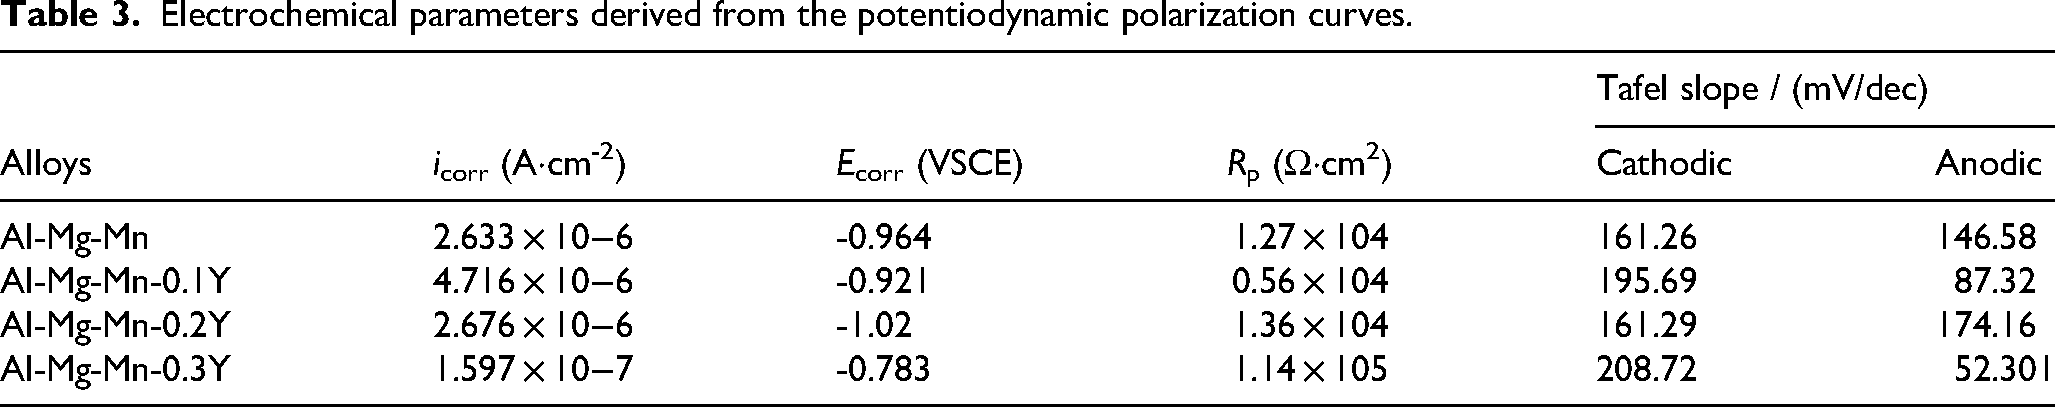
In addition, according to the Tafel slope analysis in Table 3, the corrosion mechanism of Al-Mg-Mn-xY alloy can be further elucidated. For Al-Mg-Mn alloys, the anodic Tafel slope is 146.6 mV/dec and the cathodic Tafel slope is 161.3 mV/dec, indicating that the kinetics of anodic dissolution and cathodic reduction reaction are relatively balanced during corrosion. When the Y content is 0.1 wt.%, the anodic Tafel slope is significantly decreased to 87.3 mV/dec, indicating that the anodic dissolution process is accelerated, consistent with the observed the increase of icorr. Although the cathodic Tafel slope is increased to 195.7 mV/dec, implying some inhibition of the cathodic reaction, the overall corrosion rate is still dominated by the enhanced corrosion process, which may be attributed to the formation of additional galvanic cells. When the Y content reaches 0.2 wt.%, the anodic Tafel slope is increased to 174.2 mV/dec, indicating that anodic dissolution becomes more difficult, while the cathodic Tafel slope remains almost constant (161.3 mV/dec). The corrosion resistance is improved compared with Al-Mg-Mn-0.1Y alloy. Notably, for the alloy containing 0.3 wt.% Y, the anodic Tafel slope drops sharply to 52.3 mV/dec, indicating a significant acceleration of anodic dissolution kinetics. However, the cathodic Tafel slope is increased to 208.7 mV/dec simultaneously, the highest value among all the tested alloys, indicating that the cathodic reaction is strongly inhibited. Thus, despite the enhanced anodic activity, the severely inhibited cathodic reaction causes the icorr to drop sharply to 1.597 × 10⁻⁷ A·cm-2, the lowest value among the four alloys. In summary, the excellent corrosion resistance of the Al-Mg-Mn-0.3Y alloy is mainly attributed to the significant inhibition of cathodic reaction, rather than the formation of passivation film or the inhibition of anodic dissolution.
Figure 7 displays the evolution of corrosion morphologies of as-cast Al-Mg-Mn alloys with different Y contents under various salt spray exposure times (top to bottom: 0, 24 and 48 hours). With the increase of salt spray time, the corrosion degree of the alloys with different Y contents is aggravated, and the corrosion products are increased correspondingly.
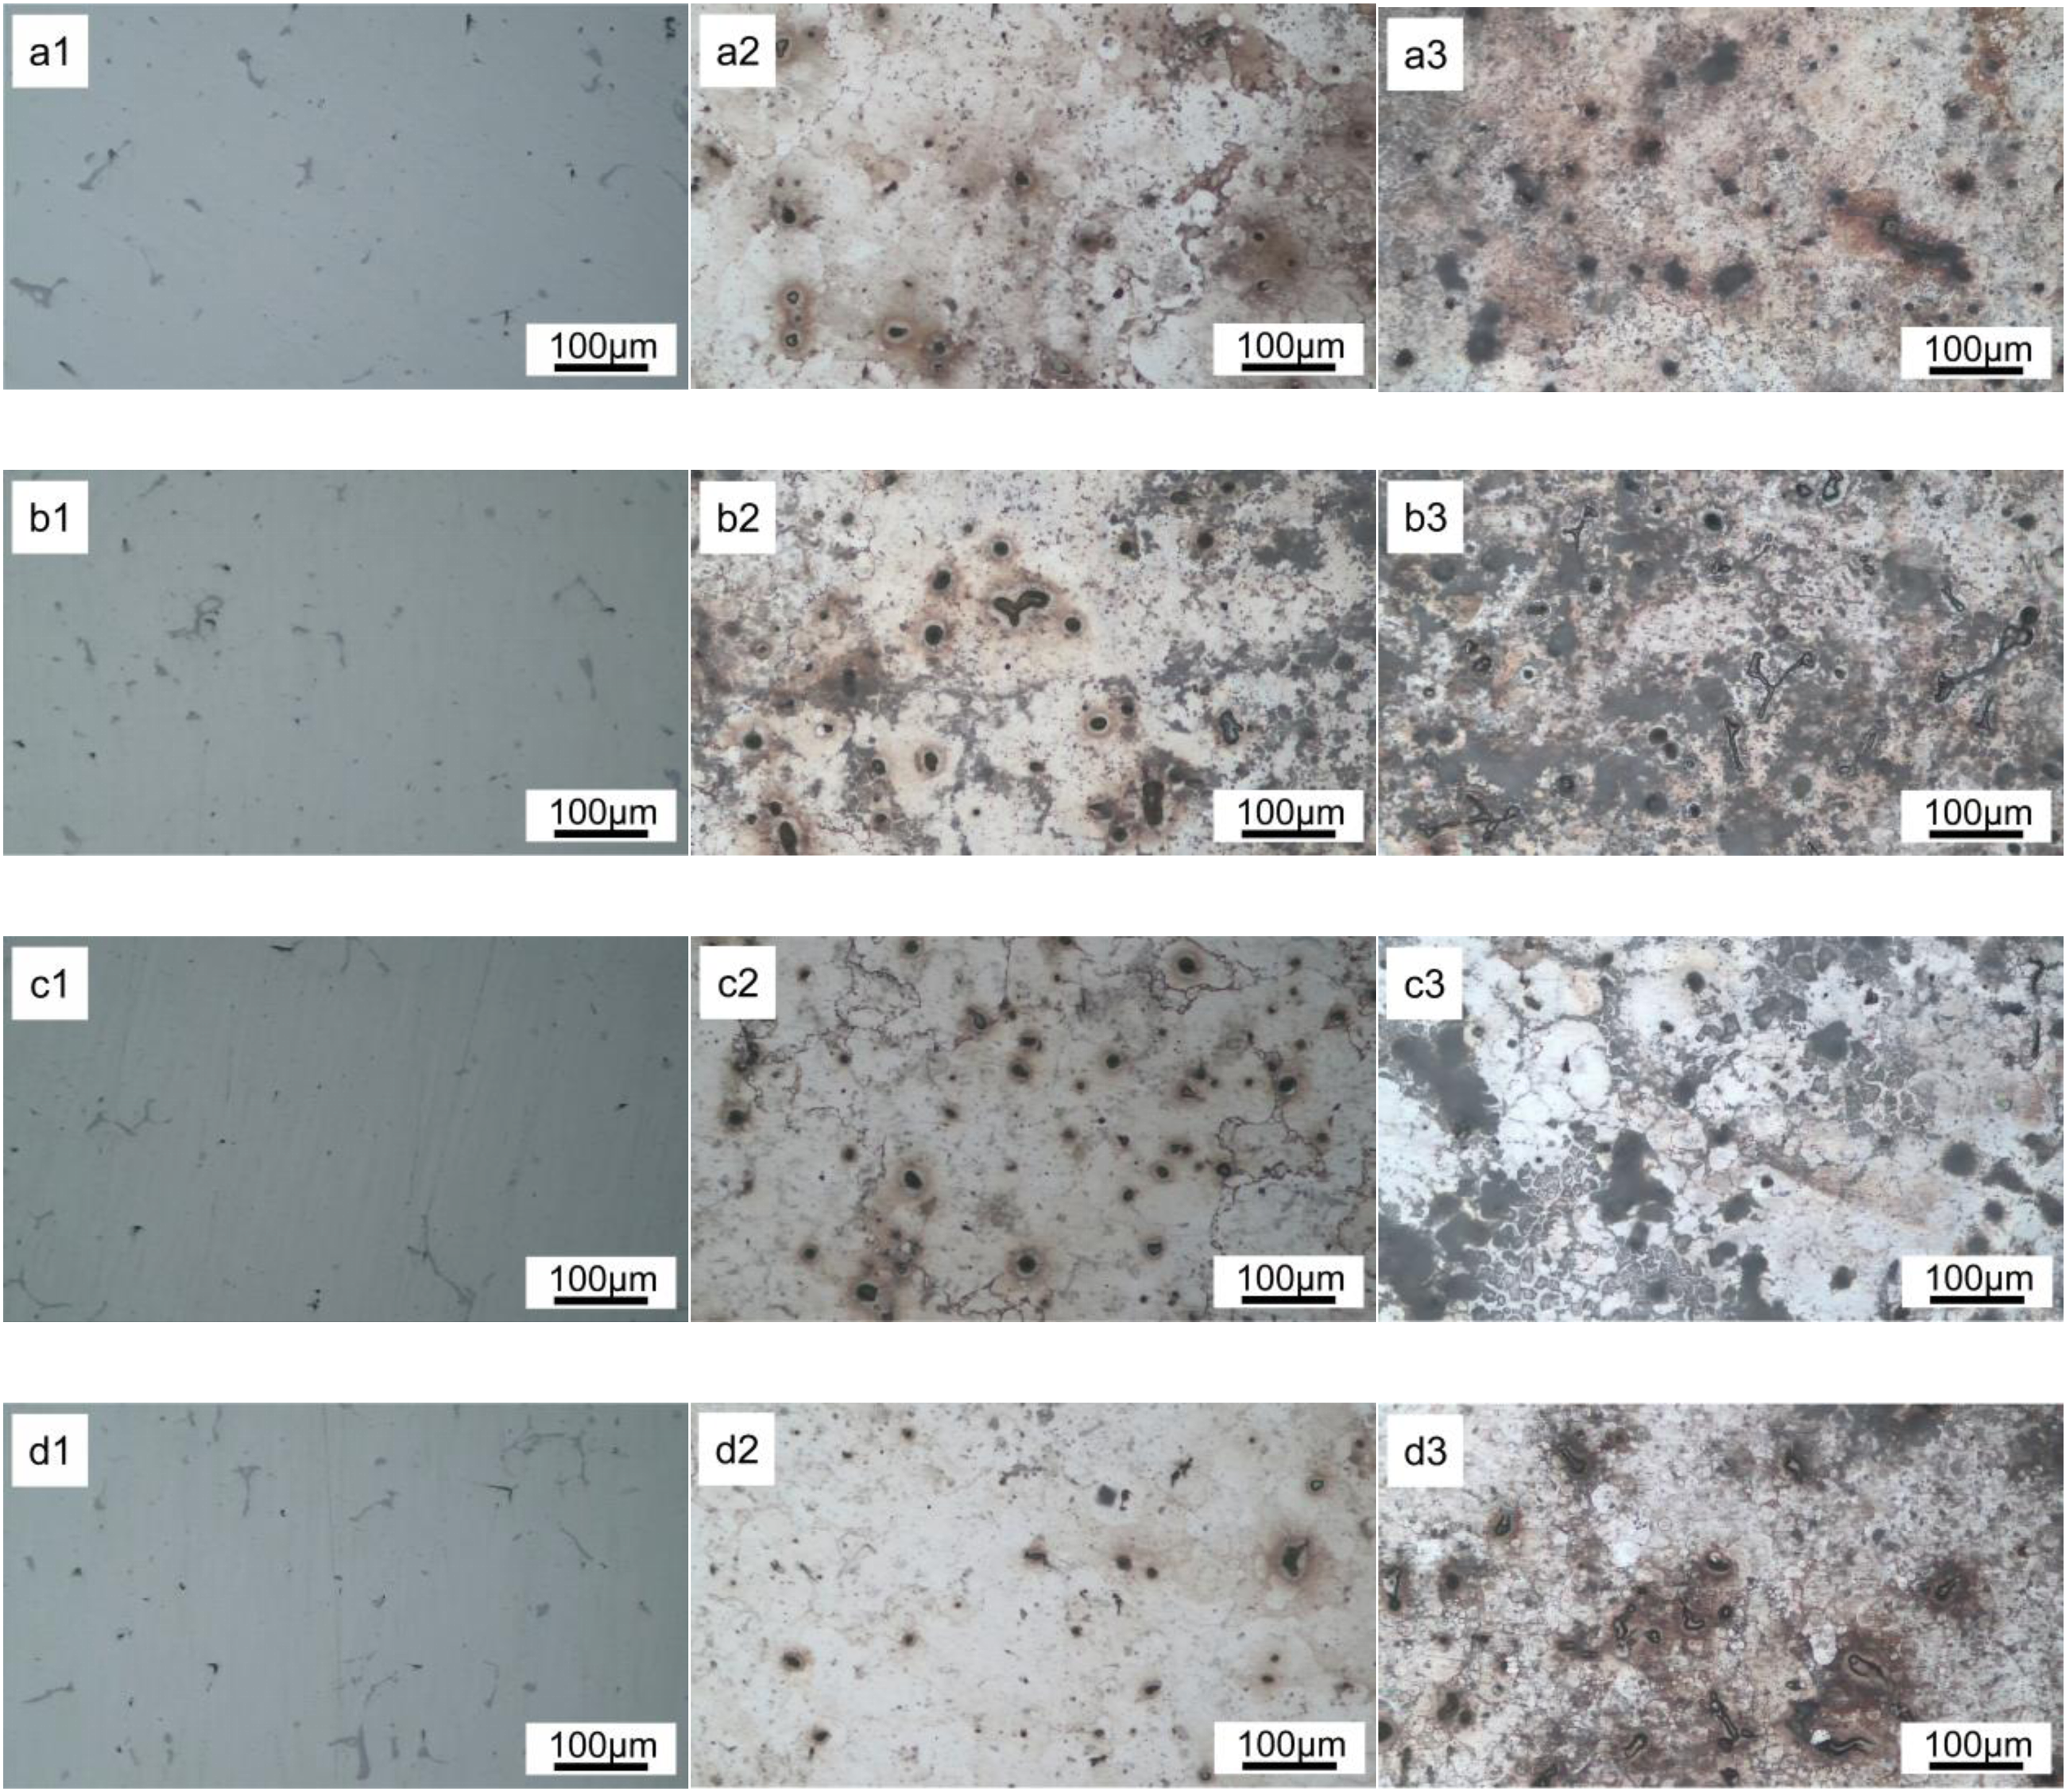
Optical micrographs of the as-cast Al-Mg-Mn alloys with different Y contents after salt spray exposure. Rows: exposure time for 0, 24, and 48 h, Columns: (a1) ∼ (a3) Al-Mg-Mn; (b1) ∼ (b3) Al-Mg-Mn-0.1Y; (c1) ∼ (c3) Al-Mg-Mn-0.2Y; (d1) ∼ (d3) Al-Mg-Mn-0.3Y.
In the Y-free alloy (Figure 7a1∼a3), until 24 h (Figure 7 a2), the pitting corrosion is formed, and the corrosion products are gradually increased and adhered to the surface of the alloy. When the salt spray time comes to 48 h (Figure 7 a3), a large number of pitting corrosion pits and corrosion products appear on the surface, and the size of some pitting pits is increased. Combined with the above polarization curves, the alloy does not form a dense passivation film, and Cl- can cause corrosion to continue. For the Y-containing alloys, when the salt spray time is 24 h, pitting and corrosion products of varying severity are also formed. For the alloy with 0.1 wt.% Y (Figure 7 b2), the pitting corrosion is gradually intensified with the increase of exposure time, and the performance is more sever than the yttrium-free alloys, which is consistent with the icorr in the potentiodynamic polarization curves. However, when the Y content is increased to 0.2 wt.%, after exposure to the corrosive medium for 24 h (Figure 7 c2), the number of the pitting corrosion pits on the surface is higher than that the alloy with 0.1 wt.% Y, which may be related to the most negative result of Ecorr in the polarization curve. This will be discussed according to the XPS results. After 48 h exposure as shown in (Figure 7 c3), the size of the pits is increased. It is worth noting that when the Y content is further increased to 0.3 wt.%, there are only a few small pitting appear on the surface as the salt spray time increases (Figure 7 d2). When the salt spray time is increased to 48 h (Figure 7 d3), although there are corrosion products, a large area of corrosion products cannot be observed, indicating that the pitting corrosion is significantly inhibited.
In order to comprehensively evaluate the effect of Y on the corrosion behavior of as-cast Al-Mg-Mn alloys, the weight loss experiments were performed. The weight loss reflects the intergranular corrosion rate of a material in a certain corrosive medium. Figure 8 shows the weight loss results of Al-Mg-Mn alloys with different Y contents, and the detailed data are shown in Table 4. The weight loss per unit area W was calculated by the following equation
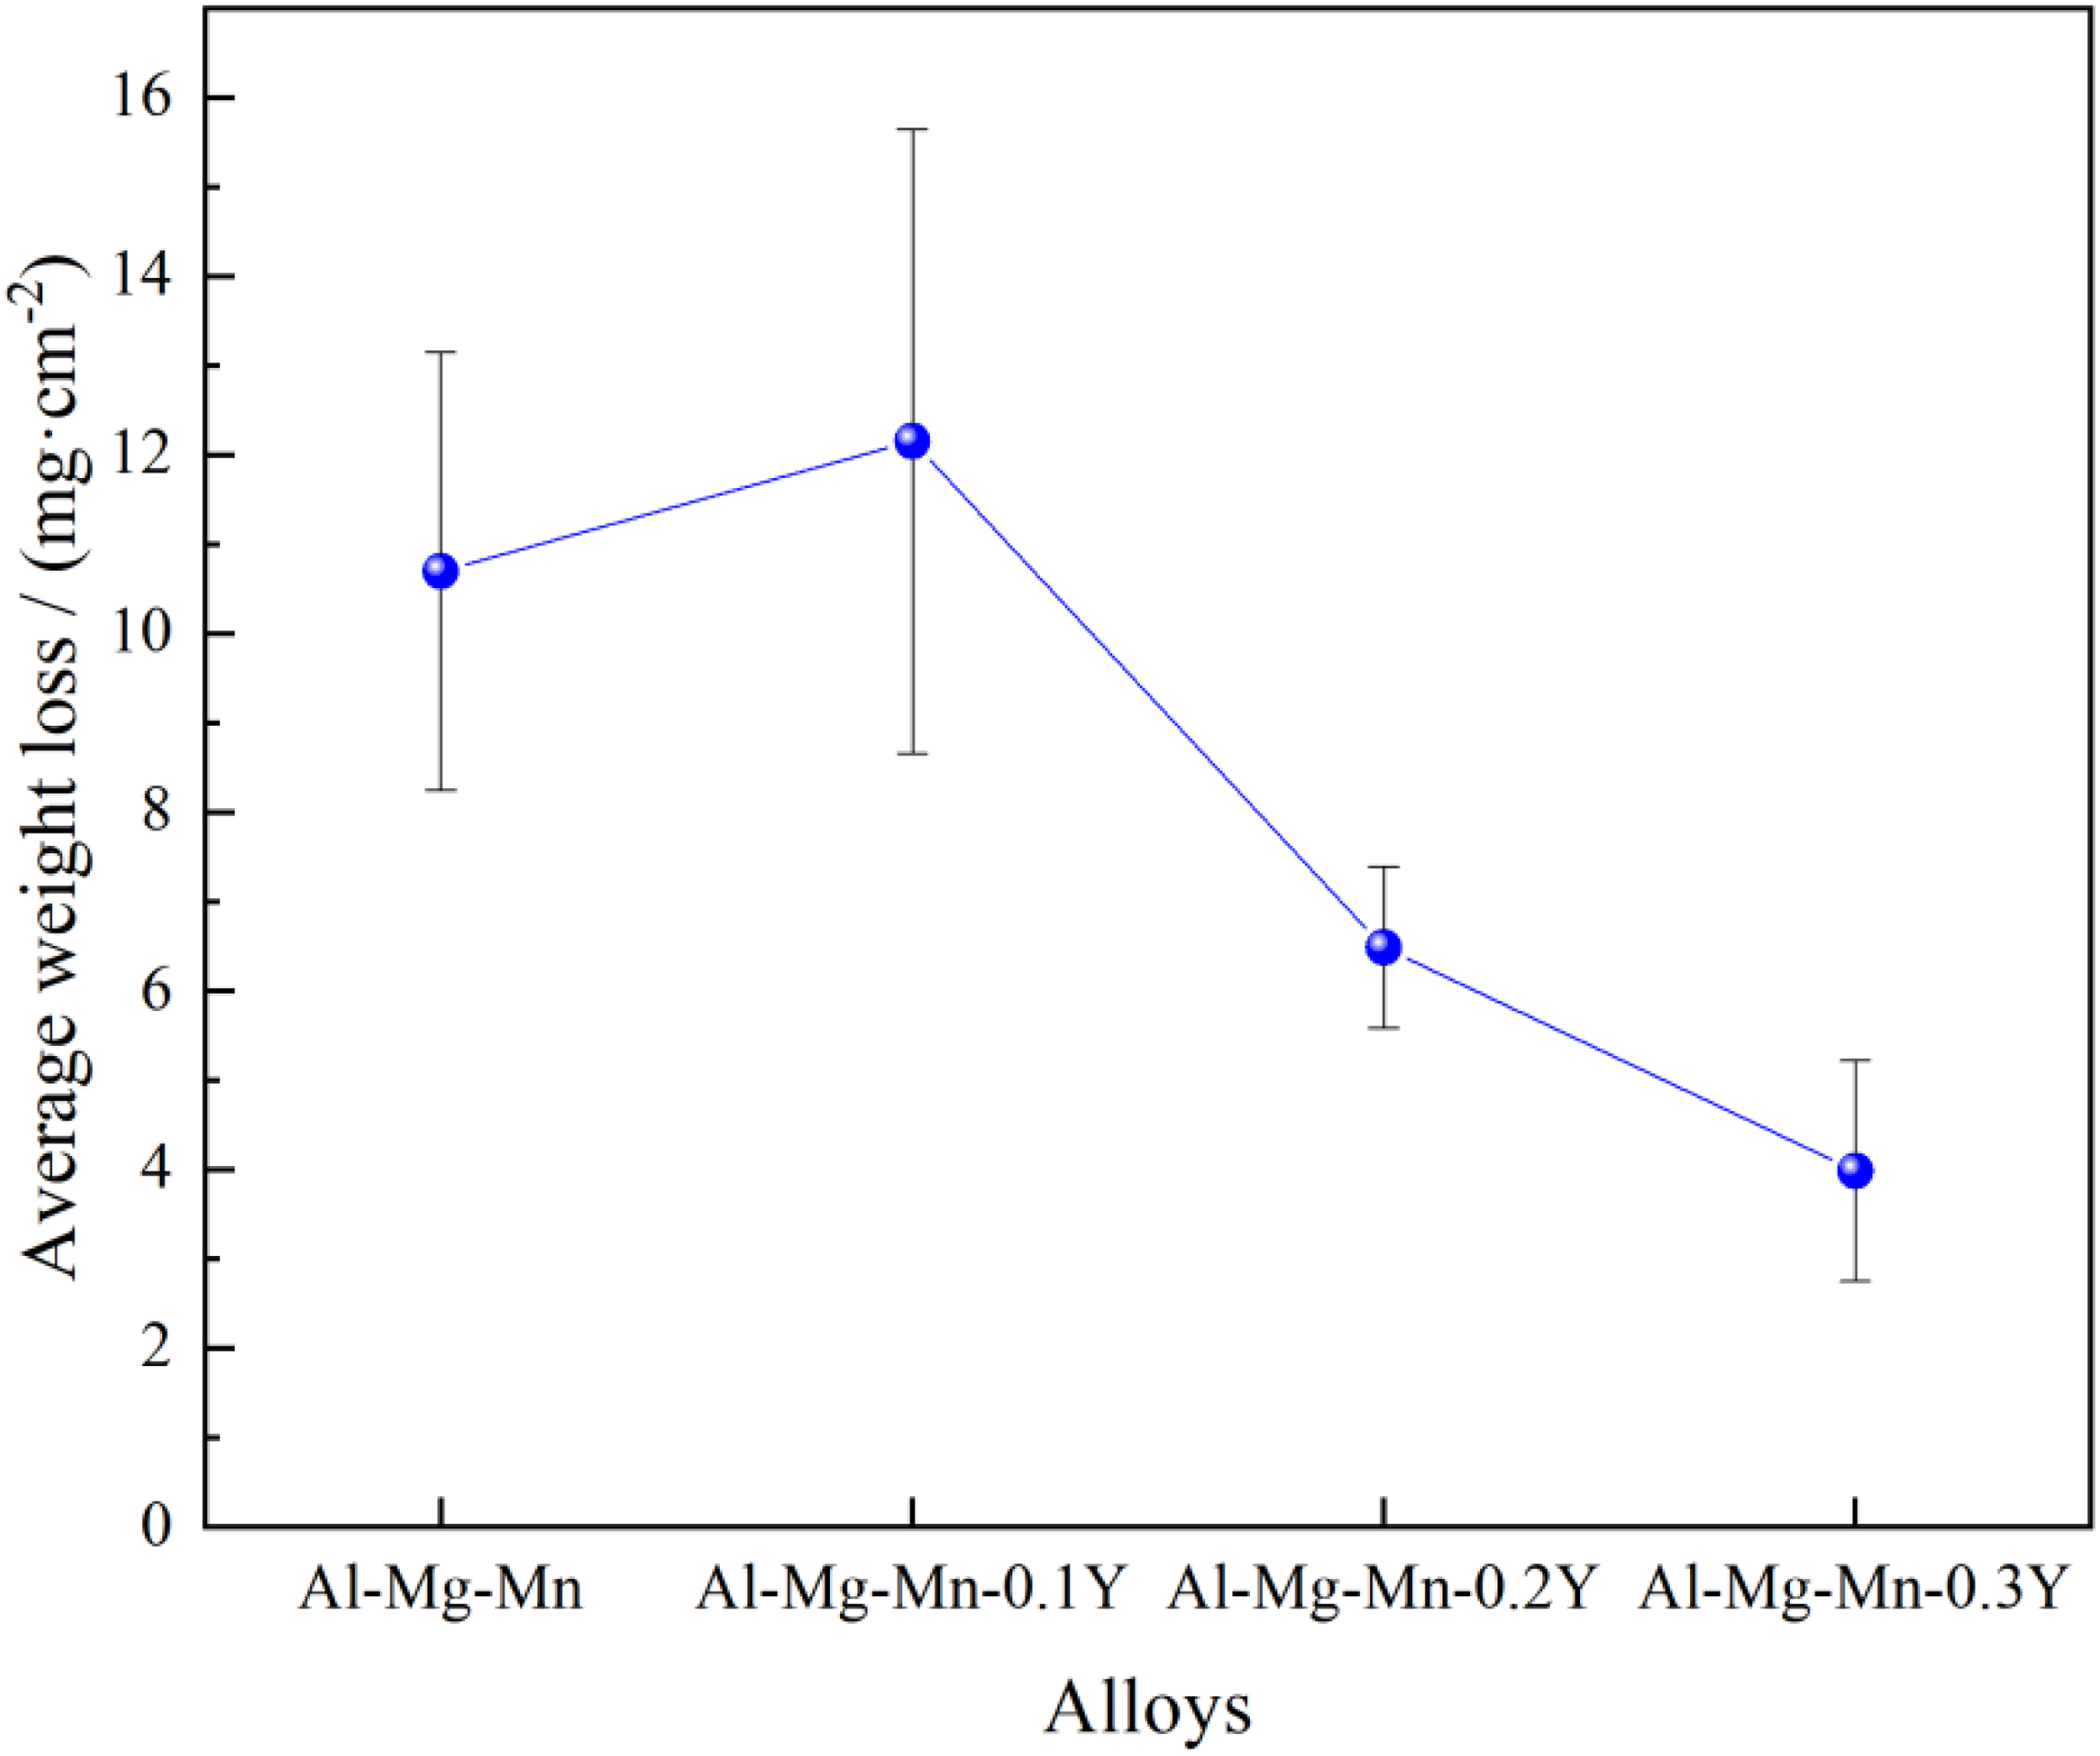
Weight loss curve in as-cast Al-Mg-Mn alloys with different Y contents.
Experimentally measured weight loss of the alloys.
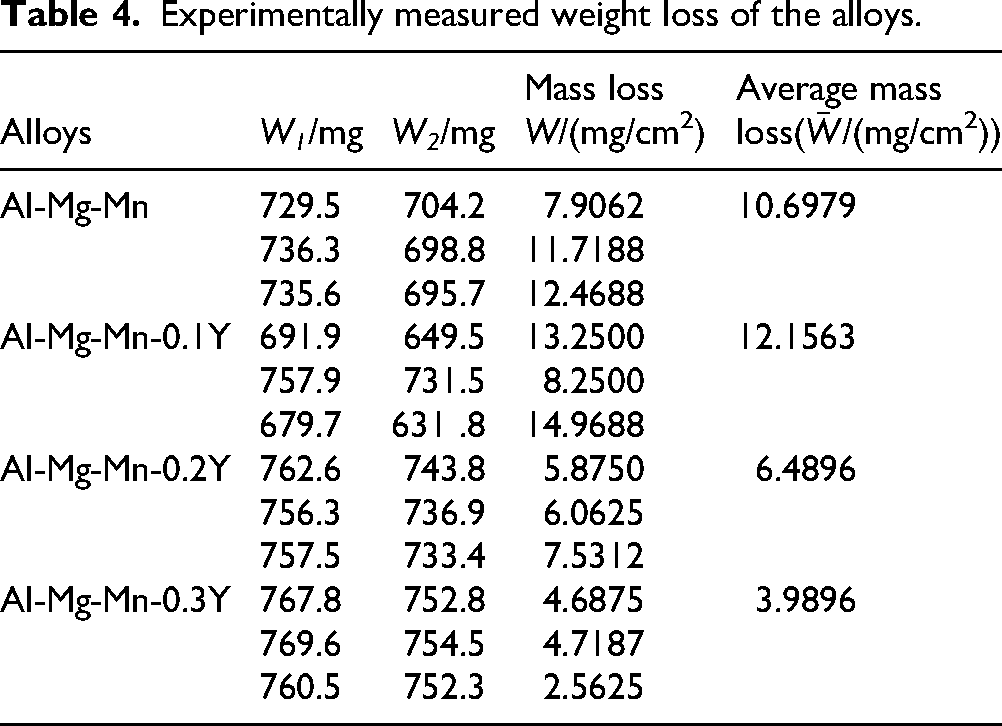
As shown in Figure 8, the average weight loss per unit area
It has been reported that coarse grain leads to the reduction of grain boundary density in the non-passivating environment, which is beneficial to improving corrosion resistance.33,34 When the addition of Y content is 0.1 wt.%, the number of grain boundaries due to grain coarsening is decreased without passivation film protection, while the volume fraction of Al3Mg2 phase does not decrease significantly, which will increase the density of the Al3Mg2 phase at the grain boundary, making it easier for corrosion to occur at the grain boundaries to result in an increase in the corrosion rate between grain boundaries. When the Y content is increased to 0.2 and 0.3 wt.%, the intergranular corrosion rate is gradually decreased due to the significant decrease of the Al3Mg2 phase and the decrease in the number of grain boundaries due to grain coarsening.
To investigate the effect mechanism of Y addition on the corrosion behavior of the as-cast Al-Mg-Mn alloys, Figures 9 to 11 present the morphological characteristics and contact potential difference (VCPD) of Al3Mg2 phase, Al6(Fe, Mn) phase, and Y-containing phase. The contact potential difference between the sample and the tip can be directly measured using the KPFM technique.35–37 The measured contact potential difference between the sample and the tip is defined by the following equation (3)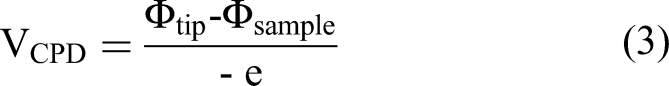
(a) AFM morphology of Al3Mg2 phase; (b) KPFM image; (c) Line profile taken from the line on (b) across Al3Mg2 phase and the surrounding α-Al matrix.
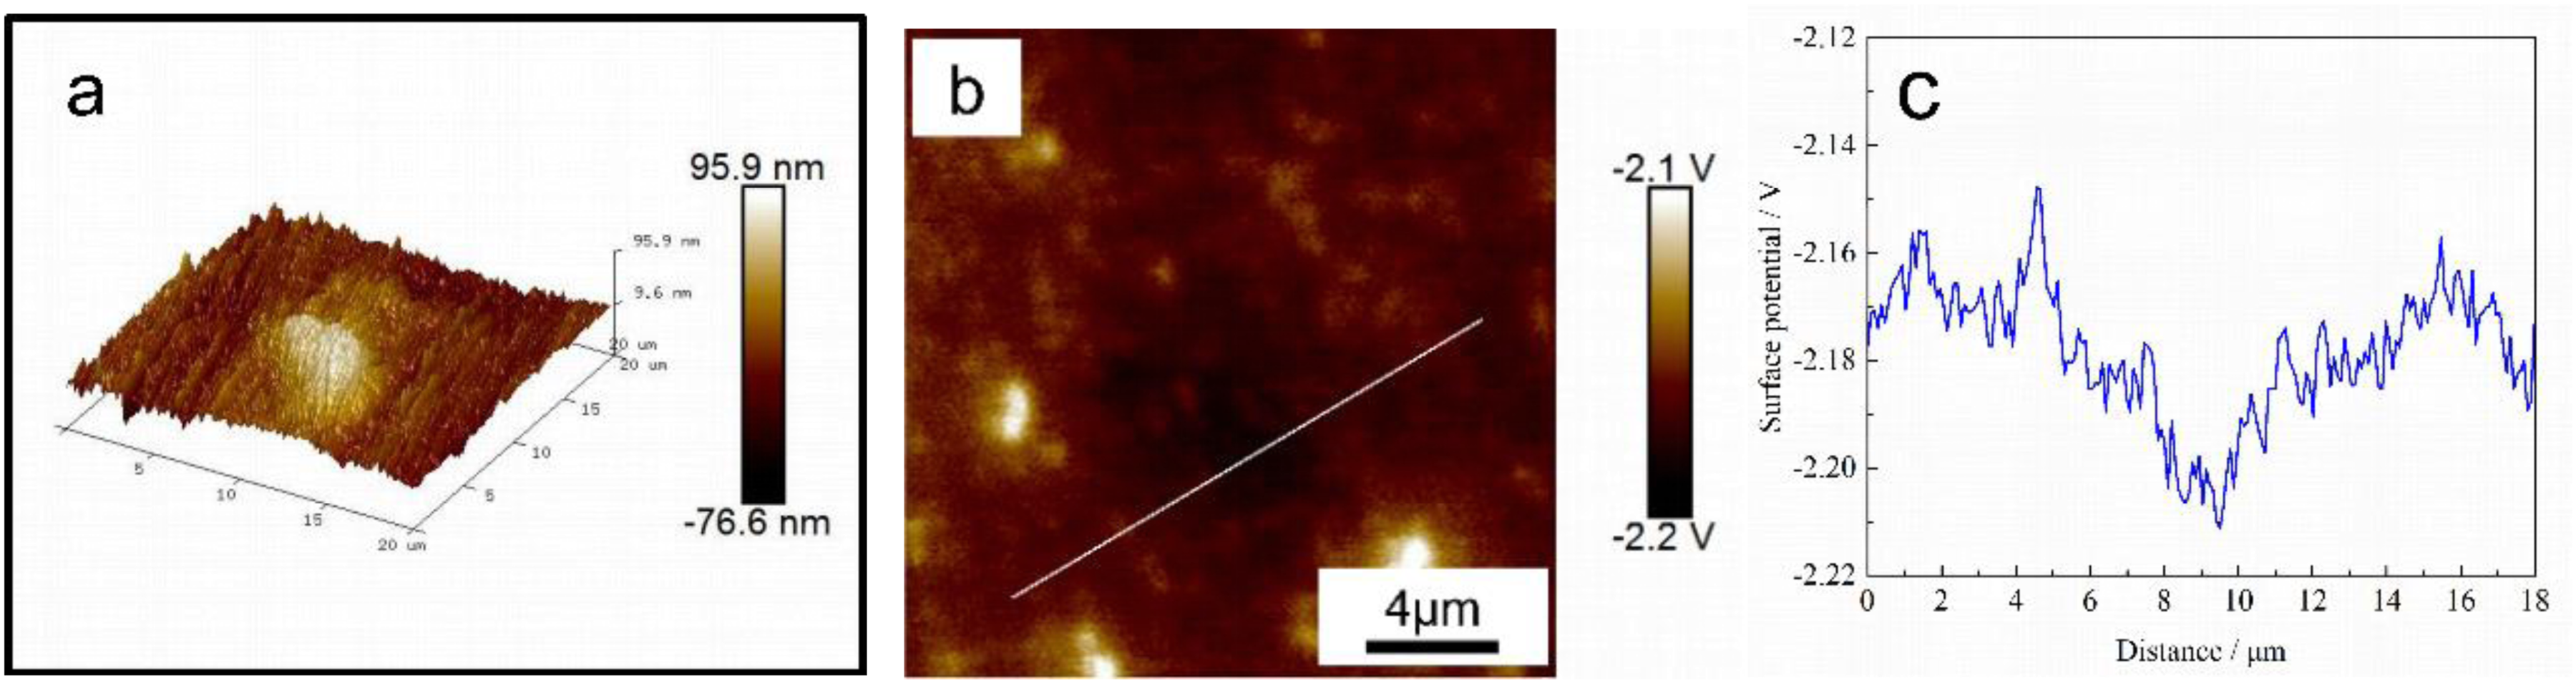
(a) AFM morphology of Al6(Fe, Mn) phase; (b) KPFM image; (c) Line profile taken from the line on (b) across Al6(Fe, Mn) phase and the surrounding α-Al matrix.
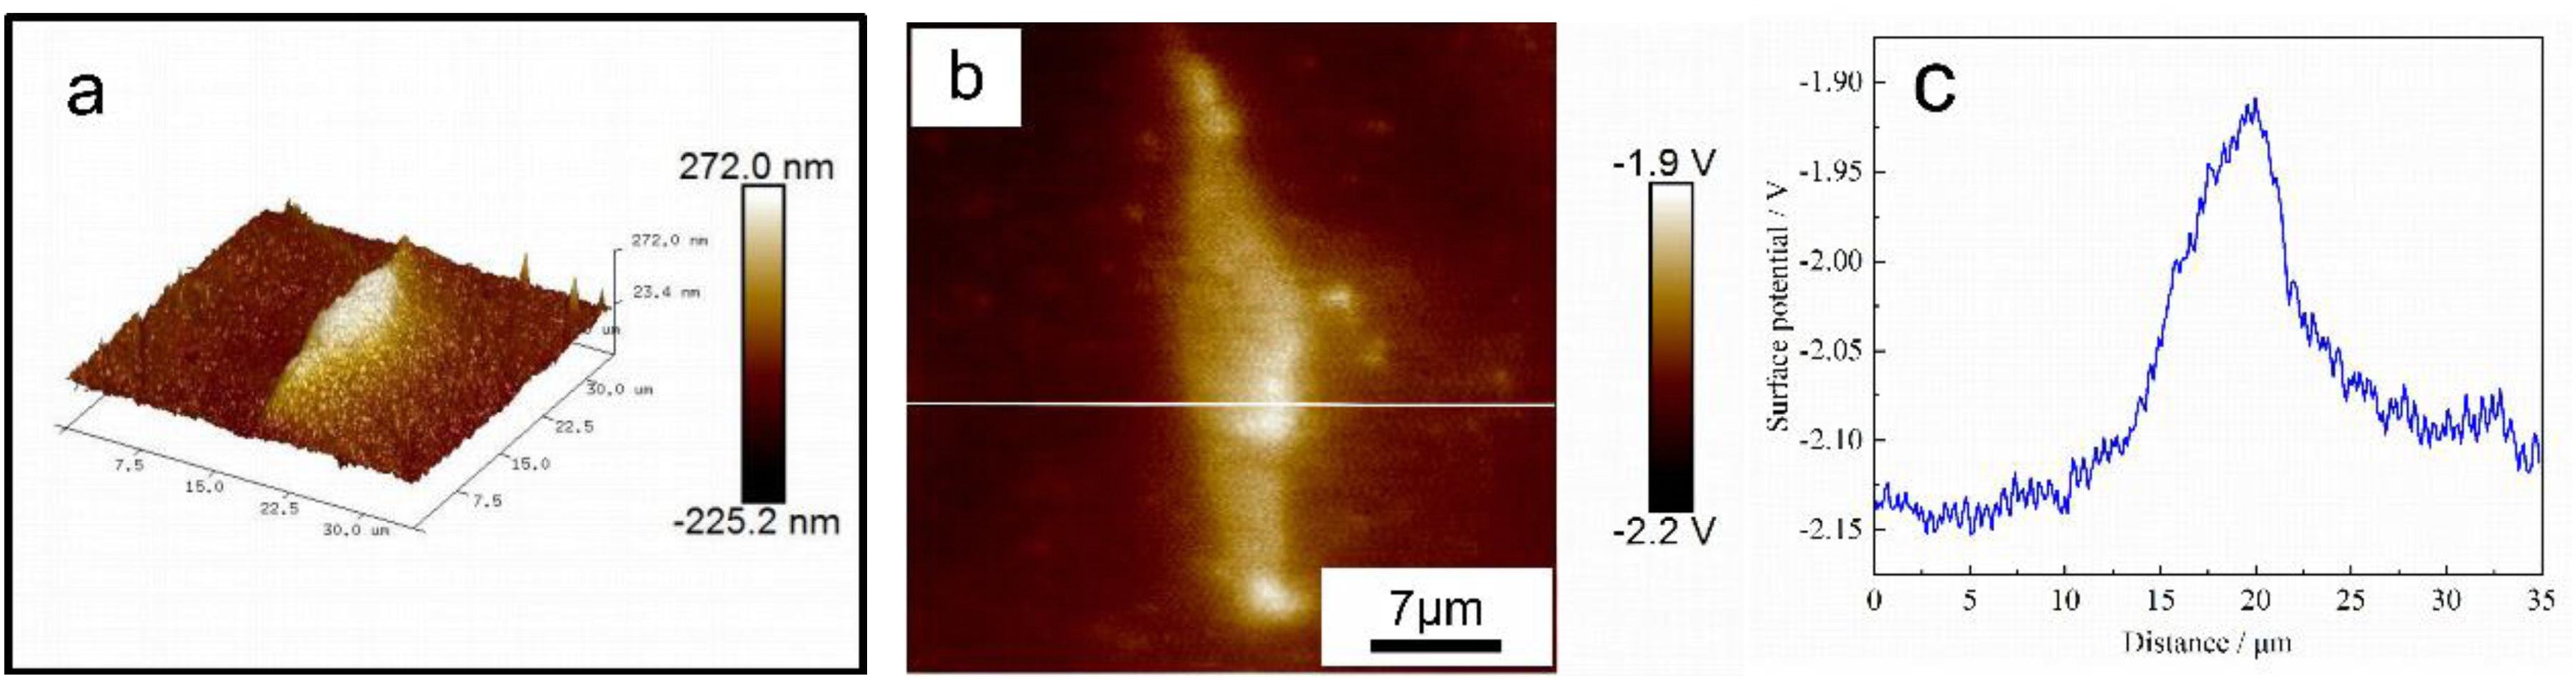
(a) AFM morphology of Y-containing phase; (b) KPFM image; (c) Line profile taken from the line on (b) across Y-containing phase and the surrounding α-Al matrix.
Figure 9 shows that the Al3Mg2 phase is approximately 95.9 nm higher than α-Al matrix, and its VCPD is lower than that of the surrounding α-Al matrix, which means its electrode potential is lower than that of α-Al matrix. Therefore, the Al3Mg2 phase will be preferentially dissolved as the anodic phase during galvanic corrosion. The heights of the Al6(Fe, Mn) phase and the Y-containing phase are about 272.0 nm and 300 nm, respectively. The VCPD of both Al6(Fe, Mn) phase and the Y-containing phase is higher than α-Al matrix (Figures 10 and 11). The potential difference between the Al6(Fe, Mn) phase and α-Al matrix is about 240.78 mV, which is higher than 137.02 mV of the Y-containing phase.
To characterize the corrosion products generated during the corrosion process, the specimens after 48 h of salt spray exposure were analyzed by X-ray Photoelectron Spectroscopy (XPS). During corrosion, these phases act as cathodes, leading to preferential dissolution of the surrounding α-Al matrix and the formation of corrosion products such as Al2O3 and Al(OH)3 around the precipitates (Figure 12). Moreover, the corrosion products after salt spray tests are primarily loose and porous Al(OH)3. Since no distinct passivation region can be observed in the polarization curves, while XPS analysis (Figure 12) confirms the presence of Al2O3 and Al(OH)3. Thus, it can be inferred that the corrosion products are only formed around the precipitated phases and are relatively loose. The galvanic corrosion around the Al6(Fe, Mn) phase is more severe than that around the Y-containing multi-component phases. The loose and porous corrosion products generated in these areas fail to effectively inhibit the galvanic corrosion caused by the Al6(Fe, Mn) phase. 38 Thus, after the addition of Y, the galvanic corrosion can be alleviated due to the formation of the Y-containing phases with lower potential difference with α-Al matrix.
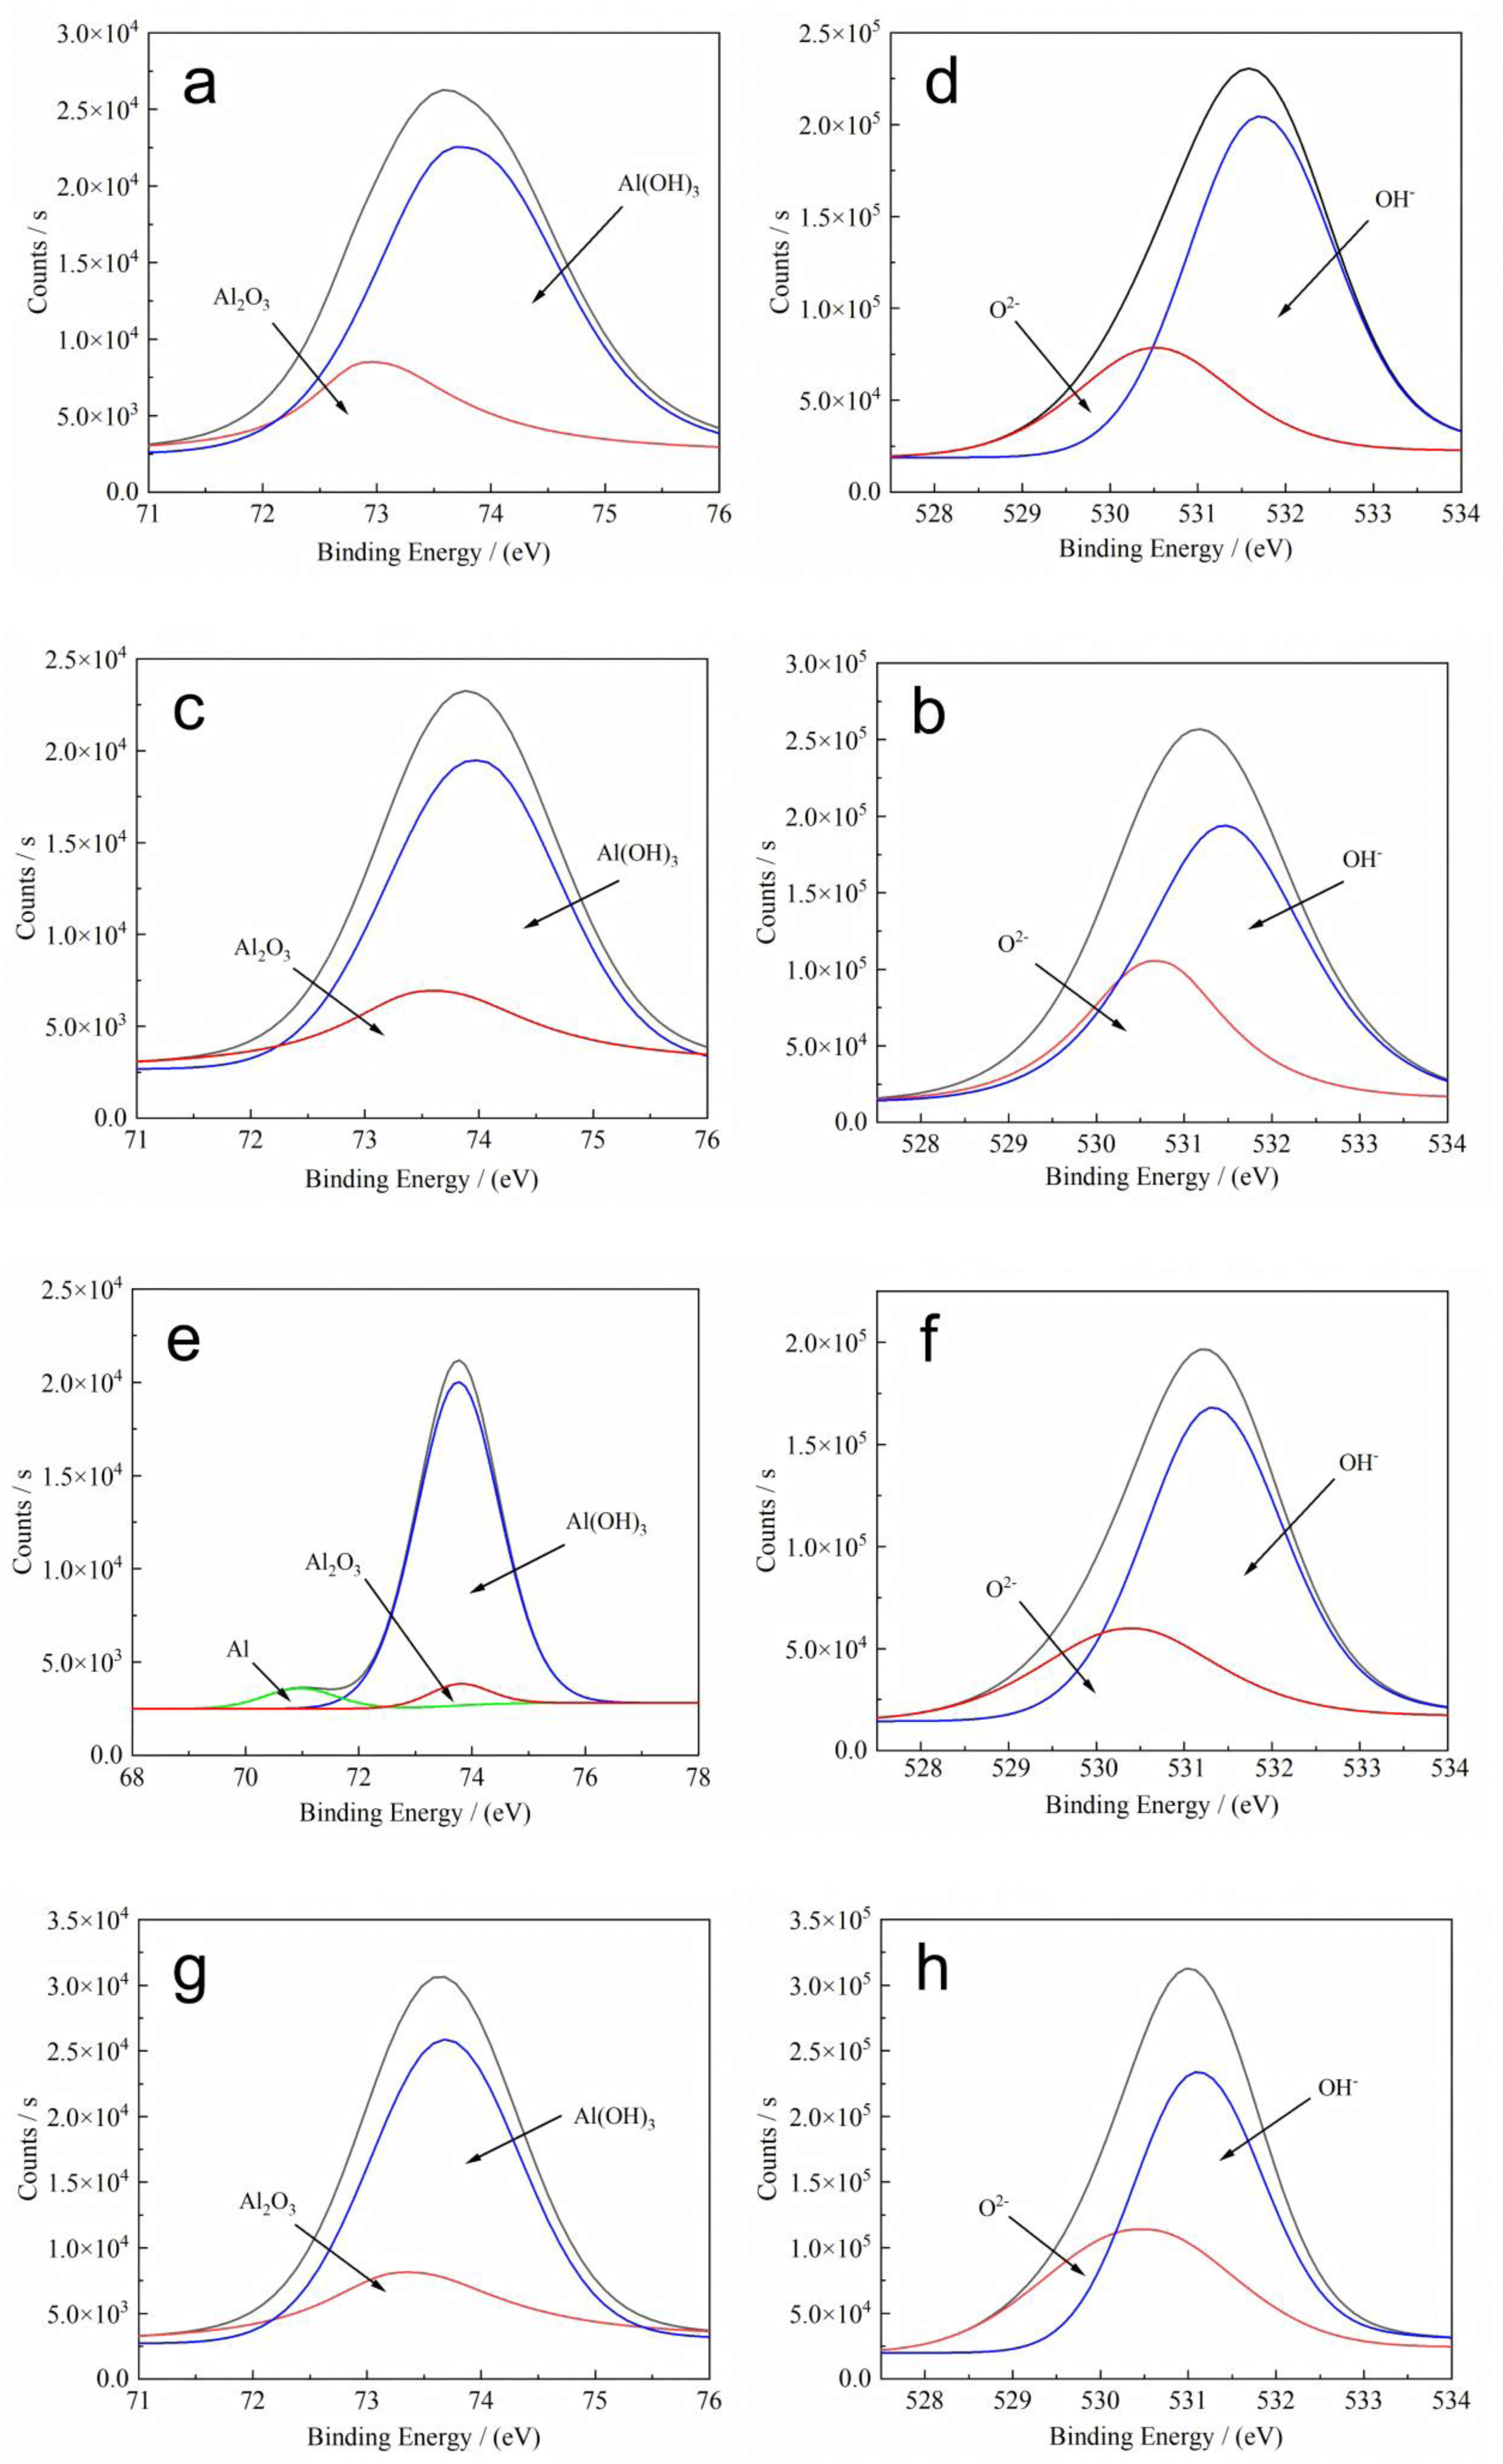
XPS spectra of Al (a, c, e, g) and O (b, d, f, h) elements in the corrosion products on the Al-Mg-Mn alloys with different Y contents. (a)∼(b) Al-Mg-Mn; (c)∼(d) Al-Mg-Mn-0.1Y; (e)∼(f) Al-Mg-Mn-0.2Y; (g)∼(h) Al-Mg-Mn-0.3Y.
Since the relative ratio of Al2O3 and Al(OH)3 in the corrosion products can directly reflect the density of the passivation film, the quantitative analysis of the relative content of Al2O3 or Al(OH)3 by XPS can help to elucidate the effect mechanism of Y addition on the corrosion resistance of the as-cast Al-Mg-Mn alloys. The corresponding peak areas of Al2O3 and Al(OH)3 in Figure 12 were fitted by Origin software. Since the relative sensitivity factor (RSF) of Al2O3 and Al(OH)3 is the same, the relative contents of Al2O3 and Al(OH)3 in the corrosion products can be calculated by the following equation (4)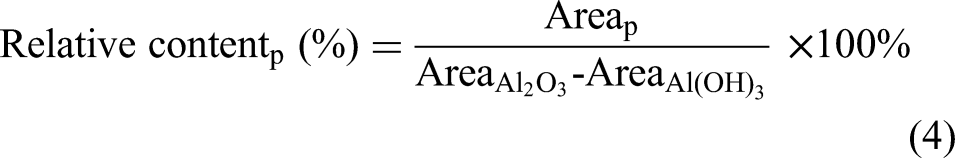
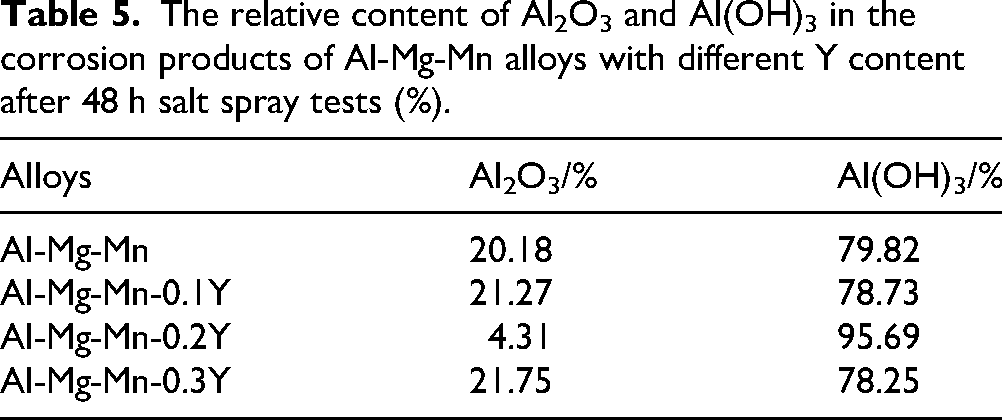
The relative content of Al2O3 and Al(OH)3 in the corrosion products of Al-Mg-Mn alloys with different Y content after 48 h salt spray tests (%).
When the Y content is 0.1 wt.%, the number of Al3Mg2 and Al6(Fe, Mn) phases remains almost unchanged and a small amount of Y-containing multi-component phase is formed in α-Al matrix. Thus, the total number of precipitates is an increased, which leads to more corrosion initiation sites. Since both Al6(Fe, Mn) phase and the Y-containing phase act as cathodes (Figures 10 and 11), more galvanic couples form in the alloy. Additionally, the composition of corrosion products is almost unchanged, resulting in higher corrosion current density (icorr) and reduced corrosion resistance.
When the Y content is increased to 0.2 wt.%, the number of Al6(Fe, Mn) phase is decreased and the Y-containing multiple phases are increased, which significantly reduces the potential difference between the precipitated phase and α-Al matrix, which weakens the galvanic corrosion. However, as shown in Figure 12, the ratio of dense Al2O3 in corrosion product layer is significantly decreased, while the content of loose and porous Al(OH)3 is increased, which is beneficial to the development of corrosion. In addition, pitting in salt spray testing is primarily caused by the reduction of the relative content of Al2O3 in corrosion products, which exposes the matrix. The above two changes counteract each other, and the corrosion current density (icorr) is decreased compared with the alloy with 0.1 wt.% Y addition, making it comparable to the Y-free alloy.
When the addition of Y is further increased to 0.3 wt.%, the precipitates in the matrix are dominated by the Y-containing multiple phases (Figure 11). This significantly reduces the number of the strong cathode Al6(Fe, Mn) phase, which greatly decreases the galvanic corrosion in the matrix. Furthermore, the Al3Mg2 phase, as an anodic phase (Figure 9), becomes smaller and the number is reduced, which fundamentally decreases the driving force of corrosion. The content of dense Al2O3 in the corrosion product is increased from 4.31% to 21.75%, resulting in the icorr is decreased and the corrosion rate is decreased, ultimately the corrosion resistance of the alloy is enhanced.
In terms of the effect of Y addition on the corrosion behavior Al-Mg alloys, only intergranular corrosion can be found. Li et al. 39 reported that the addition of 0.1 wt.% Y to Al-9.2Mg-0.7Mn alloy effectively inhibited the formation of the grain boundary β-Al3Mg2 phase, thereby reducing the weight loss of intergranular corrosion by about 50%. Similarly, Ru et al. 40 showed that after the addition of 0.1 wt.% Y and 0.1 wt.% Zr, the grains of the Al-5.5Mg-0.3Mn alloy can be refined and AlMgYZr phase forms, inhibit the segregation of Mg at the grain boundary, and mitigate galvanic corrosion.
However, previous studies have focused on IGC, and there is limited on the pitting behavior of the Y microalloyed Al-Mg-Mn alloys. In this work, the icorr is decreased from 2.633 × 10⁻⁶ to 1.597 × 10⁻⁷ A/cm2 after adding 0.3 wt.% Y, and the corrosion resistance is improved by about 16.5-fold improvement.
Conclusions
The effect of Y addition on the microstructure, and corrosion resistance of the as-cast Al-Mg-Mn alloys was examined using potentiodynamic polarization, EPMA, EBSD, and KPFM techniques. The main findings of this work can be summarized as follows:
The grain size of as-cast Al-Mg-Mn alloys with different Y contents (0.0, 0.1, 0.2, 0.3 wt.%) gradually become coarser with the increase of Y content, which are 222.6 μm, 243.5 μm, 236.1 μm and 307.8 μm, respectively. In the Y-free alloy, the main precipitates are the β-phase (Al3Mg2) and Al6(Fe, Mn) phase. Both the size and volume fraction of Al3Mg2 phase and the number of Al6(Fe, Mn) precipitates are decreased with the increase of Y content. Meanwhile, various multi-component phases Y-containing form with the increase of Y content. The corrosion current density (icorr) in the 3.5 wt.% NaCl solution is first increased and then decreased, the corrosion potential (Ecorr) shifts positively, and the polarization resistance (Rp) is increased markedly with the increase of Y content in the as-cast Al-Mg-Mn alloy. Salt spray tests further confirm this conclusion: after 48 hours of exposure, the alloy with 0.3 wt.% Y shows no significant pitting, only corrosion product deposition, demonstrating excellent pitting resistance. Average weight loss is decreased with the increase of Y content, which is in agreement with the trend of electrochemical and salt spray tests. Since the Al3Mg2 phase tends to precipitate at the grain boundary, the precipitated phase at the grain boundary decreases with the increase of Y content, and the channels of intergranular corrosion decreases, enhances the resistance of IGC. Therefore, an appropriate Y addition, particularly 0.3 wt.%, can significantly enhance the corrosion resistance of the as-cast Al-Mg-Mn alloy. Although this study confirms the beneficial effect of Y on the corrosion resistance of Al-Mg-Mn alloys, certain aspects remain to be explored deeply. Future research should design a wider range of Y contents to optimize the alloy composition, evaluate the influence of deformation processes on microstructural evolution and corrosion behavior and assess mechanical properties.
Footnotes
Acknowledgements
This work was financially supported by Guangxi Science and Technology Programs (Guike XT2503980012, and Guike AD25069019).
Funding
This work was finacially supported by Guangxi Science and Technology Programs (Guike XT2503980012, and Guike AD25069019).
Declaration of conflicting interests
The authors declared no potential conflicts of interest with respect to the research, authorship and/or publication of this article.