
Abstract
Delaunay triangulation converts two-dimensional scatter images into statistical data. Parameters derived from the triangulation—such as triangle area, edge length, neighboring triangle area, and neighbor distance—are all related to particle distribution uniformity. In this work, Delaunay triangulation is applied to simulated scatter plots with varying densities and non-uniformity levels to identify an indicator that accurately reflects distribution non-uniformity. Statistical results show that the coefficient of variation of the Delaunay edge lengths (vd) sensitively captures differences in non-uniformity while being minimally influenced by areal density, establishing it as a reliable single-value indicator. For MnS inclusions in free-cutting steel, vd exhibits a significant positive correlation between cutting resistance. This a quantitative microstructure-property link, enabling prediction of machining performance from inclusion distribution features.
Keywords
Background
MnS inclusions in sulfur-containing free-cutting steels significantly enhance machining performance through two primary mechanisms.1,2,3 First, the weak interfacial bonding between MnS inclusions and the steel matrix promotes stress concentration at these sites during cutting. This introduces localized fracture of the material ahead of the tool edge, leading to the formation of discontinuous chips and reduced tool-chip friction. Second, MnS inclusions possess moderate plasticity, allowing them to deform plastically under the thermomechanical loads of cutting. The deformed inclusions then adhere to the tool surface, forming a lubricating film that minimizes direct contact between the, workpiece, and the tool-chip, thereby reducing both abrasive and adhesive bonding. The spatial distribution of MnS inclusions is thus a critical factor governing the machinability of free-cutting steels. SEP 1572-2019 specifies a method for quantitatively evaluating MnS inclusions in free-cutting steels using standard micrographs. The method involves examining a longitudinal section to grade the inclusions based on their length, width, and area. However, even samples with the same grade can exhibit different cutting performance, as the grading basis does not account for the non-uniformity in MnS distribution.
The non-uniformity of a distribution is generally defined by the relative positions of nearest-neighbor particles. However, directly identifying “nearest” or “non-nearest” neighbors on a two-dimensional image is challenging. To address this, the centroids of MnS inclusions can be treated as nodal points for Delaunay triangulation, which converts the planar scatter set into a triangular mesh. This mesh adheres to the Delaunay property—meaning no other points lie inside the circumcircle of any triangle—ensuring that each particle is connected to its natural neighbors. Thus, nearest-neighbor relationships are established, enabling quantitative analysis of distribution non-uniformity.
Bertram 4 validated the Delaunay method via simulation and introduced the Delaunay neighbor distance (DND) to characterize particle arrangements. The coefficient of variation (CV) of DND reflects distribution non-uniformity, while the CVs of triangle areas and neighbor counts are also influenced by uniformity differences. Yang 5 further demonstrated that the CV of DND is insensitive to particle size and shape but highly sensitive to distribution uniformity. Previous studies4–6 used simulated scatter plots—covering patterns from regular clusters to isotropic cellular segregation—to confirm correlations between CV values and non-uniformity. However, actual MnS distributions in free-cutting steels are neither perfectly clustered nor perfectly isotropic; they typically exhibit intermediate random patterns with localized clustering. Consequently, applying Delaunay triangulation and using the CV of DND alone fails to sensitively capture real-world differences in non-uniformity.
In this study, we generate simulated 2D scatter plots with controlled areal density gradients and clustering degrees, reflecting the actual distribution characteristics of MnS in free-cutting steel. Using Delaunay triangulation, we compare multiple parameters in terms of their sensitivity to non-uniformity and robustness against interference, leading to the selection of an optimal indicator. The proposed indicator is then used to quantify MnS distribution non-uniformity in free-cutting steels 1215MS and 1215. Finally, machining trials (turning tests) are conducted to correlate the quantified non-uniformity with macroscopic cutting force.
Method
Actual MnS distribution
Specimens of sulfur-containing free-cutting steel were obtained from hot-rolled rods. To examine the inclusion distribution, both longitudinal (parallel to rolling direction) and transverse (perpendicular to rolling direction) sections were prepared through grinding and polishing. Backscattered electron (BSE) images were then captured at 300× magnification using a scanning electron microscope (SEM), as illustrated in Figure 1.
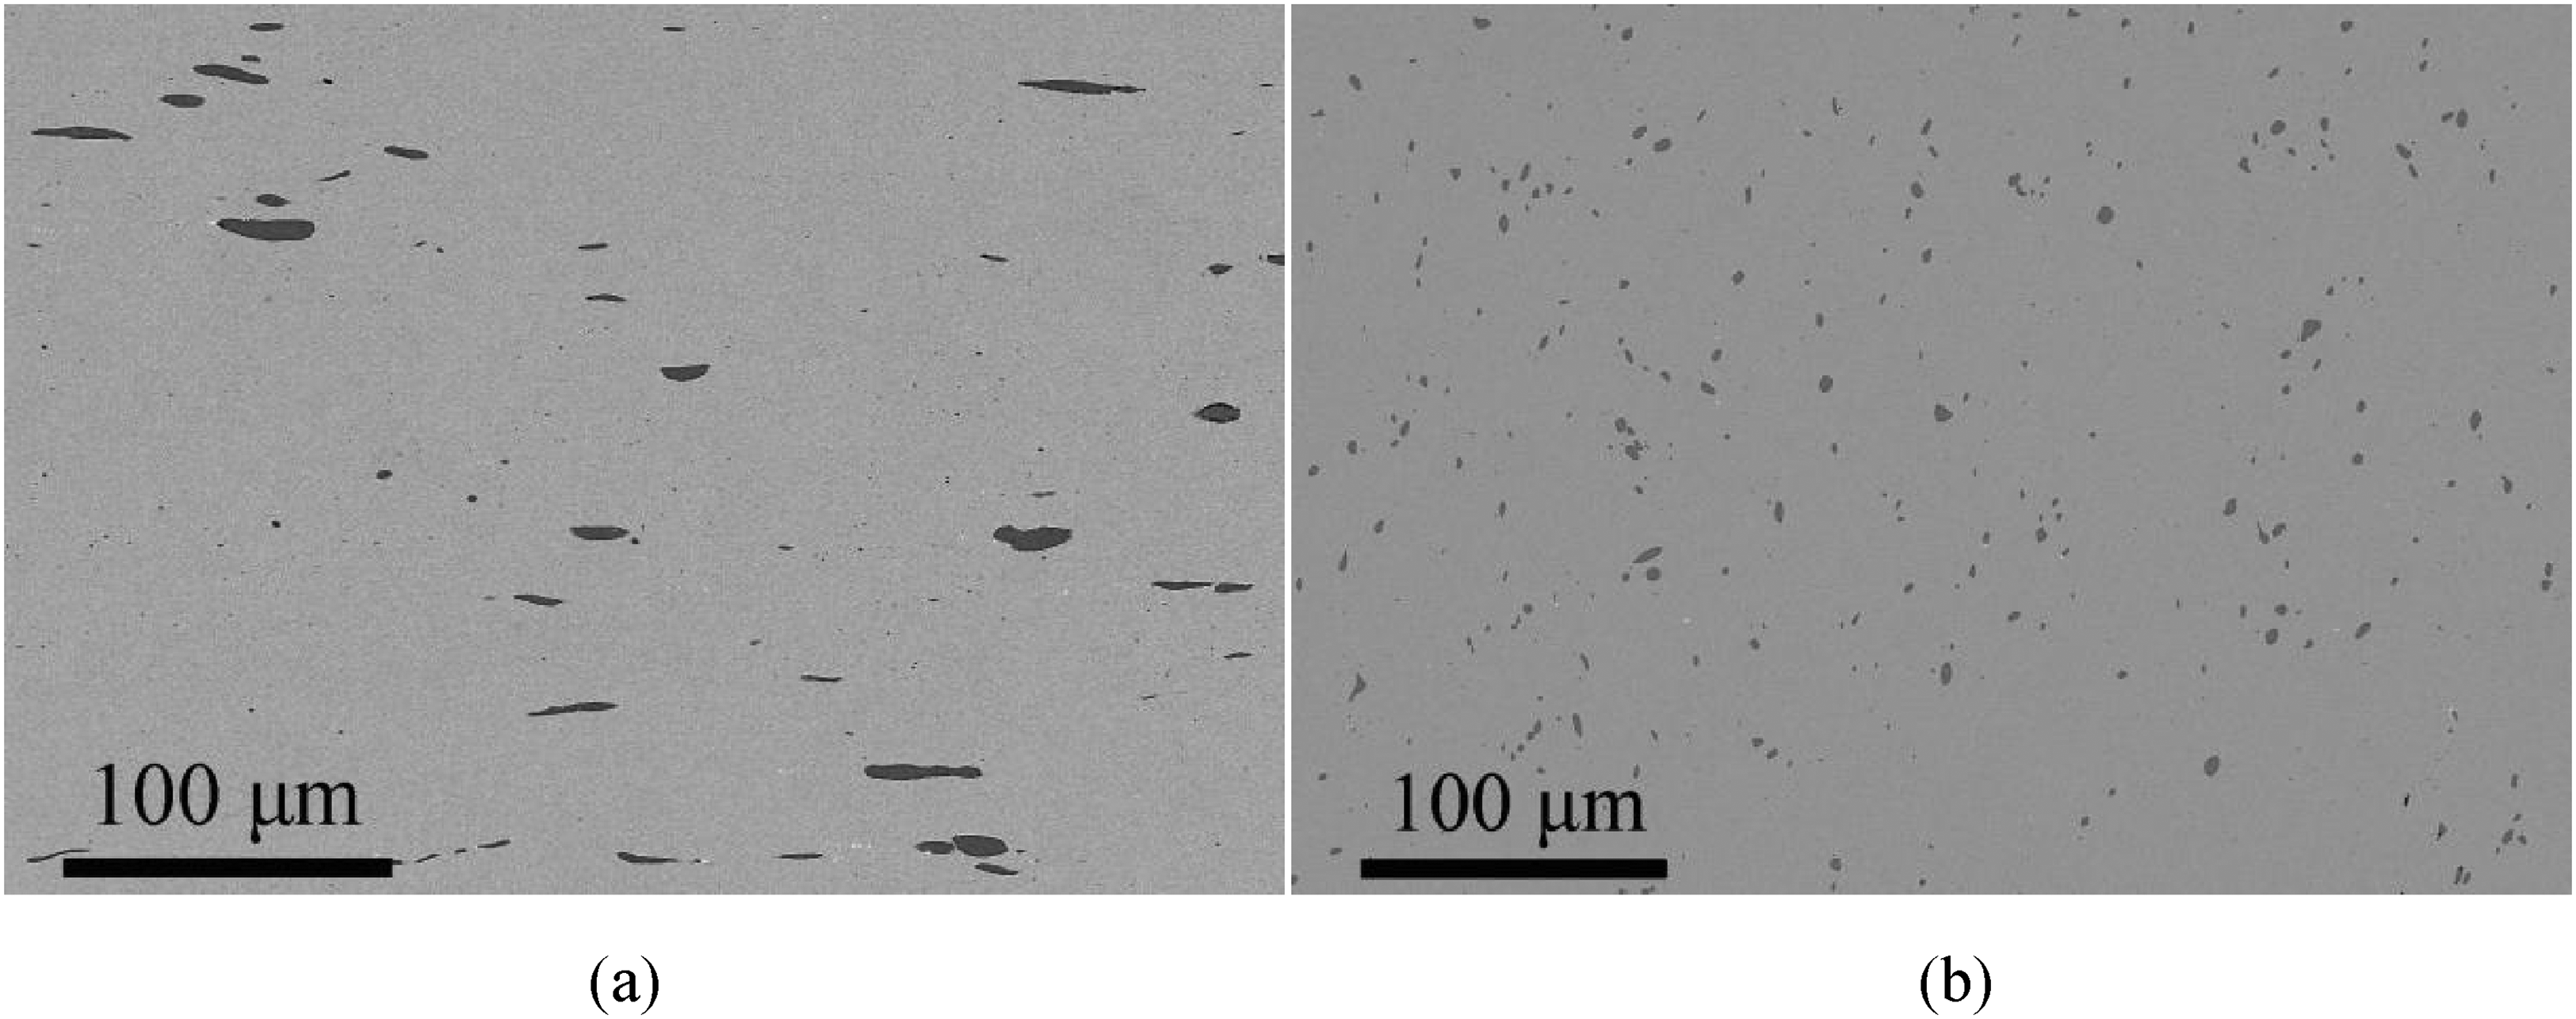
BSE images of MnS inclusions in the free-cutting steel: (a) longitudinal section and (b) transverse section.
Manganese sulfide (MnS) inclusions exhibit high ductility, leading to significant elongation along the rolling direction. In conventional steels, these elongated MnS inclusions promote chip breaking due to their inherent plasticity; however, their unfavorable morphology also introduces substantial detrimental effects on mechanical properties.
To address this issue, free-cutting steels incorporate specific modifiers—such as calcium (Ca), rare earth elements (RE, e.g., cerium, lanthanum), or titanium (Ti)—into the molten steel. These additives effectively alter the morphology of MnS inclusions. The underlying principle is to transform the elongated, harmful MnS structures formed during rolling into fine, uniformly dispersed inclusions. Such modified inclusions positively contribute to cutting performance while minimizing adverse impacts on transverse properties. By precisely controlling the morphology, size, and distribution of MnS inclusions, free-cutting steels effectively leverage their benefits while mitigating associated weaknesses, thereby significantly enhancing machinability.
As a result, the longitudinal section is commonly used to evaluate parameters such as sulfide length, aspect ratio, and count for rating purposes, which reflect the efficacy of modification and the rolling process. In contrast, the distribution density and uniformity of sulfides on the transverse section are more directly correlated with cutting performance. It should be noted that the longitudinal and transverse sections represent two orthogonal views of the same three-dimensional sulfide population and are intrinsically interrelated.
Therefore, MnS images from transverse section were used as the reference for simulation. Quantitative measurements revealed an areal density ranging from 1700 to 10,000 particles/mm2, with the spatial distribution appearing nearly random and containing limited clustering.
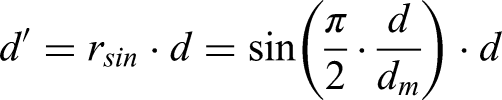
To approximate the inclusion distribution characteristics of actual samples, the simulated scatter plots are designed to cover an areal density range of 1700∼10,000 particles/mm2. Each simulation is confined to a 200 μm × 200 μm field, initialized with square lattices of 8 × 8, 10 × 10, 12 × 12, 16 × 16, and 20 × 20 configurations. All lattice points are simplified to circles, with their areas being random values ranging from 10 to 20 μm2. Random deviations (not exceeding the average lattice spacing) are applied to the x- and y-coordinates of scatter points, generating baseline distributions with theoretical areal densities of 1,600, 2,500, 3,600, 6,400, and 10,000 particles/mm2, respectively. To introduce controlled non-uniformity, several clusters are defined within the field. The level of non-uniformity increased with the number of clusters increasing. A cluster is composed of a core and the scattered points around the core. On the simulated scatter plot, after specifying the coordinates of the core, the scattered points around it will shift towards to the core, and the spacing from the core would be multiplied by a coefficient less than 1. Four contraction functions are tested:
Sinusoidal contraction coefficient:
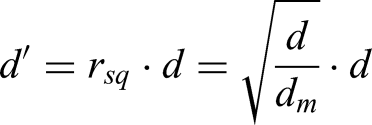
Square-root contraction coefficient:
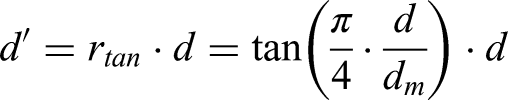
Tangent contraction coefficient:
Linear contraction coefficient:
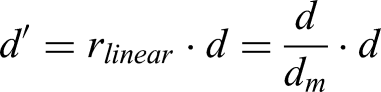
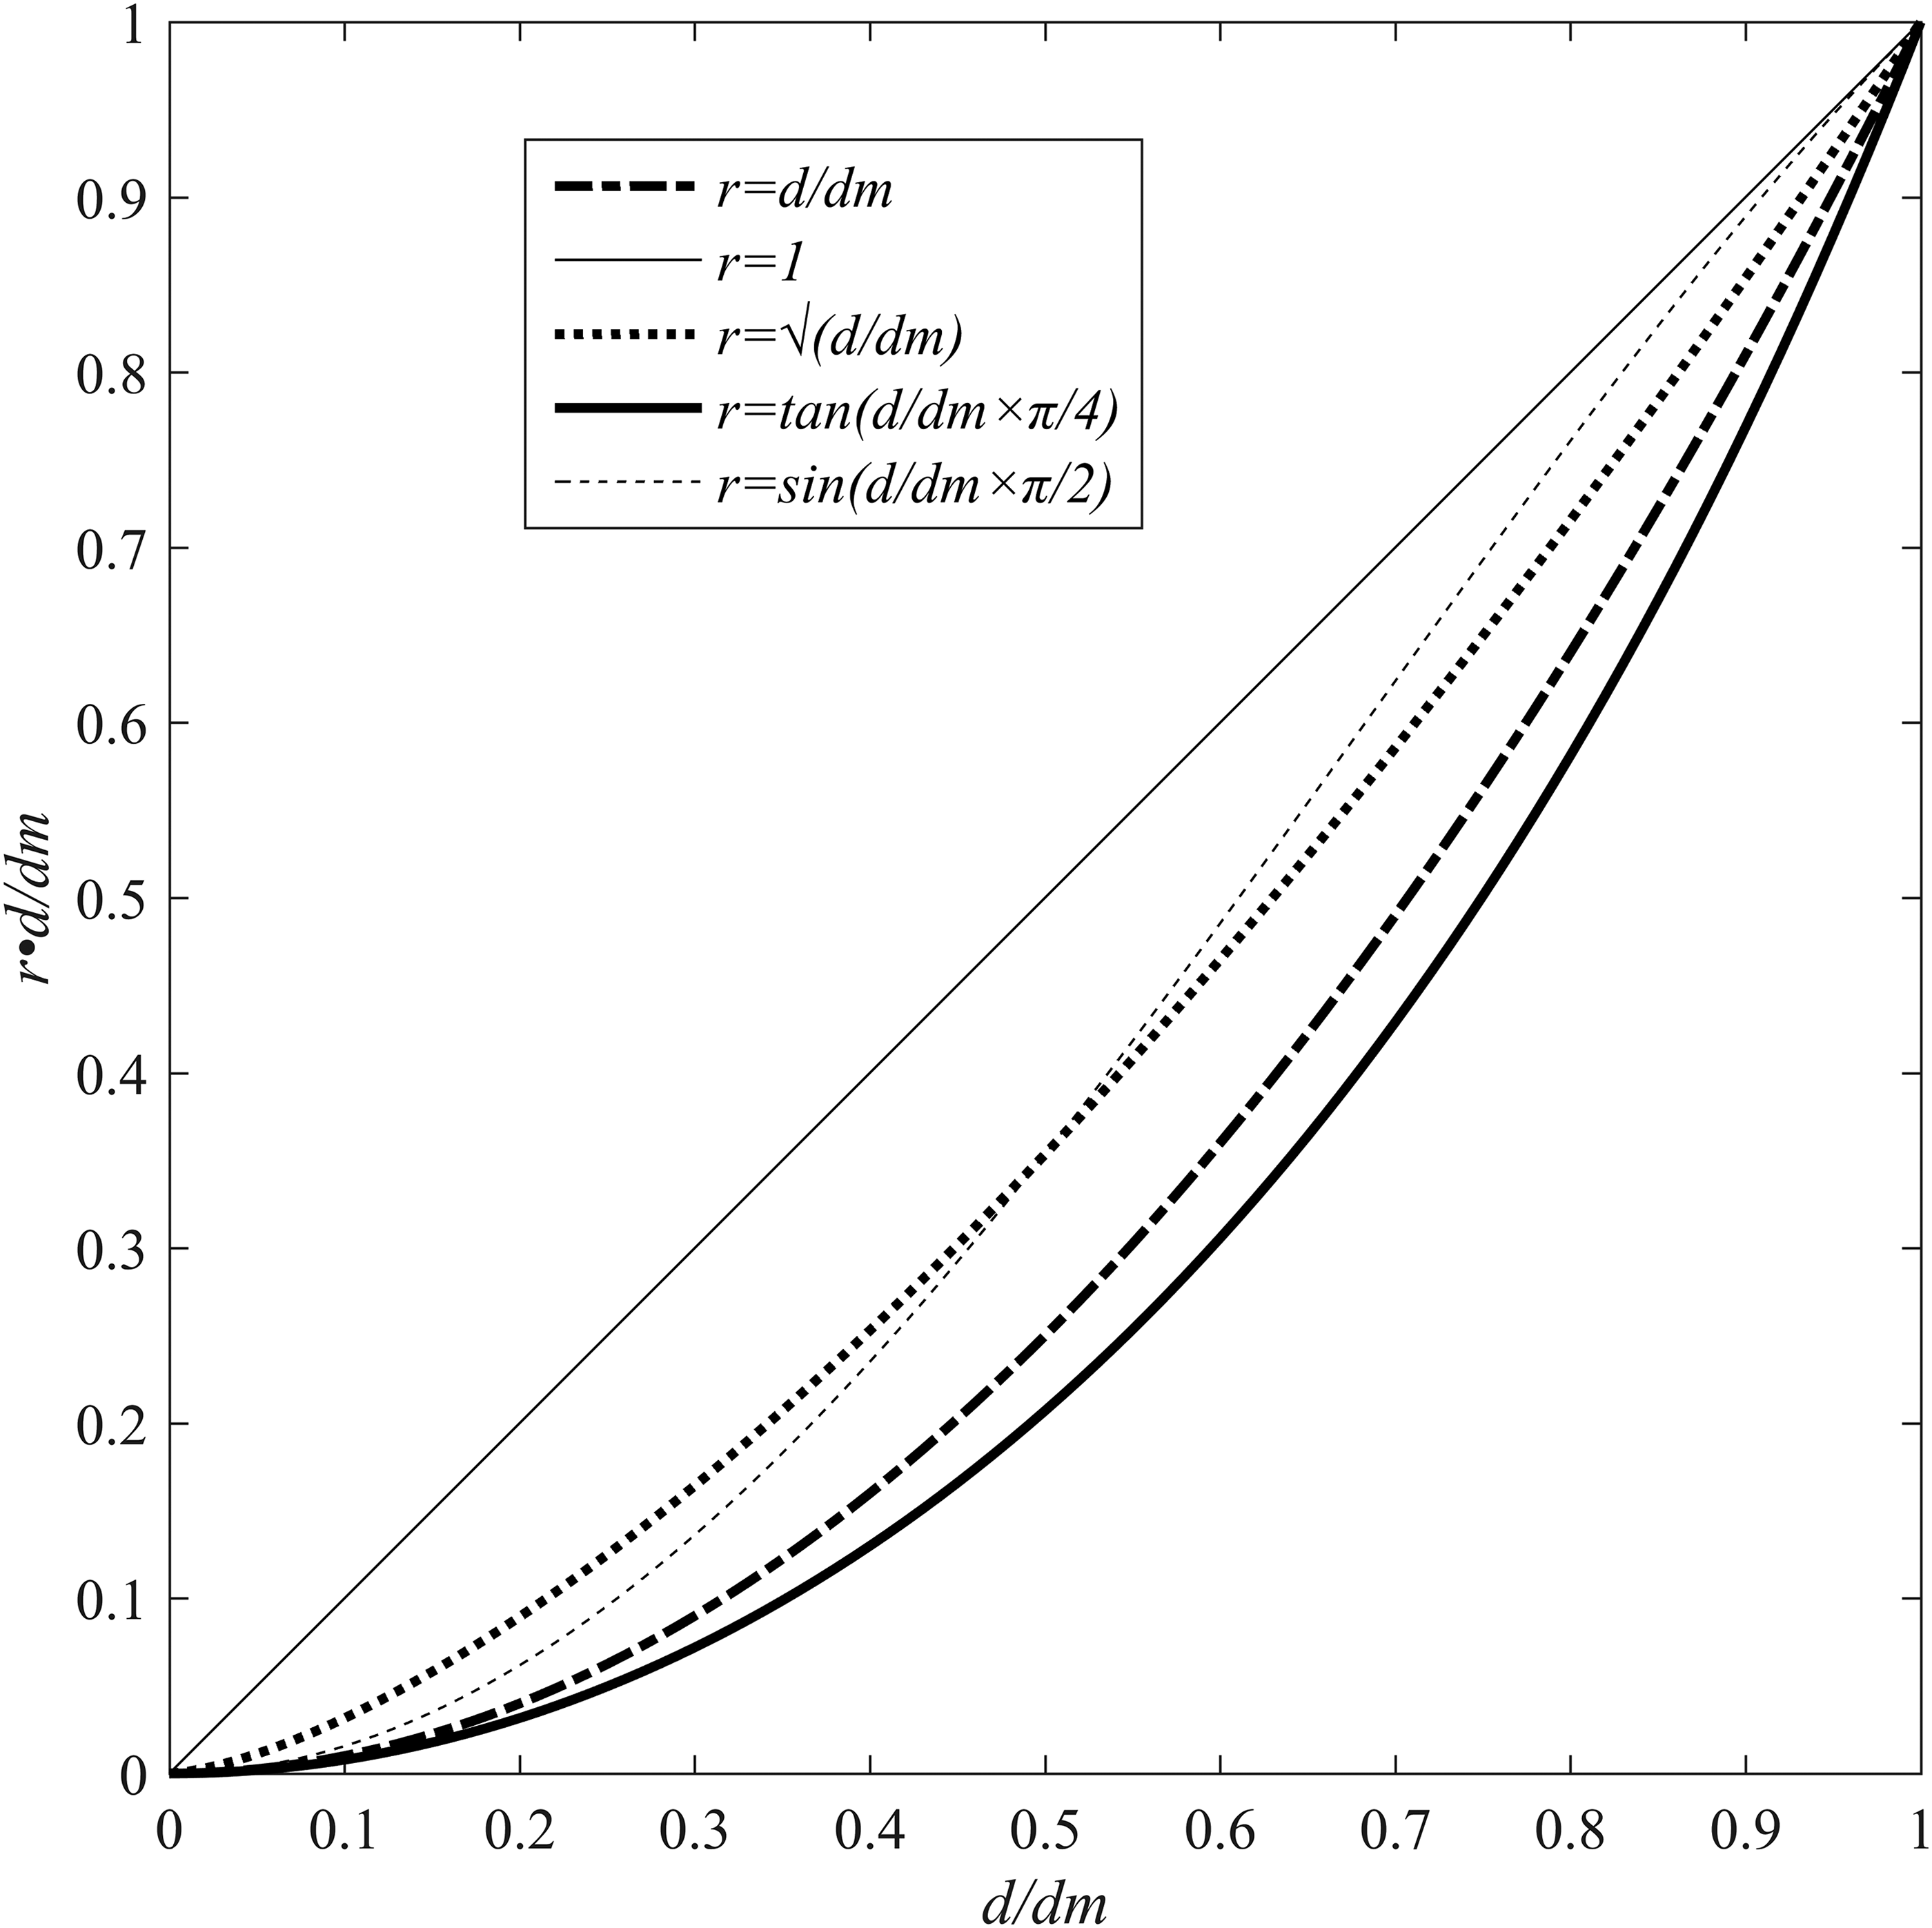
As shown in Figure 2, the four contraction coefficients produce markedly different effects on particle spacing. The sinusoidal and linear coefficients have the weakest impact, whereas the tangent coefficient exerts the strongest. To select the optimal coefficient for simulation, each was applied to a uniformly distributed scatter plot (Figure 3(a)). By comparing the resulting distribution patterns against real microstructures, the coefficient that best matched the actual sample was selected for subsequent simulations. The results demonstrate that the tangent contraction coefficient yields a distribution most consistent with the MnS inclusions observed via SEM; it was therefore adopted for all subsequent work.
Contraction coefficient.
The effect of each contraction coefficient on the baseline distribution: (a) baseline distribution, (b) sinusoidal contraction, (c) square-root contraction, (d) tangent contraction and (e) linear contraction.
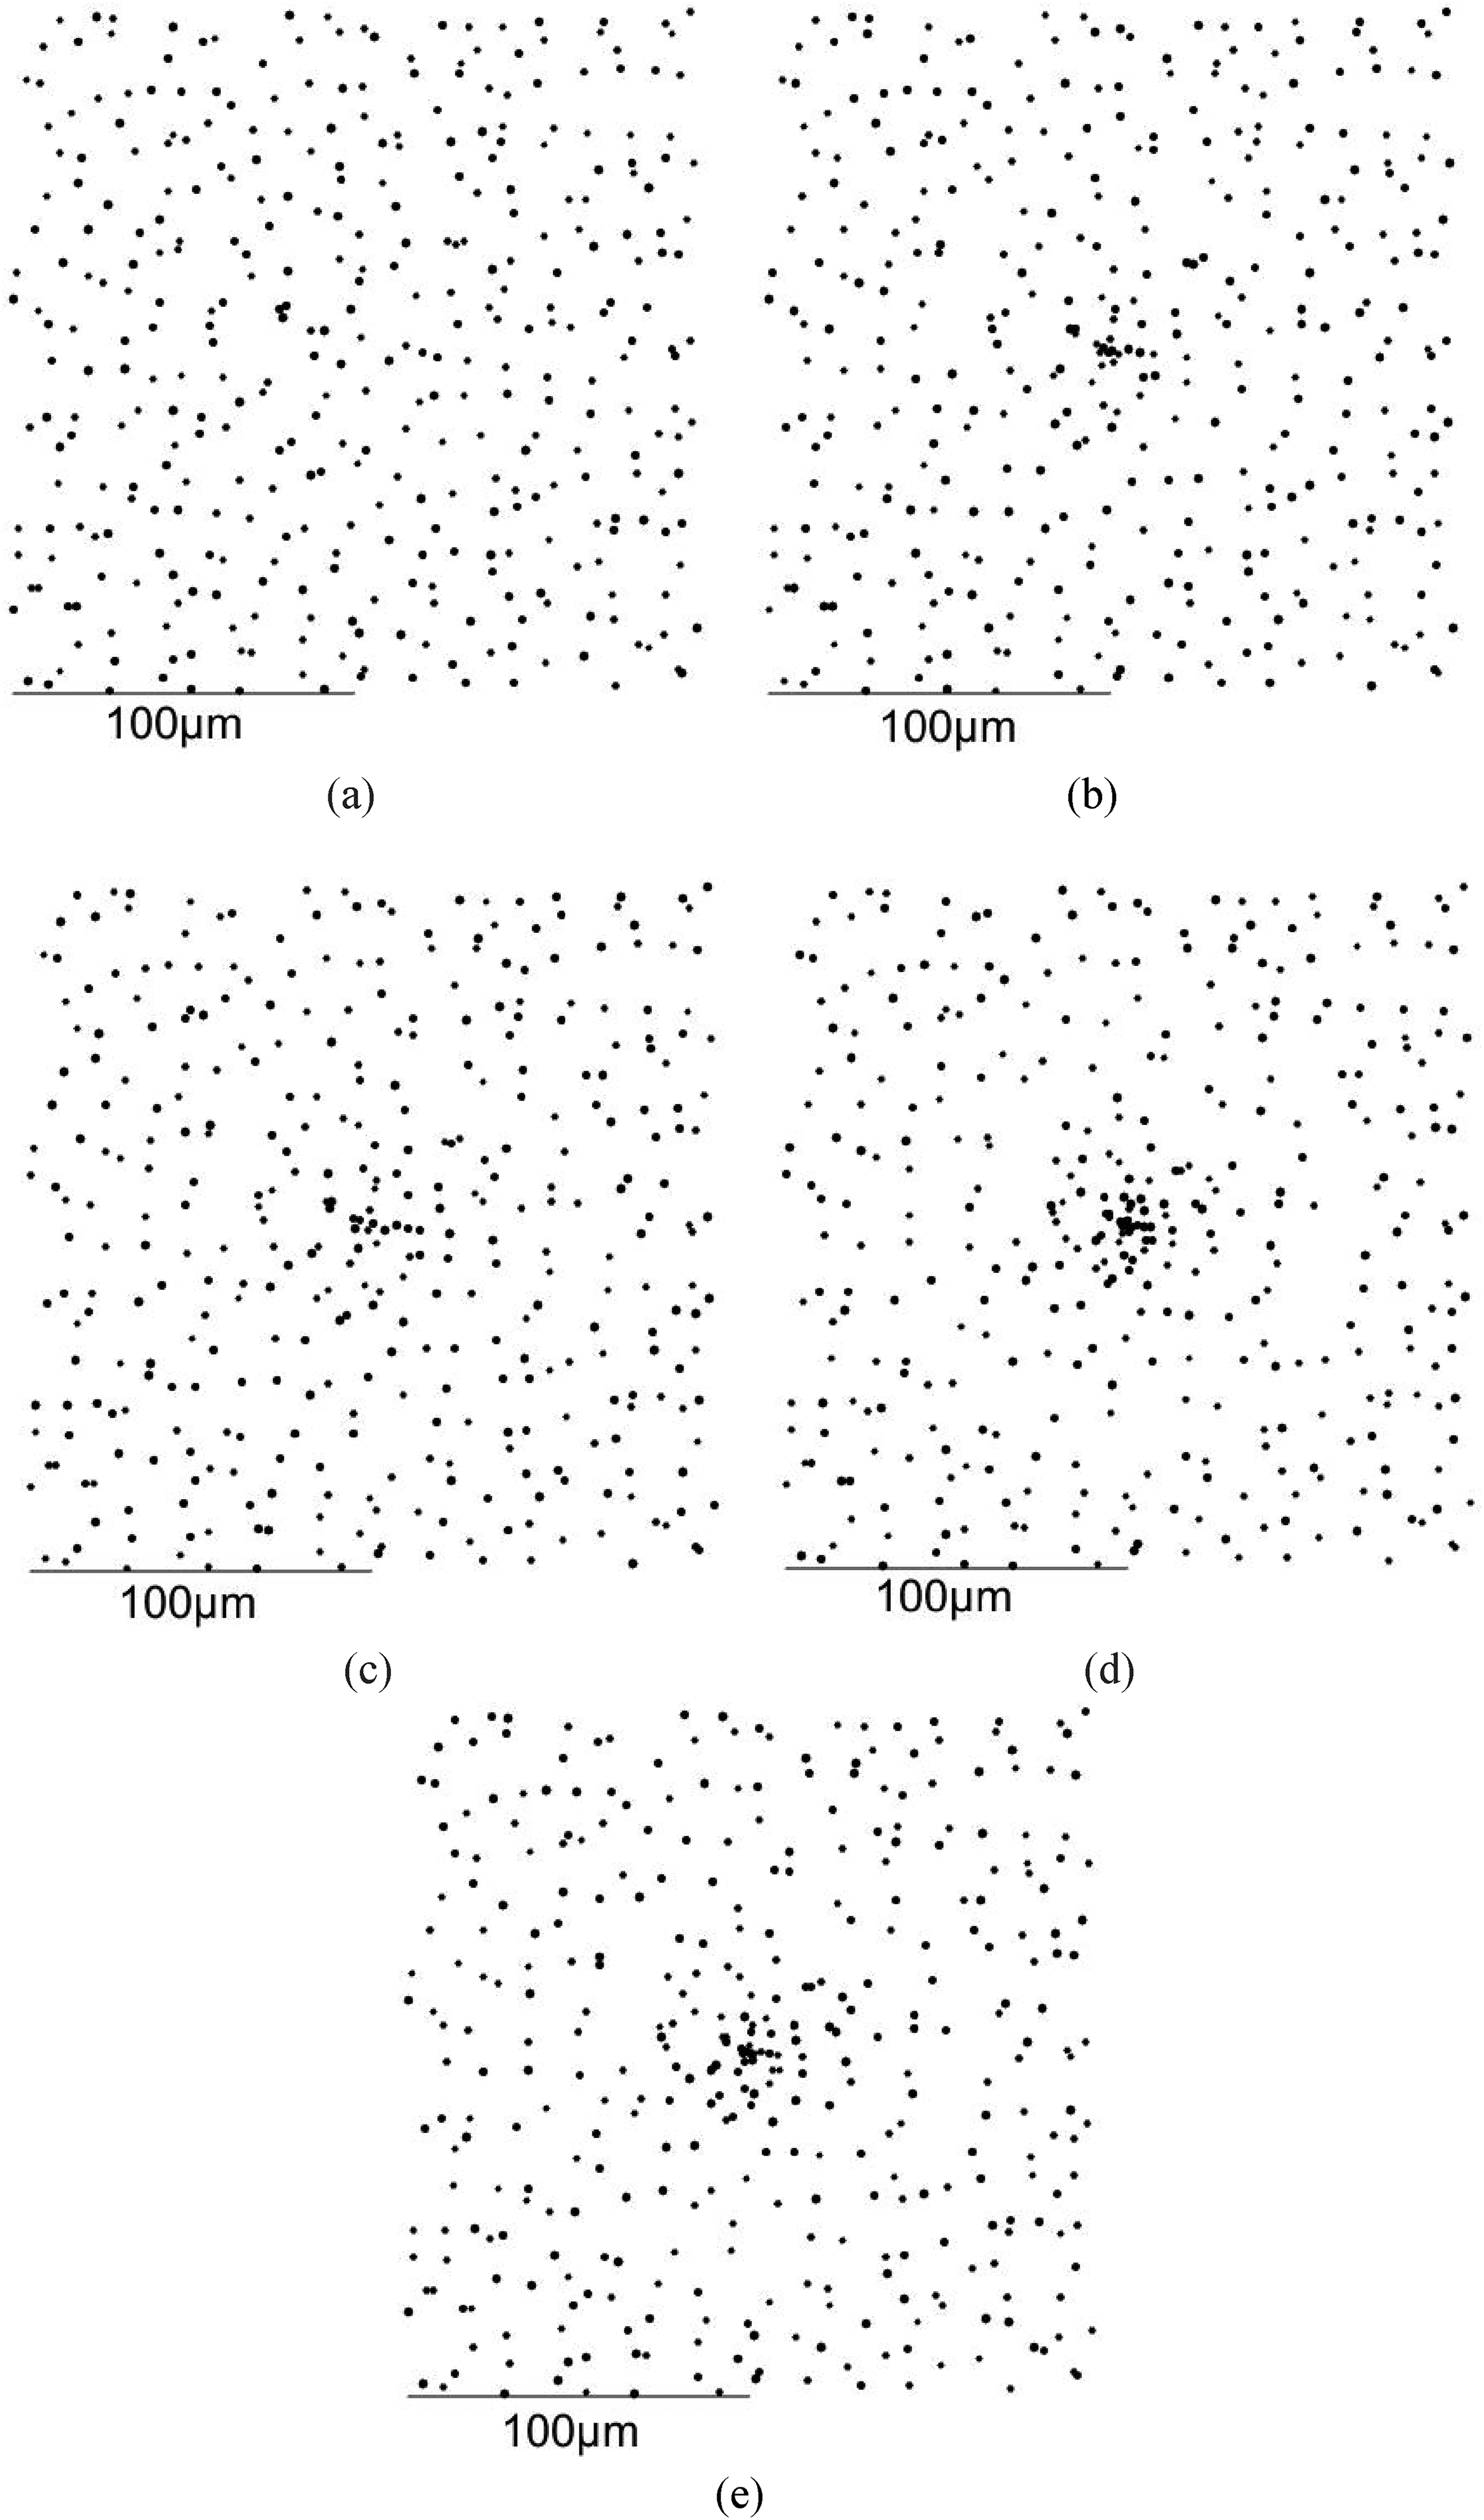
After introducing clustering cores, the areal densities of the simulated scatter plots were converted to approximately 1,200, 2,000, 3,500, 7,000, and 10,000 particles/mm2, covering the preset density range. The non-uniformity of the distribution intensified with the incremental addition of clustering cores.
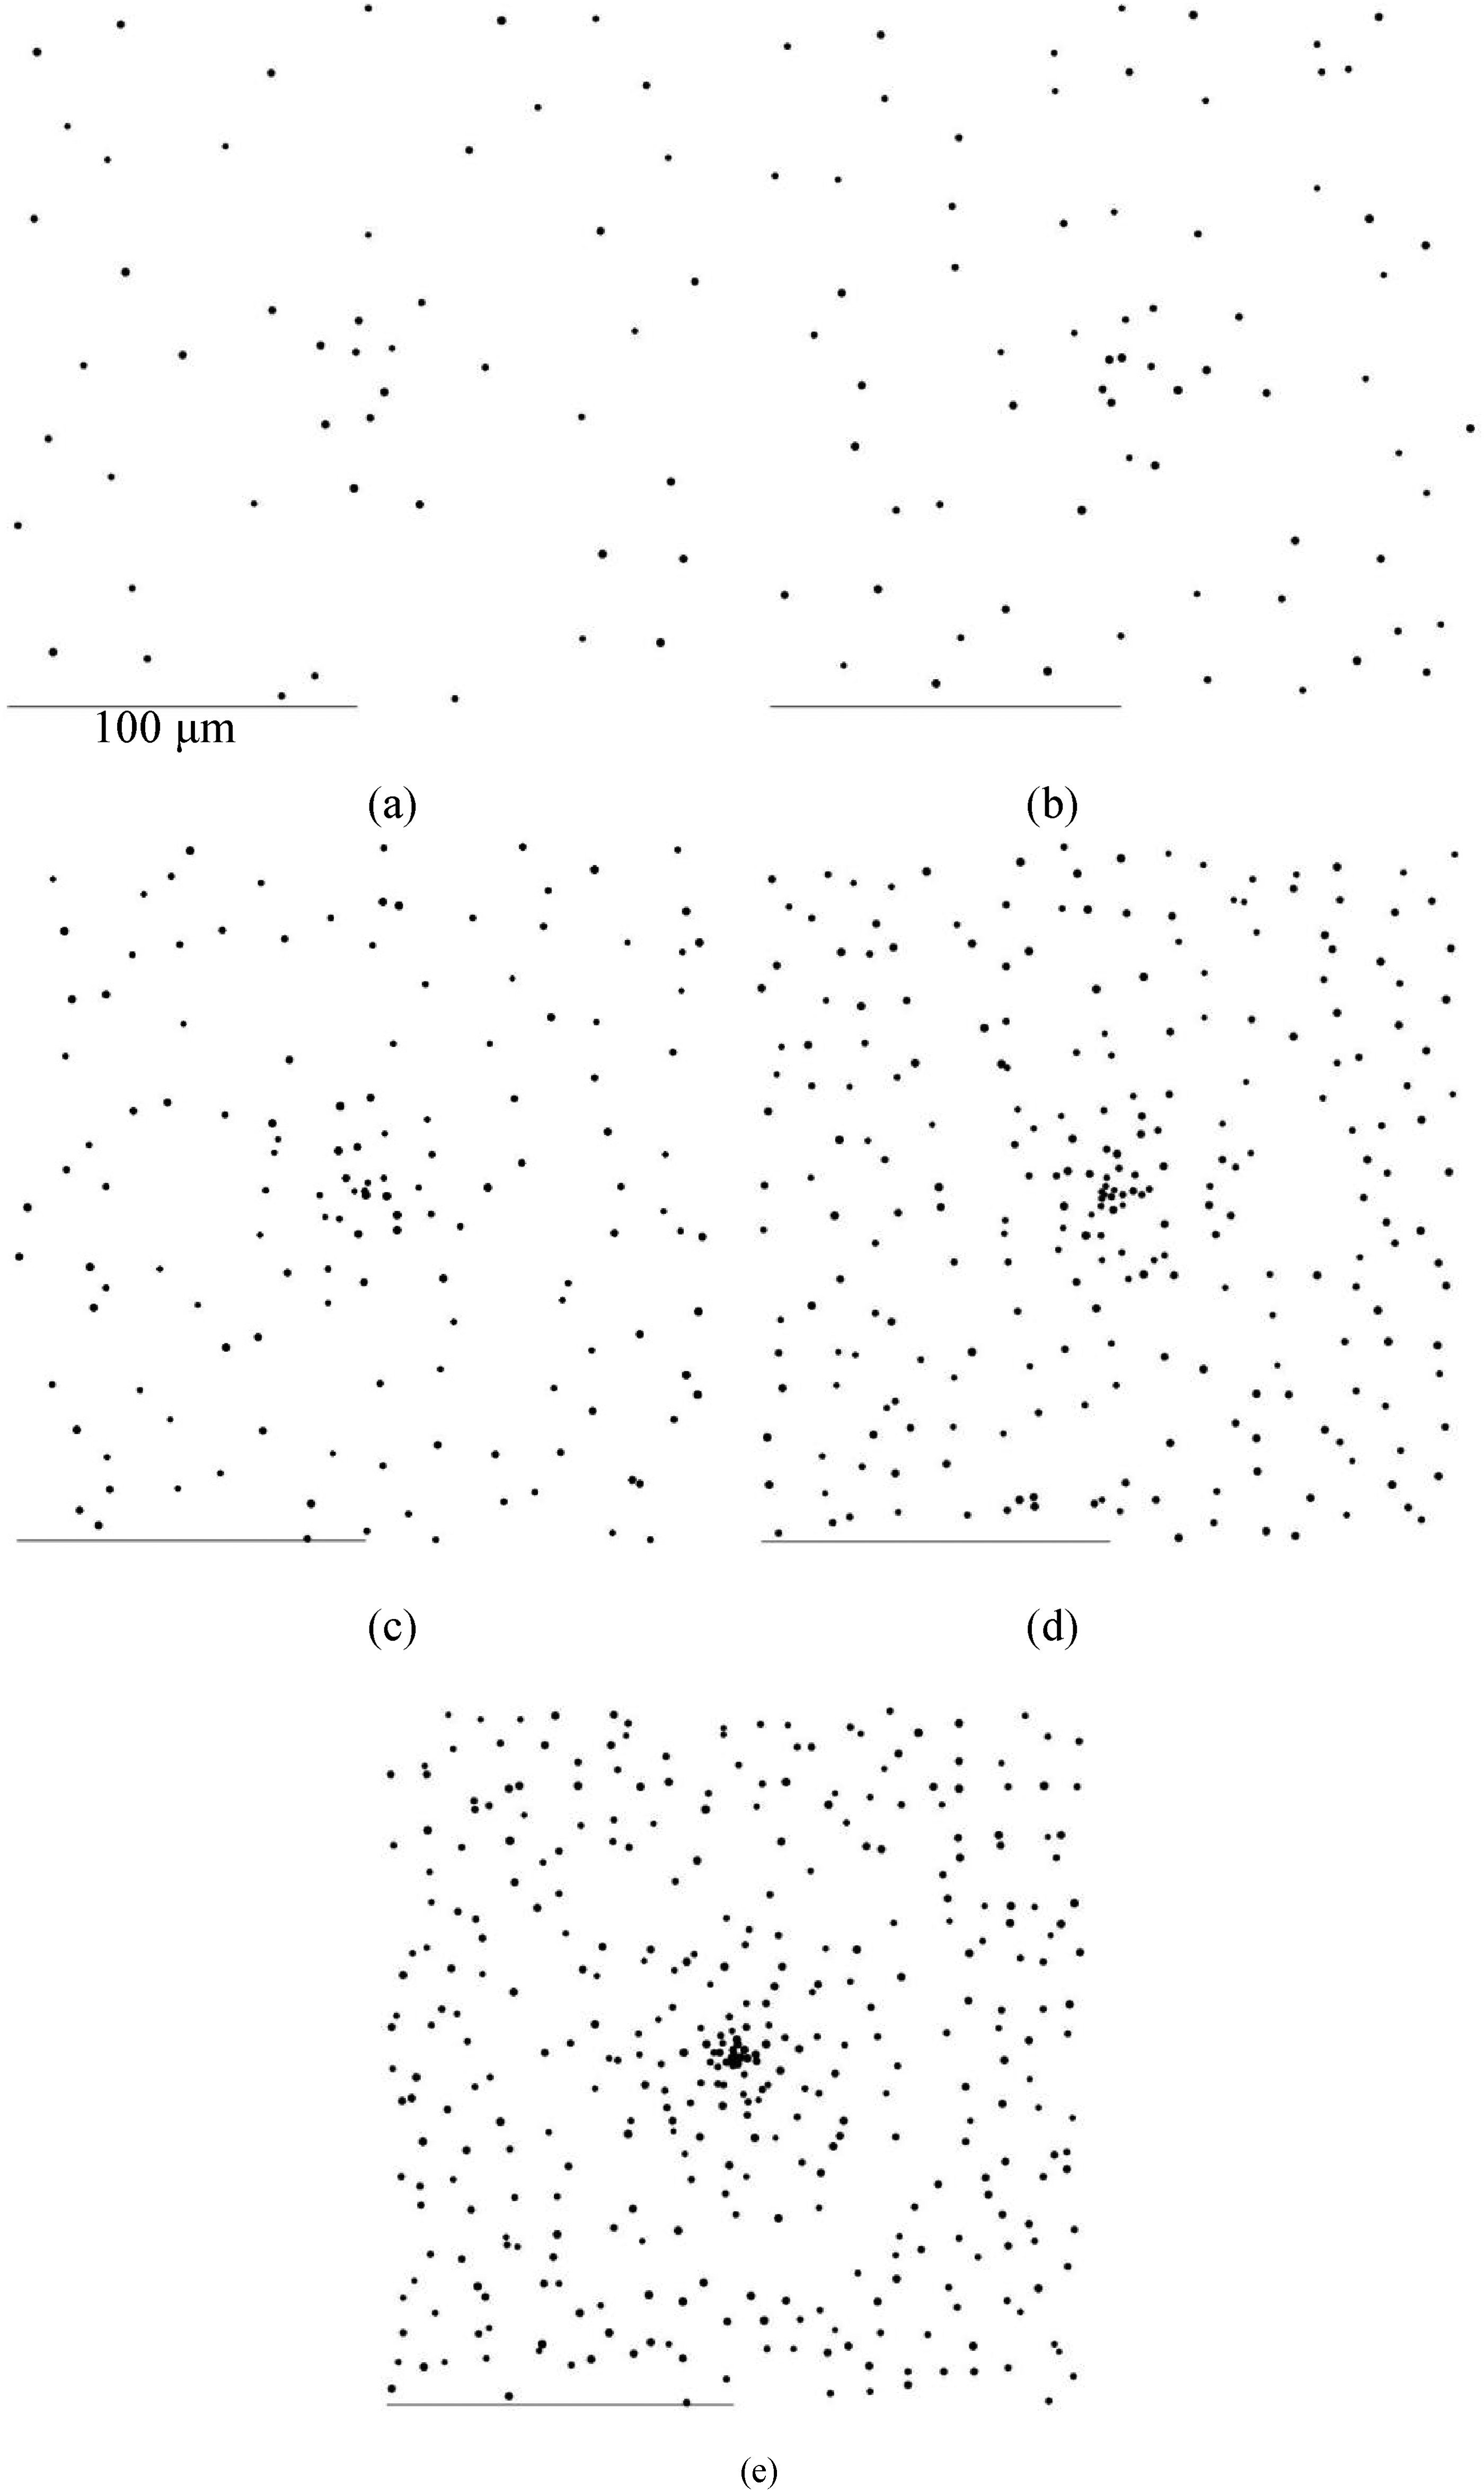
Figure 4 illustrates scatter plots with a single clustering center at each density level, while Figure 5 demonstrates plots with 2∼4 clustering cores under an areal density of ∼7000 particles/mm2. By varying the positions of clustering centers, distinct scatter patterns sharing identical distribution characteristics were generated. For each configuration, two statistically equivalent simulated scatter plots were produced to ensure analytical robustness.
Simulated scatter plots with a single clustering core at each density levels :(a) 1200, (b) 2000, (c) 3500, (d) 7000 and (f) 10000 particles/mm2.
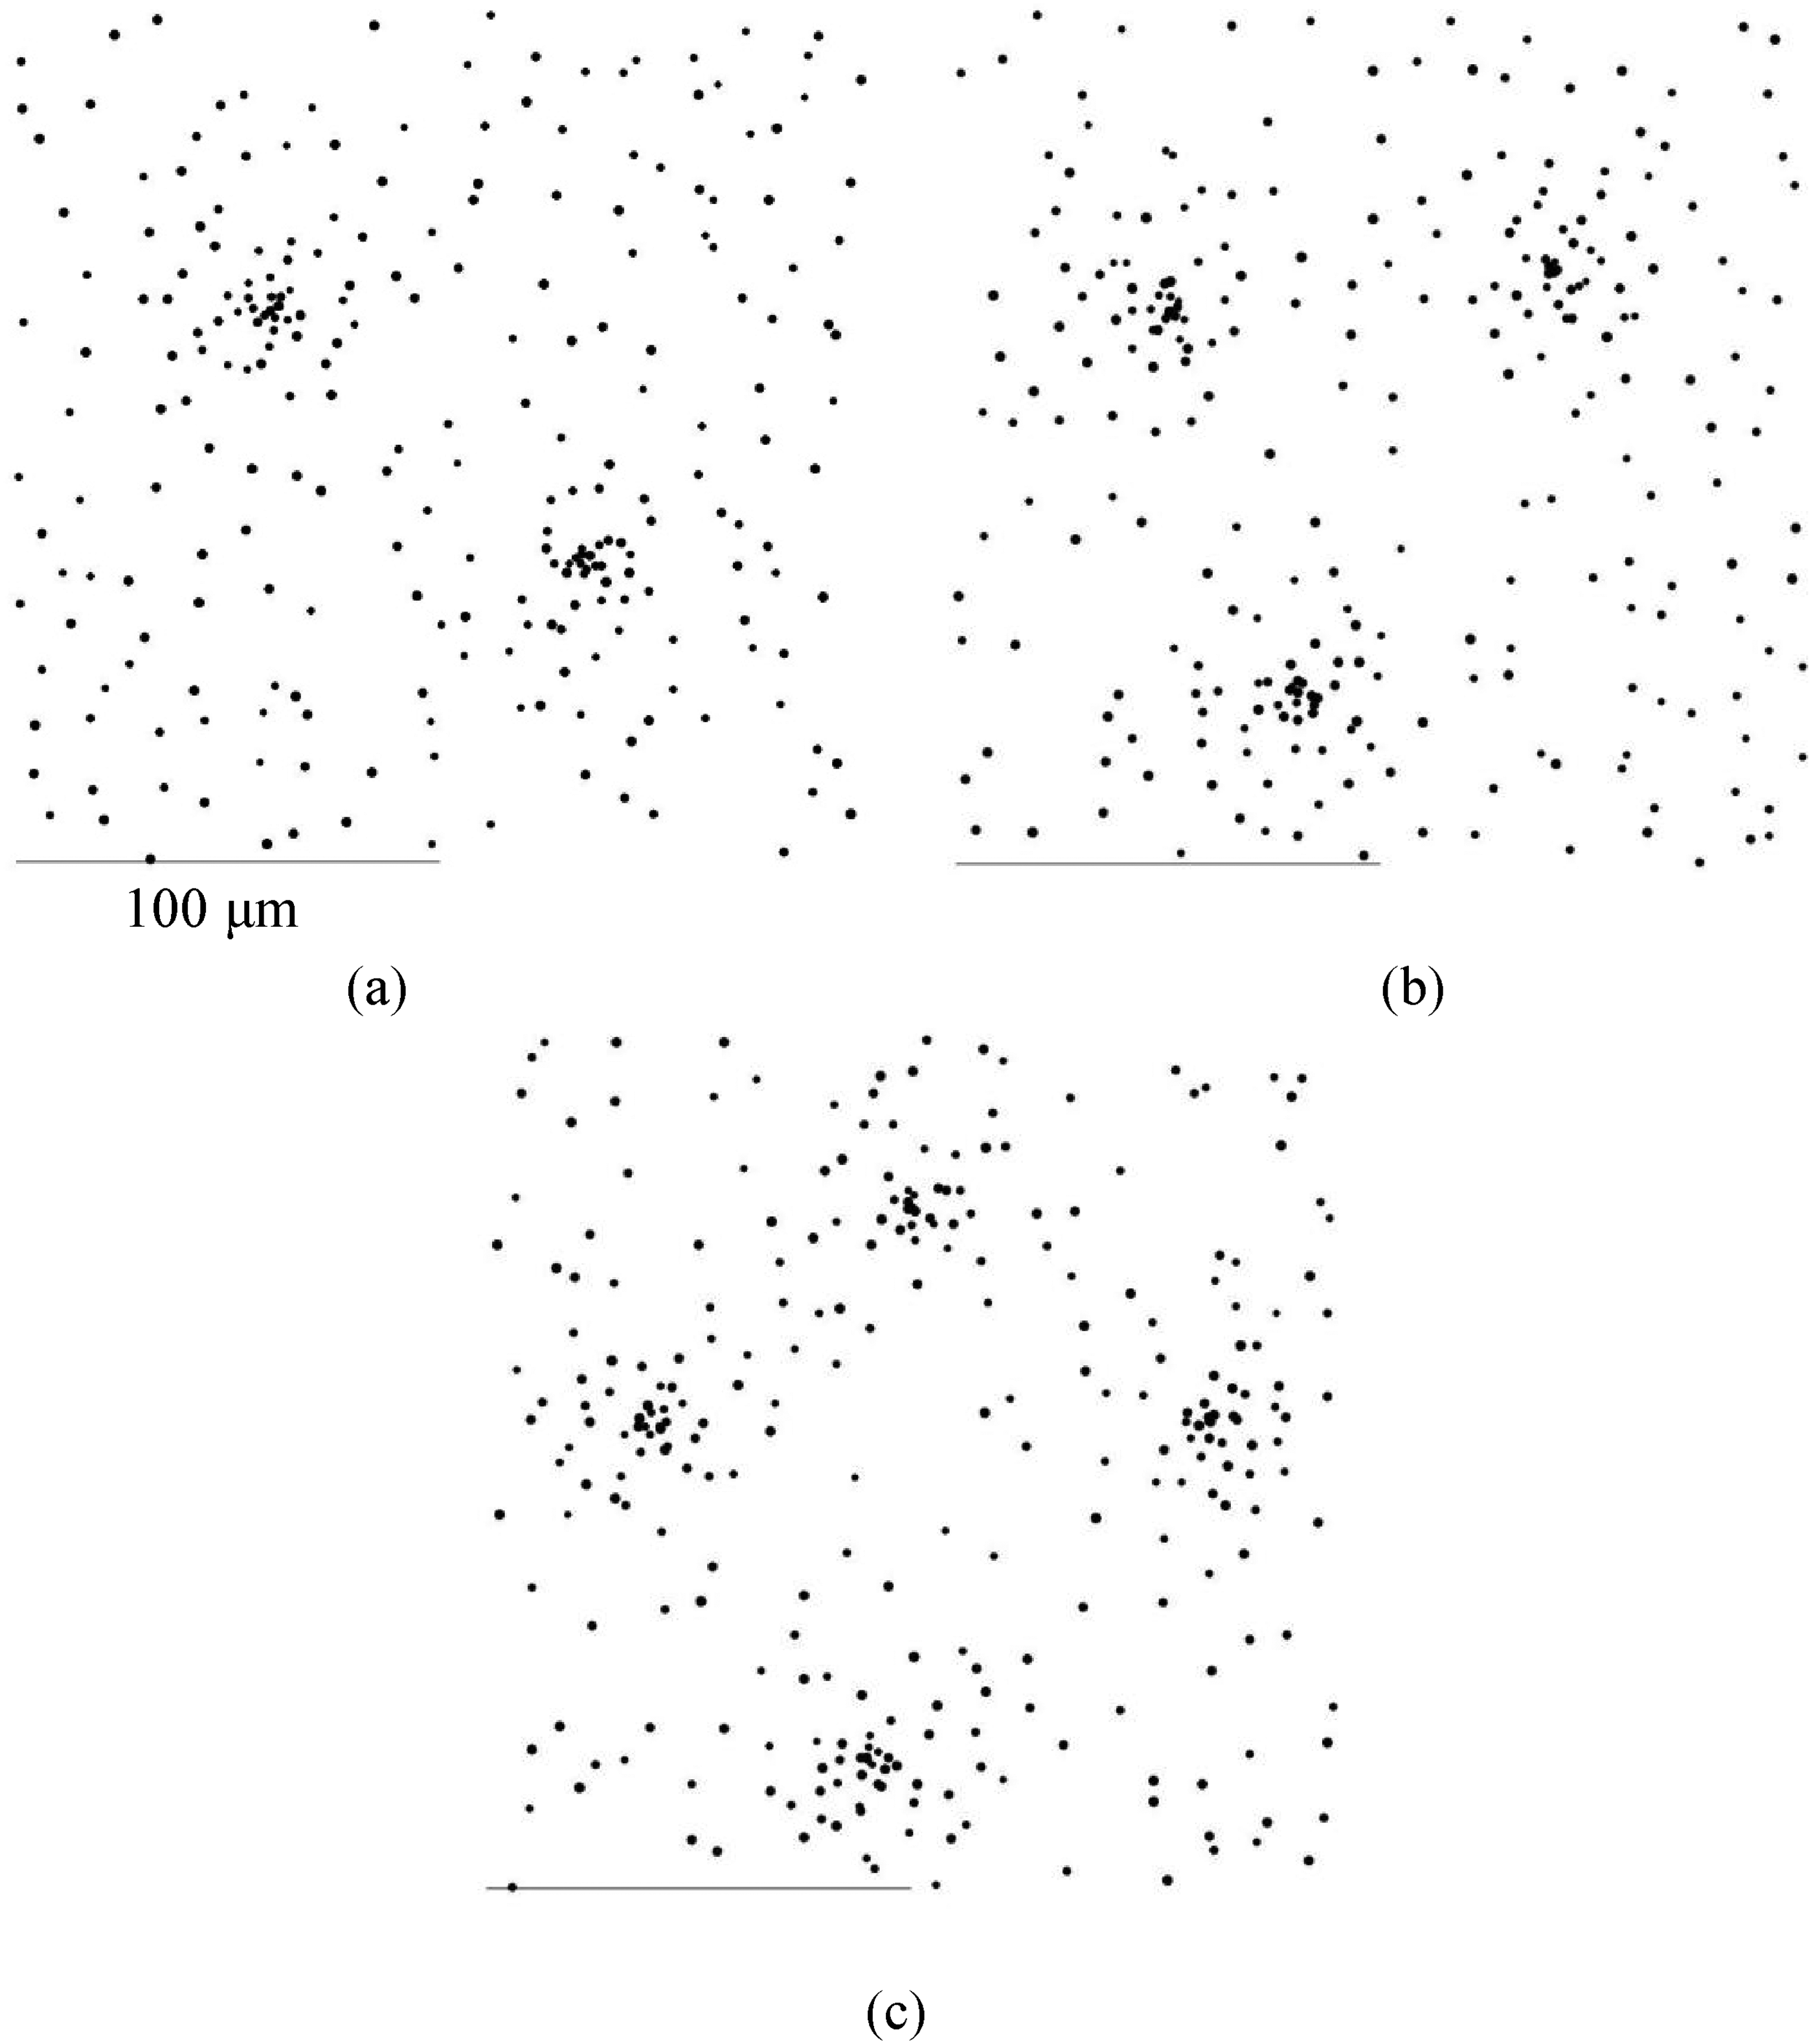
Simulated scatter plots with (a) 2, (b) 3 and (c) 4 clustering cores under an areal density about 7000 particles/mm2.
Assessing the non-uniformity of two-dimensional scatter distributions requires an indicator that exhibits high sensitivity to non-uniformity levels while maintaining robustness against variations in areal density. Triangulation was applied to the simulated scatter plots described in Section 2.2, yielding geometric parameters including edge lengths and triangle areas. The non-uniformity of scatter points directly influences the consistency of triangular mesh properties, manifesting as increased variability in edge lengths and triangle areas.
Bertram
4
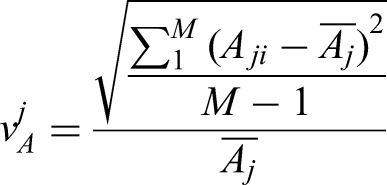
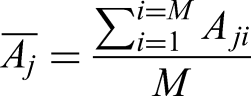
had pointed out the correlations between non-uniformity and coefficient of variation (CV of DND). So this work systematically examined the responsiveness of a series of coefficients of variation to scatter distribution non-uniformity in order to find out an appropriate univariate indicator. The coefficients of variation included: va: CV of area, the ratio of standard deviation to average value of triangle areas in the triangular mesh on the field of view; vA: the mean value of all CVs of nearest-neighbor triangle area around each scatter point. As shown in Figure 6(a), the CV of nearest-neighbor triangle area at a certain point with M triangles around, is:
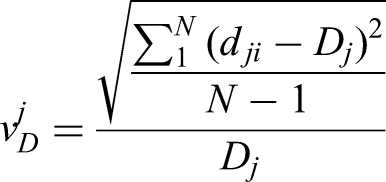
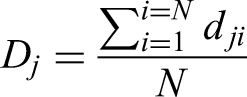
vD: the mean value of all CVs of DND around each scatter point. As shown in Figure 6(b), the CV of DND at a certain point with N edges around is:
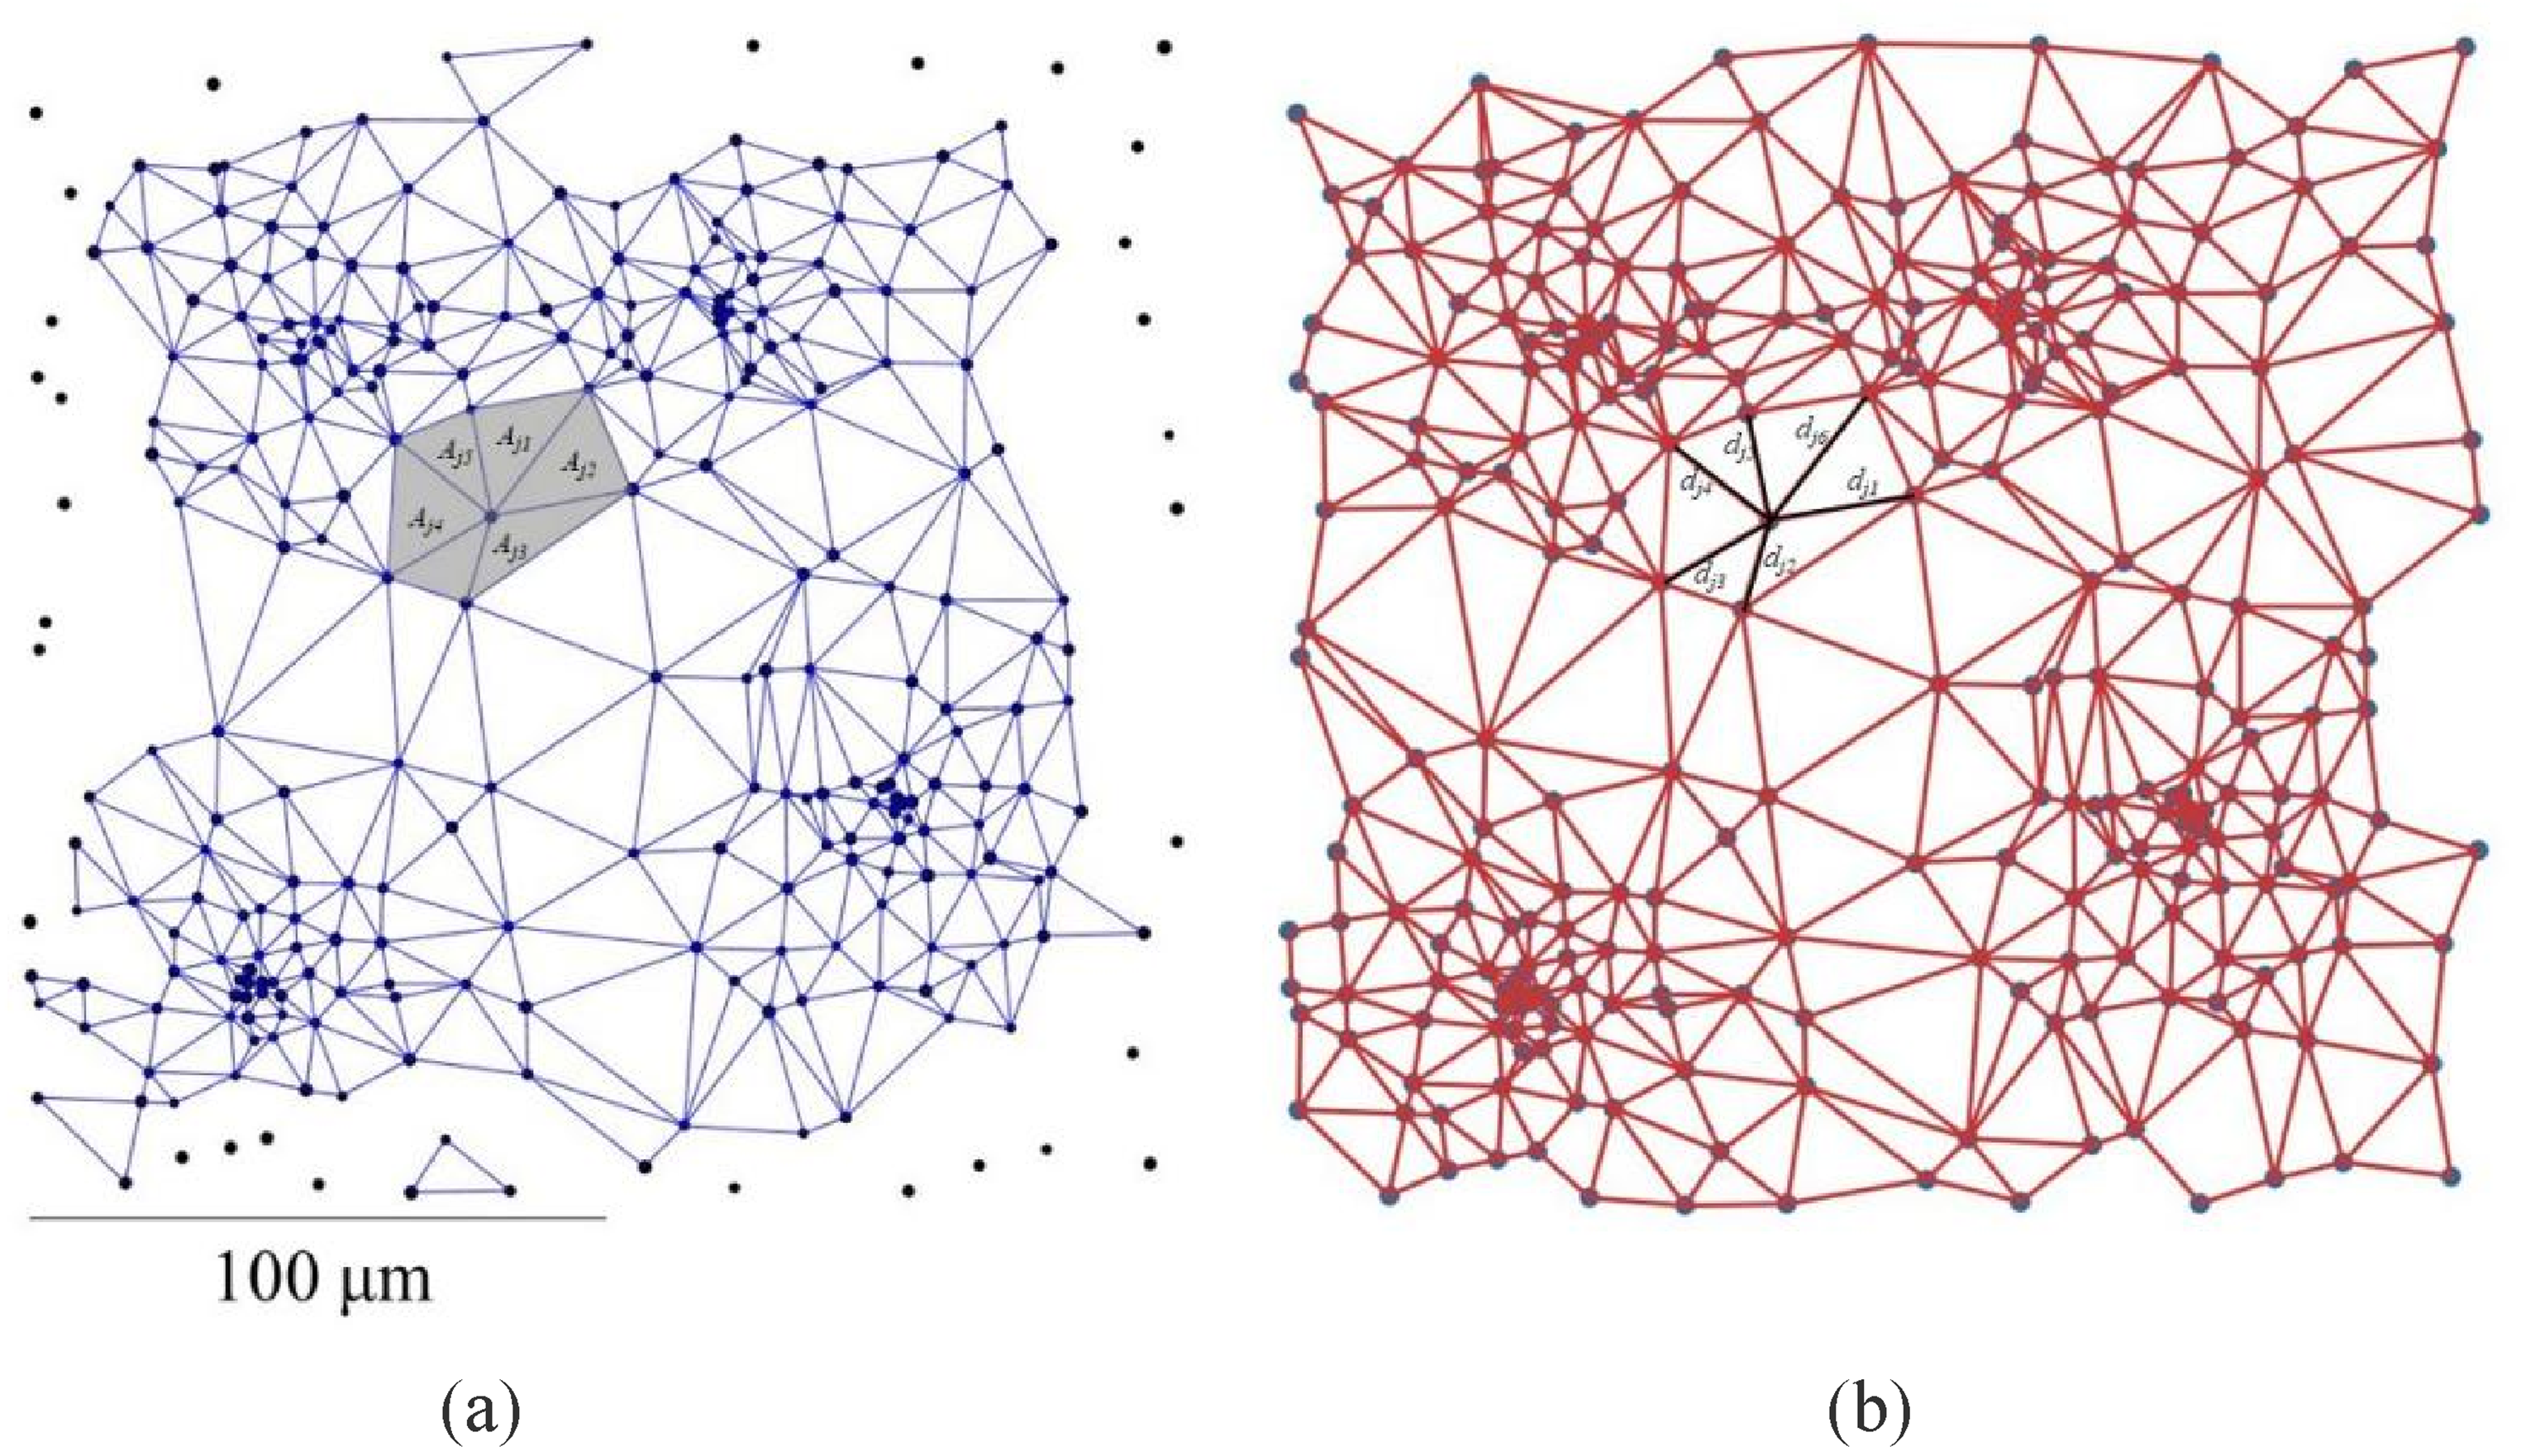
Example of (a) the nearest-neighbor triangle and (b) delaunay neighbor distance (DND) in a simulated scatter with 4 clustering centers under an areal density about 7000 particles/mm2.
Fig 7 shows the distribution of various CVs with the areal density of scatter points in each simulated scatter plot, where different markers represent different numbers of clustering centers. Both vA and vD exhibit a significant convergence trend as the areal density of scatter points increases. That is because both vA and vD are the mean values of the CVs at each scatter point, and as the number of points increases, the weight of the variability among individual points decreases, thus, for the same level of non-uniformity, a higher number of points (areal density) results in a smaller mean CV. This indicates that the areal density affects these two coefficients of variation. When evaluating the distribution non-uniformity of MnS inclusions, it is necessary to exclude the influence of areal density variation. Therefore, vA and vD are not suitable.
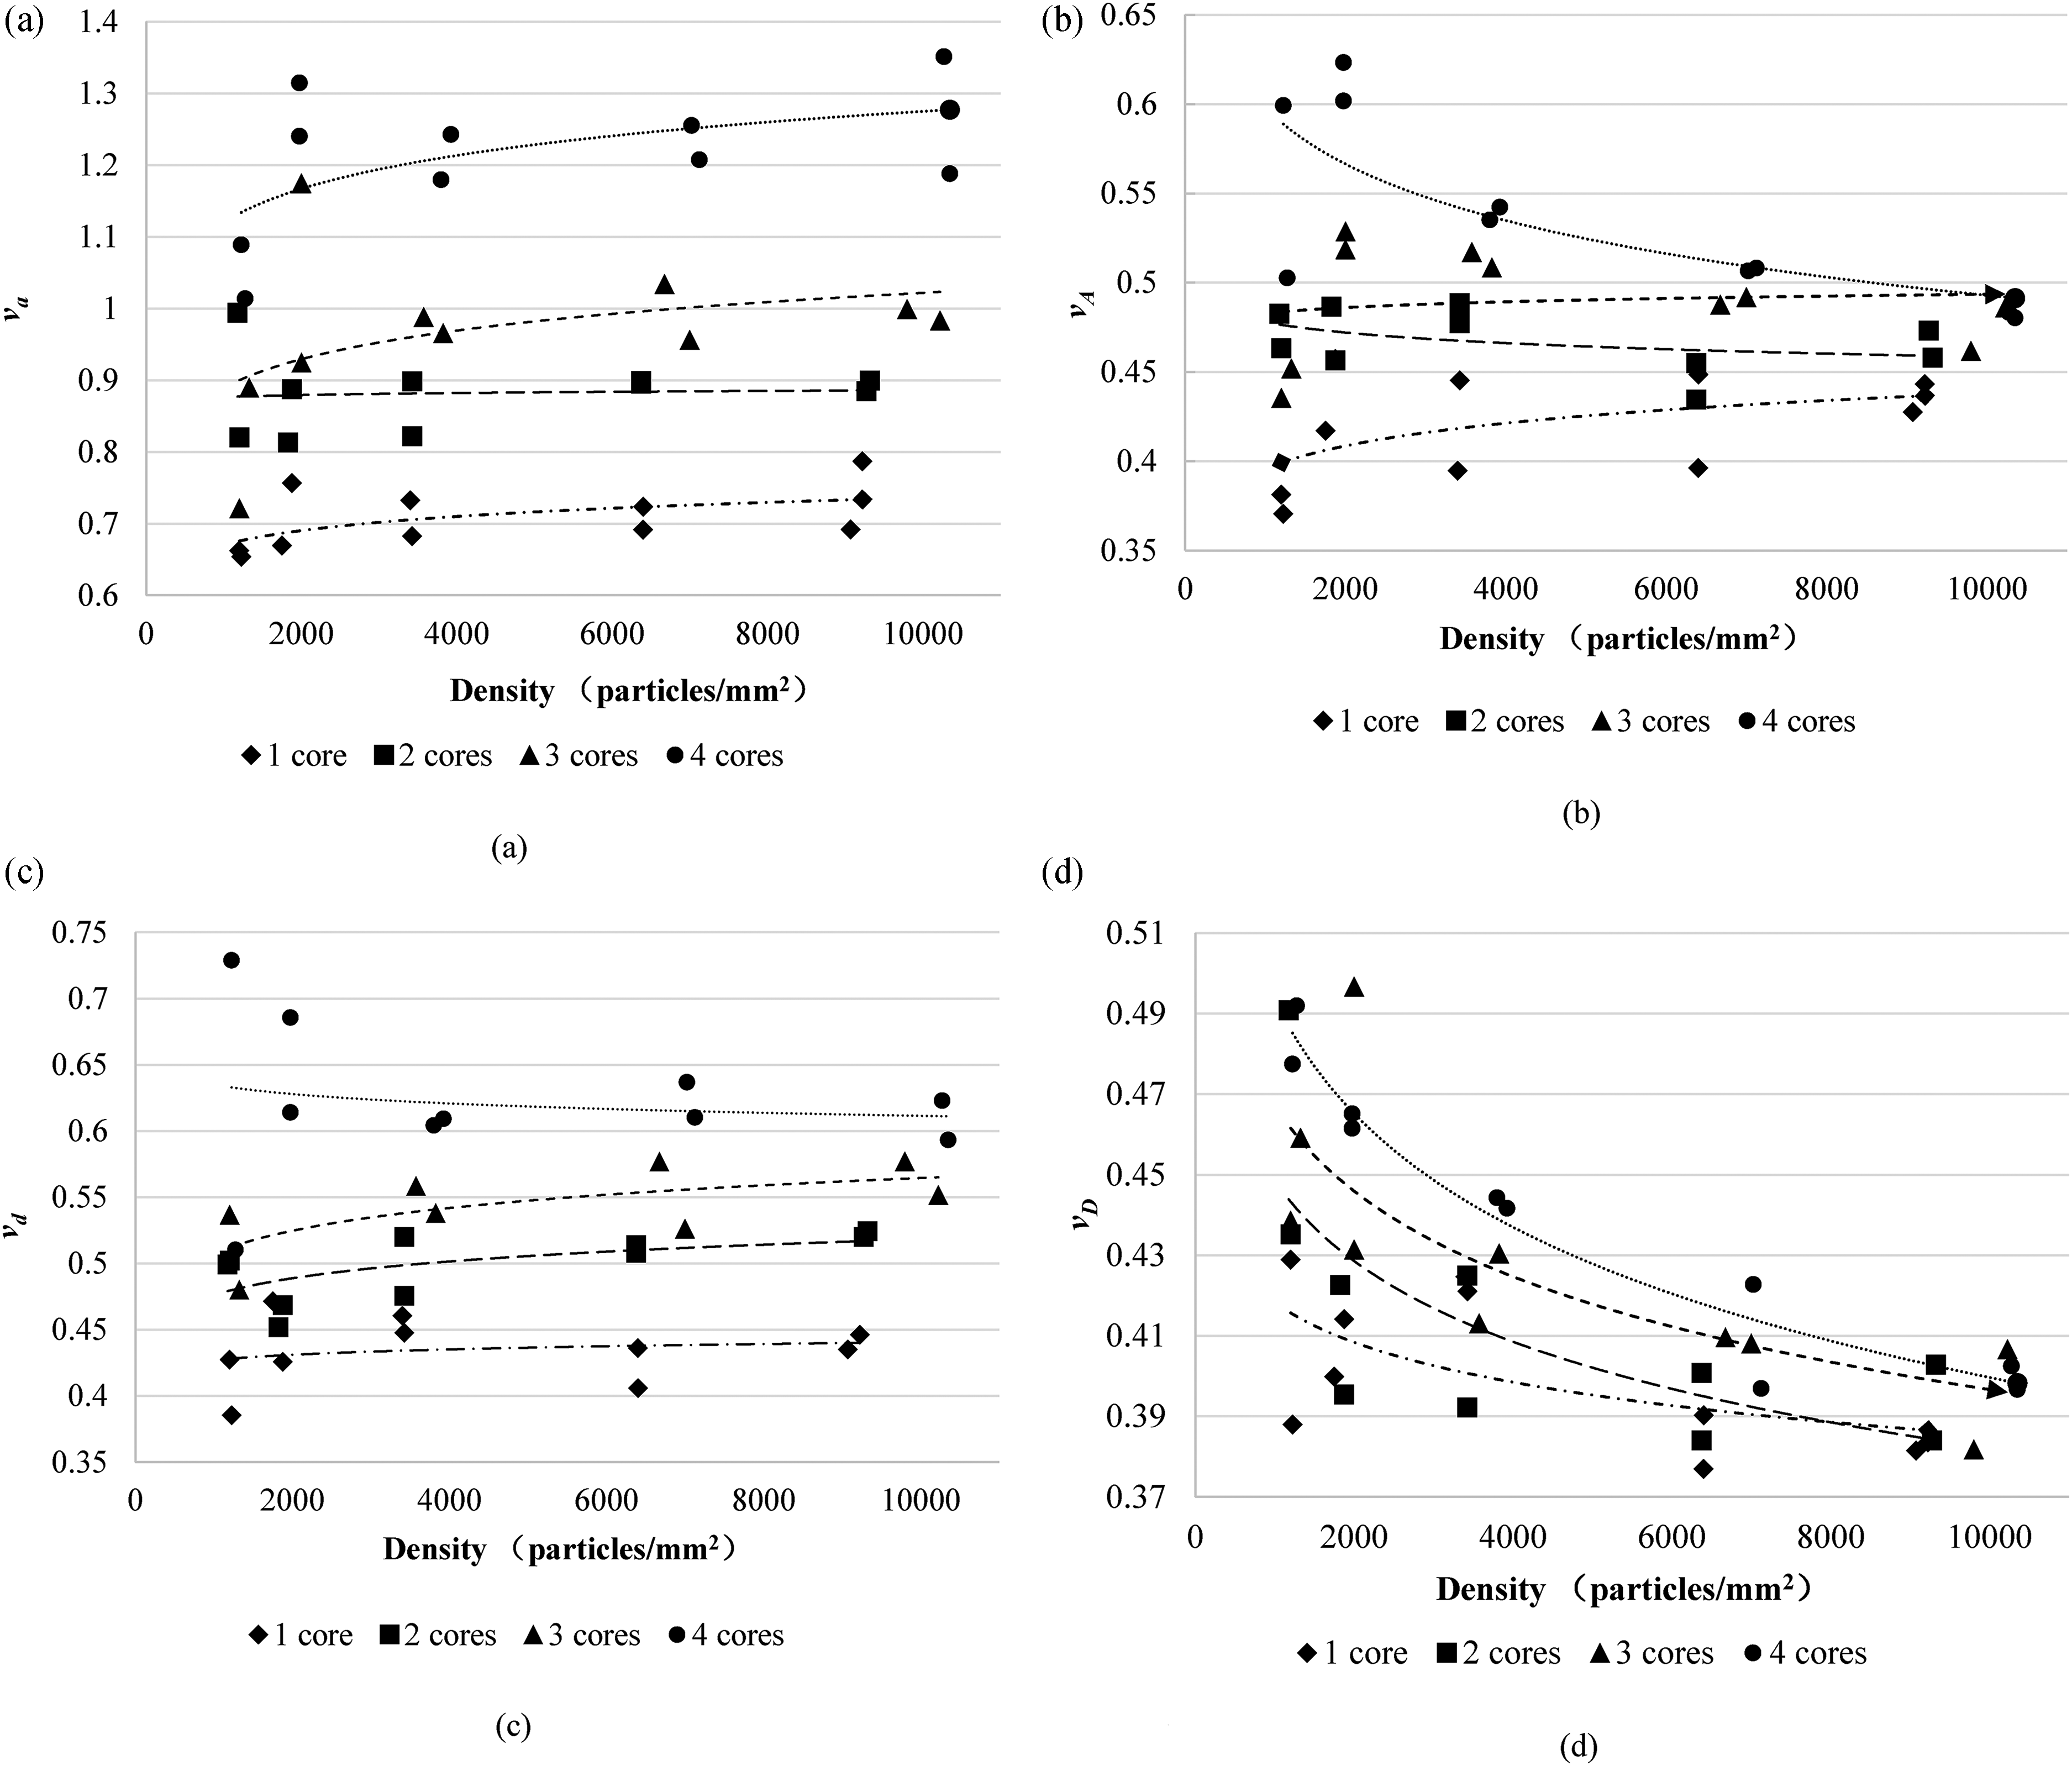
Response of coefficients of variation to the areal densities and numbers of clustering cores: (a) va, (b) vA, (c) vd and (d) vD.
The convergence trend of va with increasing scatter areal density is less pronounced. However, the its values under different clustering core numbers overlapped, and the variations under identical scatter plot conditions are great, that means it is insensitive to reflect the non-uniformity changes. The vd is defined as the ratio of the standard deviation to average value of the edge lengths in the triangular mesh. It reflects the non-uniformity of edge lengths across the entire mesh and is insensitive to the number of points. The distribution of vd approaches horizontal with increasing areal density, while showing distinct gaps between different clustering core numbers. Comparatively, vd is most suitable for assessing the non-uniformity of scatter point distribution.
Cutting performance
Turning experiments were conducted on the free-cutting steel using bar specimens with a diameter of 45 mm. The longitudinal direction of the bars was parallel to the rolling direction. During the turning tests, key parameters including the cutting tool, feed rate, and depth of cut were held constant. Only the cutting speed was varied, with values set at 50, 100, 150, and 200 m/min. One end of a specimen was fixed in a clamp, while the other end was turned from the outer diameter inward until one-third of the diameter was removed. The average cutting force (F) (Table 1) was measured during this process to evaluate the material's machinability, where lower cutting force indicates better cutting performance. The results demonstrate that 1215MS exhibited superior cutting performance compared to 1215.
Data of cutting test.
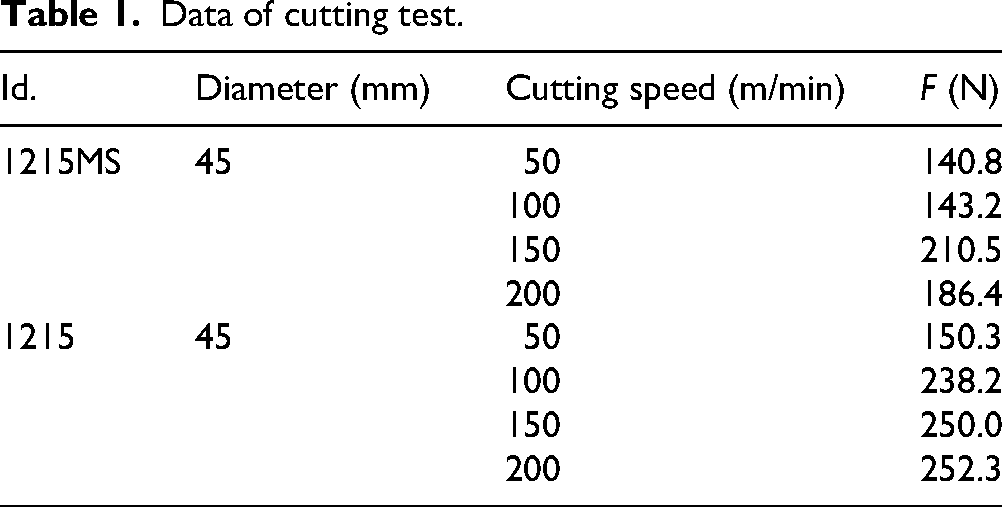
Data of cutting test.
6∼8 backscattered electron (BSE) images at 300× magnification were randomly captured at the edge, 1/4 of the diameter, and 1/4 of the diameter regions of each specimen, which were used to analyze the distribution of MnS inclusions. The typical image at each position is shown in Figure 8.
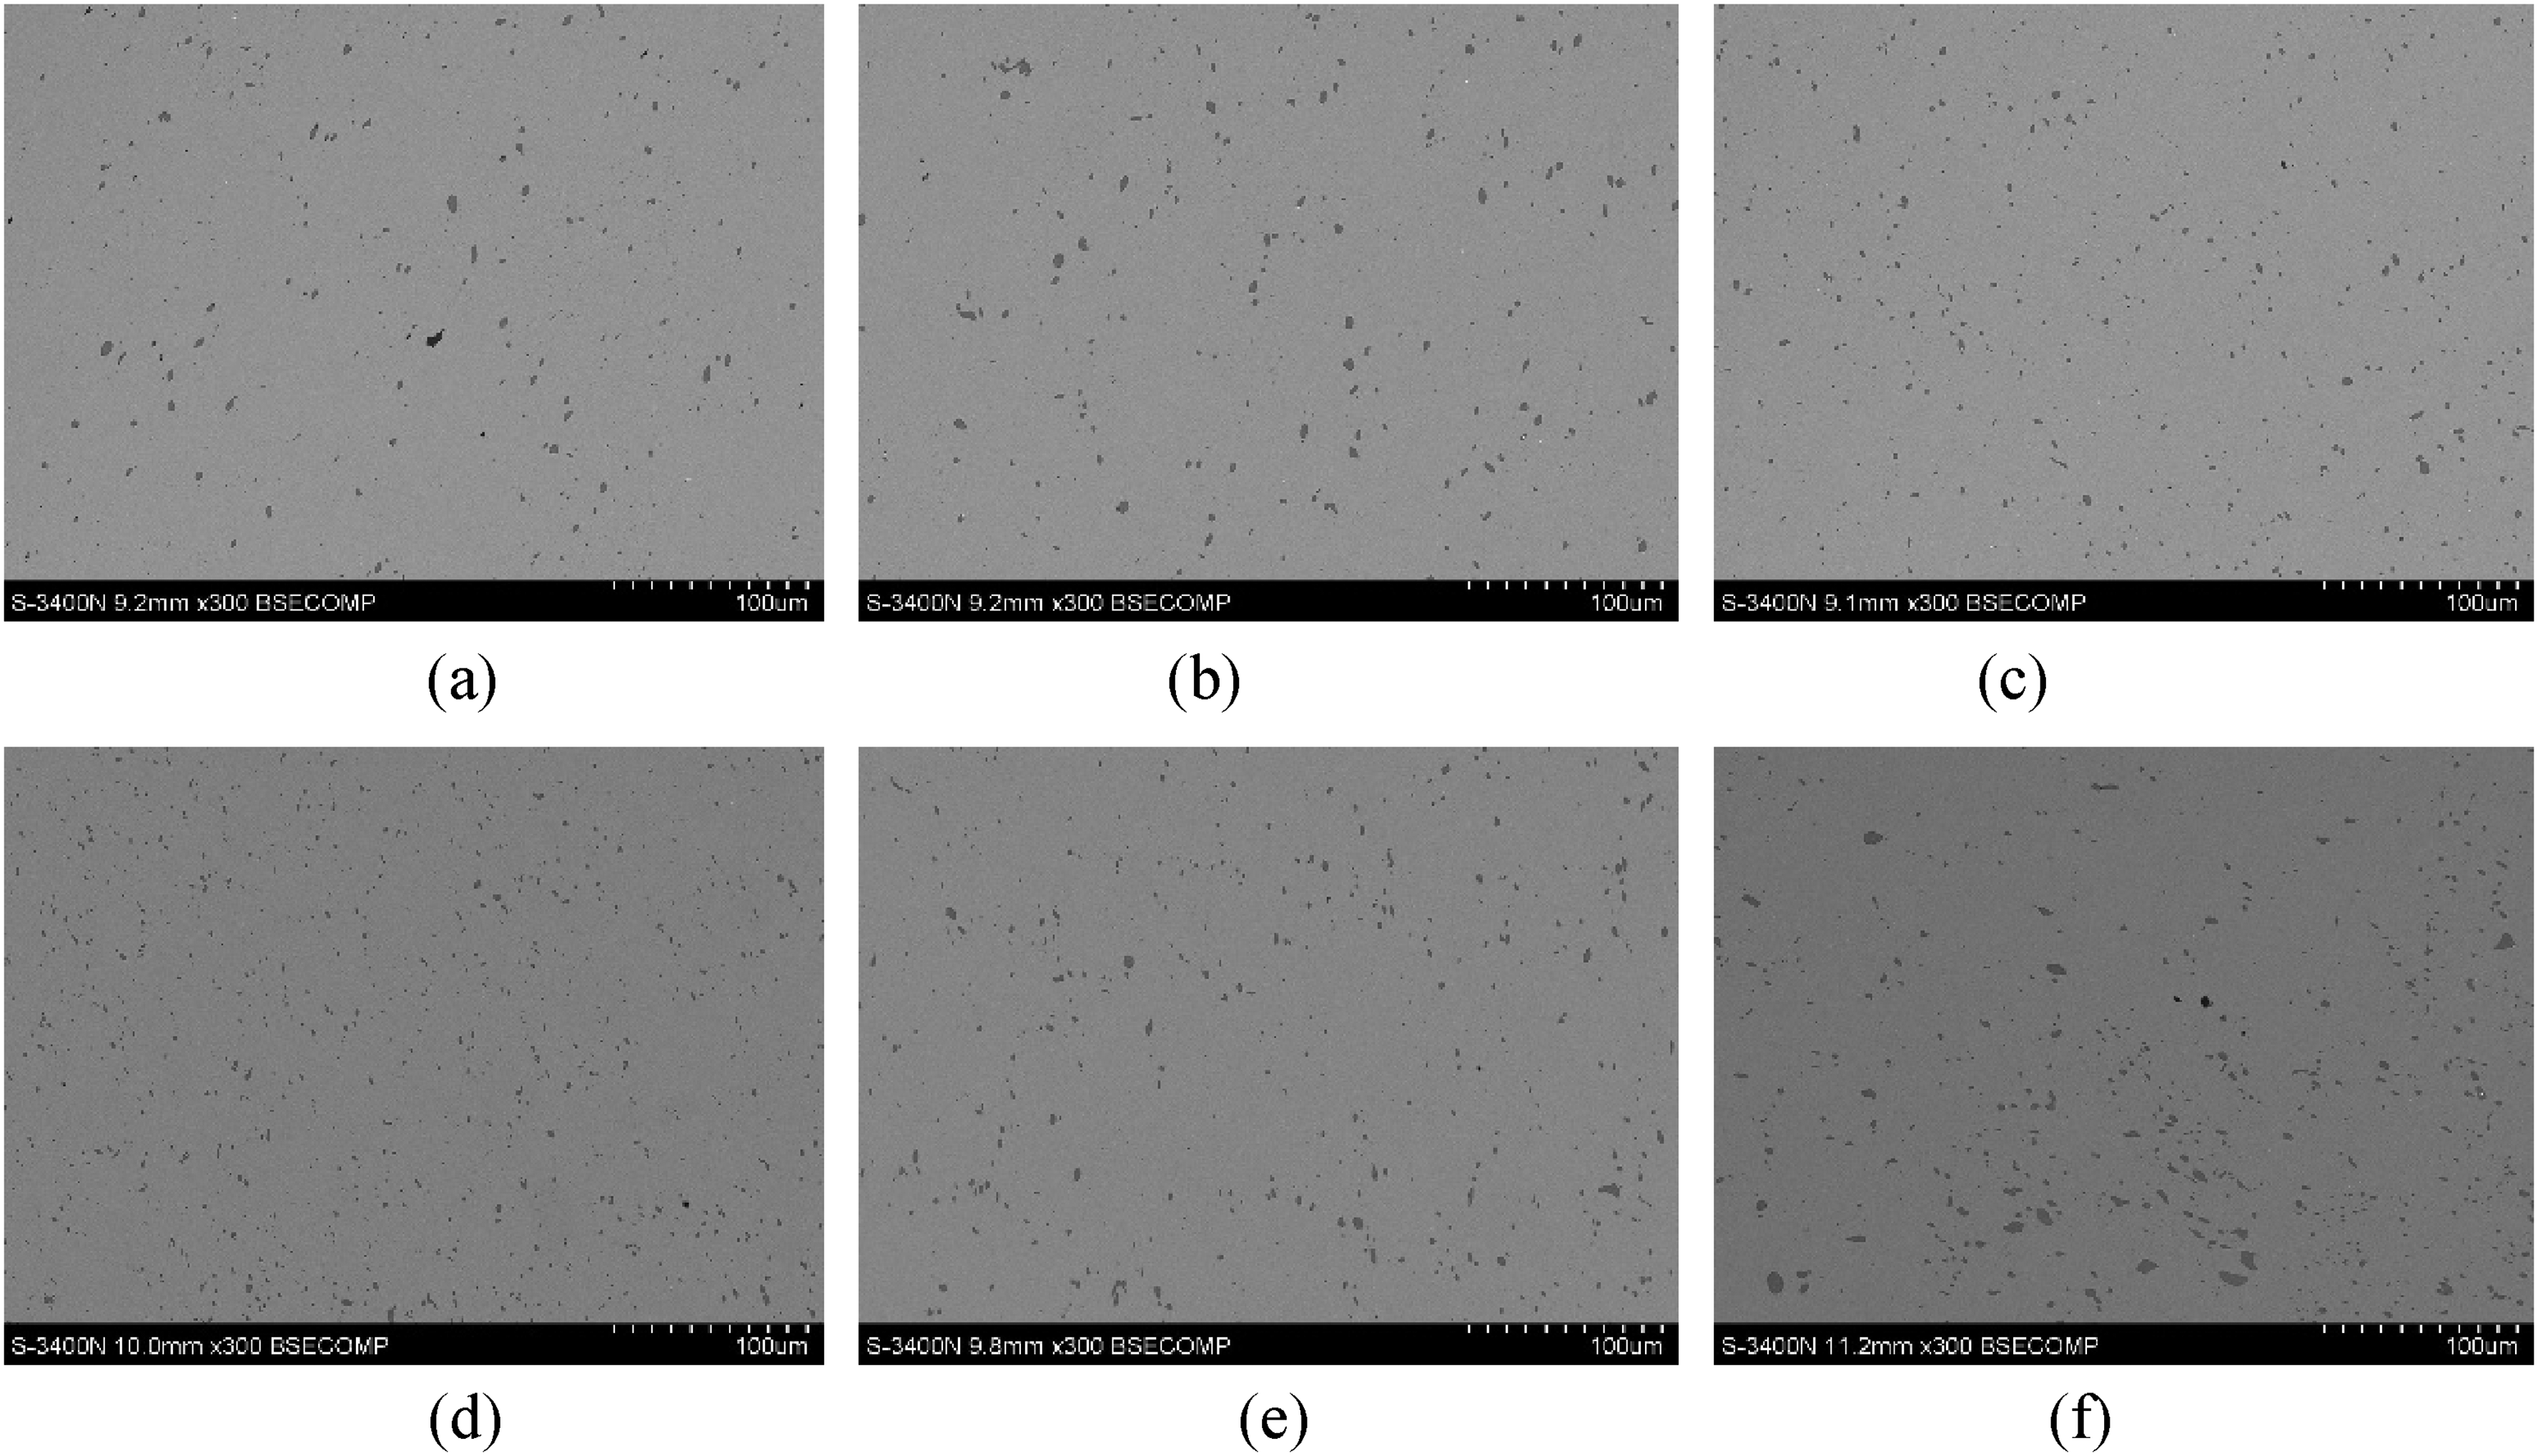
BSE images of MnS inclusions in every region of the two specimens: (a) edge, (b)1/4 diameter and (c)1/2 diameter position of 1215; (d) edge, (e)1/4 diameter and (f)1/2 diameter position of 1215MS.
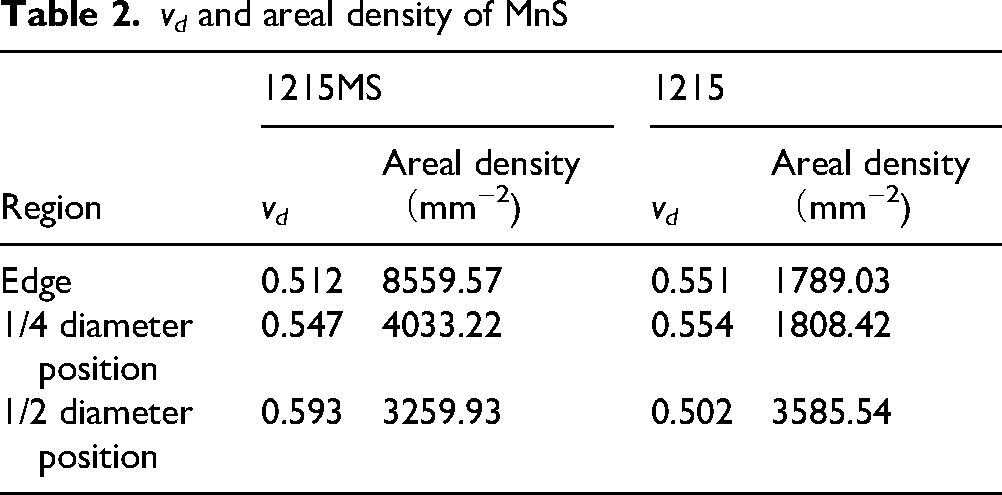
Triangulation was performed on the images by taking the centroids of MnS particles as nodal points, as shown in Figure 9. The geometric parameters of the triangular mesh—including edge lengths and triangle areas—were subsequently extracted for analysis. The average of the analysis results for each position was listed in Table 2.

Delaunay triangulation of MnS inclusions in every region of the two samples: (a) edge, (b)1/4 diameter and (c)1/2 diameter position of 1215; (d) edge, (e)1/4 diameter and (f)1/2 diameter position of 1215MS.
v d and areal density of MnS
As shown in (a), (b), and (c) of Fig 8, for the 1215 steel grade, the distribution of MnS inclusions is generally consistent at the edge and the 1/4 diameter position, while the areal density of sulfide inclusions at the 1/2 diameter position is slightly higher, with marginally better uniformity. However, for the 1215MS steel grade, as illustrated in (d), (e), and (f) of Fig 8, the distribution varies more significantly across the three positions. These observations are consistent with the areal density and distribution uniformity data calculated using triangulation, as presented in Table 2.
In general, the edge region typically exhibits the lowest degree of elemental segregation. Additionally, an excessively high cooling rate can lead to abnormal inclusion morphology. The 1/2 diameter position is generally the area with the most severe elemental segregation, whereas the 1/4 diameter position experiences a moderate level of segregation, and its deformation behavior is considered representative.
Consequently, the 1/4 diameter position is regarded as the position that best balances and represents the overall material characteristics. This conclusion is primarily based on a comprehensive consideration of the segregation patterns in the continuous casting bloom and the impact of subsequent hot working deformation, with the aim of obtaining the most representative and reproducible inspection results.Therefore, this study adopts the sulfide distribution at the 1/4 diameter position for subsequent analysis and comparison.
During turning experiments the tool tip encountered sulfides, the chips fractured. A more uniform distribution of MnS inclusions on the transverse section of the bar specimen contributed to lowering the tool tip temperature, reducing the cutting force, and improving the surface finish. Therefore, the distribution uniformity of sulfide on the transverse section significantly influenced the cutting force in the turning experiments. As noted previously, the cutting tests were performed from the outer part of the specimen bar to the 1/3 diameter position, with the cutting force representing the average value over this specific section. Therefore, it is reasonable to evaluate the machinability by correlating the sulfide distribution at the 1/4 diameter position with the measured cutting force.
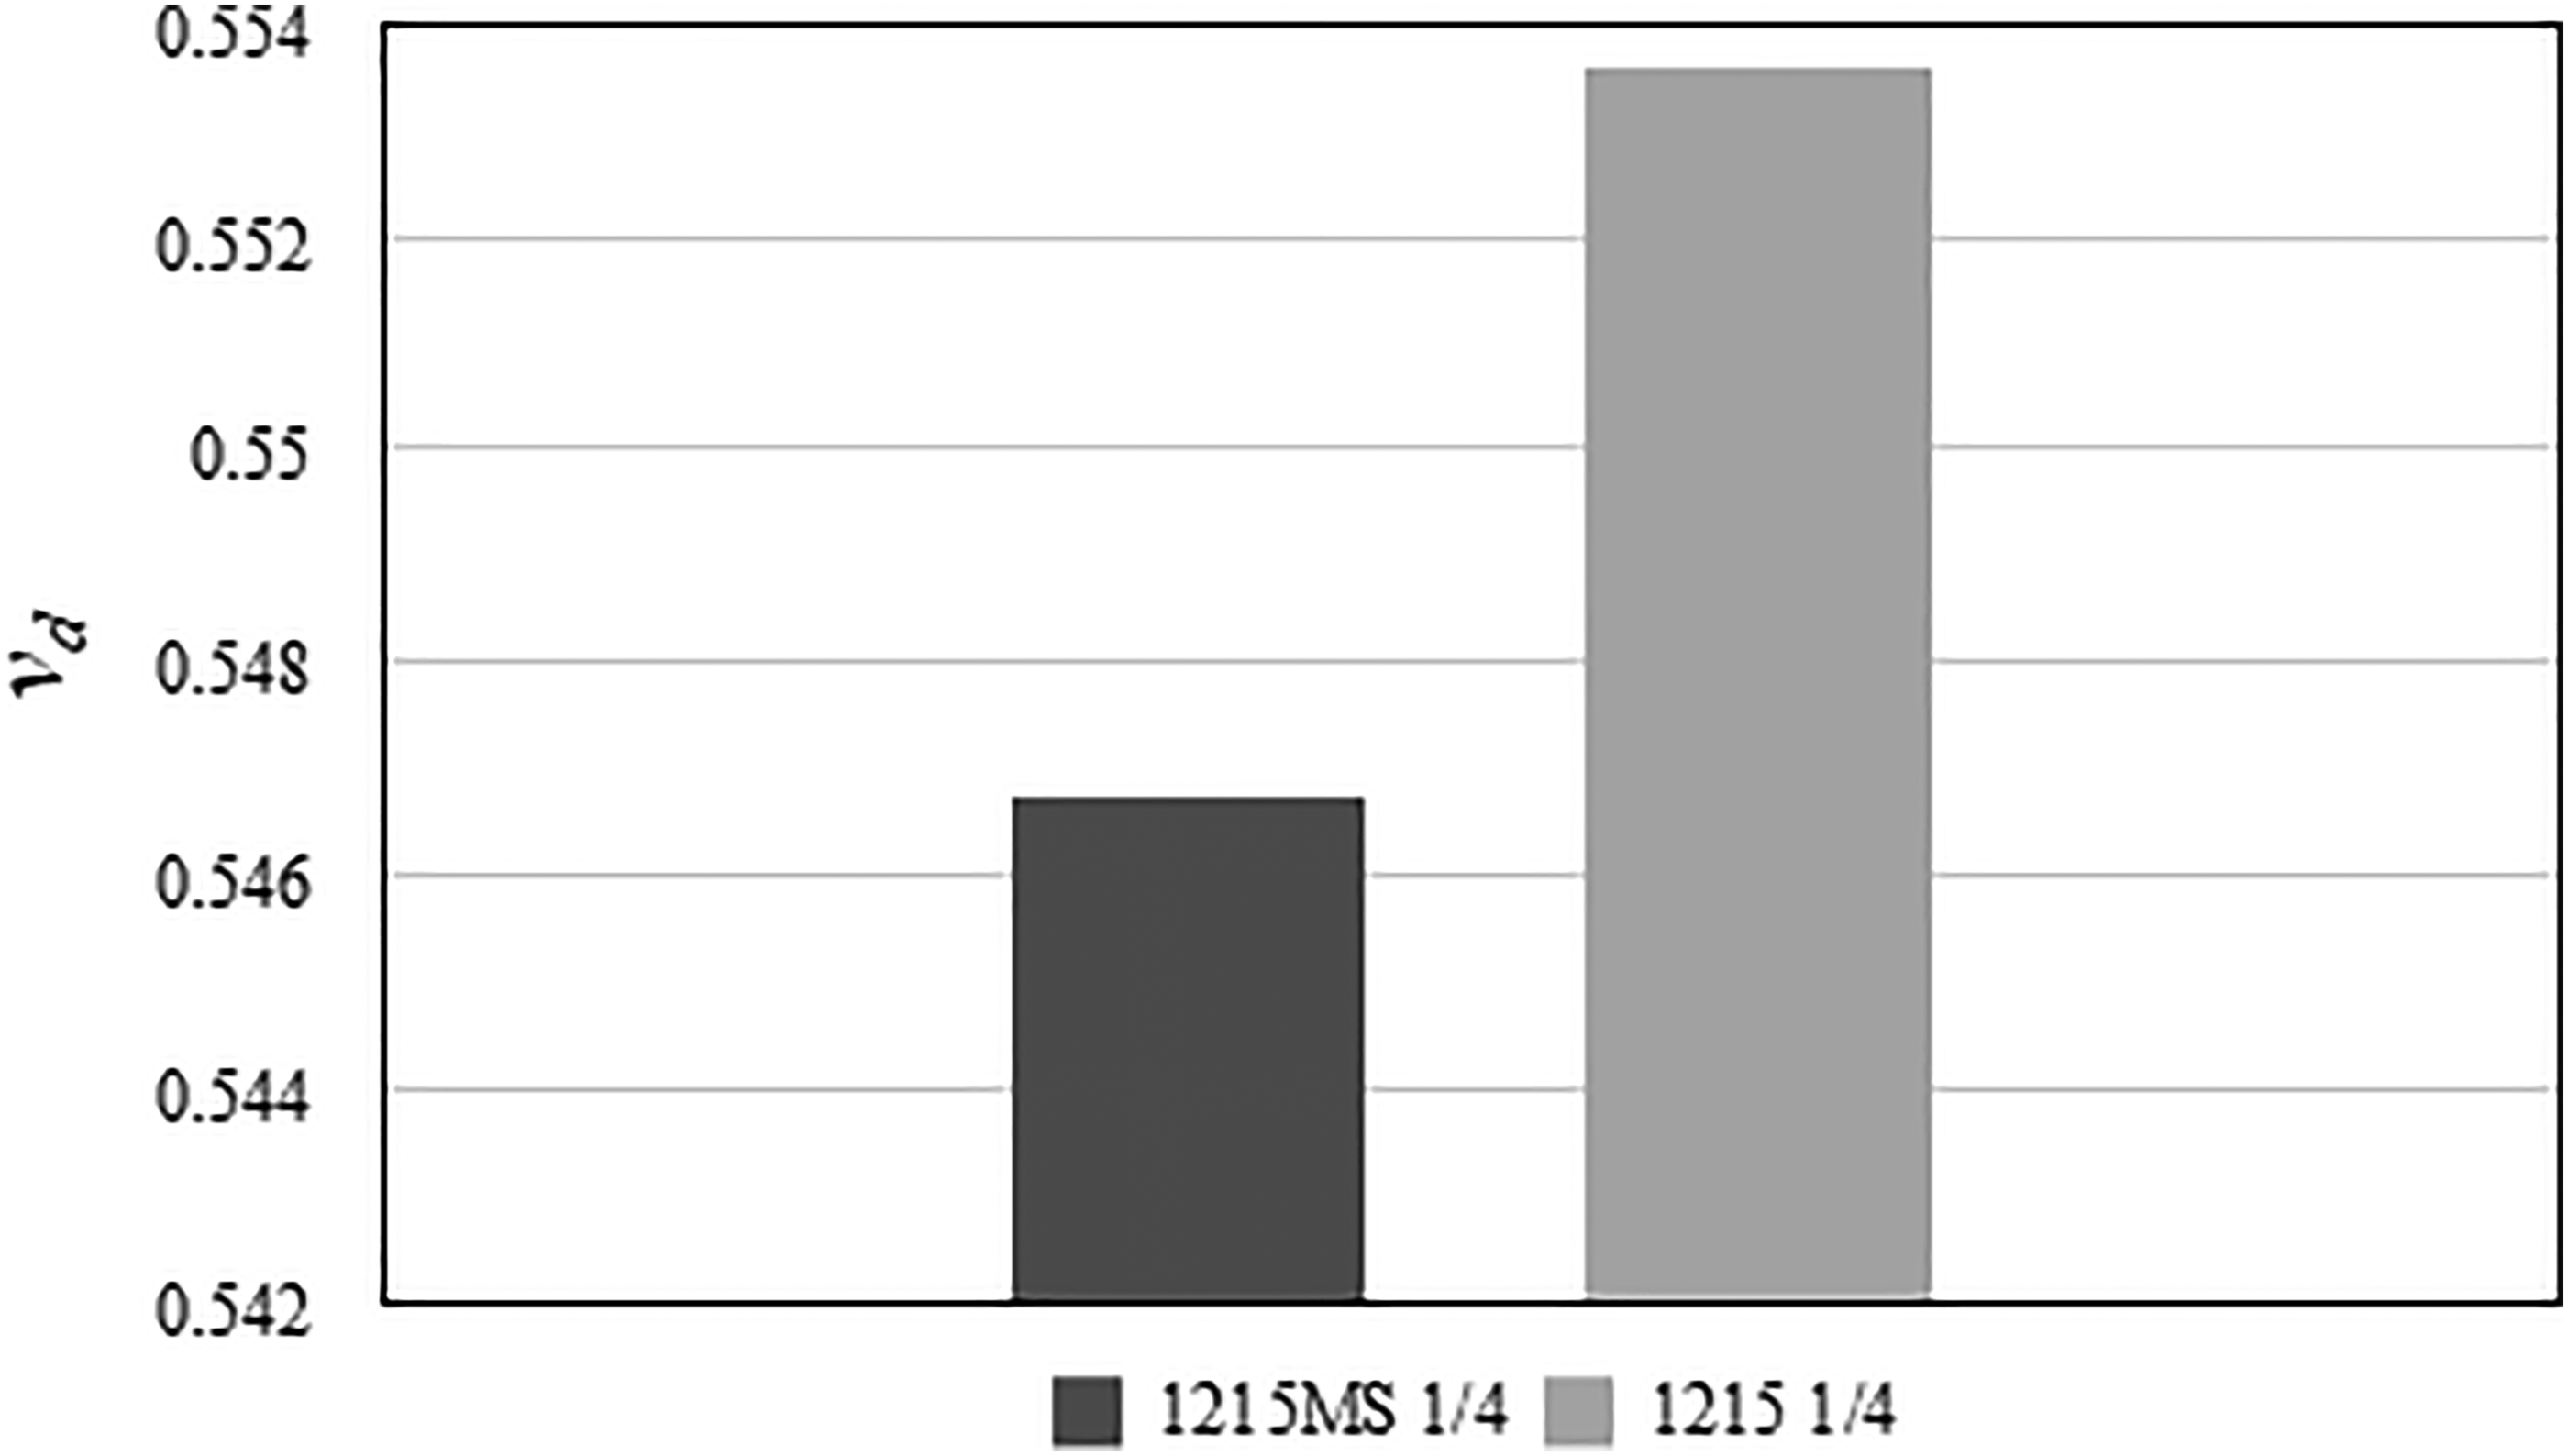
A comparative analysis of the vd values at the 1/4 position between steel grades 1215 and 1215MS (Fig 10) reveals that 1215MS exhibits significantly better uniformity in MnS distribution. As a result, its cutting force is lower than that of 1215 across all cutting speeds listed in Table 1, demonstrating superior machinability.
Statistical results of triangulation meshes of MnS inclusions in 1/4 diameter position of the two specimens.
The vd indicator proposed in this study was specifically developed to characterize MnS inclusions in free-cutting steel. Its applicability to other inclusion types, such as oxides, nitrides, or carbides, requires further validation. From a modeling perspective, however, the vd indicator can be adopted to evaluate any inclusion type, provided that its appearance on a specific observation plane is analogous to that of MnS on the transverse section of free-cutting steel. This principle is exemplified by the successful application of a similar analytical approach to assess the distribution uniformity of spheroidized carbides in spheroidized annealed microstructures.
This study developed simulated two-dimensional scatter plots with controlled areal density gradients and clustering degrees, based on the actual distribution characteristics of MnS inclusions in free-cutting steel, for subsequent Delaunay triangulation analysis. A robust indicator for assessing MnS distribution non-uniformity was selected and applied to the free-cutting steels 1215MS and 1215. The key conclusions are as follows:
The coefficient of variation of the Delaunay edge lengths (vd) is highly sensitive to distribution non-uniformity yet remains largely unaffected by variations in areal density, establishing it as a reliable indicator. For a given areal density, a higher vd value signifies a greater degree of non-uniformity. When applied to analyze MnS inclusions in free-cutting steel, the results reveal a significant positive correlation between the vd value and cutting resistance. While the vd indicator is derived from simulated 2D scatter plots, a discrepancy exists between these simulations and actual inclusion distributions. This deviation primarily arises from model simplifications: the simulations employed circular scatters with randomized areas within a defined range, neglecting the realistic variations in size and aspect ratio observed in actual inclusions on the transverse section. These morphological factors may also influence cutting performance. The influence of MnS inclusions on cutting performance is twofold: (a) Distribution non-uniformity: a more uniform distribution promotes more stable chip breakage. (b) Areal density: a higher density of inclusions facilitates easier chip breaking. In specimen 1215MS, the MnS distribution is more uniform at the edge and 1/4 diameter positions compared to 1215, and it also exhibits a higher areal density. Both attributes contribute to enhanced chip fragmentation, which is consistent with the superior cutting performance (i.e., lower measured cutting loads) of 1215MS. This correlation underscores the potential to establish a quantitative relationship between microstructural characteristics and macroscopic machining performance, thereby enabling the prediction of cutting resistance based on inclusion distribution.
Footnotes
Acknowledgments
The authors gratefully acknowledge Mr HAM Jongoh for his inspirational input and constructive discussions during the development of this research.
Author contribution(s)
Funding
The authors received no financial support for the research, authorship, and/or publication of this article.
Declaration of conflicting interests
The authors declared no potential conflicts of interest with respect to the research, authorship, and/or publication of this article.
Data availability
Data will be made available upon request.