
Abstract
The addition of reduced graphene oxide (rGO) to the negative active material (NAM) of advanced flooded lead-acid batteries can enhance battery life under partial state of charge (PSoC) conditions. Hence, we sought to evaluate the effects of different rGO concentrations (0.20%, 0.75%, and 1.40%) on battery performance. The rGO was synthesized using an improved Hummers method. Microstructural characterization of rGO involved X-ray diffraction, scanning electron microscopy, Raman spectroscopy, and other techniques. Electrochemical characterization, including cyclic voltammetry and electrochemical impedance spectroscopy, confirmed rGO's superior specific capacitance compared to conventional carbon additives. Capacitance studies showed that approximately 38% of rGO's total capacitance was due to pseudocapacitance. Battery performance tests under PSoC conditions revealed that NAM containing 0.20% rGO exhibited a 21% increase in cycle life and a 6.1% higher C20 specific capacity than control plates with advanced carbon black. However, higher rGO concentrations (0.75% and 1.40%) led to reduced performance due to increased faradaic processes involving hydrogen evolution. These findings suggest that rGO can be an effective additive for advanced flooded lead-acid batteries, provided its concentration is carefully optimized to maximize benefits while minimizing adverse effects.
Keywords
Introduction
The automotive industry, under pressure from public policies, 1 has been advancing in vehicle electrification projects, ranging from the integration of electric and combustion engines in hybrid vehicles to fully electric vehicles. To meet the emerging demand characterized by fast charging at high current rates, an increased number of charge/discharge cycles, and operation in a partial state of charge (PSoC), as observed in hybrid vehicles, it is necessary to develop high-performance energy storage systems. In this scenario, a circular battery economy, both economically and environmentally responsible, presents a key opportunity to align with the long-term goals of the Paris Agreement, which aims to limit the average global temperature increase to below 2 °C compared to pre-industrial levels. 2
Given their advantages in production costs, an established production chain, and dominance in reverse logistics systems with recycling rates of 98–99% in Europe and the United States,3,4 the long-established lead-acid battery remains a viable technology for energy storage systems. In effect, the lead-acid battery continues to be a suitable alternative to current demands to store energy produced from renewable sources (e.g., wind and solar) and in some hybrid and electric vehicle applications.3,5 In hybrid vehicles operating in a PSoC, the main failure mode reported is the excessive accumulation of lead sulfate (PbSO4) on the negative plate. Under PSoC conditions, lead sulfate crystals undergo growth through the “Ostwald Ripening” process, 6 resulting in larger PbSO4 crystals and compromising recharge efficiency due to the highly passivating nature of this material. The negative plate is particularly affected due to its smaller surface area (0.5–1.0 m2 g−1) compared to the positive plate (4.0–5.0 m2 g−1). 6 If uncontrolled, this phenomenon compromises battery performance and shortens its lifespan.
The sulfation of the negative active material (NAM) is explained through the electrodic reactions leading to lead sulfate formation from lead metal in sulfuric acid. In this regard, a kinetic model in the literature describes the solid-state zonal reactions of lead sulfate formation, which includes nucleation and growth of a continuous PbSO4 film. However, the presence of high electric fields causes partial external rupture of the PbSO4 films due to electrostriction, followed by recrystallization of the ruptured part.7,8 Another traditional kinetic model considers that PbSO4 film formation occurs via dissolution and precipitation mechanisms. 9 In the first stage, metallic lead is oxidized to Pb2+, which subsequently reacts with sulfate ions (SO4−2) in the electrolyte to form PbSO4, precipitating on the negative plate.
To address the NAM sulfation issue, many studies have incorporated carbonaceous materials as additives in negative plates, enhancing lead-acid battery performance by suppressing lead sulfate accumulation. Different mechanisms have been proposed to explain the additive's role. Moseley et al.6,10 proposed eight potential mechanisms, among which Jhabli et al.
11
highlighted the four main ones:
Increased electrical conductivity facilitated by a conductive carbon network that promotes PbSO4 to Pb (NAM) conversion. The capacitive effect from the charge/discharge of the electric double layer on the carbon surface, improving the reaction kinetics that occur in the electrode. Changes to the microstructural area of active material to facilitate electrolyte diffusion. Steric hindrance, where carbon particles favor lead sulfate formation in the form of small crystals (preventing large crystal accumulation).
Among the various types of carbon studied, Zou and collaborators 12 observed that the use of high surface area carbon black (254 m2 g−1) and activated carbon (1800–2000 m2 g−1), each at a concentration of 0.5%, effectively reduce the PbSO4 crystal size and prolong battery performance in HRPSoC cycles by mitigating sulfation of the negative plates. In the last decade, various researchers13–15 have investigated the effects of adding carbon nanotubes to NAM and have demonstrated the potential for reducing “hard sulfation.” Banerjee et al. 13 reported that even at very low concentrations (0.01% in NAM), the addition of single-walled carbon nanotubes effectively suppresses the sulfation failure mode, which they attributed to the formation of a matrix with enhanced conductivity in the active materials. Regarding cycle life performance, the authors demonstrated increased performance of up to 418% for cells produced with carbon nanotubes compared to those with conventional NAM formulations; however, the life cycle tested was at 50% depth of discharge, and HRPSoC cycles were not performed. Nevertheless, Sugumaran et al. 14 observed that 35 Ah C20 capacity batteries, produced with 0.16% carbon nanotubes in the negative electrodes, achieved a number of HRPSoC cycles 60% higher than conventional batteries, which the authors associated with specific issues related to the overcharge reaction mechanism, though details were not provided.
Recently, research involving the addition of different carbonaceous materials as additives in NAM has increased, such as graphene,16,17 graphene oxide (GO),18,19 and reduced graphene oxide (rGO).20–24 Notably, the use of an rGO known as 3D-rGO stands out because it features a three-dimensional porous structure. 21 The addition of this material to NAM at a concentration of 1% resulted in a number of HRPSoC microcycles 116% higher than those of conventional negative plates (carbon black as additive). The authors attributed this improvement to a synergistic effect between the capacitive property of rGO and the restriction on the size of the PbSO4 crystals formed during discharge. Moreover, the initial C20 capacity of the plates containing 3D-rGO was 18% higher than that of the carbon black version. Naresh et al. 22 found that a hybrid additive composed of TiO2-rGO, added to NAM at a concentration of 0.5%, significantly increased the number of HRPSoC microcycles by 197%. This result was attributed to the capacitive effect exerted by rGO particles during high-rate charges, along with the enhanced ion transport from the surface to the interior of the active material, facilitated by the TiO2-modified porous structure of NAM.
Wei et al. 23 doped rGO with sulfur, obtaining S-rGO, which, when added at 1% to NAM, enabled a number of HRPSoC microcycles up to 13 times greater. The authors suggested that this sulfonation reaction alters the active center for hydrogen evolution, thereby increasing the overpotential for H2 evolution and reducing this reaction. This favors electron conduction for the Pb2+ ion, thereby enhancing the charging process efficiency. Another rGO composite was tested by Liu et al., 24 who investigated the effects of adding N-rGO/PbOand found that the addition of 0.5% of this composite increased the number of HRPSoC microcycles by approximately six times compared to a control sample containing acetylene black. This improvement is attributed to several factors. First, the PbO nanoparticles loaded in rGO increase the overpotential for hydrogen evolution, thus reducing the reaction rate. Furthermore, N-doped rGO promotes a more uniform distribution of the additive in the negative active matrix, strengthening the bond between the particles and providing a conductive network that facilitates redox reactions.
Notably, any comparative analysis of these studies requires caution, as the studies differ in HRPSoC cycle testing algorithms, cell construction, and active material paste formulations (e.g., raw material types and proportions). For better visualization and analysis of this heterogeneity, these results were summarized in Table 1.
Comparative summary of rGO as an additive to the NAM.
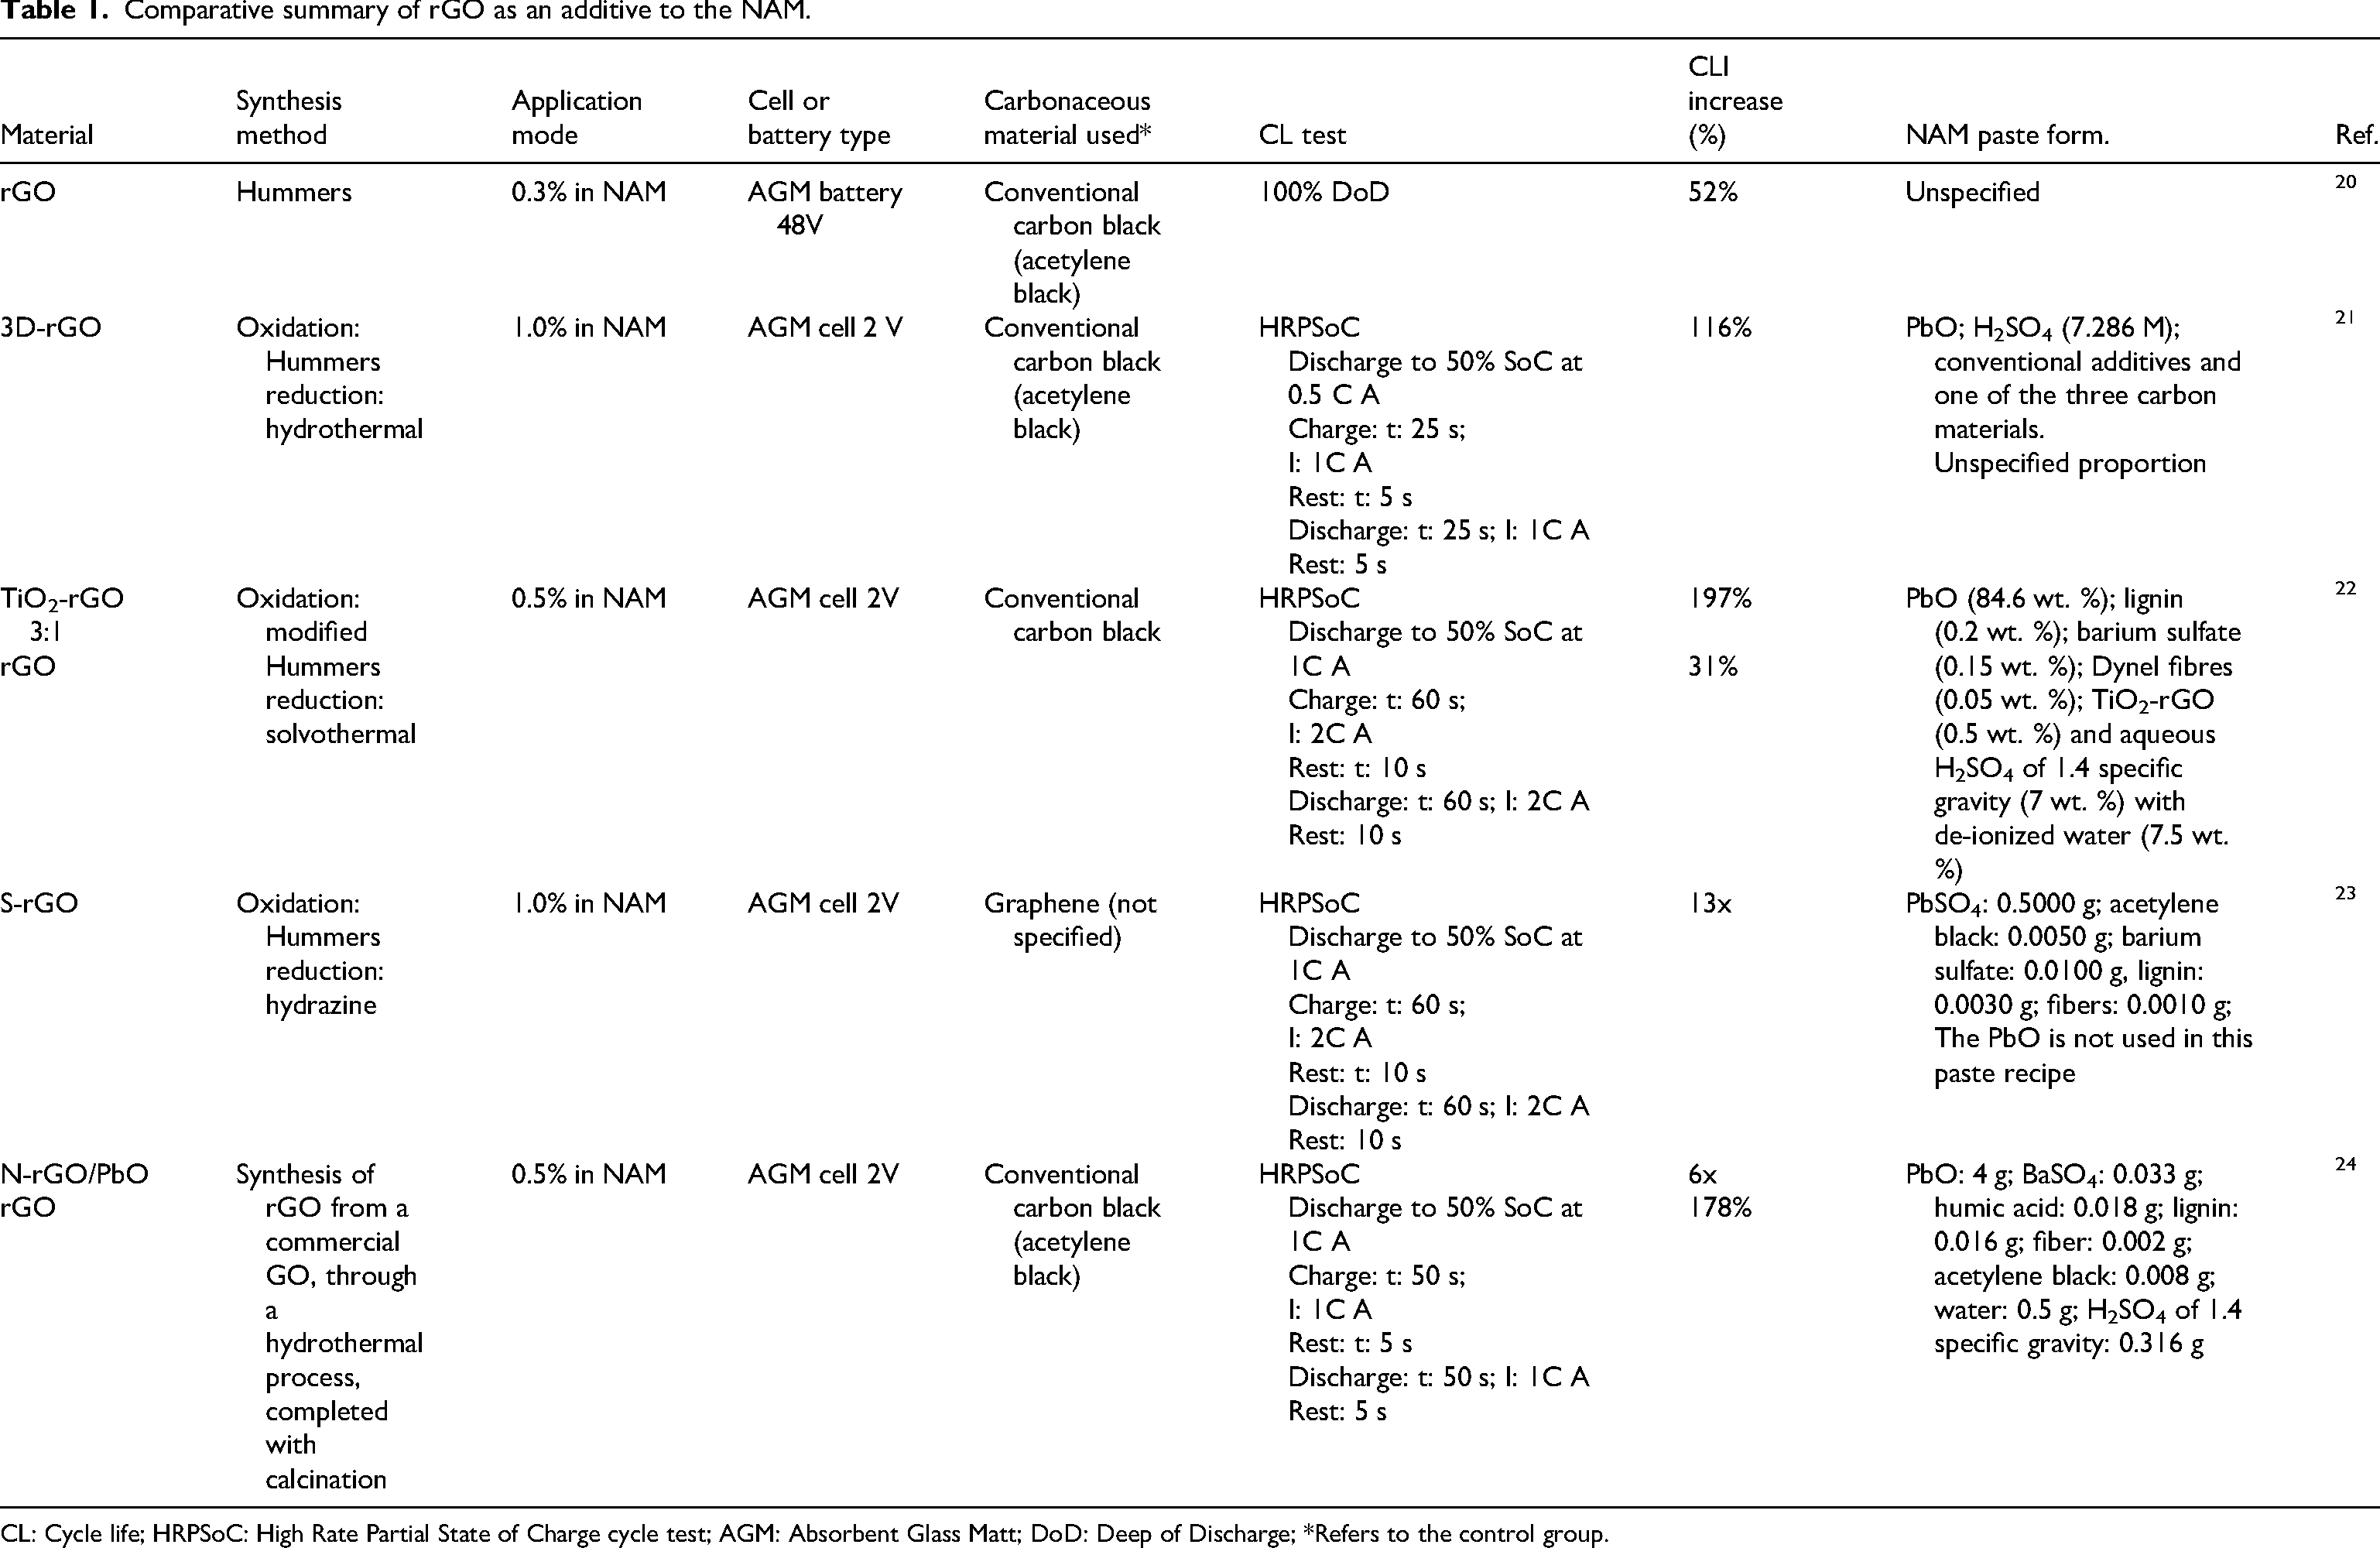
CL: Cycle life; HRPSoC: High Rate Partial State of Charge cycle test; AGM: Absorbent Glass Matt; DoD: Deep of Discharge; *Refers to the control group.
With these studies in mind, this study focused on investigating the use of rGO, obtained via an improved Hummers method, 25 as an additive to NAM at different concentrations, as there are no known studies on the use of this specific type of rGO applied to lead-acid batteries. The rGO utilized was synthesized through an optimized, fully scalable, one-pot protocol that offers significant advantages over conventional production routes. Specifically, this method employs sonication-assisted oxidation followed by reduction with ascorbic acid, achieving simultaneous oxidation and exfoliation. Furthermore, by facilitating hydrophilicity loss during the reduction stage, this method eliminates lengthy pre-reduction washing steps, resulting in rGO that is both highly reproducible and suitable for industrial-scale battery applications.
Negative plate performance during the formation process, including C20 capacity measurements and HRPSoC cycle life applied to flooded lead-acid cells, was studied and compared to plates with two other types of carbon commonly used in lead-acid battery production (graphite and advanced carbon black). An HRPSoC cycling test protocol specifically applicable to flooded batteries was adopted, contrasting with studies in the literature that applied this protocol to absorbent glass mat (AGM) cells. AGM technology exhibits superior performance in cycling applications due to its internal oxygen recombination mechanism, which explains its preferential use in various studies. However, in tropical countries, flooded batteries are still widely used as AGM cells are more sensitive to high temperatures, compromising their stability and durability under such conditions. In addition to the performance tests, the capacitive properties of these carbonaceous materials were investigated using methods outlined elsewhere,26–28 providing insights into both the practical and electrochemical aspects of rGO application in flooded lead-acid batteries.
In this context, the novelty of the present work lies in the investigation of an industrially scalable rGO, synthesized through an optimized one-pot protocol, as an additive for NAM operating in flooded lead-acid cells under HRPSoC conditions. To the best of our knowledge, no previous studies have reported the application of this specific type of rGO in lead-acid batteries. The innovative character of this approach is associated not only with the scalable synthesis route employed for rGO production, but also with its application in flooded battery technology, which remains widely used in tropical countries. Furthermore, the study provides a comparative analysis performed under conditions closer to the industrial reality, since the proposed rGO additive was evaluated against carbonaceous additives already commercially employed in lead-acid battery manufacturing.
Experimental details
Reduced graphene oxide synthesis
The rGO was synthesized using the improved Hummers method as developed by Abdolhosseinzadeh et al. 25 The process involves three main steps: oxidation (graphite powder is oxidized to graphite oxide), oxidation/exfoliation (graphite oxide is exfoliated to yield GO), and reduction (GO is reduced to rGO). The reagents used for synthesis included 99% graphite powder (Sigma-Aldrich, USA), concentrated sulfuric acid (98%), potassium permanganate PA, sodium hydroxide in pellets, ascorbic acid PA, and hydrochloric acid (36%). The water used in this process was demineralized, with conductivity of 5–8 µS cm−1. The initial stage is carried out at a controlled temperature of a maximum of 10 °C, by maintaining the system in an ice bath. A total of 3.0 g of graphite powder was added to a beaker containing concentrated sulfuric acid (150 mL) under stirring. Subsequently, 9.0 g of potassium permanganate was slowly incorporated. After the addition of potassium permanganate, a sequence of 25-min stirring was initiated, followed by 5 min of sonication. This stirring/sonication sequence was repeated 12 times. Prior to the reduction stage, demineralized water (600 mL) was added, followed by the gradual addition of NaOH pellets until the pH was between 6 and 7. After neutralization, the mixture was subjected to sonication for 2 h. In the final stage of the synthesis, chemical reduction was carried out by adding an ascorbic acid solution (60 g/600 mL), and the reaction was sustained with stirring for 1 h at 95 °C. The resulting rGO underwent vacuum filtration process, washing with 1 mol/L HCl solution and demineralized water until the pH stabilized between 5 and 6. The drying process occurred at 60 °C for 48 h. Starting from 3.0 g of graphite, 2.81 g of rGO were obtained, corresponding to a gravimetric yield of 93.7%. Since the reduction of graphene oxide by L-ascorbic acid is not complete and the exact chemical composition of the obtained rGO cannot be accurately determined, the synthesis yield was calculated based on the recovered mass of the final material.
Reduced graphene oxide microstructural characterization
To confirm the phase composition, X-ray diffraction (XRD) was performed using a Bruker D8 Advance ECO device equipped with a copper target (CuKα, λ = 0.1514 nm) at 40 kV and 25 mA. Measurements were taken over an angle range of 2θ = 5–60 °C and scan speed of 2°/minute. Fourier transform infrared spectroscopy (FTIR) was used to analyze the oxygen functional groups in the sample, utilizing a Bruker Vertex 70 setup. Samples were analyzed in transmittance mode using KBr tablets with a wavelength range of 3500–500 cm−1 and a resolution of 4 cm−1.
Raman spectroscopy was conducted to evaluate structural defects in the synthesized rGO structure using a Micro RAMAN spectrometer (LabRAM HR, Horiba, USA) with a Nd:YAG laser (λ = 632.8 nm, 19 mW power). Additional information on electronic levels and their relationship with the efficiency of the reduction process efficiency was obtained through photoluminescence spectroscopy using a spectrofluorometer (Fluorolog-3 FL3-122, Horiba, USA). The rGO sample was prepared by dispersing 0.02 mg cm−3 in demineralized water and sonicated for 5 min. The spectrum was obtained using an excitation source (laser) at 325 nm and an emission wavelength of 370–850 nm.
Morphological structure analysis was performed through scanning electron microscopy (SEM) with FEI equipment featuring a FEG filament (Magellan 400 L, FEI, USA) at an accelerating voltage of 25.0 kV. Surface areas were measured by obtaining adsorption isotherms using nitrogen gas at −195.5 °C (77 K) with an automatic physisorption equipment (ASAP 2020 Plus, Micromeritics, USA) within a relative pressure range (P/P0) of 0–0.995. Prior to measurements, all samples were pretreated at 70 °C for 12 h to eliminate volatile compounds and then subjected to a vacuum of 10 µm Torr. The specific surface area (S_BET) was determined by the Brunauer-Emmett-Teller (BET) method using adsorption data within the P/P0 range of 0.05–0.30. The mean pore diameter (dP) was calculated using the Barrett-Joyner-Halenda method (dP = 4VP/SBET, where VP is the total pore volume). Total pore volume was determined by converting the amount of adsorbed N2 gas at a P/P0 of 0.995 to the volume of the liquid adsorbate.
Electrochemical tests
The performance of rGO was evaluated at three mass loadings: 0.2%, 0.75%, and 1.4%. These experimental conditions were systematically compared with a control plate formulated with carbon black PBX-135, which has a BET area of 120–180 m2 g−1 (Cabot Corporation, USA). PBX-135 was incorporated at 0.75%, as recommended by the manufacturer. This selection is justified by the material's designation as an advanced carbon specifically formulated for enhanced performance in advanced lead-acid batteries (Enhanced Flooded Battery and AGM), providing a high-performance benchmark for assessing the rGO variants. The influence of these materials on the performance of negative plates (5.7 × 6.1 cm) was investigated using a 2 V PNP electrochemical cell (one negative plate in the center and two oversized positive plates at the ends). The composition of the negative pastes consisted of lead oxide (75% PbO and 25% Pb), water, lignin (Vanisperse A, Borregaard LignoTech, Norway), barium sulfate (Solvay, Belgium), and one of the three carbonaceous additives. Prior to incorporation into the paste formulation, the carbon materials were subjected to a preliminary ultrasonic dispersion step in a suspension containing the corresponding amount of lignin and water. This procedure ensured adequate wetting and homogenization of the carbonaceous additives, as lignin acts as an effective dispersing agent. The amount of water added was sufficient to achieve the consistency required for adequately applying the mass to the grid. Each plate contained 15.5 g of negative paste. The plates were cured in an industrial oven with automatic temperature and humidity control under the following conditions: 2 h at 85 °C with 95% relative humidity, 30 h at 60 °C with 70% relative humidity, followed by 10 h at 75 °C with 0% relative humidity. After the curing process, the electrochemical cells were assembled, and the formation process was continued. The electrolyte volume was 315 mL. A soaking period of 2 h was performed at an H2SO4 concentration of 1.0 mol L−1. After soaking, the electrolyte was replaced with a 4.6 mol L−1 H2SO4 solution, and the formation process began according to the formation profile Ic = 1.58 mA cm−2 for 36 h, followed by Ic = 3.16 mA cm−2 for 10 h.
The HRPSoC cycle life test began by bringing the negative plate to 50% state of charge through a discharge current of 1600 mA for 30 min. Immediately after this period, a micro-charge of 1600 mA was applied for 2 min, followed by a rest of 10 s, a micro-discharge of 1600 mA for 2 min, and another rest of 10 s. This sequence of micro-charges and discharges was repeated until the cell voltage reached 1.83 V. This test protocol was adapted based on Pavlov et al. 29 Figure 1 presents a diagram of this HRPSoC cycle.
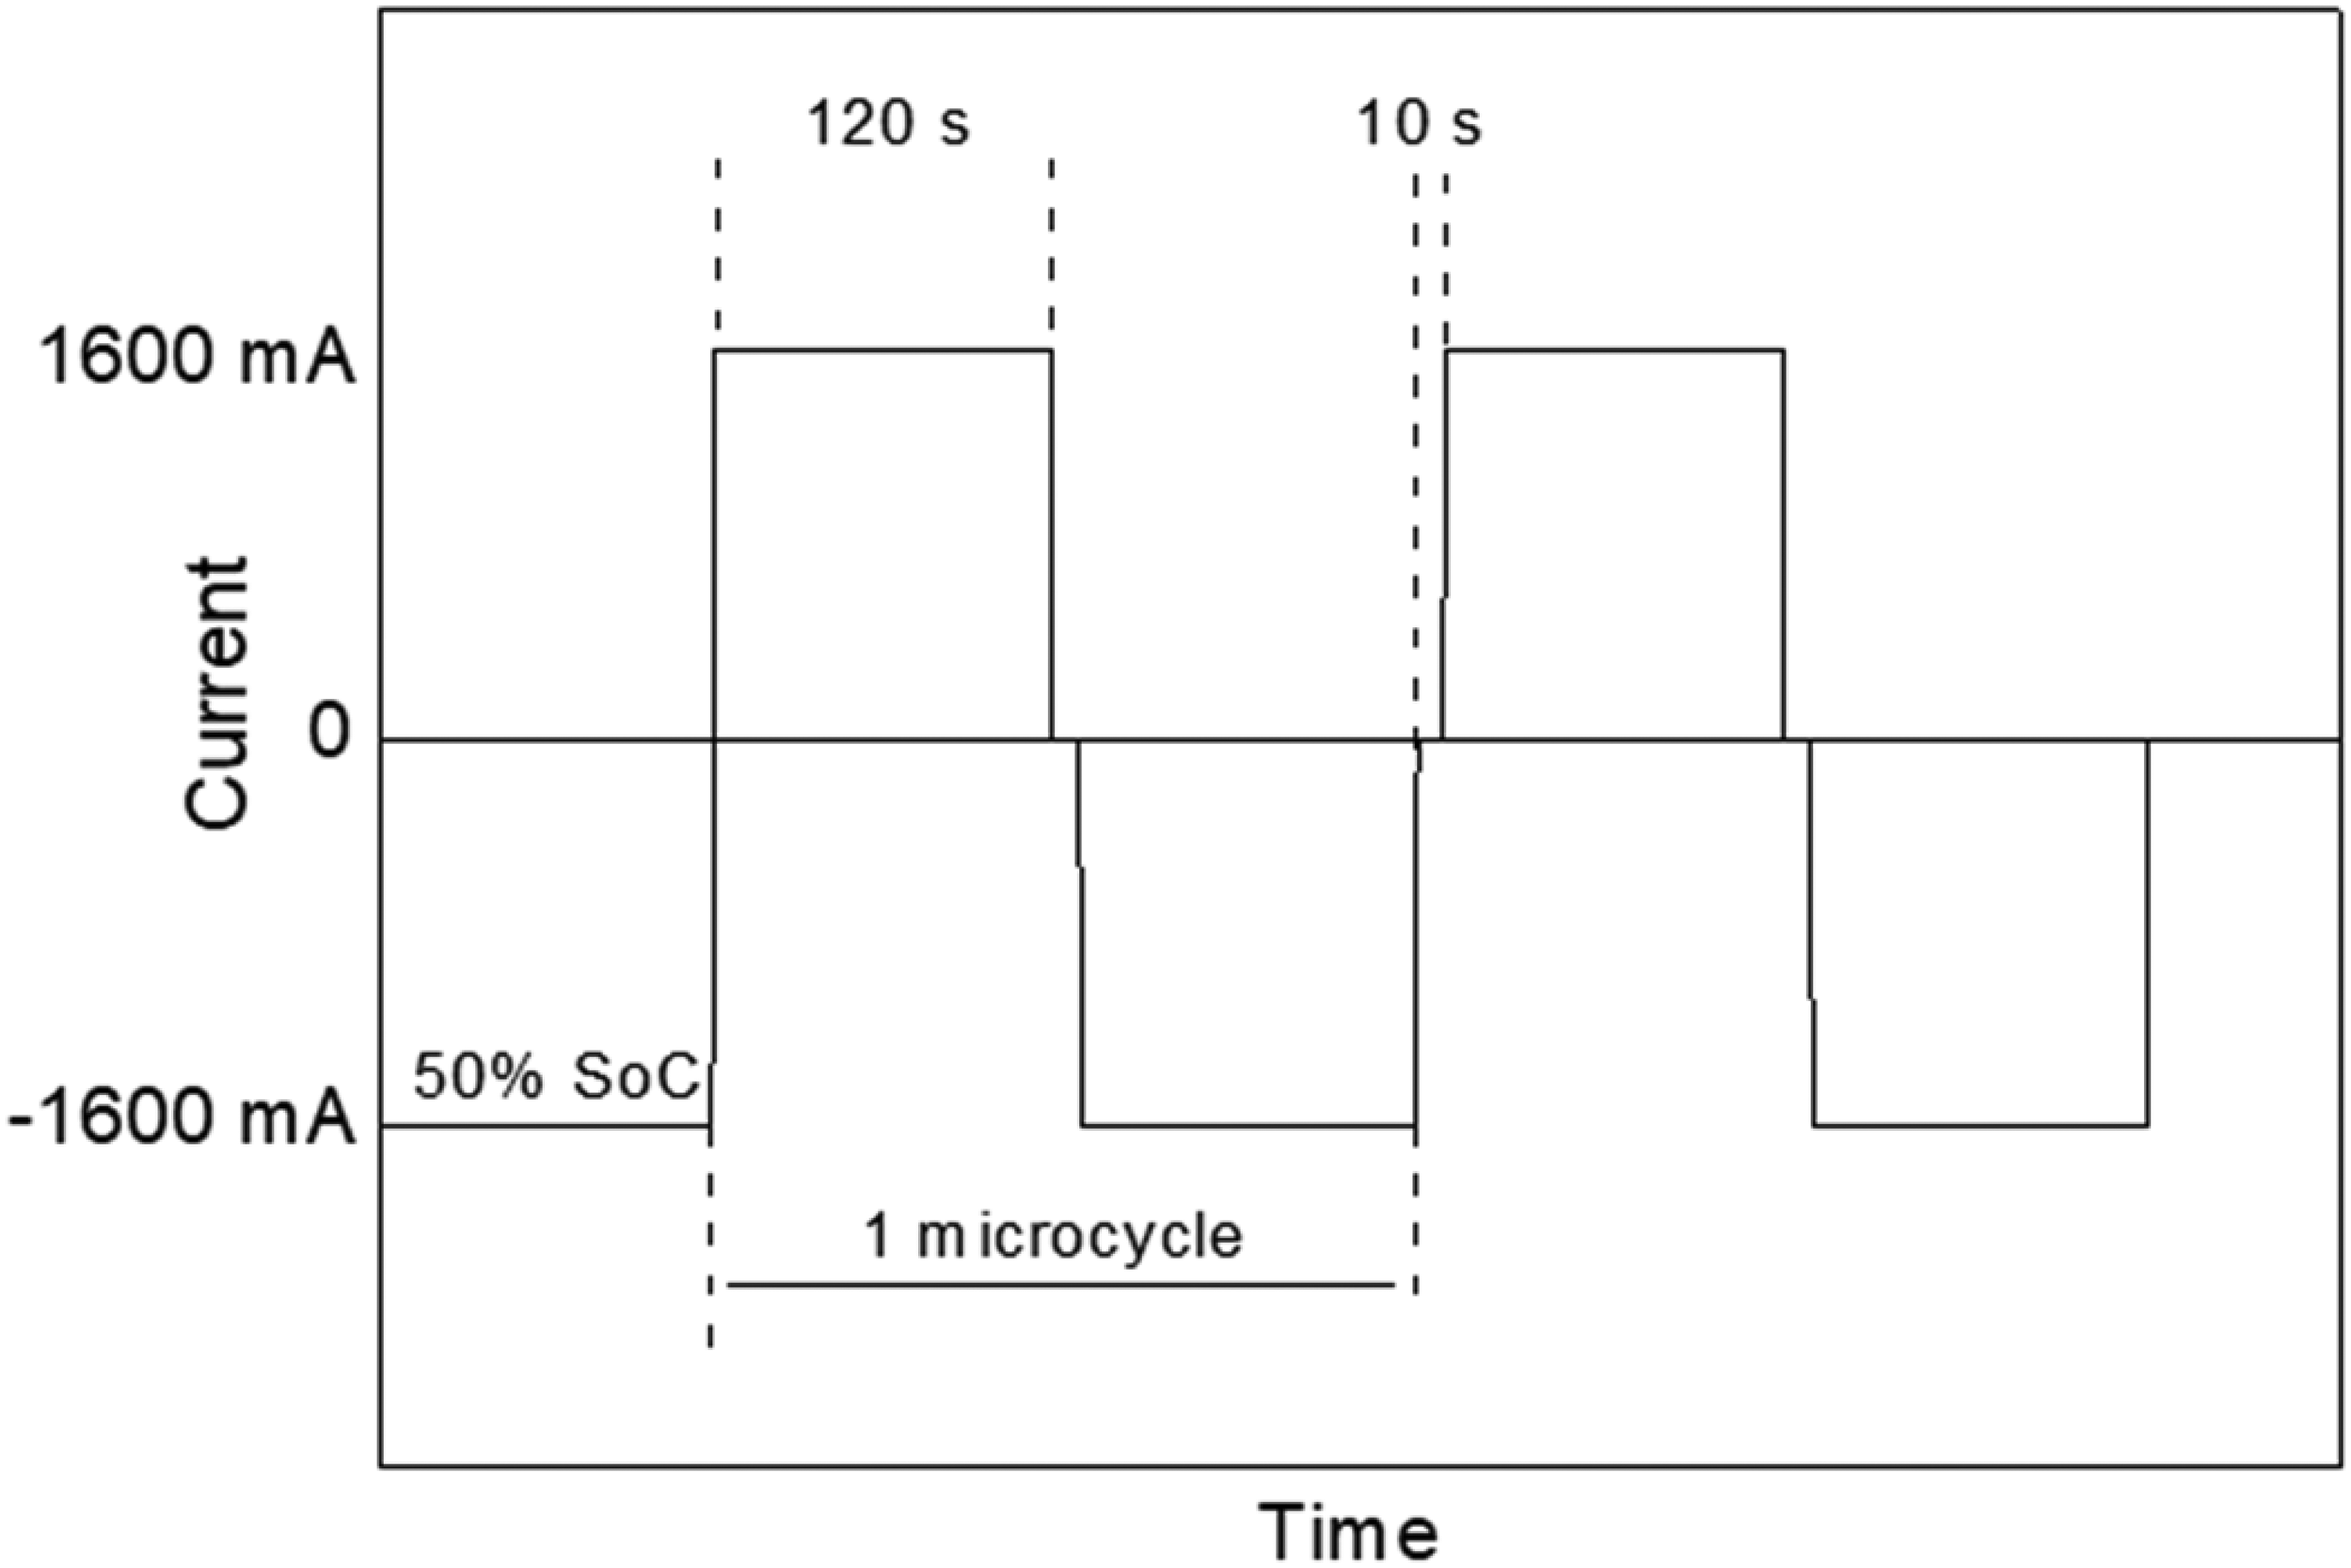
Profile of a micro-cycle of the HRPSoC cycling test.
The specific capacitance of carbonaceous materials was calculated using cyclic voltammetry, electrochemical impedance spectroscopy, and electrochemical capacitance spectroscopy, as outlined in the literature.26–28 In addition to rGO and PBX-135, the electrochemical properties of the graphite used as the precursor in rGO synthesis were also studied using a potentiostat (AUT8684, Metrohm, Switzerland). The working electrode was made of glassy carbon with a geometric area of 0.3 cm2, onto which 12 µL of a suspension containing 0.5% (w/w) of the carbonaceous materials under study was applied. This suspension comprised isopropyl alcohol (19.3%), Nafion (1.0%), and demineralized water (79.2%). The container containing the suspension was subjected to ultrasound for 30 min to ensure adequate dispersion of the materials. The counter electrode used was platinum, and the reference electrode was Hg/Hg2SO4, H2SO4 4.6 mol L−1. The specific capacitance (CS) was calculated using Equation (1):
The results from this method show that the charge associated with the electric double layer is obtained by extrapolating the voltammetric charge to zero from the graph of q−1 vs. v1/2, while the total charge is obtained by extrapolating the voltammetric charge to infinity from the graph of q vs. v−1/2. The pseudocapacitive charge is represented by the difference between total charge and charge associated with the electric double layer. The respective specific capacitances (CP, CDL, and CT) are obtained by dividing the corresponding charge values by the ΔV used in cyclic voltammetry. The electrochemical impedance spectroscopy measurements used sinusoidal disturbance signal parameters of 10 mV amplitude, applied over the frequency range of 0.1–100 mHz with 50 steps/dec, at an open-circuit potential of 160 mV. The impedance (Z) values were converted into capacitance (C) through C′′ = φZ′ and C′ = φZ′′. The redox capacitance was represented through the Nyquist capacitive diagram.
Results and discussion
Reduced graphene oxide microstructural properties
The synthesized rGO was characterized for its macrostructural properties using XRD, FTIR, Raman, and photoluminescence measurements (Figure 2), which confirmed that the exfoliation and reduction processes were effective in obtaining rGO. The XRD analysis showed that the graphite used in the synthesis exhibited a crystalline peak at 2θ = 26.3°, corresponding to the basal plane 002 of its hexagonal structure. For rGO, the graphite crystalline disappeared and a halo formed at 2θ = 24.7°, with low intensity and a wide base. The disappearance of the characteristic graphite peak, as well as the absence of other well-defined peaks, indicated that the reduction of GO to rGO was efficient. Additionally, the shift in the 2θ value in the rGO diffractogram relative to graphite suggests increased interplanar distance. The calculated interplanar distances for graphite and rGO were 3.3 Å and 3.6 Å, respectively. This increase is attributed to the presence of residual functional groups resulting from the oxidation of graphite to GO. FTIR was used to characterize these functional groups.
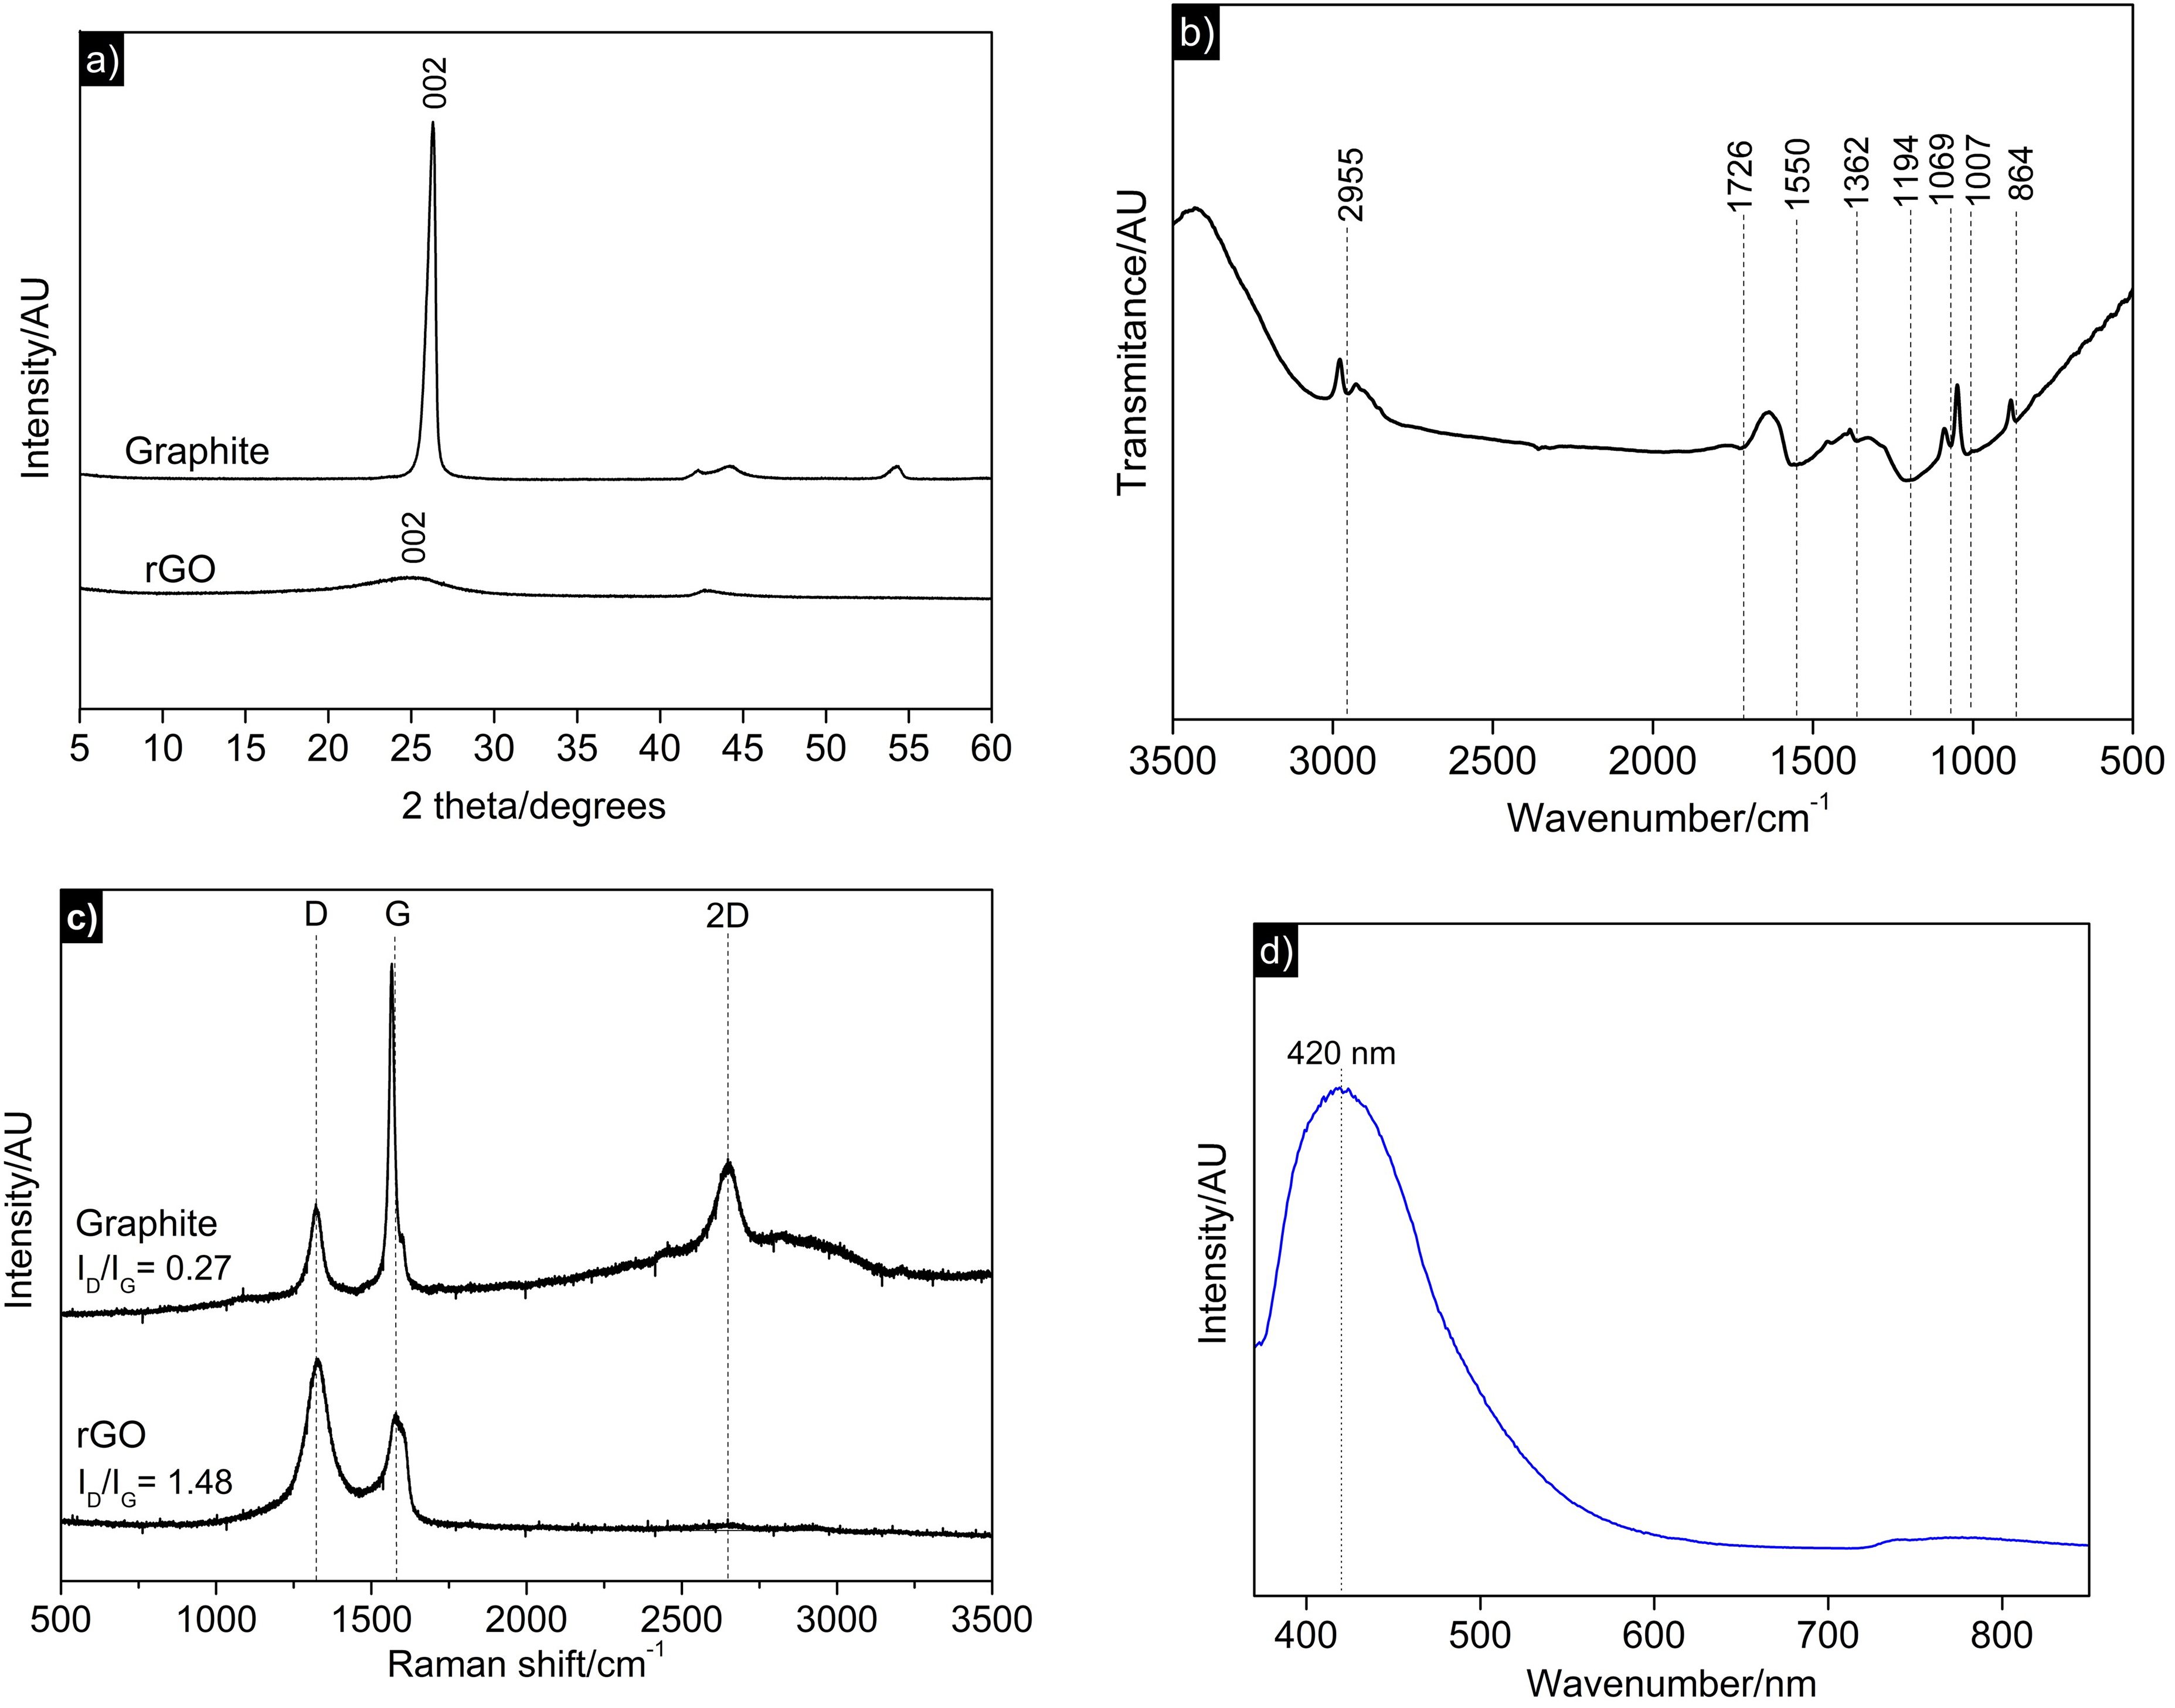
Microstructural characterizations: (a) X-ray diffraction diffractograms of reduced graphene oxide (rGO) and graphite, (b) Fourier-transform infrared (FTIR) spectrum of rGO and graphite; (c) Raman spectrum of rGO andgraphite; (d) photoluminescence spectrum of rGO.
The rGO spectrum showed low-intensity peaks; notable peaks include the sp2 structure of C = C in aromatics at 1550 cm−1, the C-O stretching likely from ester groups at 1194 cm−1, and hydroxyls (O-H) from carboxylic acids at 1007 cm−1. The low intensity of the peaks supports the XRD discussion that the GO to rGO reduction process was effective. Some studies have investigated the effects of these functional groups on the capacitive properties of carbonaceous materials and suggested the existence of significant effects.30–32 Evidence suggests that the introduction of pseudocapacitance from these oxygenated functional groups occurs through a mechanism of reversible Faradaic redox reactions and, in the case of acidic media, alkaline functional groups, especially carbonyls and quinones, react with protons (H+).33,34
The Raman spectra showed D (1322 cm−1), G (1579 cm−1), and 2D (2648 cm−1) bands. The D band, related to the A1g vibrational mode, is associated with disorder and defects in the material structure; a strong signal indicates a high degree of defects and disorder. The G band, related to the E2g vibrational mode, is associated with the quality of the graphitic network; more intense signals suggest a higher degree of order. Based on the Raman spectra, the ID/IG intensity ratio, widely used to evaluate structural defects,35–37 was significantly higher in rGO (1.48) than in graphite (0.27), indicating an increased degree of structural disorder. This suggests successful exfoliation of the highly ordered graphitic structure (indicated by the high intensity in the graphite G band), resulting in a material with greater structural disorder due to exfoliated graphene layers. 35 A prominent intensity peak was observed in the graphite 2D band, significantly higher than in the rGO spectrum. This also indicates effective exfoliation, as the highest intensity peak in graphite is linked to increased resistance for electron movement due to distortions from van der Waals interactions between graphite layers.36,38
The band gap in rGO permits light absorption and emission (photoluminescence), a property that can be used to characterize the degree of reduction. In its oxidized form (GO), the photoluminescence spectrum presents emission in the yellow-red region of the UV-vis spectrum, with a broad-based peak centered at approximately 600 nm. After reduction, the rGO spectrum exhibits fluorescence in the blue region of the UV-vis spectrum, with a narrow-width peak centered at approximately 420 nm. This shift in the photoluminescence spectrum occurs in rGO due to the restoration of sp2 domains, resulting from the removal of oxygenated groups during reduction.39,40
Morphological analyses were conducted using SEM (Figure 3), revealing that the synthesized material exhibited a morphology similar to other studies, 25 with a nanometric thickness of rGO layers and a crumpled, flexible aspect. Quantitative analyses of the micrographs revealed that the rGO sheets possessed a nanometric thickness of 25–35 nm. This thickness is significantly higher than the theoretical few-layer rGO, possibly indicating the high degree of restacking or aggregation of the individual rGO sheets. Despite restacking being evident, the crumpled morphology may have prevented complete stacking, ensuring the formation of sufficient inter-sheet voids and channels. These channels are essential for maintaining the solvated electrolyte ions’ accessibility during cell operation.
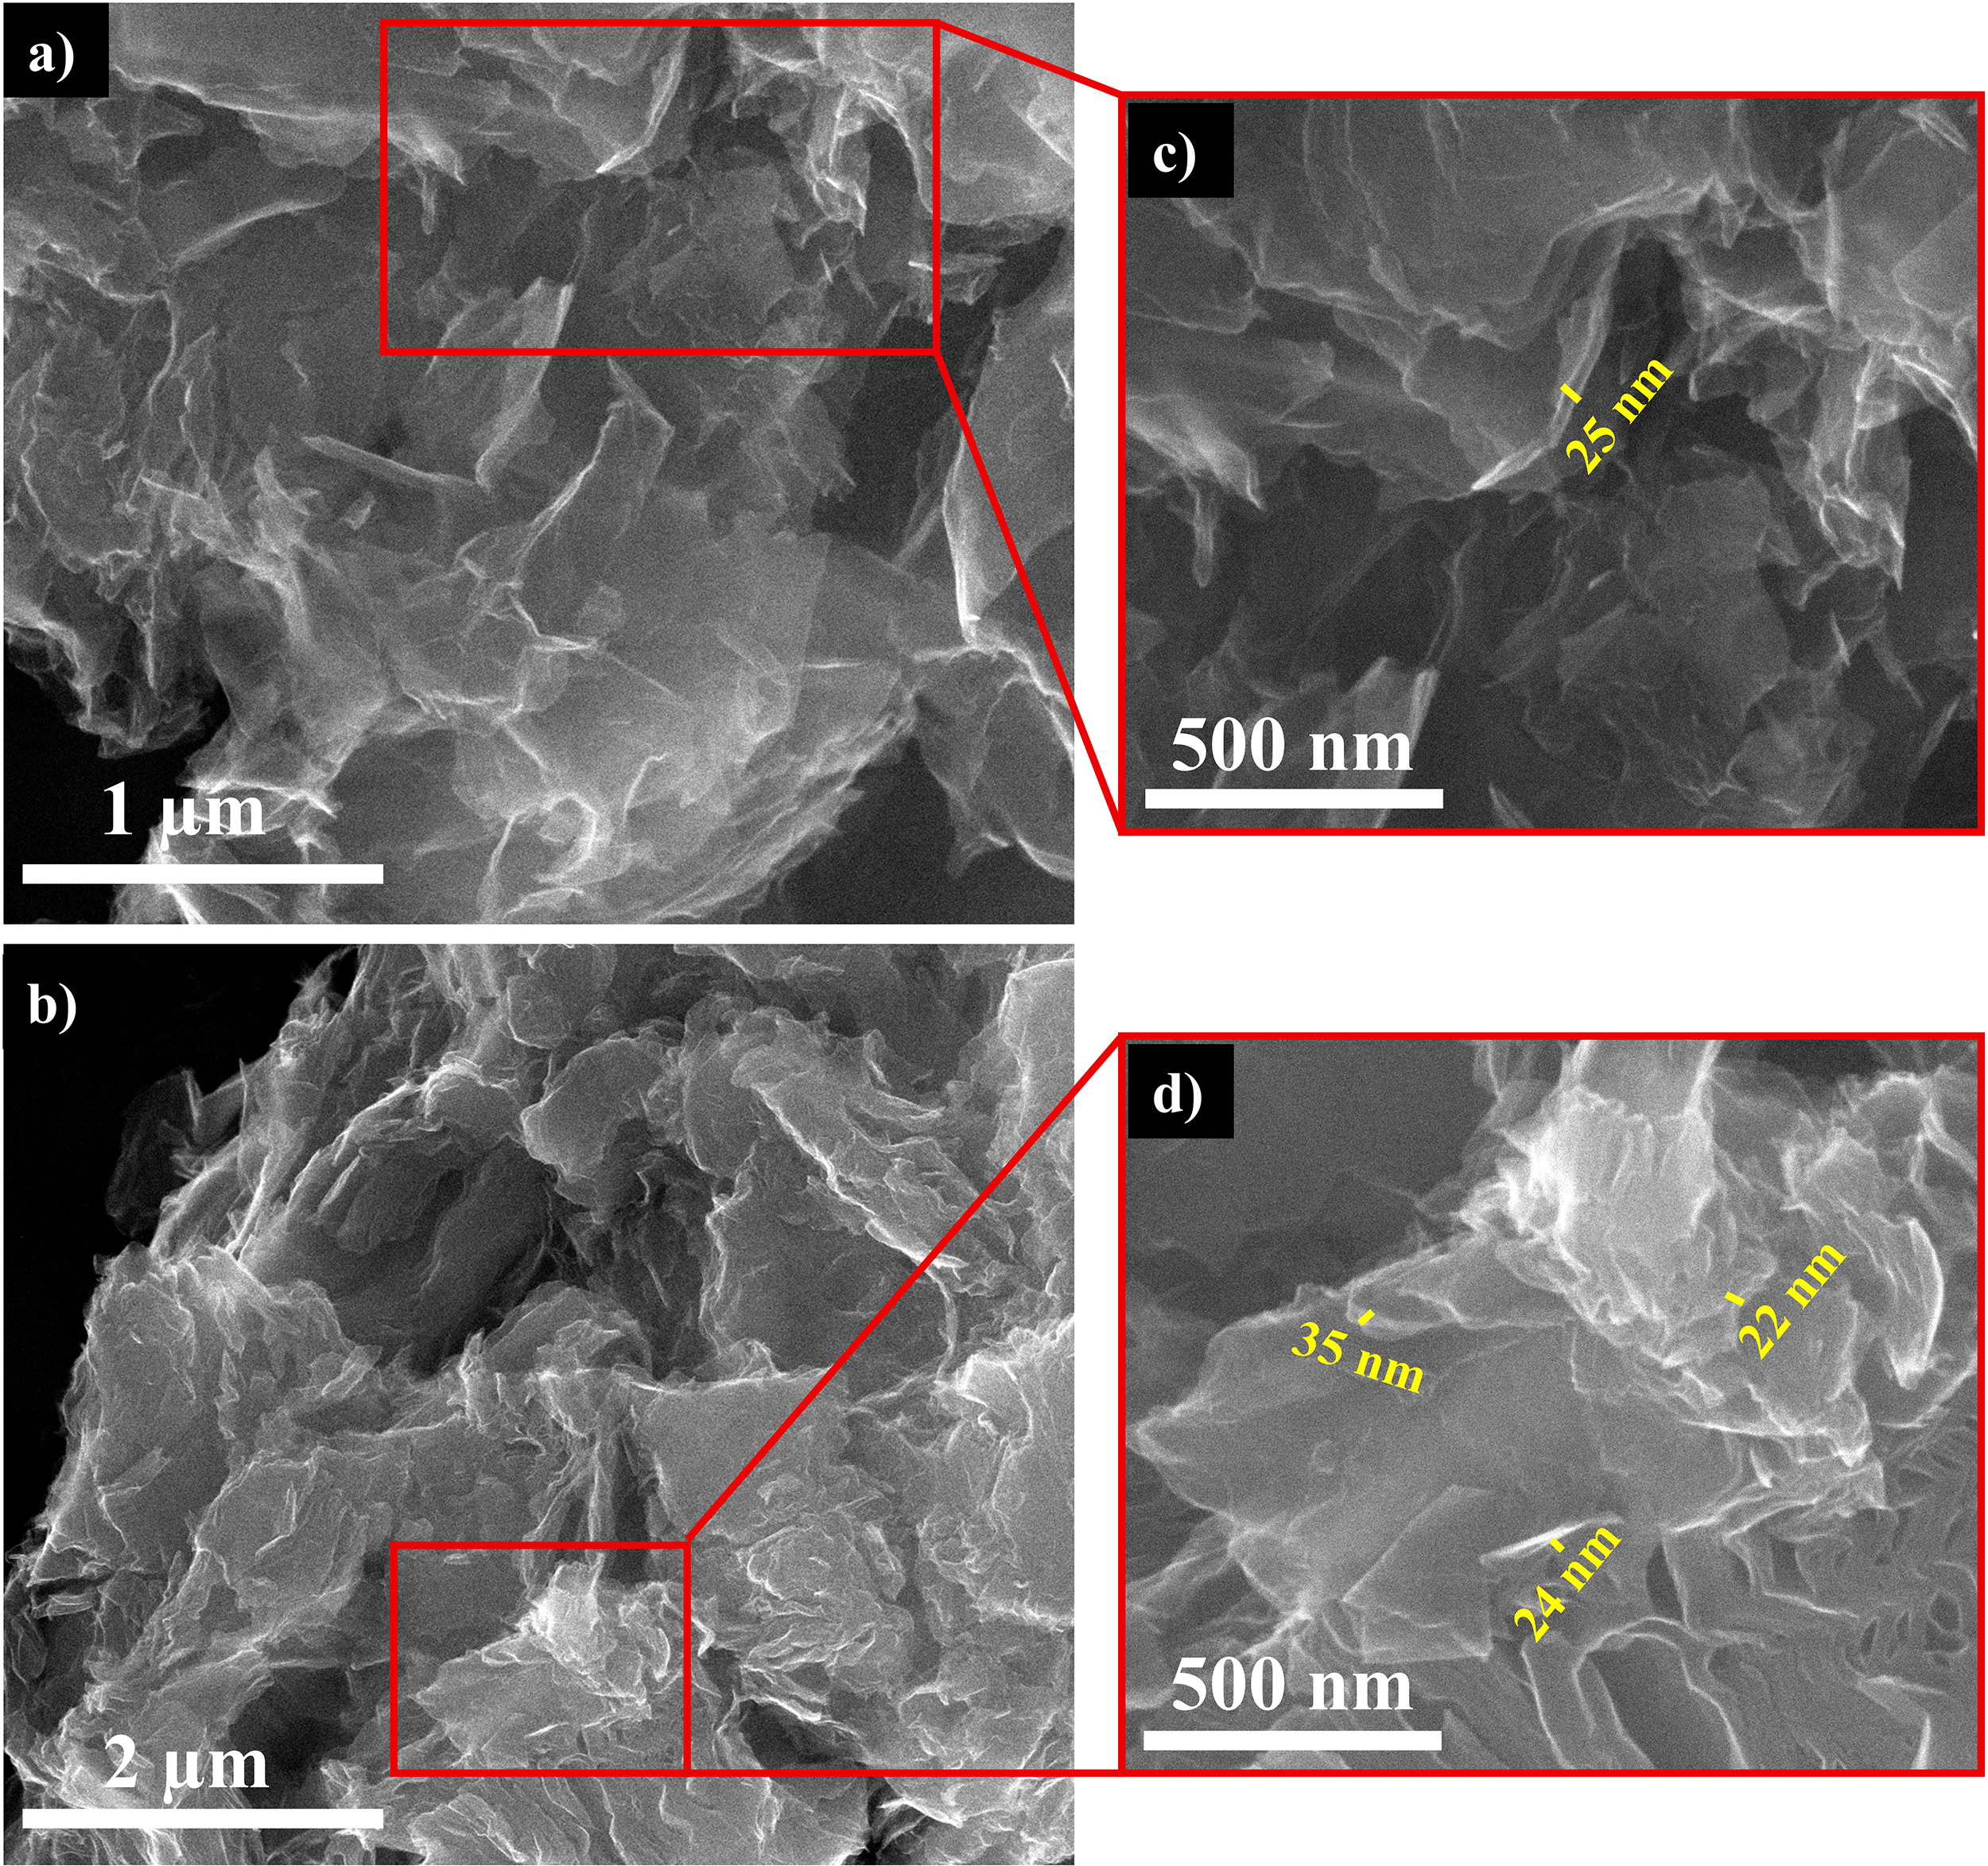
Scanning electron microscopy images of an rGO structure: (a) 100,000 x; (b) 50,000 x; (c) and (d) 200,000 x.
Regarding the BET surface area, the isotherms in Figure 4 indicate that, since there was no capillary condensation (stabilization of the adsorbed volume at high P/P0 values), the resulting isotherm can be described as a mixture of type II and V. This is typical of a type II macroporous material but includes slit-shaped mesopores, which are associated with type V isotherms, characteristic of porous solids with low surface activity. The average pore diameter of the material is within the 2–50 nm range, indicating the presence of mesopores, a structure limited between microporous and microporous.
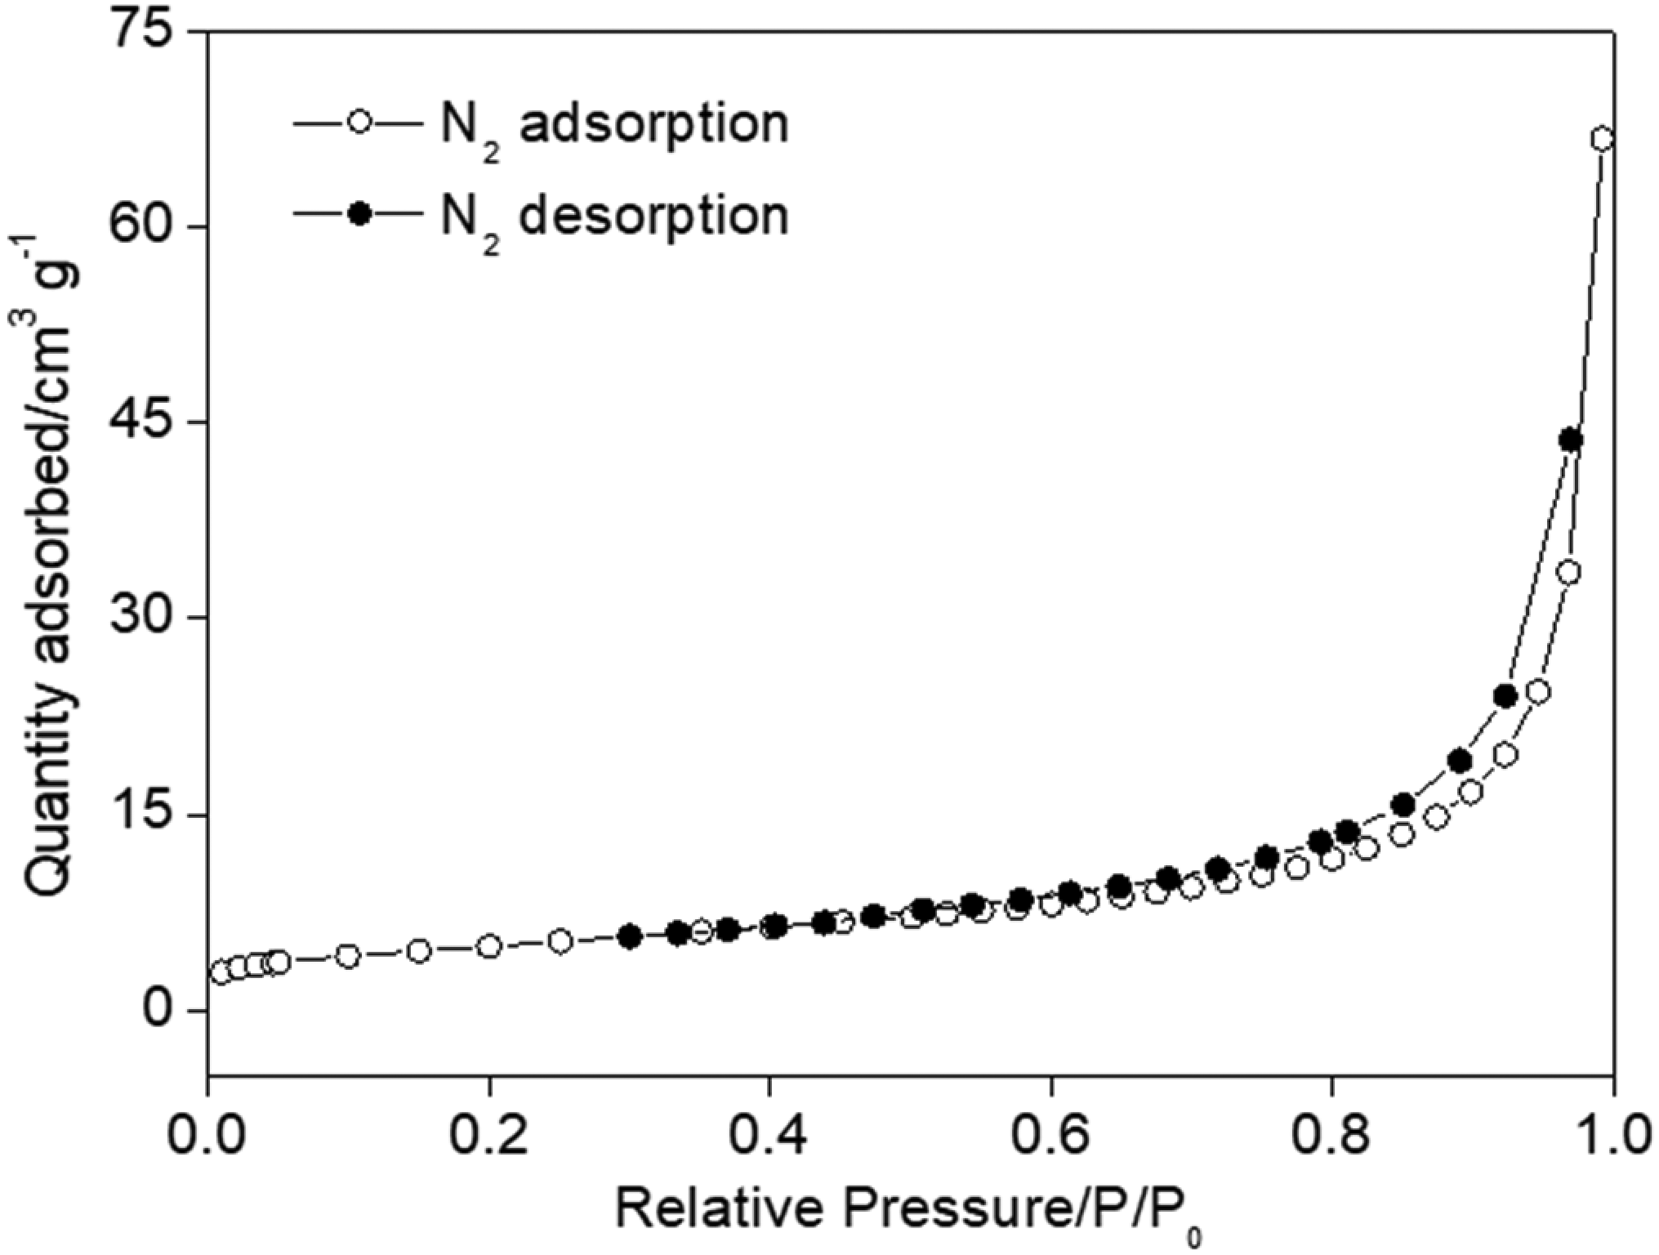
Brunauer-Emmett-Teller analysis of nitrogen adsorption-desorption isotherm of rGO.
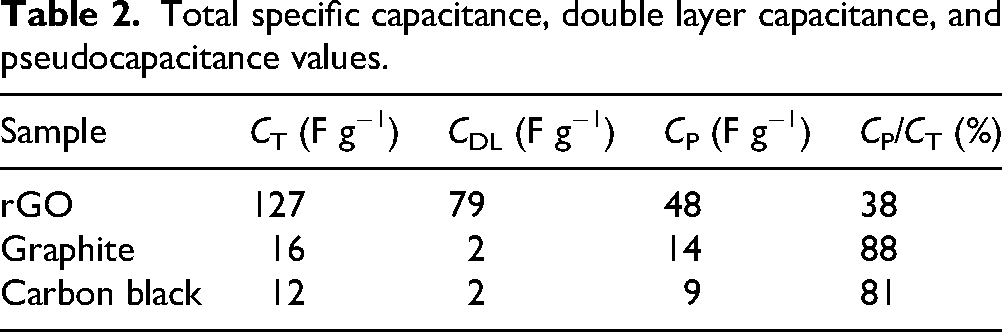
Although both the presence of mesopores and the high degree of structural disorder observed by Raman spectroscopy (ID/IG = 1.48) would typically be associated with higher BET surface areas, the measured BET value was 17.25 m2 g−1. This relatively low value may be attributed to partial restacking and agglomeration of graphene sheets during the reduction and drying processes, as suggested by the SEM images, which can reduce the accessibility of internal surfaces to N₂ during BET measurements. Despite this relatively low BET area value for carbonaceous materials with capacitive properties, 10 yet it did not hinder the electrochemical performance of the rGO, which exhibited a capacitance of 127 F g−1 (Table 2). This can be attributed to a possible synergy between the material's capacitive nature and its electrochemical surface area, which is likely related to its highly defective structure. A detailed analysis showed that 38% (48 F g−1) is derived from the CP (Table 2), a Faradaic charge storage mechanism associated with the functional groups remaining in the rGO structure, which does not directly depend on a high BET area. The remaining capacitance, representing 79 F g−1, suggests that the electrochemical surface area is, in practice, significantly larger than the measured BET area. This implies that, under experimental conditions of ambient temperature and applied potential, the solvated electrolyte ions can effectively penetrate the stacking regions of the rGO layers that are inaccessible to N2 gas in the BET measurement.
Total specific capacitance, double layer capacitance, and pseudocapacitance values.
Effect of reduced graphene oxide addition in negative plate formation and capacity
Figure 5 shows the influence of rGO on the NAM formation process. During the first formation stage, occurred at −0.90 V, no significant differences were observed between the various plate versions. This stage corresponds to the formation of a primary Pb structure (structural), followed by a secondary Pb structure (energetic), derived from the reduction of PbSO4. Figure 5(b) highlights the transition from the first to the second potential stage, which initiates between −1.310 V and −1.450 V and is associated with the hydrogen evolution reaction. In this stage, the rGO/1.4 version remained closer to the region of the first stage for longer, indicating improved efficiency of the formation reactions. In versions with lower rGO concentrations and the control, no significant differences were observed.
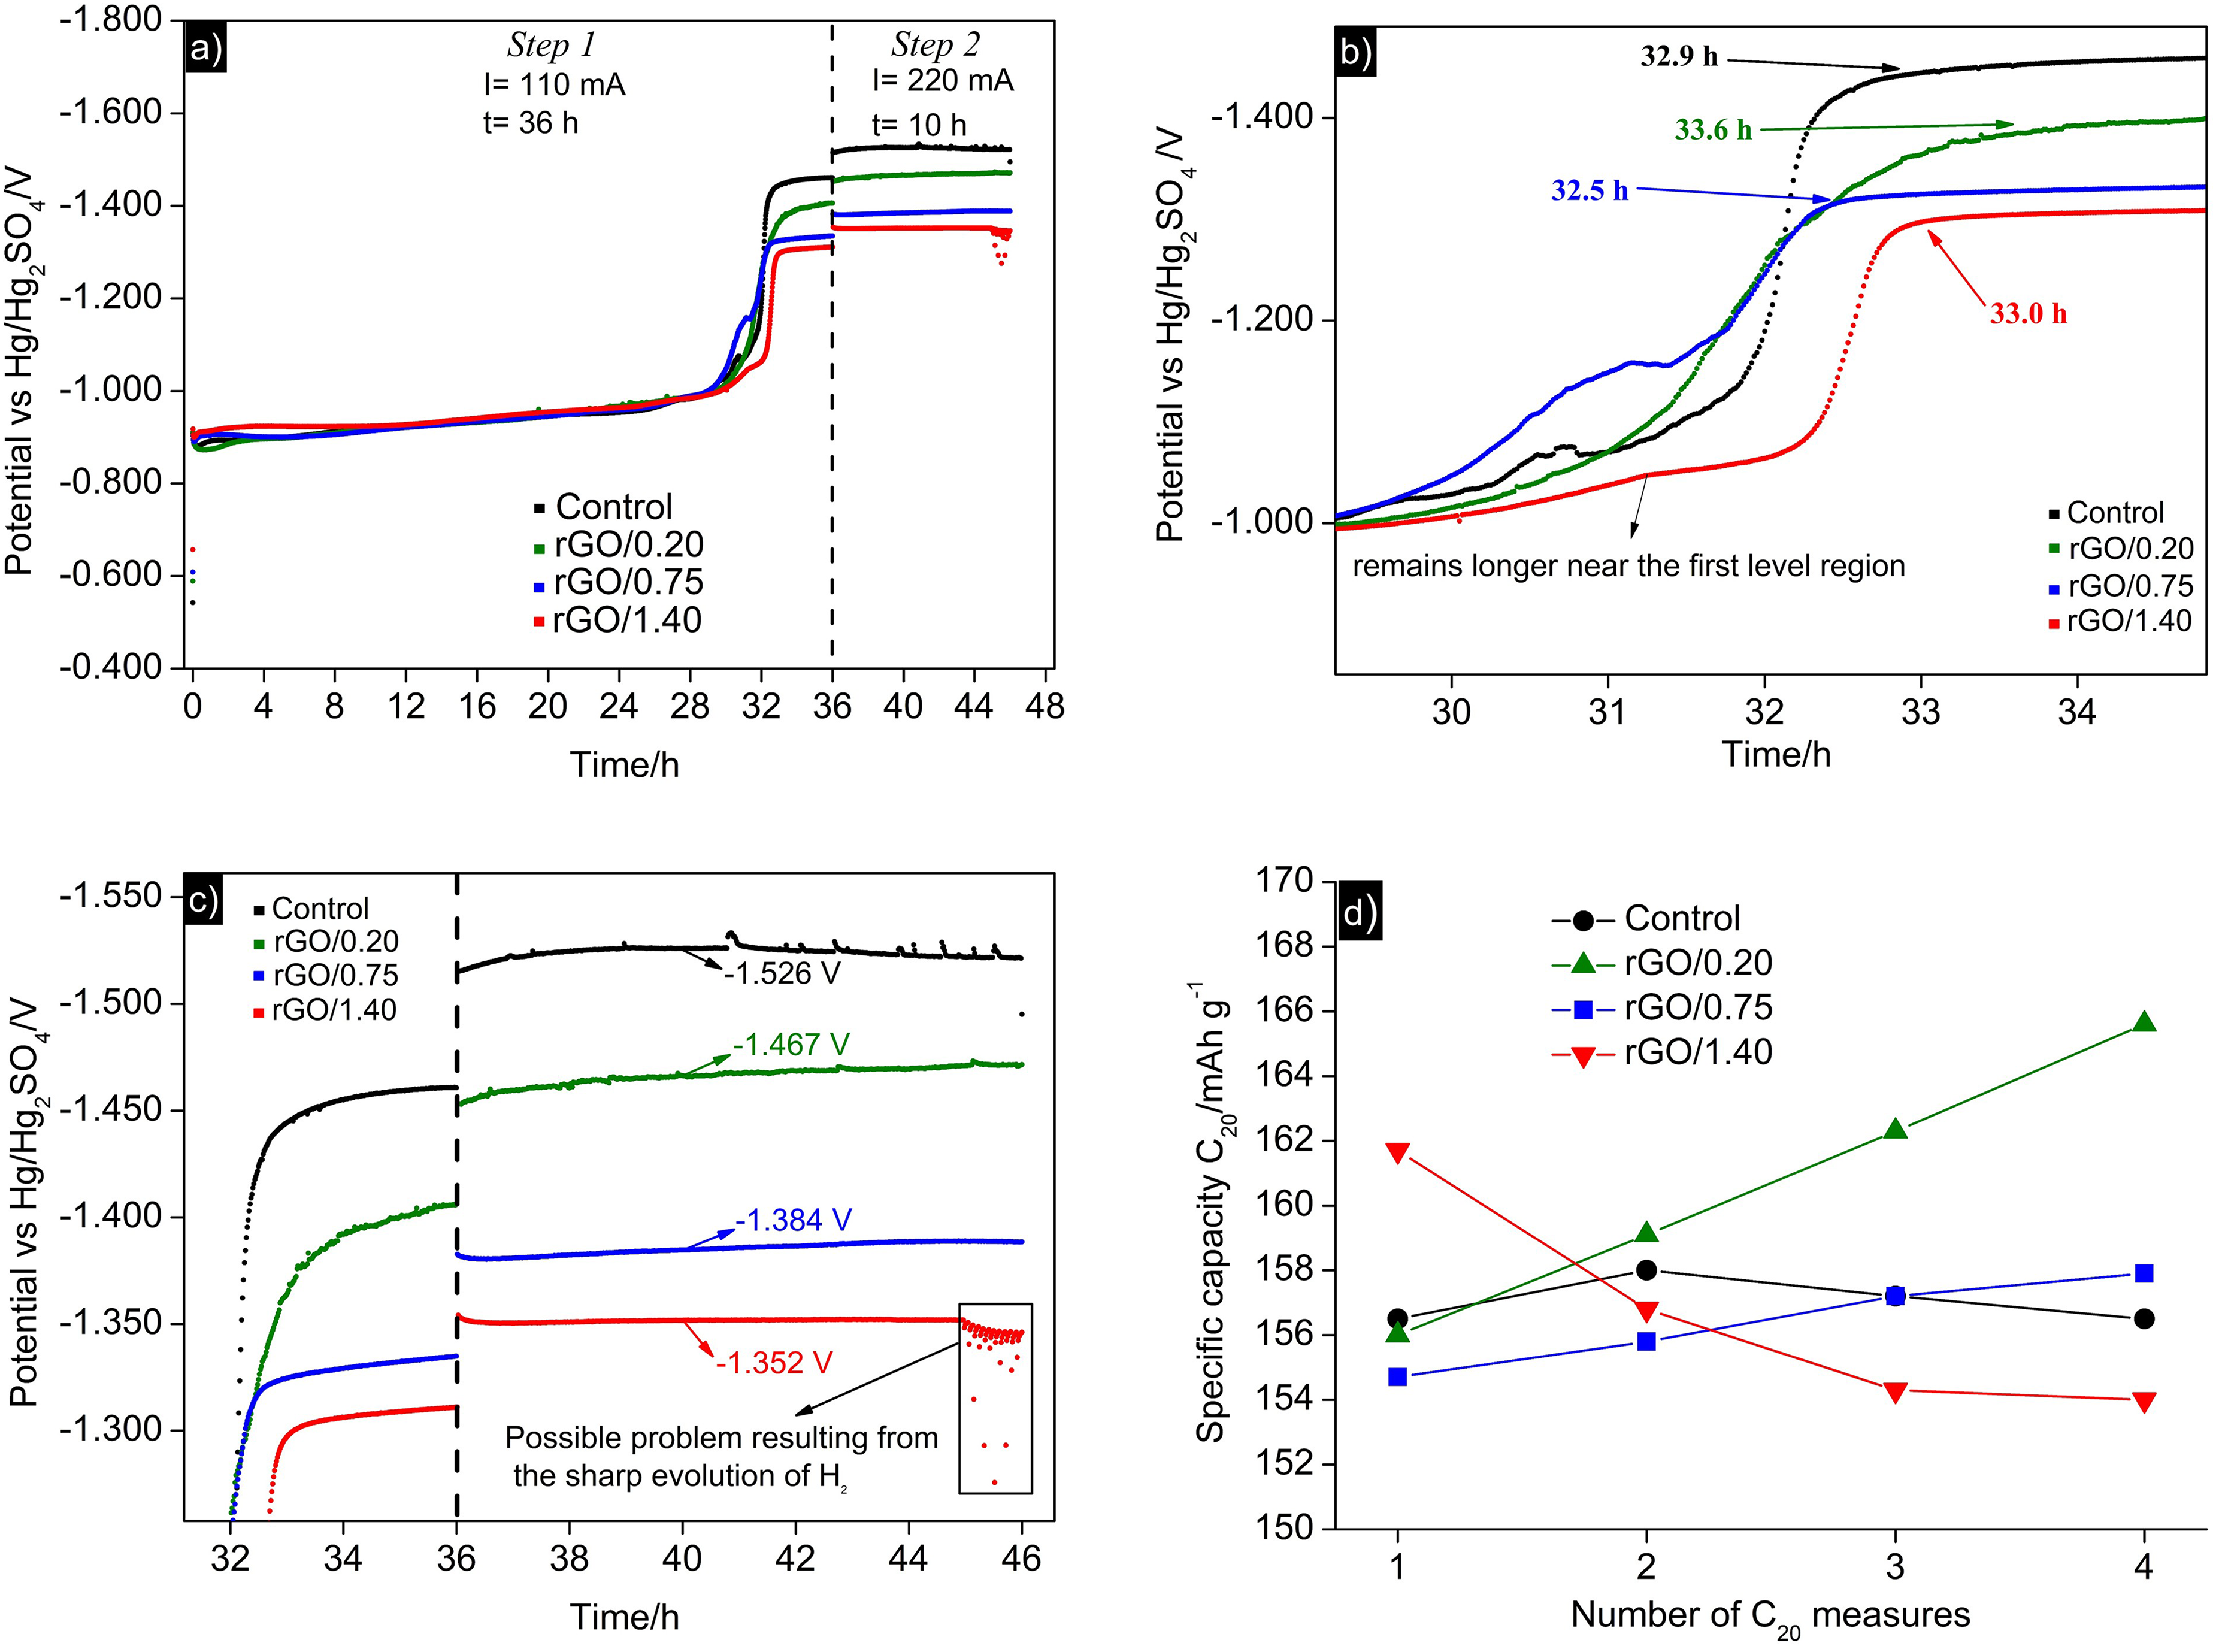
(a) Formation curves of the negative plates; (b) formation curves in the transition region from the first to second potential level; (c) formation curves in the region of the second potential level; (d) specific capacity C20.
The most notable characteristic during the formation process was observed in the second stage, where a potential shift to less negative values is evident in the plates containing rGO. This shift is proportional to the concentration of rGO and is more pronounced in plates with higher concentrations of this material (Figure 5(c)). The reduction in the overpotentials required to reach the second stage suggests that the hydrogen evolution reaction is favored in the presence of this material. This phenomenon may indicate a lower efficiency of the recharge reactions throughout the plate's life cycle and, depending on the effect's magnitude, may result in lower performance during charge and discharge cycles. Less efficient recharging could lead to a greater lead sulfate accumulation in the negative material, especially HRPSoC. Supporting this observation, an increase in the H2 rate occurred in the last hour of the formation process of the plate with the highest rGO concentration (1.40%), where potential instability was observed, likely due to a significant evolution of hydrogen bubbles. This favoring of hydrogen evolution has also been reported elsewhere, 30 suggesting that carbon additives can promote hydrogen evolution, as carbonaceous materials generally exhibit lower overpotential for hydrogen evolution, particularly in acidic environments (e.g., lead-acid batteries). 41
In reference to the C20 capacity measurements, Figure 5(d) presents the capacity values expressed as specific capacity (mAh g−1), considering the exact mass of active material. Notably, plate versions containing rGO exhibited a progressive increase from the first capacity measurement, except for the rGO/1.40 plate. The rGO/0.20 version stood out, which presented a 6.2% increase between the first and fourth capacity measurements, a significant value compared to the specific capacity values of the other versions. This increasing trend may suggest that rGO, when added in specific concentrations, can enhance the efficiency of the kinetics of the NAM reactions. As for the observed decrease in capacity over the measurements for the rGO/1.40 plate, a plausible explanation is its high rGO concentration, results in an elevated rate of hydrogen evolution, thereby reducing the efficiency of recharges post capacity measurements. Conversely, the rGO/1.40 plate presented the highest value for the initial capacity measurement (indicative of formation efficiency), supporting the observation that its formation curve remained at a potential close to the initial level longer than the other versions. The rGO/0.75 plate did not show a tendency for decreasing capacity, although its increase was limited to 2.1% between the first and fourth measurements, lower than the rGO/0.20 plate, possibly influenced by a higher hydrogen evolution rate. The control plate exhibited a 1.0% increase between the first and second capacity measurements, followed by a progressive 1.2% decrease between the second and fourth measurements. The initial increase can be attributed to capacity stabilization after formation, while the subsequent decline was possibly related to the lower contribution of carbon black compared to rGO in enhancing the efficiency of the kinetics of NAM reactions. Considering the last capacity measurements, the best-performing plate (rGO/0.20) exhibited a specific capacity value 6.1% higher than the control. This outcome aligns with other studies that have added different types of rGO to NAM.21,22
Electrochemical performance
The voltammograms (Figure 6) obtained for rGO, graphite, and carbon black exhibited a quasi-rectangular shape, typical of materials with pseudocapacitive properties, representing an intermediary behavior between capacitors that store energy purely in the electric double layer and batteries.42,43 The synthesized rGO presented a broad peak in the range of 0.5–0.6 V, indicative of pseudocapacitive character associated with faradaic charge transfer. This is due to a rapid sequence of reversible “faradaic redox” processes, defined by three different mechanisms: adsorption, redox, and intercalation.42,43 Unlike an ideal capacitor, the current values presented dependence on the scanning speed, often attributed to the double layer structure, ion adsorption, and the material's porous structure influencing electrolyte diffusion. These findings suggest that rGO films have binding sites capable of facilitating faradaic redox reactions, which can be explained by the remaining oxygenated groups in the rGO structure, as identified in FTIR measurements.
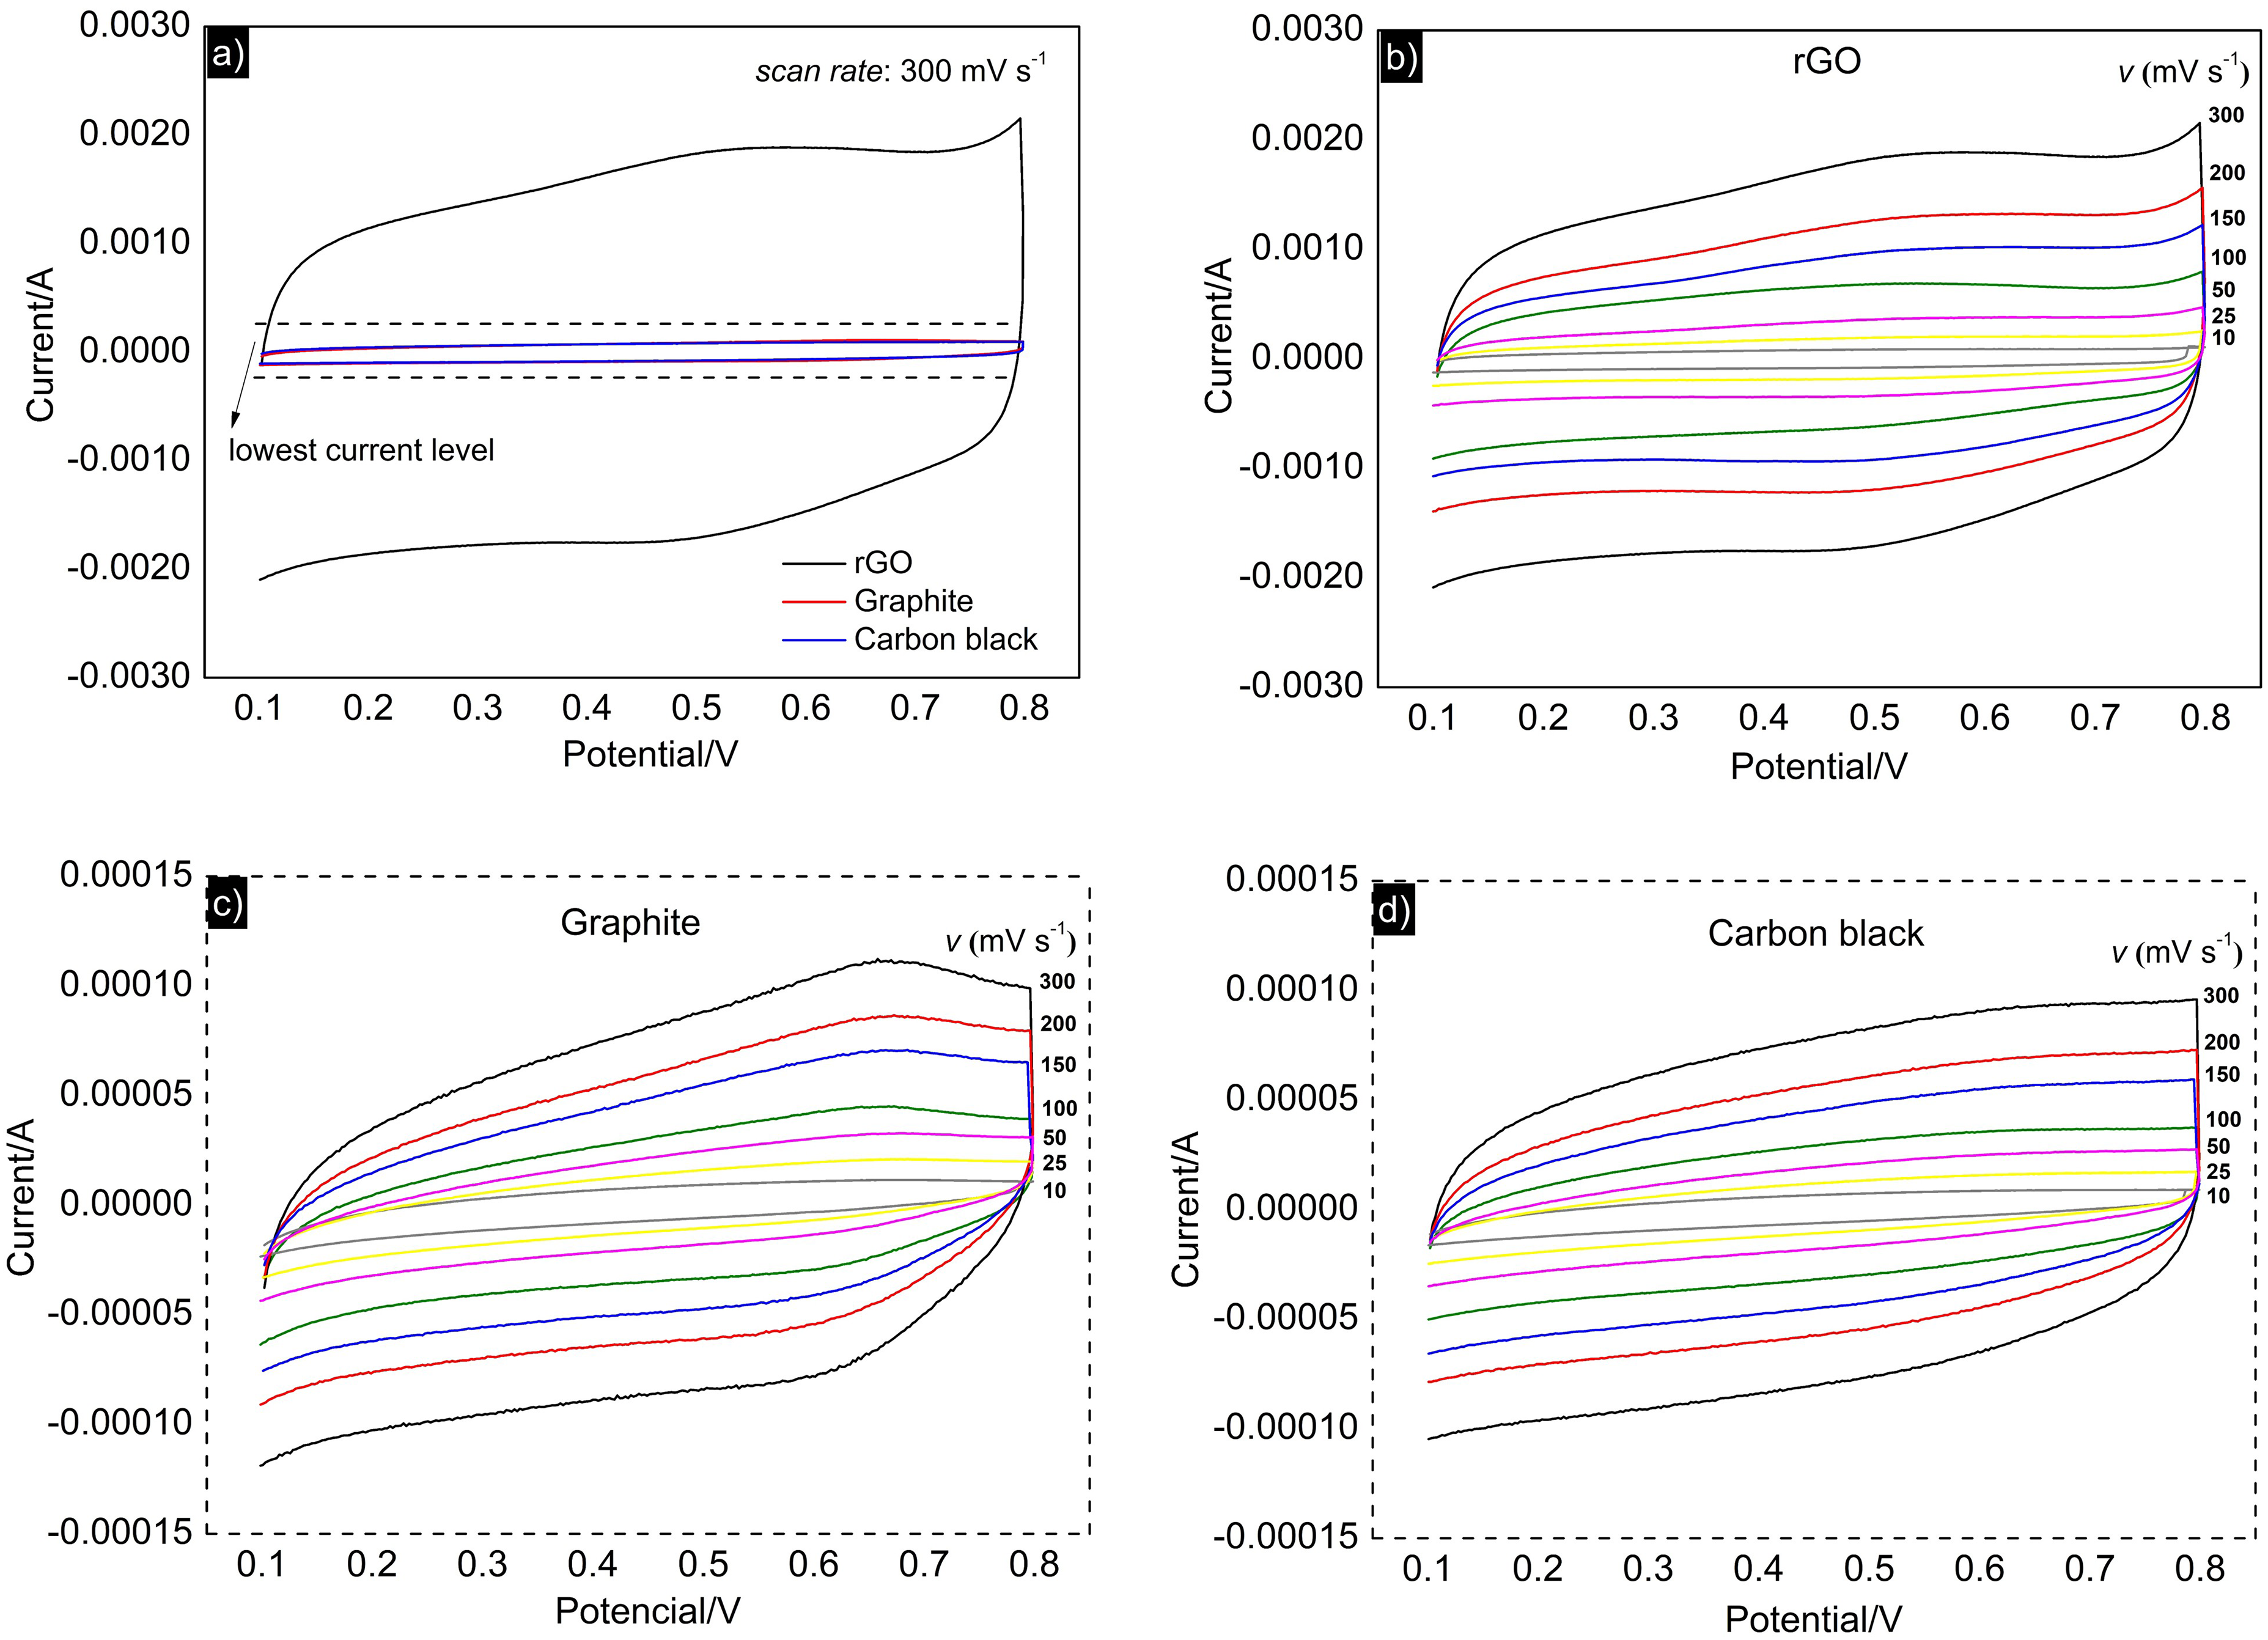
Cyclic voltammograms of (a) rGO, graphite and carbon black (300 mV s−1 scan rate); (b) rGO at different scanning speeds; (c) graphite at different scanning speeds; (d) carbon black at different scanning speeds.
The calculated values of specific capacitance for the materials (rGO, graphite, and carbon black) at different scanning speeds are presented in Figure 7(a). As previously inferred from the magnitude differences in the current values of the respective cyclic voltammograms (Figure 6(a)), rGO presented a specific capacitance (calculated by Equation (1)) significantly higher than those of graphite and carbon black (approximately 10 times higher). These values suggest that the synthesized rGO has the potential to exert a capacitive effect, consistent with findings in the literature for other types of rGO produced from different synthetic routes.21,44–48 Data were then treated (Figure 7(b) and (c)), from which the values resulting from the CDL and CP were calculated. These values are listed in Table 2, in which one can observe that rGO significantly contributed its pseudocapacitive properties, representing 38% of the calculated CT. The CT value of 127 F g−1 aligns closely with values calculated from Equation (1), represented in Figure 7(a), underscoring the data's consistency.
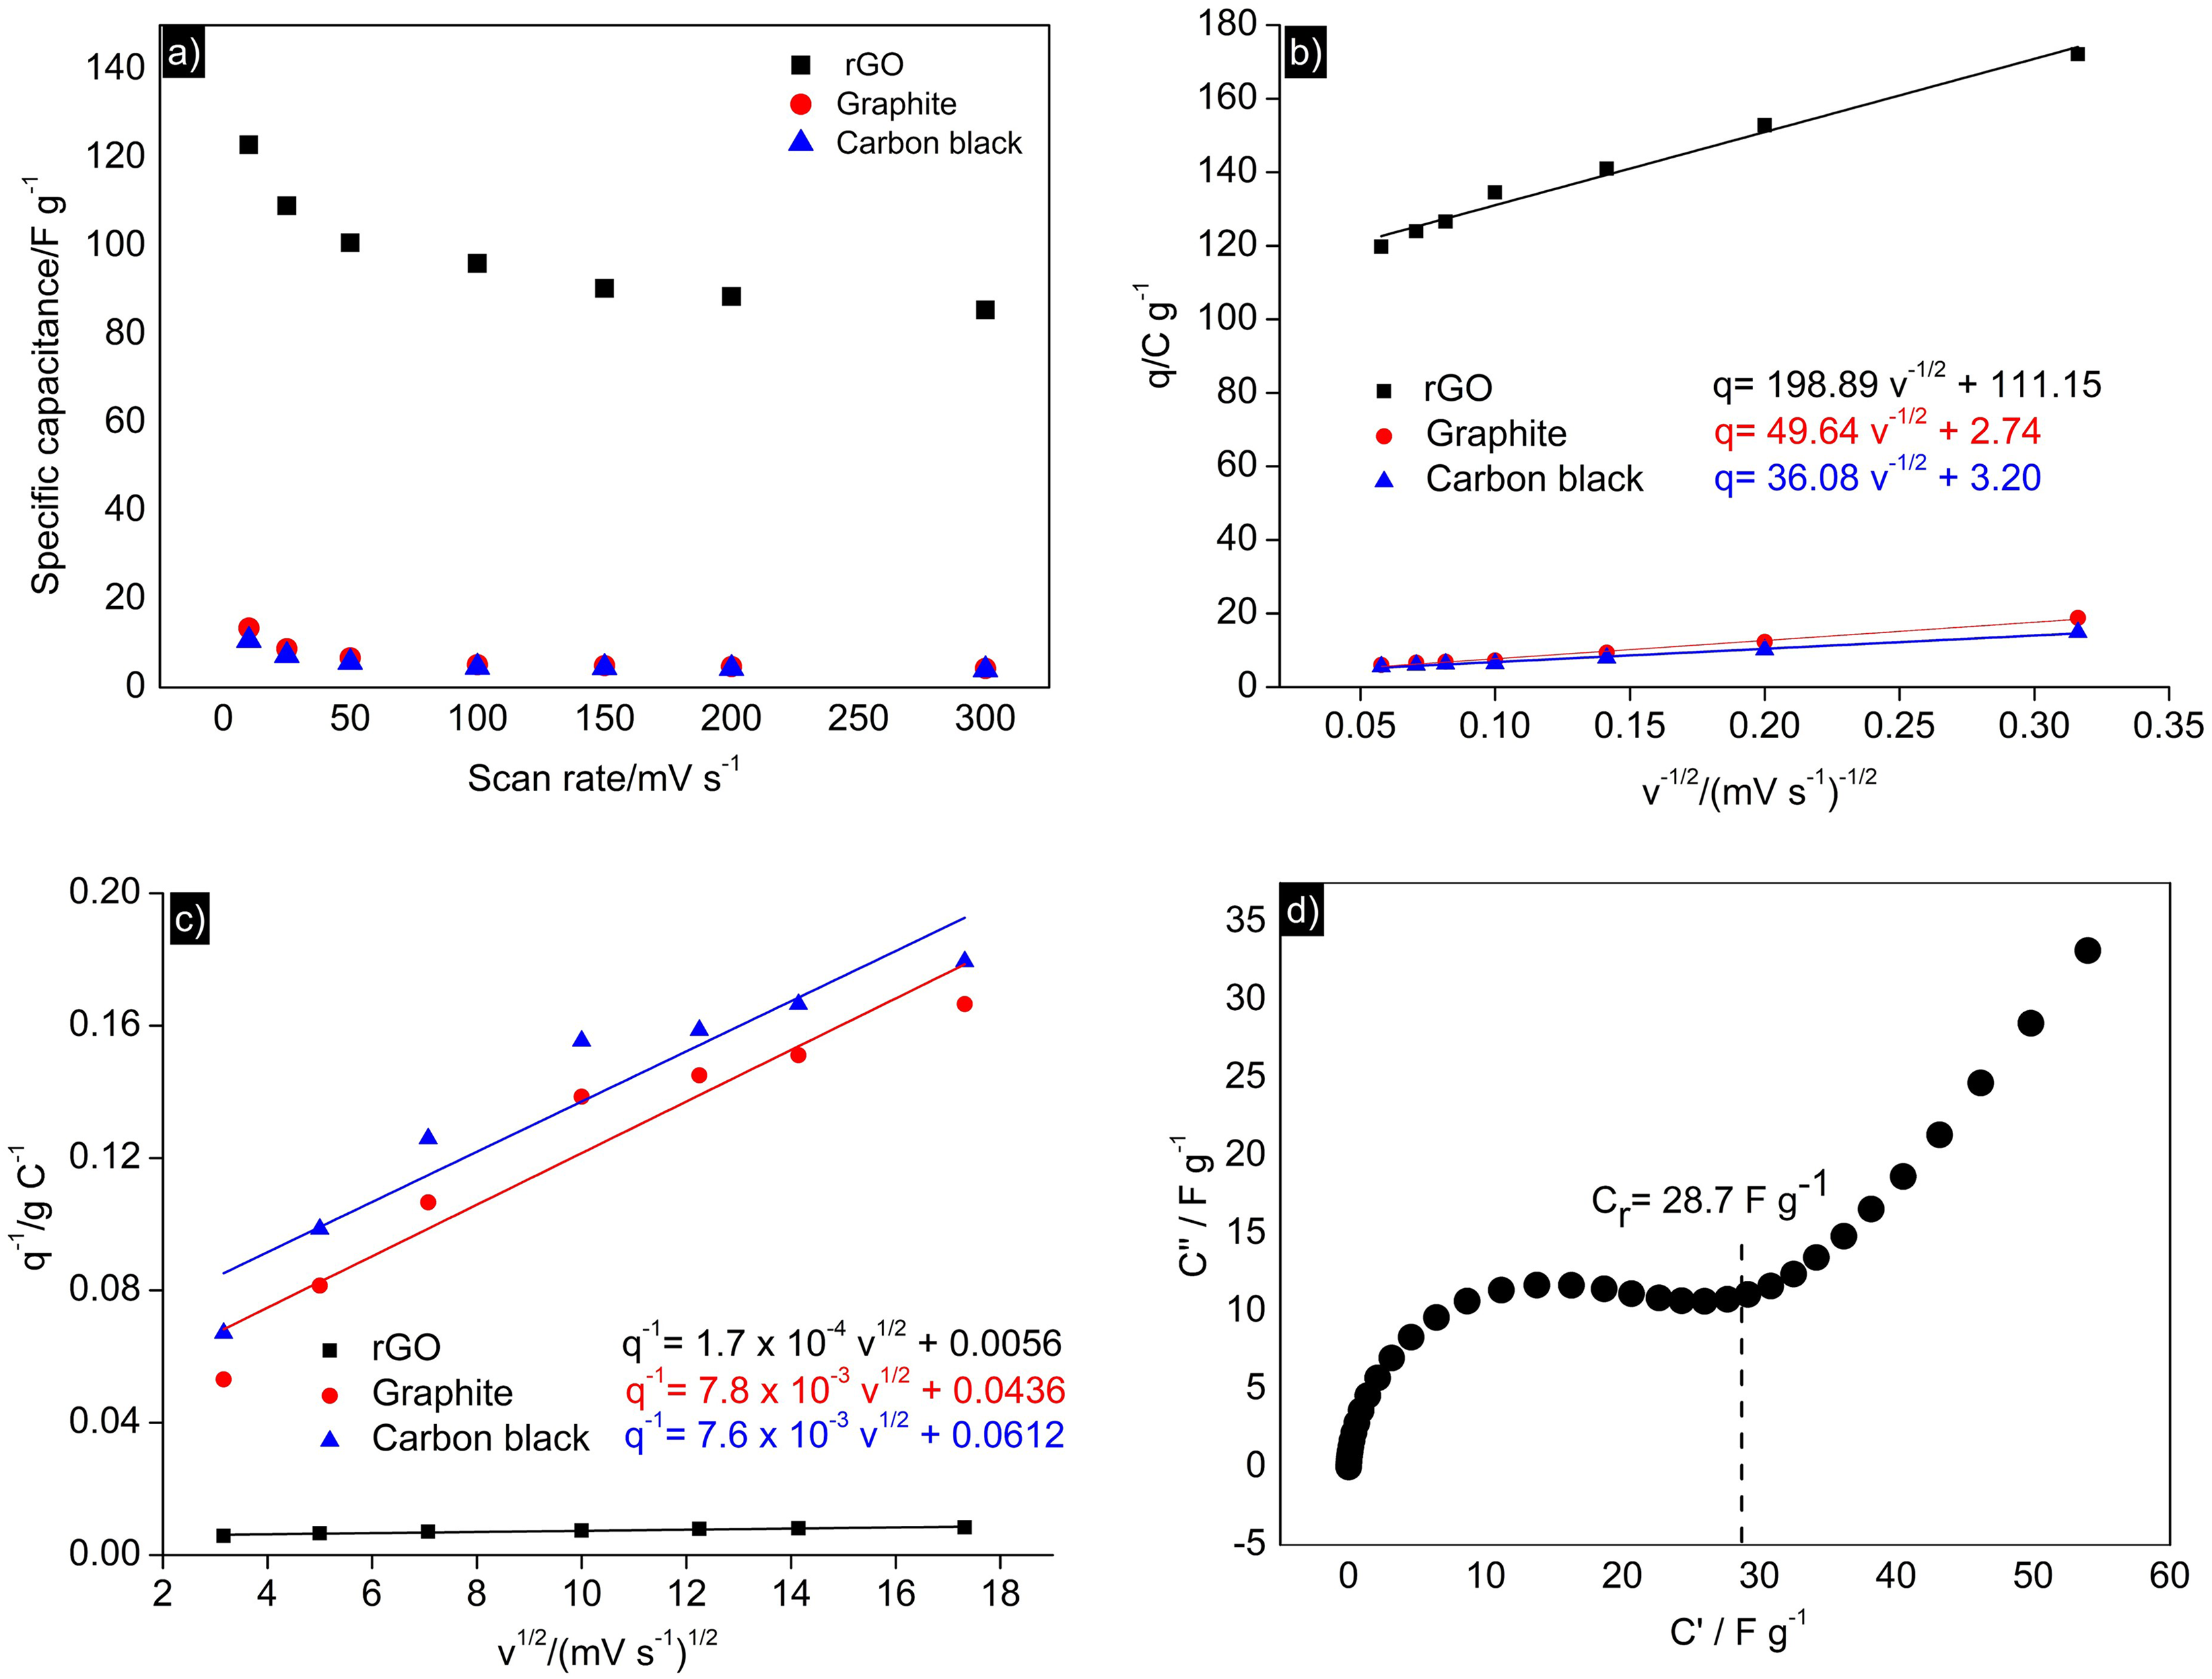
(a) Specific capacitance values of rGO, graphite and black at each of the scanning speeds, representation of the dependence of b q vs v−1/2 and c q−1 vs v1/2 and d nyquist capacitive diagram for the rGO coated electrode.
To further investigate the pseudocapacitive behavior of rGO, we utilized electrochemical impedance spectroscopy. Figure 7(d) presents the Nyquist capacitive spectrum obtained for the electrode coated with rGO. The presence of rGO resulted in a response characterized by a well-defined capacitive arc, qualitatively indicating its capacitive nature. The calculated value of the redox capacitance was 28.7 F g−1, comparable to the CP value calculated via voltammetry, confirming that pseudocapacitance contributes significantly to the total capacitance, although electric double-layer capacitance remains predominant.
Figure 8 shows the curves of the final discharge voltages obtained during the HRPSoC microcycle test. The results demonstrate that the negative plate containing 0.20% rGO exhibited superior performance in the HRPSoC microcycle test, completing 21% more cycles than the control plate (3656 vs. 3023 microcycles). This enhanced performance of the rGO/0.20 version is consistent with the C20 capacity measurements (Figure 5(d)) where this plate version stood out, presenting a significant progressive increase in values compared to other plate versions. The superior performance is hypothesized to stem from the dual electrochemical role of rGO within the NAM: providing enhanced electronic conductivity and a significant capacitive contribution. During high-rate charging, the rGO sheets may act as conductive and capacitive interfaces that temporarily accommodate incoming charge through electric double-layer charging. This effect likely promotes a more homogeneous distribution of charge transfer across the NAM and reduces local polarization, particularly considering the high electronic conductivity of sp2-hybridized carbon materials. In this context, the role of rGO is not to replace the faradaic conversion of PbSO4 to Pb, but to improve the electrochemical accessibility of PbSO4 regions. This mechanism not only enhances the overall charge acceptance efficiency but also minimizes the accumulation and growth of large, electrically insulating lead sulfate crystals, which are characteristic of irreversible sulfation. Consequently, the improved efficiency of the charging reaction facilitated by rGO directly leads to a sustained reduction in the concentration of PbSO4 over cycling. Although the measured pseudocapacitive contribution associated with residual oxygen-containing functional groups may also participate in transient charge storage, the results presented in Table 2 suggest that the predominant contribution to the improved HRPSoC performance arises from the electrochemically accessible surface area of rGO and the corresponding electric double-layer capacitive behavior, promoting rapid charge accommodation and mitigating local polarization within the NAM.
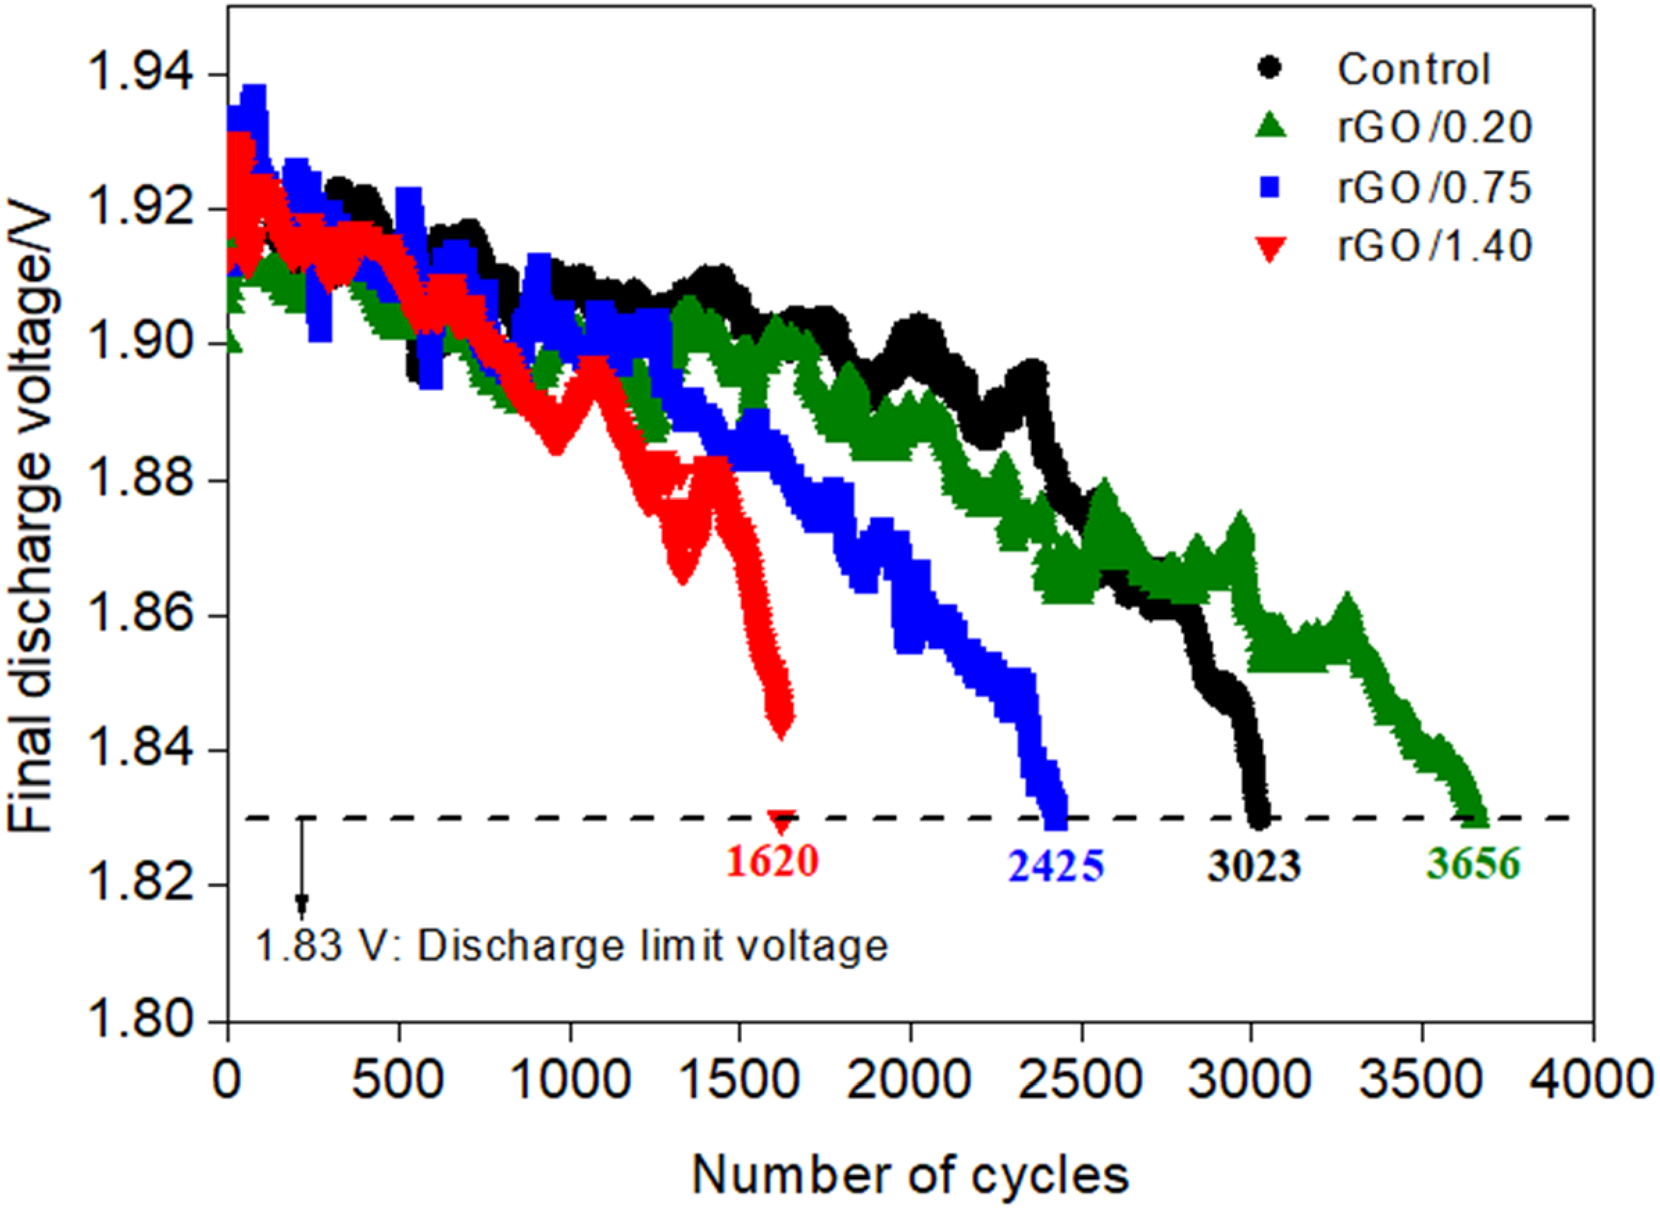
HRPSoC microcycle curves of discharge plotted as a function of the final discharge voltages.
Despite the improved performance of the plate containing rGO, as seen in the rGO/0.20 version, the same behavior was not observed in versions produced with higher rGO concentrations. The rGO/0.75 and rGO/1.40 plates completed 20% and 53% fewer microcycles than the control plate, respectively. This can be attributed to the relationship between increased areas containing carbon centers and decreased capacitive effects, favoring enhanced hydrogen evolution during recharges, as indicated by previous analyses of the formation curves and C20 capacity measurements. Figure 9 presents images showing the condition of the plates after the HRPSoC microcycle test, evidencing the more significant damage caused by increased hydrogen evolution in the plates with higher rGO concentrations, as evidenced by the presence of eruptions and signs of mass detachment.
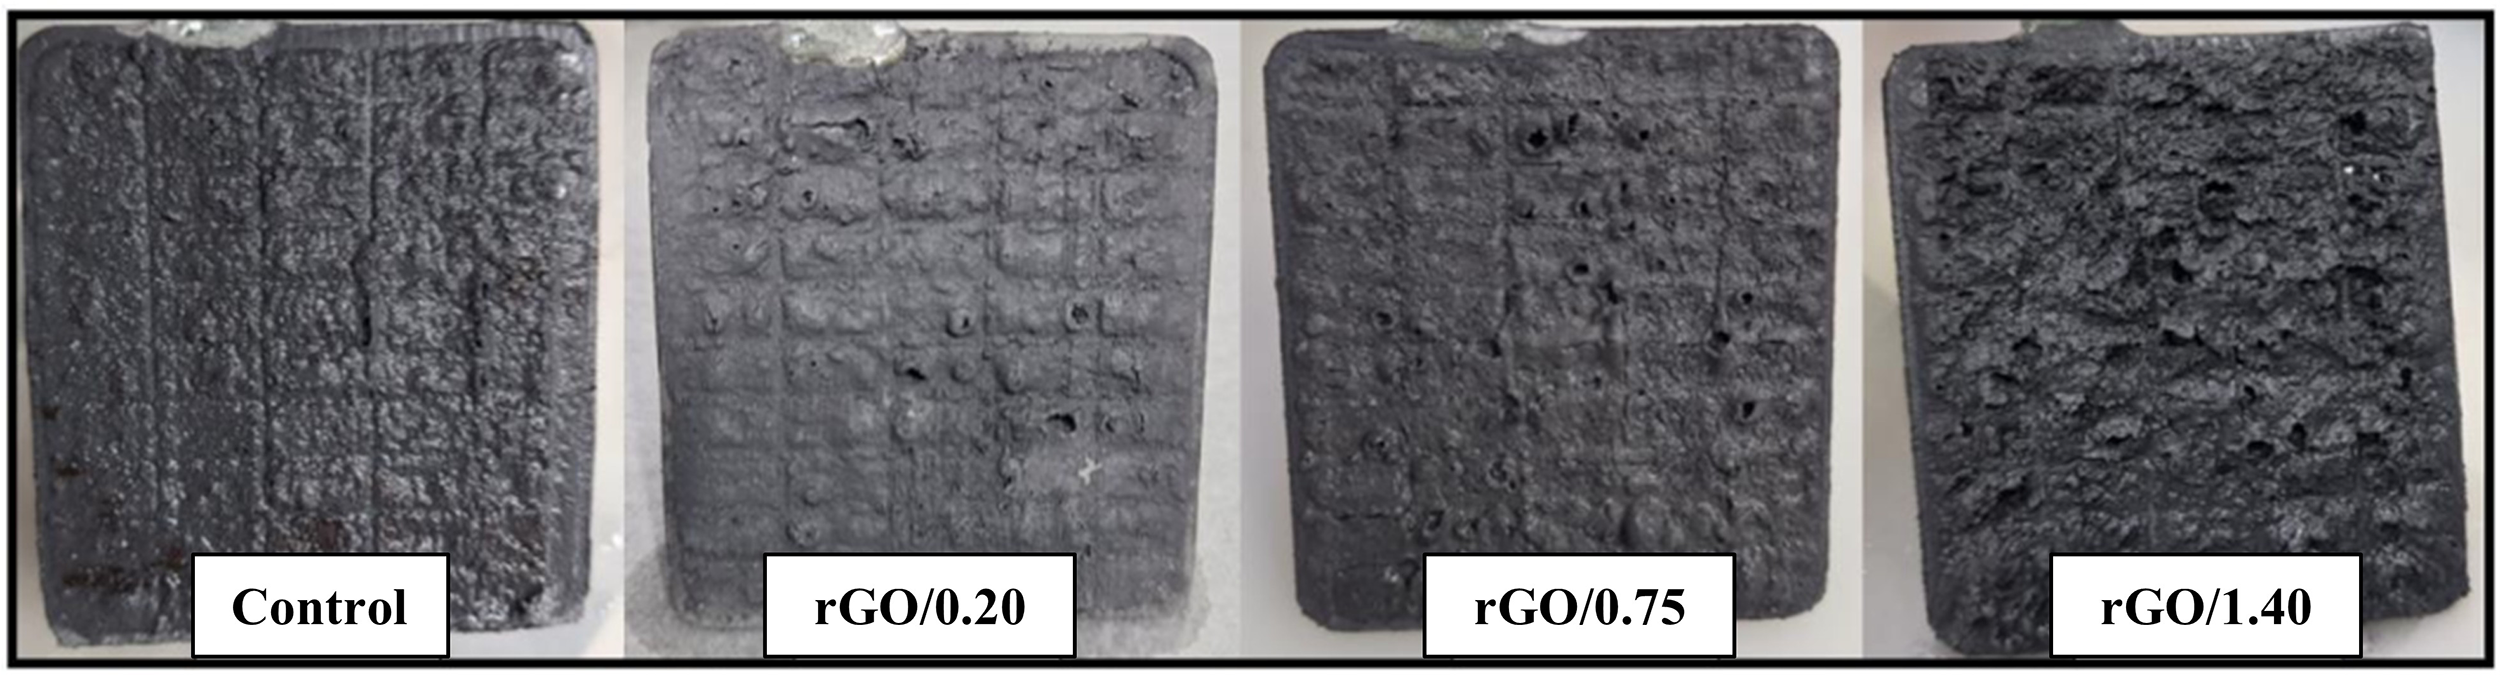
Photos of the negative plates after HRPSoC microcycle test.
Although desirable, a direct comparison between results from distinct studies is complex and unfeasible. As seen in Table 1, there is significant heterogeneity in experimental conditions and methods, preventing direct comparison. This complexity mainly arises from differences in cell technology, test protocols, and reference materials (control). Most studies have focused on AGM batteries, which inherently exhibit superior performance in controlled environments and often use distinct HRPSoC protocols. In contrast, our work applied a specific HRPSoC algorithm adapted for flooded-type cells, a technology where optimizing NAM with rGO under these conditions is less explored. Regarding the control material, many studies have used conventional carbon black. However, we utilized the advanced carbon black Cabot PBX-135 for a more rigorous comparison standard. Consequently, the reported performance increase was measured against a high-performing control, enhancing the real impact value of our additive. In addition, the composition used in preparing the active materials must also be considered. The origin and properties of the raw materials, as well as their respective proportions, result in specific conditions of porosity, surface area, paste density, crystal size of the basic sulfates, humidity, and corrosion layer at the active material/current collector interface. As shown in Table 1, the paste formulation differs significantly between the studies compared. Together with other points discussed, this underscores the care needed when comparatively analyzing results from different studies.
Conclusion
Reduced graphene oxide was successfully synthesized using an improved Hummer's method. When incorporated into NAM, this material demonstrated potential as an additive for advanced lead-acid batteries. A concentration of 0.20% proved to be optimal, resulting in a 21% improvement in HRPSoC micro cycles of charge and discharge, and a specific capacity that is 6.1% higher than the control plate. Notably, this improvement was particularly significant considering that the control sample was already formulated with a type of carbon black commonly employed in advanced battery technologies, which is known to enhance performance. Therefore, achieving a 21% increase over an already optimized formulation highlights the strong potential of rGO as a performance-enhancing additive. This performance enhancement can be attributed to the capacitive/pseudocapacitive properties of rGO, as evidenced by electrochemical techniques such as cyclic voltammetry and electrochemical impedance spectroscopy. At higher concentrations (0.75% and 1.40%), the rGO contributed to a reduced number of HRPSoC micro cycles. This adverse effect was due to the increased hydrogen evolution promoted by this material, which was observed experimentally and corroborated by formation curves and C20 capacity measurements. This phenomenon is widely reported in the literature as a known issue with some carbonaceous materials, attributed to their lower overpotential for hydrogen evolution. Although the addition of rGO at 0.20% showed satisfactory performance, future studies should seek to develop methods to inhibit hydrogen evolution, as this would enable the use of higher rGO concentrations and consequently achieve better performance of the negative plates. Mechanistic studies are also suggested to elucidate the action of rGO in NAM, because although we identified important capacitive/pseudocapacitive properties in this material, the BET surface area of 17.25 m2 g−1 is considerably lower than values commonly reported for carbonaceous materials with capacitive properties.
Footnotes
ORCID iDs
Author contribution(s)
Funding
The authors disclosed receipt of the following financial support for the research, authorship, and/or publication of this article: This study was support by the São Paulo State Research Support Foundation – FAPESP (grant nos. 2024/02935-1 and 2018/14506-7) and the National Council for Scientific and Technological Development – CNPq (grant no. 303141/2021-2).
Declaration of conflicting interests
The authors declared no potential conflicts of interest with respect to the research, authorship, and/or publication of this article.