
Abstract
Passivation is a frequently used method to strengthen the surface of aluminum alloys. This study fabricated two zirconium-rich passive layers on the Al alloy. The morphology, thickness, and chemical composition of the prepared coating were analyzed employing XPS and TEM. Electrochemical impedance spectroscopy and Tafel polarization tests are also used to assess the anticorrosive performance. The passivation layers exhibit a dual-layer structure, with thicknesses ranging from 16 nm to 26 nm. Chemical composition of the two component layers is different. Electrochemical tests confirm a significant improvement in anticorrosive performance for both passivated samples compared to the untreated substrate. The study offers insights into the bonding mechanisms and layered architecture of the passivation film, contributing to the development of non-toxic, high-performance surface treatment technologies for aluminum alloys.
Introduction
Aluminum alloys possess excellent casting and mechanical properties but are prone to corrosion over time. This not only leads to the economic loss but can also cause irreversible accidents.1–9 To mitigate this challenge, a range of corrosion protection methodologies were employed for aluminum alloy structures, among which passivation technology is an effective method. The passivation layer on aluminum alloys can effectively resist atmospheric halides and moisture, provide additional protection, extend the service life, and reduce maintenance costs.10–12
The traditional chromate passivation process significantly enhanced the anticorrosive performance of Al alloys 13 ; nevertheless, owing to the significant toxicity and carcinogenic nature of Cr6+, it gradually faced stringent restrictions and prohibitions under environmental regulations such as the EU RoHS and REACH directives. 14 Consequently, the development of environmentally friendly and efficient new passivation systems became a critical research focus in the field of surface engineering.
Zhu et al. 15 immerse a rolled 6063 aluminum alloy sample in a titanium/zirconium passivation solution, forming a passivation layer approximately 1 nm thick. Shi et al. 16 use a TiZrV NEG film to investigate the formation mechanism of the surface passivation layer, identifying atmospheric oxygen, carbon dioxide, and water molecules as the primary oxygen sources. Qin et al. 17 treated 6061 aluminum alloy with a solution containing titanium salt, sodium fluoride, and H2O2 for a fluorotitanate conversion, finding that the hydrolysis of fluorotitanate produces TiO2 colloids that deposit on the conversion coating particles, enhancing its corrosion resistance.
This study will investigate the composition, morphology and corrosion resistance of typical zirconium-rich passivation layers. Meanwhile, the formation mechanism and the enhanced anticorrosive performance of the passivation layer was analyzed. The innovation of this work lay in revealing the “dual-layer synergistic protection structure” emerged from the interaction between silane coupling agents and zirconium salts within the composite passivation system, and in clarifying their chemical bonding modes and corrosion inhibition mechanisms with the substrate through high-resolution microscopic analysis and electrochemical fitting. This research not only provided theoretical support and performance verification for the enterprise's existing process, but also offered a scientific basis for the structural design and process optimization of novel, environmentally friendly, high-performance aluminum alloy surface treatment technologies.
Materials and methods
The samples for this experiment are A356 samples after precision turning. The samples were subjected to passivation treatments using a variety of distinct solutions. The first solution consists of zirconium fluoride and an acrylic resin component et al. The second solution contains zirconium fluoride, magnesium nitrate, and a large amount of a silane-based treatment agent et al. For convenience, the samples will be referred to as follows: B - blank samples, S1 - coating prepared with Solution 1, S2 - coating prepared with Solution 2. The samples were rinsed in anhydrous ethanol for 10 min with a ultrasonic washing machine to eliminate oil, contaminants, and other residues. They were rinsed repeatedly with deionized water as well as alcohol, and then dried.
Epoxy resin are used to seal the cross-sections. The cross-sections of the un-molded samples were polished with silicon carbide sandpaper on the polishing machine (Reedea MP-2B, Ningbo, China). Subsequently, polishing was performed using polishing paste on a cloth. The samples were cleaned multiple times using deionized water as well as anhydrous ethanol and then dried.
Elemental peaks present in the passivation layers were analyzed with XPS. The energy analysis range is 0–1350 eV, the range of the beam spot is 20–900 μm. In the test, the monochromatic light gun Al Kα was used as the X-ray source. Focused ion beam (FIB) thinning was conducted on samples with the assistance of a micromanipulator, operation probes, and ion beam cutting. The samples were cut into 5 × 5 × 3 μm thin slices. Elemental analysis of the surface passivation layer, lattice spacing, grain size was performed with an electron microscope (TEM Talos F200S; EDS SUPER X). The electrochemical performance of samples subjected to different passivation treatments was evaluated using an electrochemical workstation (CHI 760e, Chenhua, Shanghai). All measurements employed a three-electrode setup with a saturated calomel reference electrode, a platinum sheet counter electrode, and the specimen as the working electrode, and the electrolyte was 3.5 wt% NaCl solution. All EIS measurements were carried out at a constant open-circuit potential, scanning frequencies from 100 kHz to 10 MHz with a 5 mV signal amplitude.
Results and discussion
XPS analysis
The XPS is sensitive on surface chemical composition of a sample. Hence, an X-ray photoelectron spectroscope was enrolled to characterize the A356 aluminum alloy sample after passivation. From the XPS results shown in Figure 1, it can be observed that for S1 samples, the peaks of Zr are very small and not prominent. In contrast, S2 samples show significant peaks of Zr.18,19 Following the fitting of the Zr 3d XPS peaks, the deconvoluted Zr spectrum exhibits a doublet structure, which primarily arises from spin-orbit coupling. Within this doublet, the Zr 3d5/2 peak is positioned at approximately 181.7 eV, and the Zr 3d3/2 peak is located at approximately 183.7 eV (Figure 1(b)). The lower binding energy component at approximately 181.7 eV is assigned to zirconium in the tetravalent (Zr4+) oxidation state.19–21 The higher binding energy peak is centered at 183.7 eV. Relative to the Zr 3d5/2 peak, this represents a positive chemical shift of approximately 2.0 eV. This significant shift arises from the difference in electronegativity of the coordinating atoms. Fluorine (F) is the most electronegative element; when zirconium coordinates with fluorine, the electron density of its inner shells decreases, leading to an increase in binding energy.22–24 This assignment receives independent support from the presence of a strong peak at ∼685 eV in the sample's F 1 s spectrum.
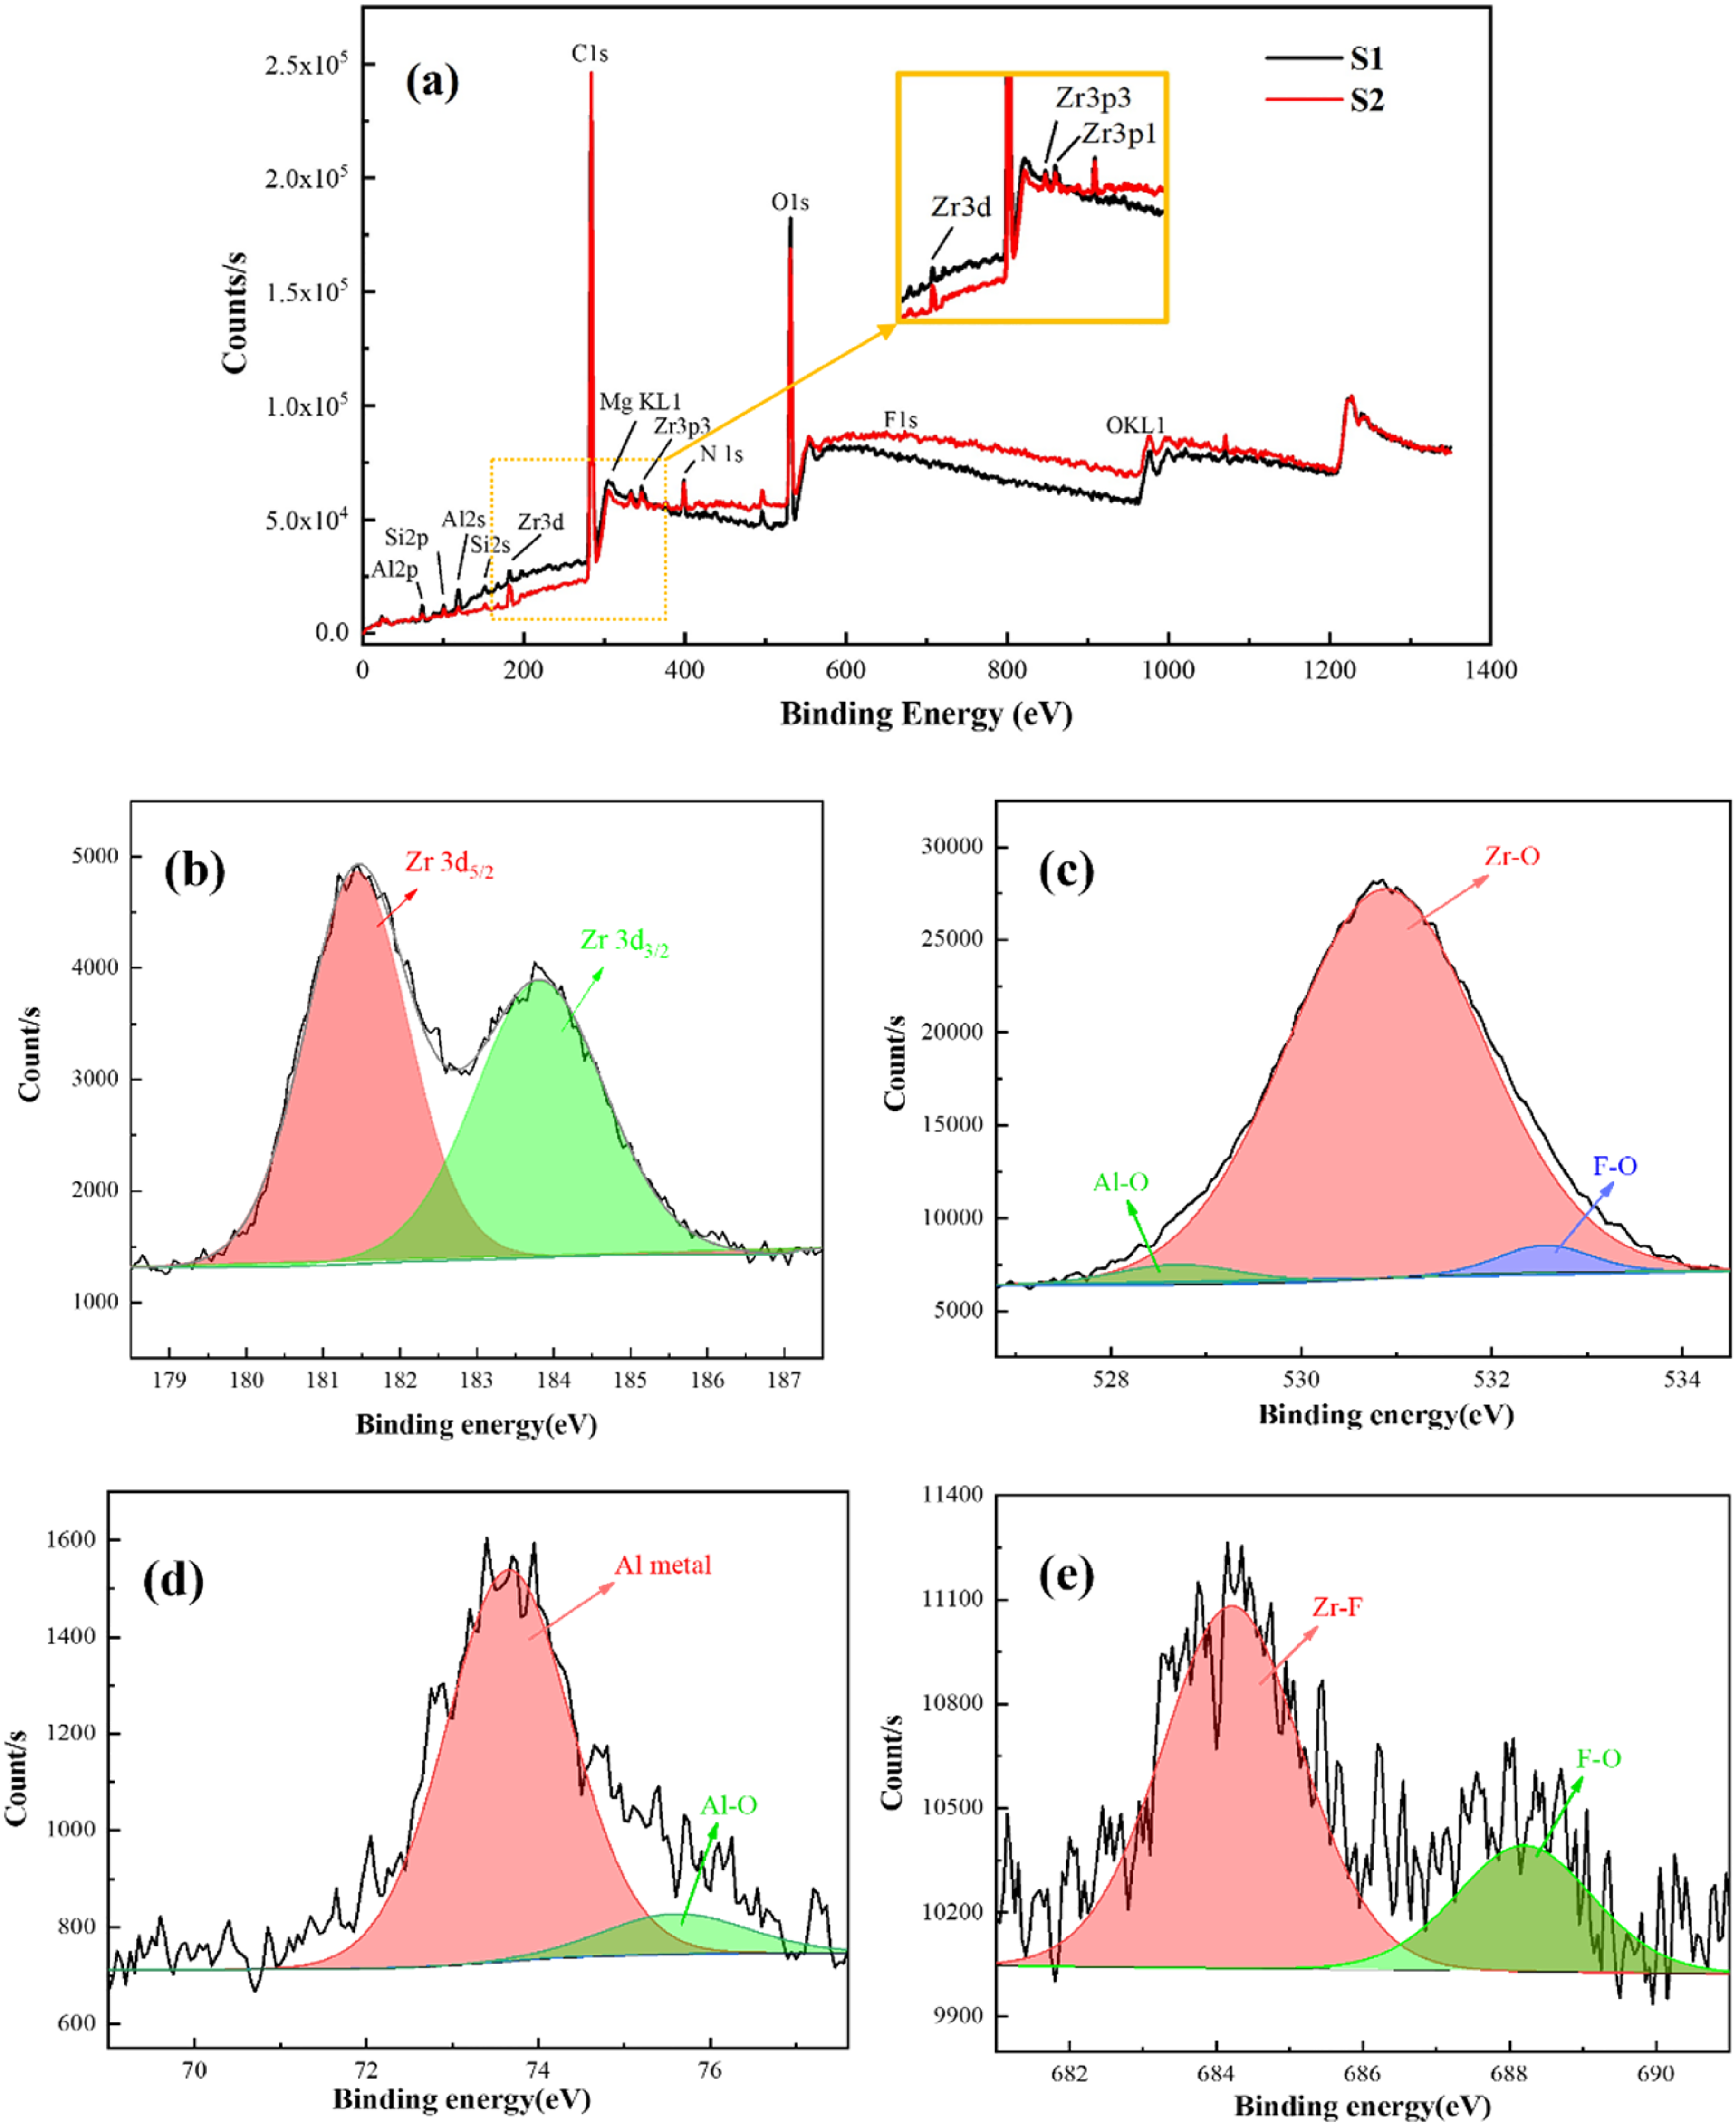
(a) XPS spectrum of passivation layer processed with S1 and S2, (b) zirconium peak spectrum, (c) oxygen peak spectrum, (d) aluminum peak spectrum, and (e) fluorine peak spectrum.
The XPS analysis reveals that aluminum with characteristic peaks of 72.8 eV and 121 eV exists in the passivation layer, this is reasonable as the Al elements is the main element in the A356 aluminum alloy. The O element peak at 531.5 eV can be found, and the fitted results reveal the possible existence of Al-O and Zr-O bonds.18,19 Subsequently, the element content of the two samples were semi-quantitatively analyzed by the Avantage software. All samples exhibited a high oxygen content of approximately 60%, with nitrogen and aluminum also constituting a portion. While, zirconium constitutes merely 1% in the S1 specimen. Sample S2 exhibited a greater zirconium concentration than S1, constituting roughly 2% of the composition, this indicates that passivation layer on the S2 sample can be thicker than which on the S1 sample. The presence of a silane coupling agent alongside fluorozirconic acid in S2 facilitates the formation of a more uniform Zr-rich layer.
TEM analysis
Two samples were processed using FIB, a strip-shaped sample approximately 5 μm thick was extracted from them. This strip-shaped sample was then placed on a copper grid for TEM testing to further characterize the morphology of the passivation layer.
Figure 2(a) and (b) show the transmission electron microscopy photographs of specimen S1. The black area is rich in gold, with a FIB-cutting protection layer above it. From the high-resolution TEM images, a layer of coating is indeed present on the surface; however, it is uneven in thickness, with some areas being less than 10 nm thick. Some areas have a thicker passivation layer, reaching up to more than ten nanometers, as shown in the above figure, the thickness of the passivation layer has reached about 16 nm.
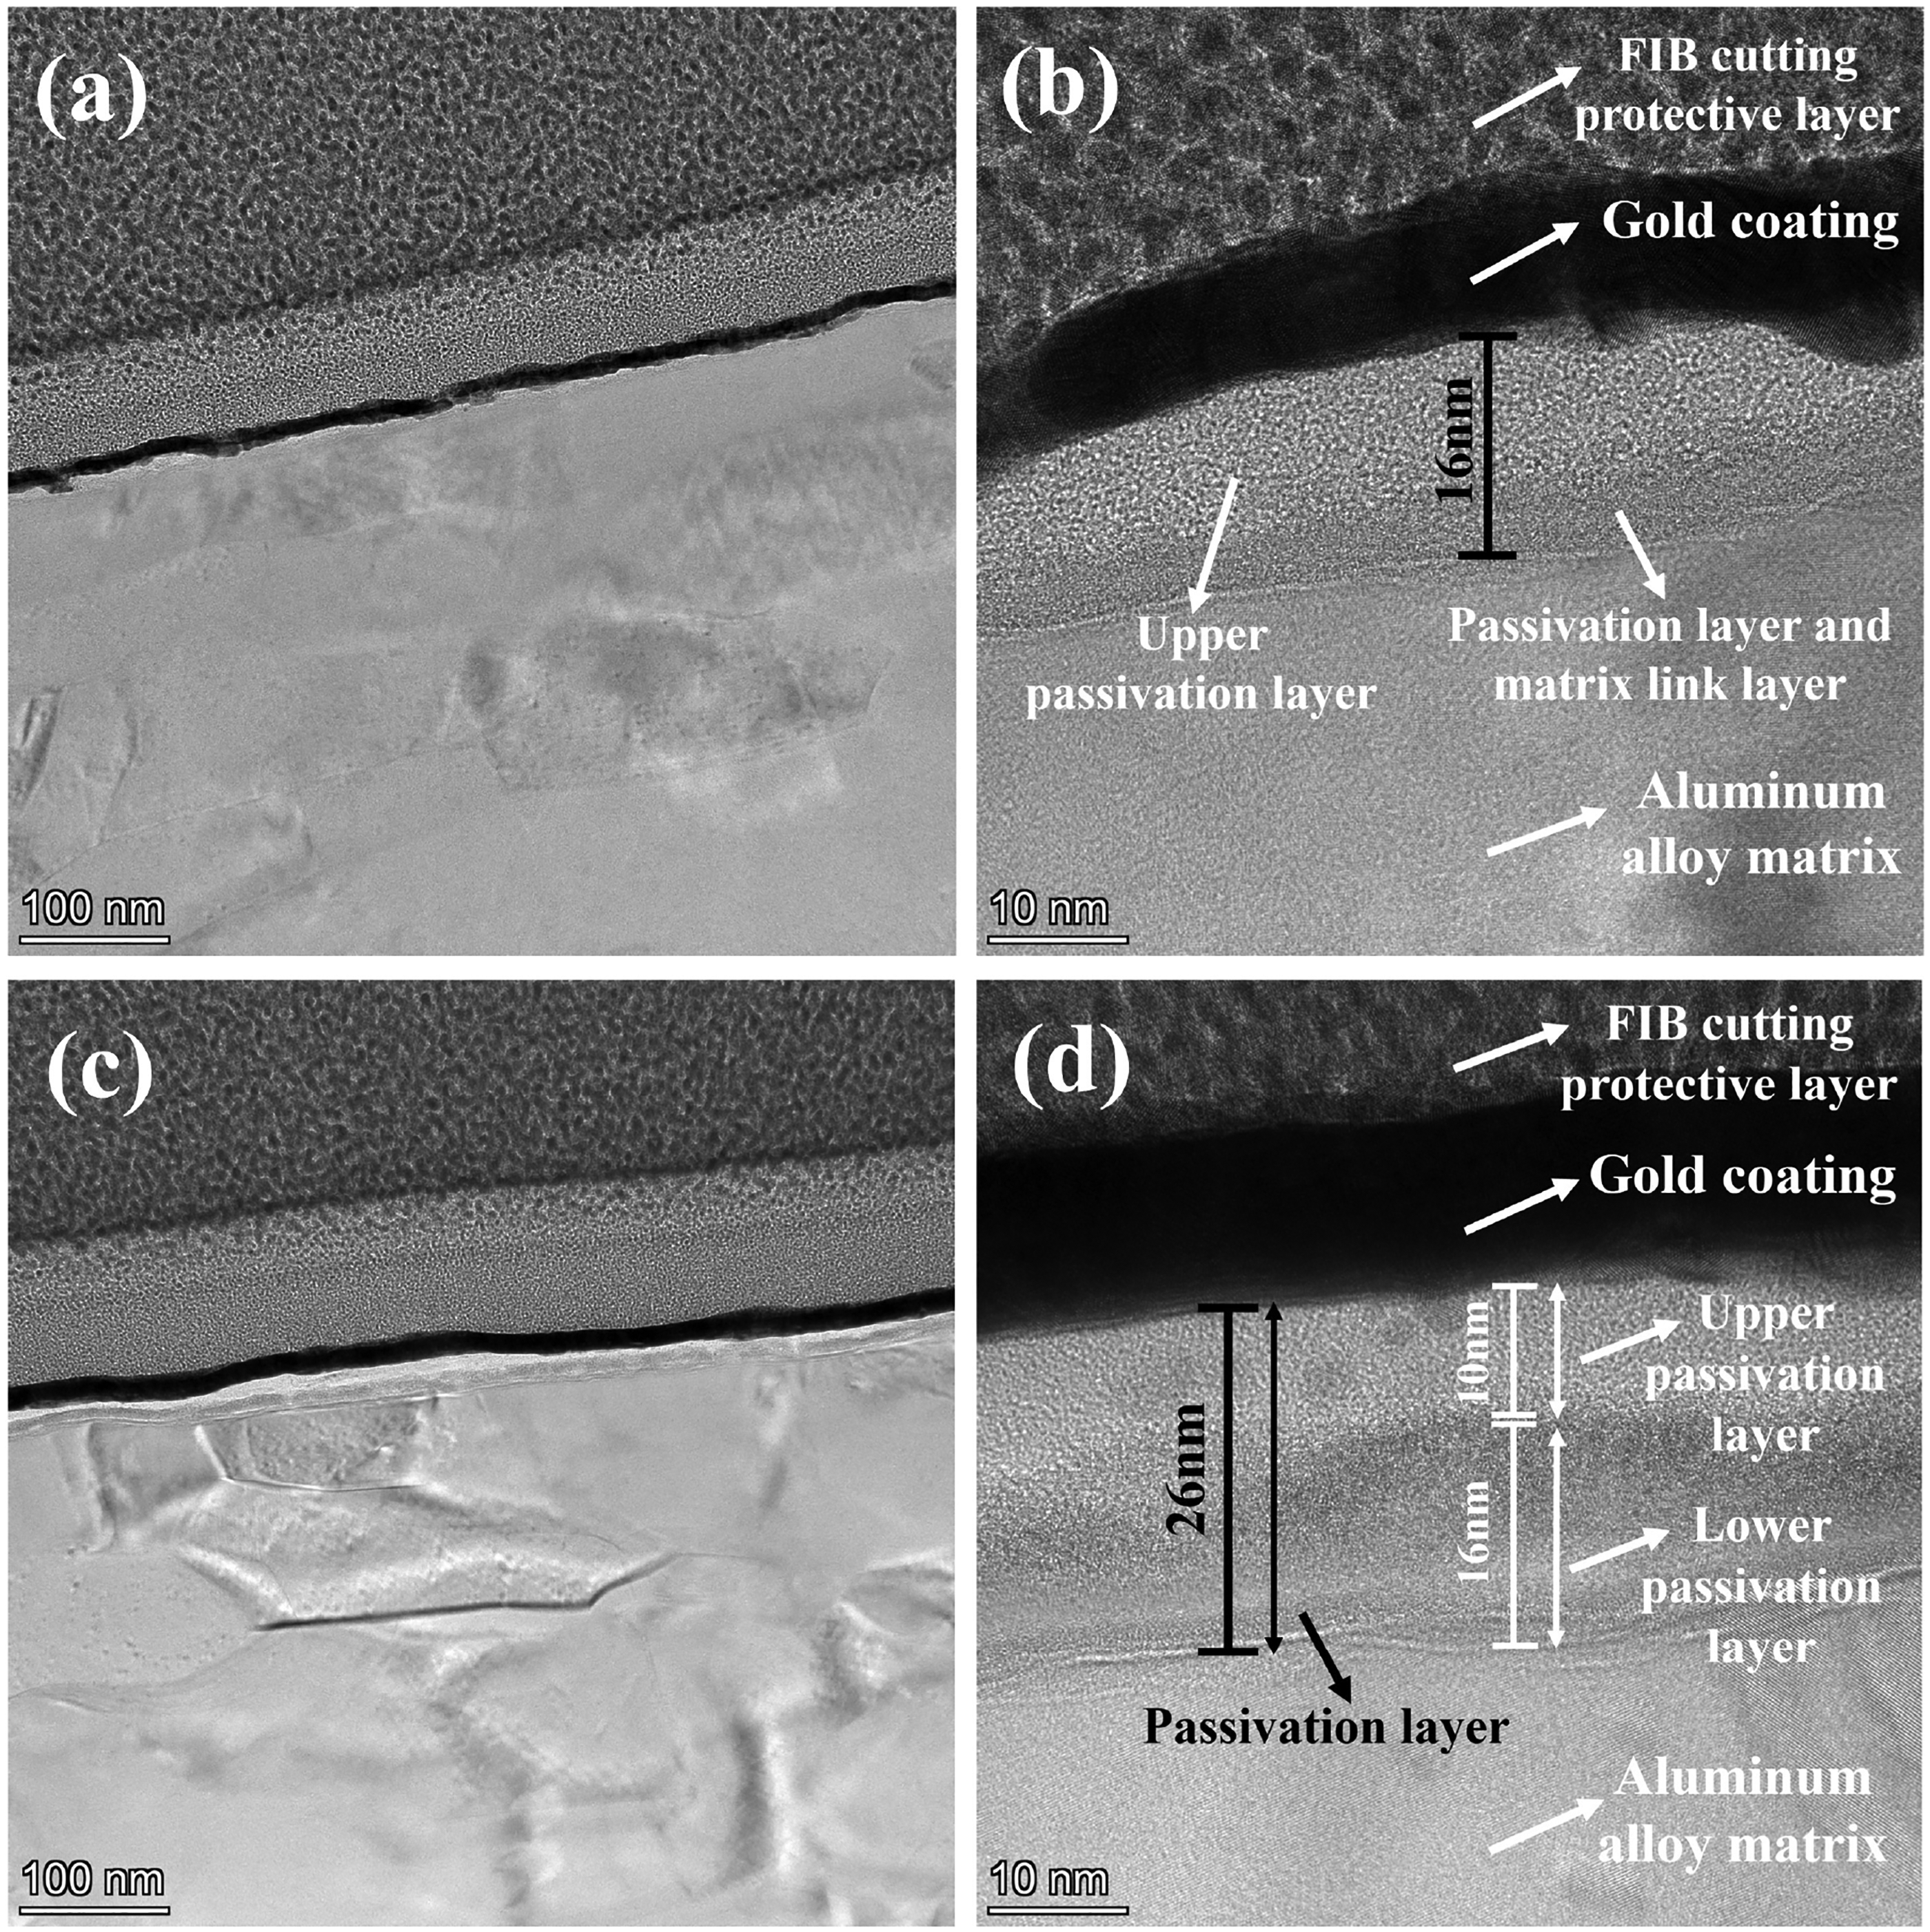
TEM cross-section of high-resolution passivation layer and element distribution. (a) the S1 sample, (b) the enlarged view of the S1 sample, (c) the S2 sample, (d) the enlarged view of the S2 sample.
Figure 3(a) shows the element distribution map of the S1 sample. The existence of a zirconium-enriched passivation layer was observed, while some Zr element can also be found in the protective gold coating. Fluorine (F) and oxygen (O) are also distinctly enriched within the passivation layer.

EDS energy spectrum analysis (a) the element distribution of the S1 sample, (b) the element distribution of the S2 samples.
Figure 2(c) shows a transmission electron microscopy photograph of specimen S2. Compared to S1, S2 samples clearly exhibit a layer of coating on the surface. Figure 2(d) shows an enlarged photograph of S2 samples. These images reveal a thick additional layer on the substrate, with most areas being around several tens of nanometers thick. The statistical analysis reveals an average passivation layer thickness of 26 nm, as illustrated. Additionally, the images indicate the presence of a boundary within the passivation layer. The passivation layer can be divided into the upper region (apart from the substrate) and the lower region (close to the substrate) based on element distribution. Quantitative characterization yields mean thicknesses of 10 nm for the upper passivation layer and 16 nm for the lower passivation layer.
Figure 3(b) shows the mapping images of S2 samples under high-resolution TEM. At the time of testing, carbon (C) accounts for half of the composition, mainly due to the accumulation of carbon during imaging or processing, so the actual proportion of elements may be lower. When the proportion of carbon is removed, the Zr element passivation layer is present, constituting 7% of the overall composition, and it can be divided into two layers. It was observed that the Zr element layer closer to the substrate is less than the layer farther from the substrate. The distribution of Al element decreases from the substrate towards the outer layer, while O element is most abundant at the interface of the passivation layer. Since the passivation solution is composed of a composite modification of silane coupling agents and zirconium dioxide, the Zr element layer close to the substrate forms Si-O-Al and Zr-O-Al bonds with the metal surface, ensuring a tight connection between the passivation layer and the substrate. As indicated by the EDS analysis in Figure 3(b), the upper passivation layer was primarily composed of silane coupling agents and zirconate systems enriched with O, N, and Zr elements, whereas the lower layer was predominantly constituted of aluminum, oxygen, and zirconium. The upper layer can also connect with other coatings.
Electrochemical analysis
Subsequently, EIS and Tafel tests were conducted on the original Al alloy substrate sample and the passivated samples prepared with solution S1 and S2, the results are shown in Figure 4. Each sample undergoes repeated electrochemical characterization, demonstrating good measurement repeatability.
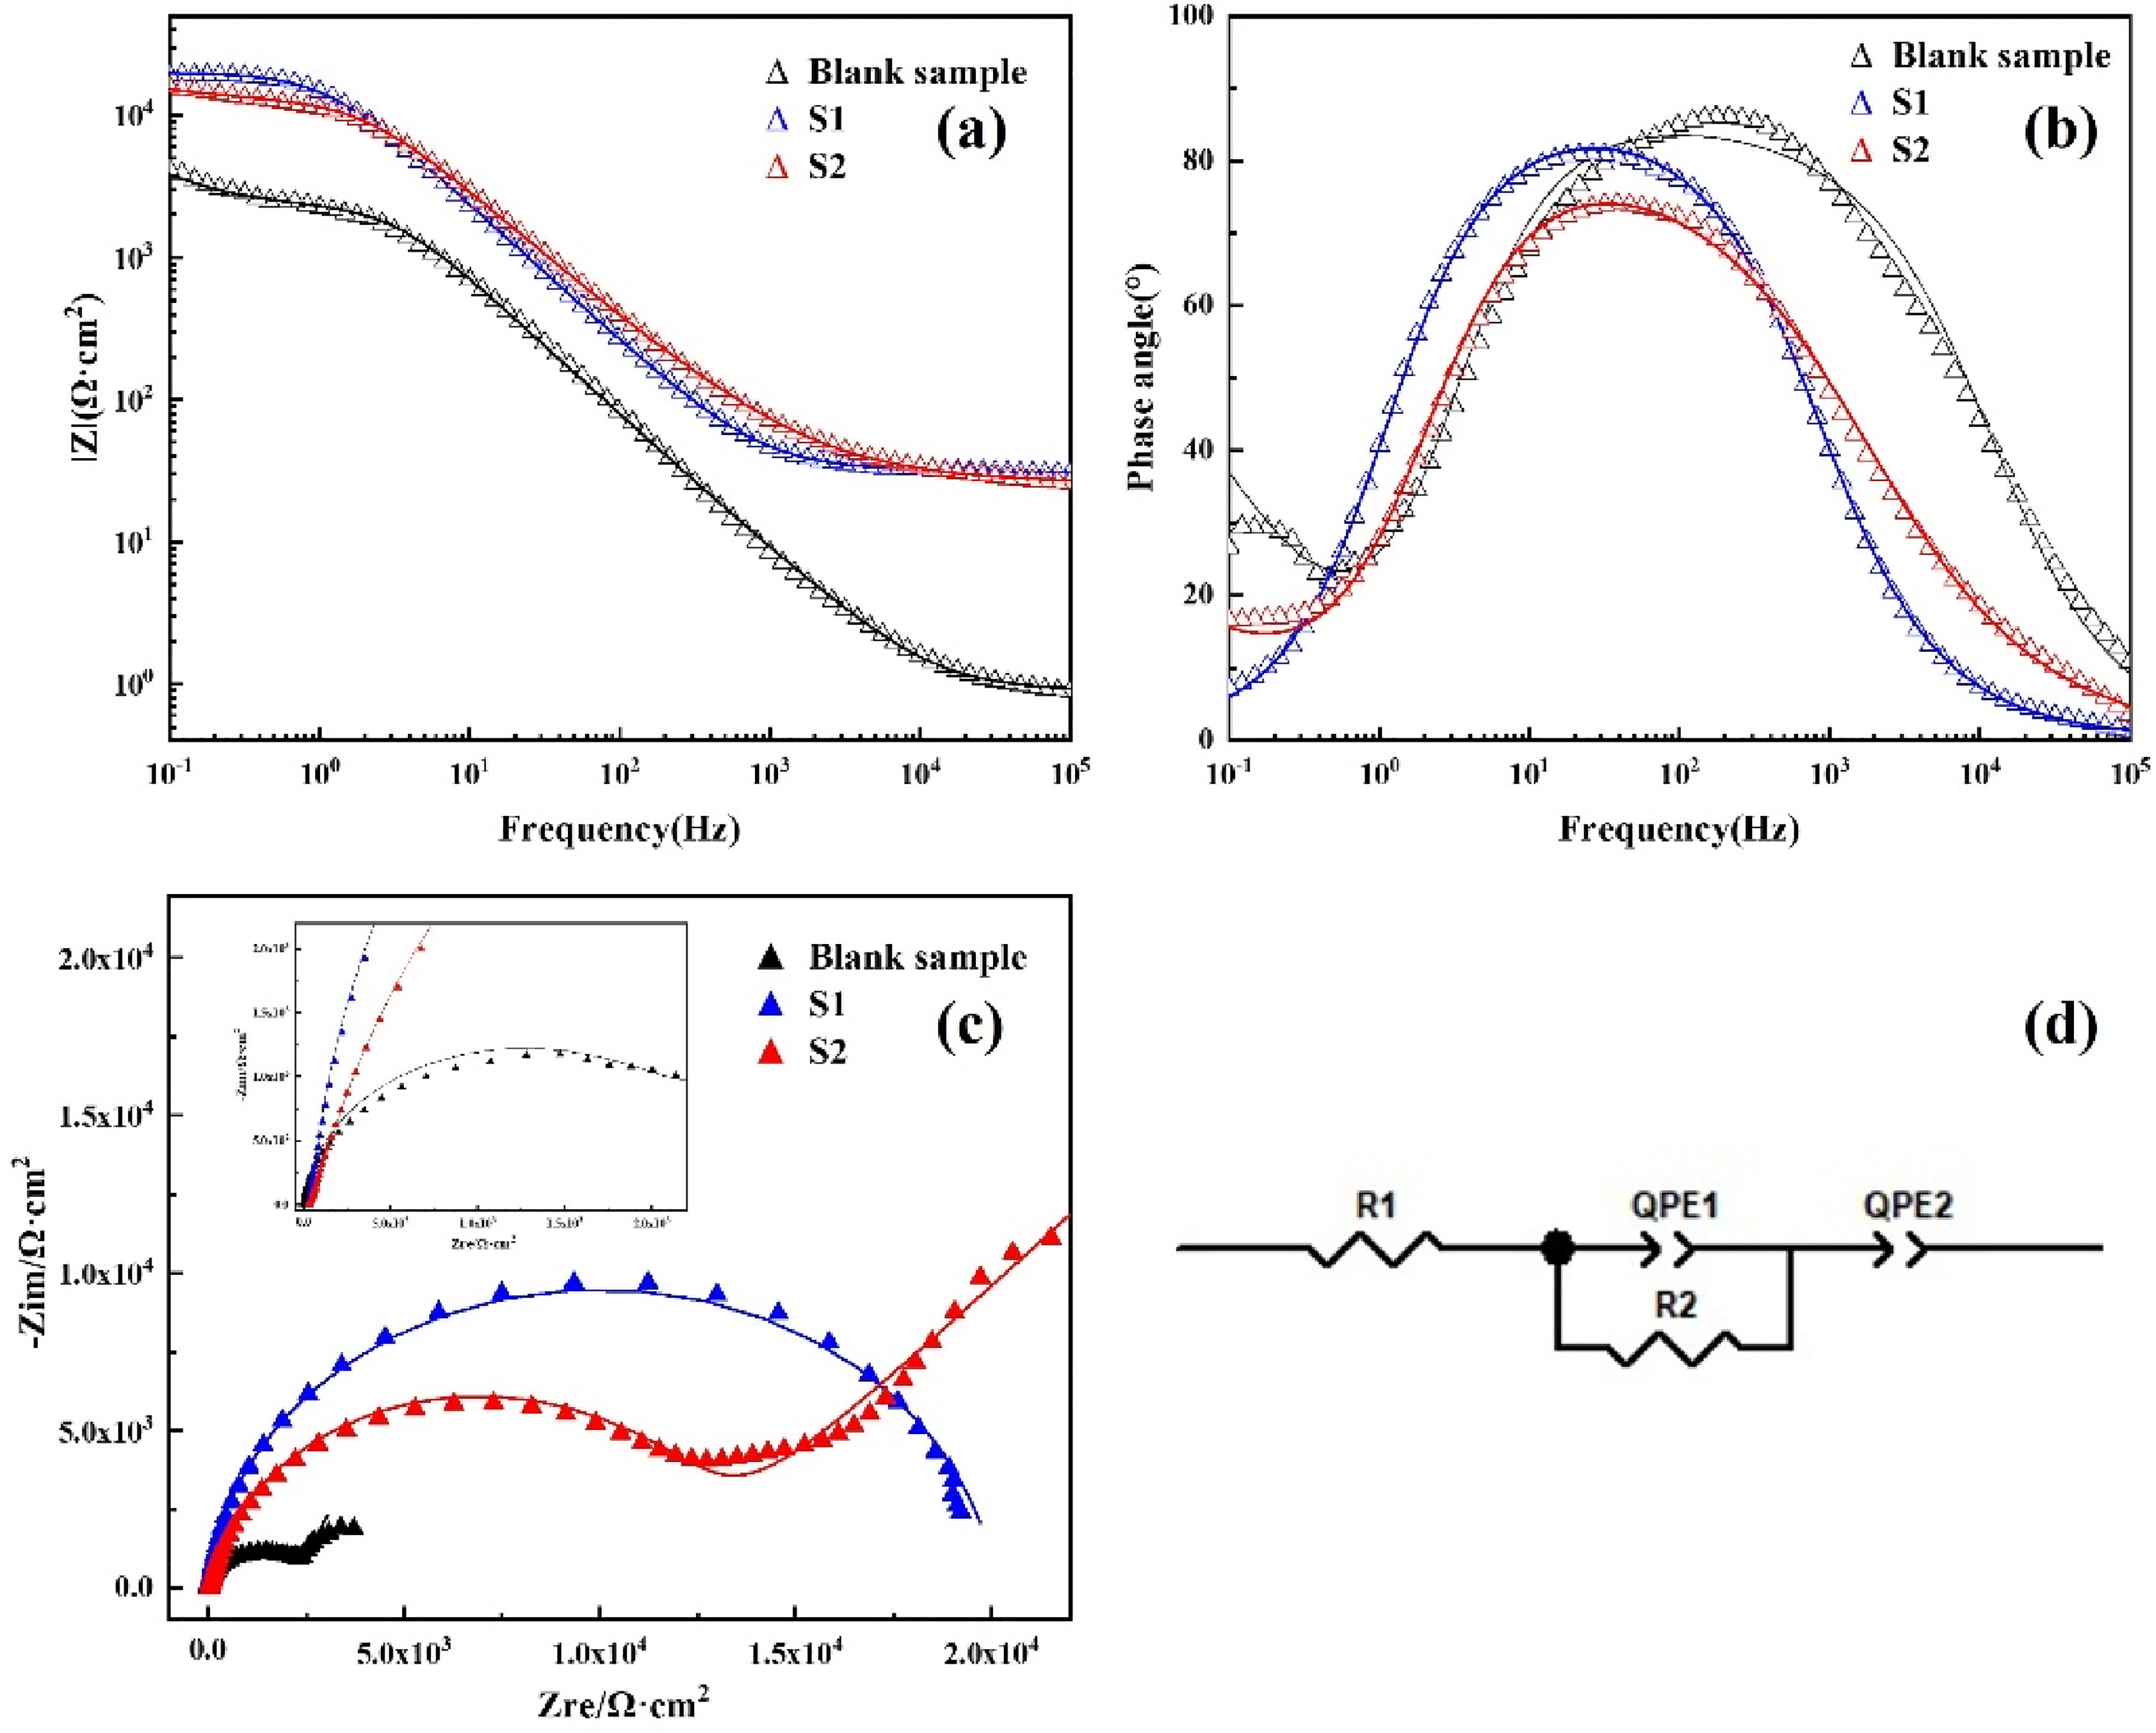
Electrochemical characterization (a) (b) bode diagram of electrochemical impedance, (c) nyquist diagram of electrochemical impedance, (d) the schematic model of the equivalent circuit.
Figure 4(a) and (b) present the Bode diagrams corresponding to three kinds of samples. The S1 and S2 samples exhibit distinct relaxation behaviors, corresponding to different physical processes. The electrochemical impedance spectrum of the S1 sample primarily exhibits one dominant time constant, which corresponds to a prominent peak in the mid-frequency region of the Bode phase angle plot. In coating/metal systems, a single dominant time constant located in the mid-frequency region typically corresponds to the charge transfer process occurring at the “metal substrate/electrolyte interface beneath the coating”, which is the relaxation of the corrosion reaction itself (anodic dissolution and cathodic reduction).25–27 Within the frequency range of 0.1 Hz to 100 kHz, the Nyquist plot for the S1 specimen predominantly exhibits a single dominant capacitive arc corresponding to the charge transfer process in the medium-frequency region; the low-frequency region does not fully enter the diffusion-controlled regime, and S1 primarily displays single time constant behavior.
The impedance response of the S2 sample is more complex; in the Bode phase angle plot, in addition to a mid-frequency peak similar to S1, an additional relaxation feature is observed in the lower frequency region. This indicates the presence of two distinguishable time constants. The mid-frequency stage is similar to S1 and physically corresponds primarily to the charge transfer process at the coating/metal interface. The emergence of the additional low-frequency relaxation, based on its frequency position, is typically associated with the transport process of corrosive ions (e.g., Cl−) from the electrolyte within the coating. This may be due to hindered diffusion of ions at the coating pores or interface, exhibiting characteristics similar to Warburg impedance.28,29
Three distinct domains are identified within the specimens. (1) High-frequency domain (1 kHz-100 kHz), both the S1 and S2 specimens demonstrate comparable impedance modulus (S1 and S2 ∼28 Ω cm2), the substrate manifests negligible impedance modulus (substrate ∼0.88 Ω·cm2) while all three specimens display phase angles approximating 0°, indicative of predominant electrolyte resistance characteristics. The elevated high-frequency impedance moduli observed for S1 and S2 passivated specimens relative to the substrate signify the passivation layer's charge-transfer inhibition mechanism via enhanced resistive and diminished capacitive properties, manifesting characteristic electrochemical signatures of effective passive film protection. (2) The mid-frequency regime exhibits a characteristic −1 slope in the Bode magnitude plot accompanied by phase angle maxima, the hallmark of capacitive interfacial processes. (3) Significant divergence in impedance moduli emerges within the low-frequency spectrum (0. 1–1 Hz) across the substrate, S1 and S2 specimens. The 0.1 Hz impedance magnitudes quantify as 4.16 × 10³ Ω·cm2 (substrate), 1.94 × 10⁴ Ω·cm2 (S1), and 2.42 × 10⁴ Ω·cm2 (S2), revealing orders-of-magnitude differences. The modified specimens (S1/S2) achieve remarkable corrosion resistance improvements over the substrate. Nevertheless, the performance differential between S1 and S2 remains statistically insignificant. Collectively, the corrosion protection efficacy ranks as: S1≈S2≫substrate.
The electrochemical impedance behavior is further visualized through Nyquist representations in Figure 4(c). While Bode magnitude plots show comparable low-frequency impedances for S1/S2, their Nyquist responses exhibit discernible variations in capacitive arc characteristics. The observation of dual time constants in the Nyquist spectra reveals two separate electrochemical processes or interfacial mechanisms within the system. The magnitude of the capacitive arc radius in Nyquist representations directly correlates with the coating's protective efficacy over the substrate. Nyquist plots in Figure 4(c) reveal pronounced differences in capacitive semicircles, with the substrate exhibiting a substantially diminished arc compared to the passivated specimens. Relative to S2, S1 manifests an expanded capacitive arc radius, indicative of better corrosion inhibition performance.
For deeper mechanistic insights, electrochemical impedance spectra were modeled via equivalent circuit analysis. The optimized circuit model is presented in Figure 4(d), circuit configurations (Figure 4(d)) comprise a series dual-CPE circuit. Each circuit element carries distinct physicochemical meaning: R1(Rs) corresponds to solution resistance, and R2(Rct) quantifies the cumulative charge-transfer resistance through the coating-substrate system. CPEs, parameterized by Q and n, capture the frequency-dependent non-ideality in interfacial capacitance. The n (0 ≤ n ≤ 1) governs CPE behavior: purely resistive (n = 0), ideal capacitive (n = 1), or diffusion-controlled Warburg response (n = 0.5). 30 Quantified circuit parameters obtained through numerical optimization are compiled in Table 1.
The fitted impedance parameters of substrate (blank sample), S1 and S2 samples.
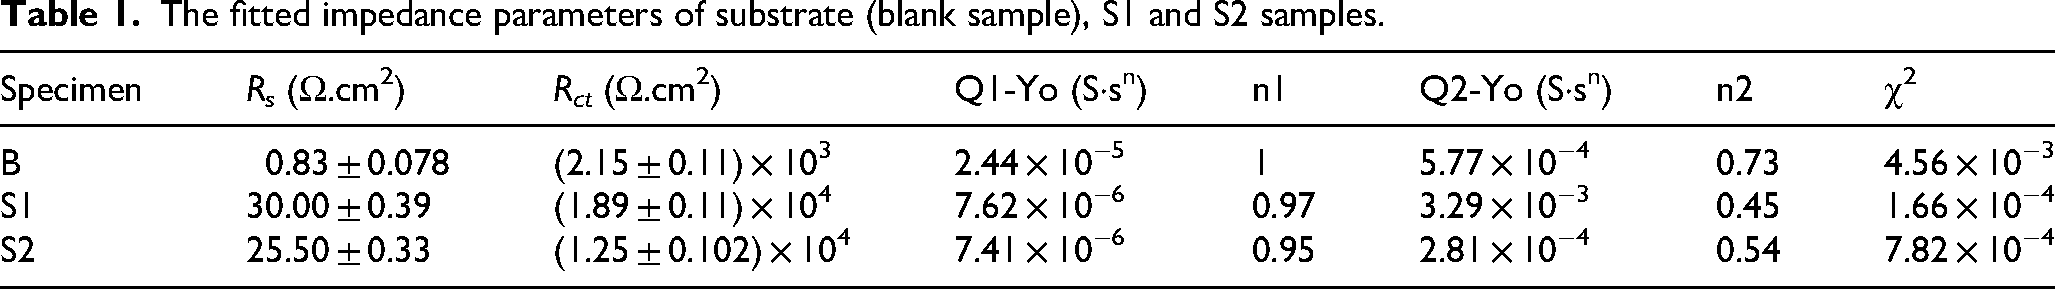
The χ2 values are 4.56 × 10⁻³, 1.66 × 10⁻⁴, and 7.82 × 10⁻⁴ for the three specimen groups, as tabulated in Table 1. These χ2 value (all <10−3) demonstrate exceptional congruence between the proposed model and empirical measurements. The minimal contribution of solution resistance Rs to the total impedance renders its influence insignificant. The maximal impedance values observed for S1 in Rct comparisons demonstrate its optimized corrosion protection performance.
Polarization curves were assessed, as depicted in Figure 5(a). In summary, the passivated samples demonstrated significantly better polarization behavior than the blank sample. By contrast, S1 and S2 exhibited polarization curves with analogous shapes, indicating that both materials shared a similar propensity for corrosion. The self-corrosion currents and corresponding error ranges derived from the polarization curves are illustrated in the subsequent graphical representation. Quantitative analysis reveals S1 achieves the most favorable corrosion performance, evidenced by its minimal self-corrosion current density (8.34 × 10⁻⁷ A·cm−2), which corresponds to the lowest corrosion rate among all specimens. S2 ranks second with a measured value of 1.297 × 10⁻⁶ A·cm−2. Comprehensive evaluation establishes the following corrosion resistance hierarchy: S1 demonstrates superior performance, followed by S2, with the bare A356 aluminum alloy without protection exhibiting the least favorable characteristics.
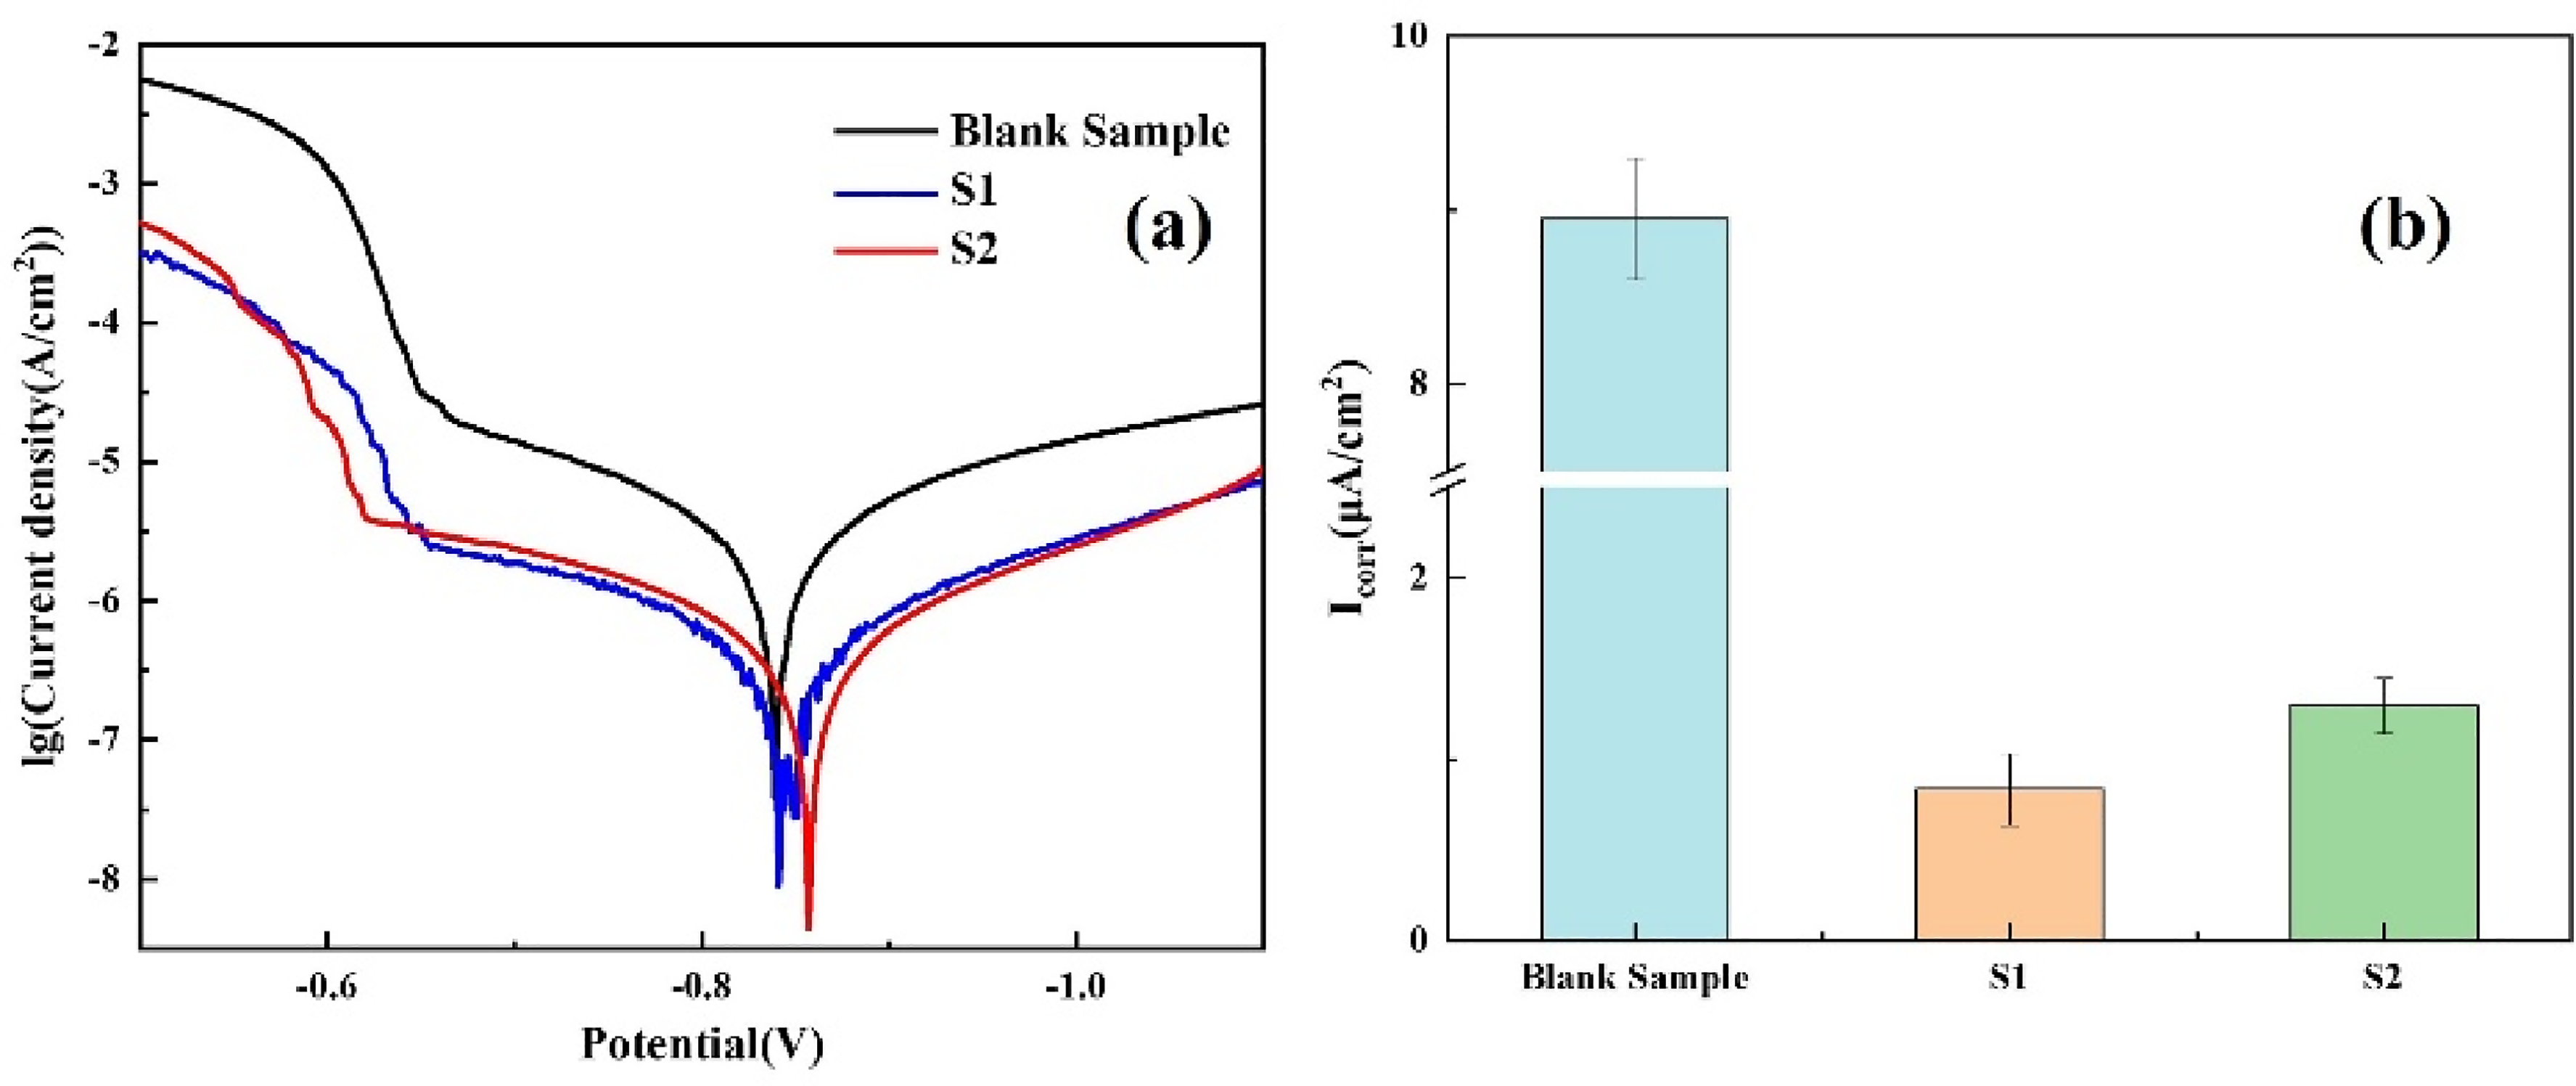
(a) electrochemical polarization curve (tafel) diagram, (b) the self-corrosion currents and error ranges for the three sample groups.
Discussion
The bonding mechanism between the passivation layer and the A356 Al alloy substrate during the passivation process was investigated. The bonding mechanism using passivation solution 1 is illustrated in Figure 6(a). When preparing the passivation solution, organic components are mixed with inorganic components, so there are inorganic parts, and organic-inorganic mixed parts in the passivation solution. These components are chemically bonded to the substrate through Al-O-Zr linkages.31,32 The TEM analysis of the S1 passivation layer revealed a relatively thin film with uneven thickness, reaching up to 16 nm. Despite its limited thickness, the passivation layer was nevertheless deduced to exhibit a distinct dual-layer configuration (Figure 2(b) and (d)). This structure was primarily attributed to the hybrid composition of the passivation solution, which combined zirconium salts and acrylic resin.
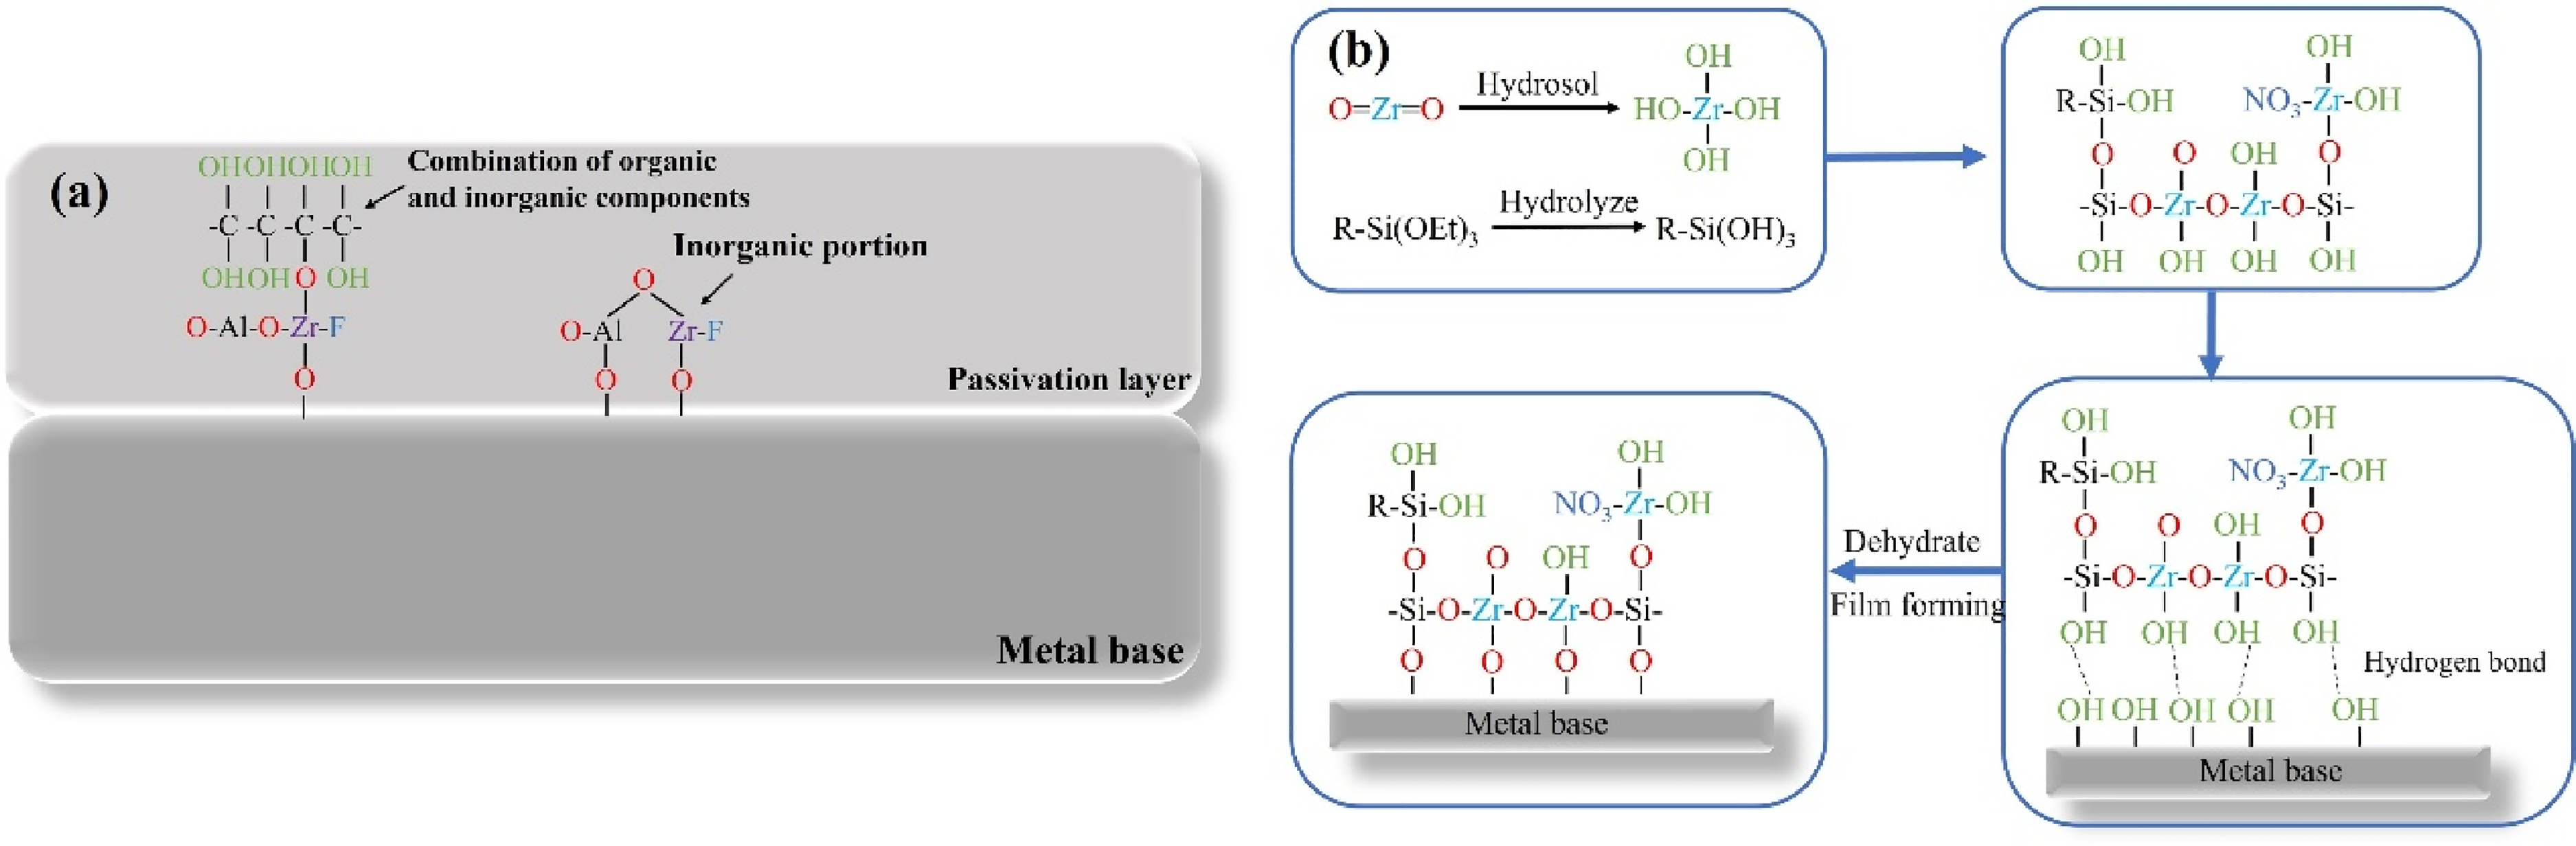
(a) illustration of the binding mechanism on the specimen passivated with solution 1, (b) illustration of the binding mechanism on the specimen passivated with solution 2.
The inner layer was rich in inorganic compounds such as Zr-O, Al–O–Zr, and possibly small amounts of Zr-F bonds, formed via direct chemical bonding between zirconium species and the aluminum substrate. This inner region served as the primary barrier, impeding the diffusion of corrosive ions and anchoring the coating to the metal. The outer layer was likely formed from partial condensation of zirconium-based complexes.
The addition of silane coupling agents is intended to modify both the passivation solution and the metal surface to improve their compatibility with materials. The structure of silane allows it to form Si-O-Me (where Me represents metal) chemical bonds with the metal surface.33–37 Additionally, the inclusion of zirconium components such as zirconium dioxide and zirconium fluoride allow for composite modification of the silane with the zirconium salt system, utilizing sol-gel technology for synergistic effects.15,17 Nano-sized gaseous ZrO2 is transformed into Zr(OH)4 by hydration and sol-gel technology, meanwhile, the ethoxy group in silane coupling agent is transformed into hydroxyl group by hydrolysis. The solution is sprayed on the surface of the substrate after mixing, and then dehydrated to form a film.
After dehydration and film formation, Si-O-Al and Zr-O-Al bonds are formed between the substrate and the passivation layer.38–40 This improves the interfacial chemical adhesion strength between the passivation layer and the metal, thereby making the bond more robust and stable, as shown in Figure 6(b).
The S2 passivation layer displayed a clearly defined dual-layered structure, with a total thickness of 26 nm (Figure 2(d)). The introduction of silane coupling agents, combined with zirconium fluoride and zirconium dioxide, enabled a more controlled sol-gel process. The inner layer, adjacent to the metal substrate, contained a high concentration of Zr, O, and Al. This layer served as the critical interface, forming strong chemical bonds and effectively isolating the substrate from corrosive environment. The outer layer showed a greater presence of silane-derived organic-inorganic hybrid moieties.
Together, the two layers acted synergistically: the inner layer provided dense protection and adhesion, while the outer layer improved environmental stability and coating compatibility with subsequent treatments. The improved electrochemical impedance response of S2 confirmed the functional superiority of this layered structure in long-term corrosion resistance.
Beyond zirconium, residual organic constituents—acrylic resin and silane coupling agents—also contribute to enhancing material corrosion resistance. The interfacial bonding between oxide coatings and polymers is widely recognized to involve both mechanical interlocking and chemical interactions. When positively charged metal atoms reside on the uppermost layer of the metal oxide, the charged heteroatoms of the polymer orient toward the oxide surface, resulting in enhanced electrostatic interactions between the oxide and the polymer. 41 These residual organic compounds simultaneously enhance the overall barrier effect of the material against corrosive species.
Conclusions
The silane coupling agent added in the passivation solution is more conducive to the formation of passivation layer. The passivation layers are bonded with the substrate in the form of chemical bonds such as aluminum-oxygen-zirconium bond, or aluminum-oxygen-silicon bond.
Compared to the bare A356 Al alloy substrate, the passivated sample reflected a corrosion-resistant coating architecture, suggesting improved long-term durability under sustained corrosive conditions. This enhancement was chiefly ascribed to its strong interfacial bond and the considerable thickness and structural integrity of the passivation layer.
The passivation layer exhibits a two-layer architecture comprising the upper section and the lower region. The upper passivation layer is rich in Si and N, while the lower layer is rich in Zr and O. The lower passivation layer bond tightly with the upper passivation layer and the substrate.
Footnotes
Acknowledgments
This work was supported by the National Natural Science Foundation of China [No. 42376209]; the Wenhai Program of the S&T Fund of Shandong Province for Pilot National Laboratory for Marine Science and Technology (Qingdao), China [No. 2021WHZZB2302]; the Provincial Natural Science Foundation of Shandong, China [No. ZR2023ME056].
Ethical approval and informed consent statement
This article does not contain any studies with human or animal participants.
Author contribution(s)
Funding
The authors disclosed receipt of the following financial support for the research, authorship, and/or publication of this article: This work was supported by the the Wenhai Program of the S&T Fund of Shandong Province for Pilot National Laboratory for Marine Science and Technology (Qingdao), China, the Provincial Natural Science Foundation of Shandong, China, the National Natural Science Foundation of China, (grant number No. 2021WHZZB2302, No. ZR2023ME056, No. 42376209).
Declaration of conflicting interests
The authors declared no potential conflicts of interest with respect to the research, authorship, and/or publication of this article.
Data availability
The data supporting the findings of this study are available upon request.