
Abstract
Although diverse political news has been recognized as a requirement for a well-functioning democracy, longitudinal research into this topic is sparse. In this article, we analyse the development of diversity in election coverage in the Netherlands between 1994 and 2012. We distinguish between diversity for party and issue coverage, and look at differences between diversity in newspapers and television news. Results show that news diversity varies over time. Diversity for party types increased over time. We found no clear trend for diversity of issue dimensions. Compared to newspapers, television news is more diverse for party types but less diverse on issue dimensions. The question concerning whether these findings are an indicator of structural bias is discussed.
Keywords
Introduction
Diversity in political news is highly valued in Western democracies. In his seminal work on media performance, McQuail (1992) argued that the value of diversity is deeply rooted in ‘the Western version of what counts as a modern society’, with a premium on ‘individualism, change, freedom of thought and of movement’ (p. 141). Diversity of political news is also desired from a normative perspective that favours democracy (Strömbäck, 2005). In an electoral democracy, politicians receive their mandate through free and open elections. This system therefore requires informed citizens who are able to vote for a party based on policy preferences (Strömbäck, 2005).
For most people, news media are the prime provider of political information. In order to inform citizens in an optimal way, the news media should report and comment on the complete range of performances, plans and policy alternatives of all parties and their politicians (Strömbäck, 2005). This means that the news media should be just as diverse as the political reality (Lau et al., 2008; Lau and Redlawsk, 1997). From this normative point of view, news coverage that is distorted (i.e. non-diverse) is a serious problem for a democratic system. As the media can influence voting behaviour (Farnsworth and Lichter, 2006; Kiousis et al., 2006; Kleinnijenhuis et al., 2007), bias towards a political party or ideology will hamper people’s ability to cast a ‘well informed’ vote. This means that the level of diversity in the news and the absence of bias can be regarded as indicators for the quality of democracy.
In this article, we want to shed light on the developments of news diversity over time, and investigate whether these developments show traces of bias. This is an important question since there is little comparative research over time (Hopmann et al., 2012). As elections are at the core of electoral democracies, we will focus on political news during election campaigns. We will use data from two decades of election studies in the Netherlands, encompassing seven Parliamentary elections. Our research question reads as follows: How did the diversity of the Dutch political news in newspapers and television news programmes develop during the national election campaigns from 1994 to 2012?
Evaluating diversity of political news
If diversity is an indicator of the quality of democracy, by which standards should it be evaluated? Diversity refers to the variety in offer that is presented in the news as well as to the way this offer reflects political reality. The diversity in offer in the news can be measured both on the level of the media system as a whole (horizontal diversity) and on the individual media level (vertical diversity) (Hellman, 2001). In the definition of Hallin and Mancini (2004), vertical diversity means ‘the extent to which media outlets avoid institutional ties to political groups and attempt to maintain neutrality and “balance” in their content’ (p. 29). Horizontal diversity, on the other hand, refers to the choice of content by all media outlets within the media system in a given time period (Hellman, 2001). Either type of diversity will work in favour of a representative democracy, which makes it important to consider both types.
There are different norms to evaluate the way news coverage reflects diversity of political reality. Van der Wurff and Van Cuilenburg (2001) distinguished between open diversity and reflective diversity. According to the norm of open diversity, attention should be equally distributed over all parties that compete in the elections as well as all political issues that are raised. Reflective diversity requires that the diversity in the news should reflect the diversity of political actors or political issues outside the media environment. A straightforward reflective norm for political actors could be the power base in the political system (Hopmann et al., 2012). In this study, we focus on both open and reflective diversity with respect to the political parties involved. The reflective norm for diversity of political issues can be derived from the attention that these political actors pay to different ideological issues. However, there is no simple way to determine the attention from political parties for ideological issues, apart from news attention. Therefore, in this study, we only look at open diversity when it concerns issue coverage.
Diversity and distortion of diversity in the news
One concept often used to denote non-diverse coverage is bias, ‘a systematic tendency to favour … one side or position over another’ (McQuail, 1992: 191). Biased coverage misinforms voters and hampers them in coming to a ‘well informed vote’. Aside from unbalanced coverage of political parties, bias can also apply to coverage of political issues. This is the case when media consistently over- or under-represent the issues owned by certain parties or the issues central to a particular political ideology.
As for types of bias, we can distinguish between bias that is intentional – partisan bias – and bias that is unintentional – structural bias (Van Dalen, 2012). Partisan bias implies that it is the choice of journalists or editors to favour one political party over another. It will therefore most likely be found on the level of individual news media instead of in the media system as a whole. In a formerly pillarized society like the Netherlands (Lijphart, 1968), partisan media used to dominate the media landscape, showing preferences for those parties and their issues that the medium was linked to. Due to secularization and individualization, most media took leave of their partisan ties after the 1970s. Still, as Takens et al. (2010) showed, traces of this partisanship were found in the news as recently as in the 2006 Parliamentary Election. Nevertheless, we do not expect these small traces of partisan bias to have great explanatory value for trends in diversity of political news.
Structural bias is unintentional and caused by media routines or journalistic preferences for a certain type of news story, which lead the media attention away from an optimal open or reflective diverse coverage of politics (Van Dalen, 2012: 34). The cause of structural bias thus lies in the production process of news, in the mechanisms that news media develop in order to meet the daily demands of publishing (Cook, 2006; Shoemaker and Reese, 1996).
Structural bias plays a role in the process of selecting political parties and issues to cover in the news, a process guided by news values (Galtung and Ruge, 1965; Harcup and O’Neill, 2001). Eilders (2006) summarized the findings of decades of news value research in a few general categories of news factors in journalistic selection: relevance/reach, damage/controversy/aggression/conflict, elite persons/prominence and continuity (p. 11). Elite persons/prominence, relevance/reach and continuity will result in an over-representation of parties that hold power. Parties in the ruling government will generally score higher on these criteria and are thus more likely to be selected as news. Research shows indeed that formal power during the decision-making process influences the amount of news coverage (Hopmann et al., 2012). Perspectives originating in non-coalition circles are only reported when there is a strong opposition towards the governmental policy (Bennett et al., 2007). In the same vein, a Danish study found a relationship between incumbency bonus and political power: governments that were expected to win the elections received a larger incumbency bonus than governments whose power was balanced by a strong opposition (Hopmann et al., 2012). Therefore, we perceive an over-representation of government parties in the news as an indicator for structural bias.
The political system in the Netherlands is that of a multiparty system with proportional representation and an electoral threshold of only 0.67%. As such, it is common for 10 parties or more to be represented in Parliament. We will therefore need to reduce the number of political parties to a limited number of meaningful categories in order to compare diversity over time. The first distinction we make is between parties that hold power – in the case of the Netherlands, there is always a coalition of several parties in power – and opposition parties. In the Dutch context, we further have to distinguish between opposition parties and structural opposition parties. Structural opposition parties never took part in a coalition government. Therefore, the potential power of opposition parties is higher than that of structural opposition parties. Finally, the political system in the Netherlands is so open that new parties can enter Parliament relatively easily. New parties have the potential to change the power balance.
In selecting political issues, journalists will attune to the same general categories of news values as for the selection of political actors. So issues that score high on relevance/reach, damage/controversy/aggression/conflict and continuity are more likely to be selected. Political issues that are addressed by elite parties are seen as more important and more relevant than those addressed by others. Castells (2009) argues that the political elite, with their access to knowledge and the ability to make choices with significant consequences for society, possesses a political vantage point that makes their stories more newsworthy for the journalists than other societal actors.
In order to discuss news diversity of political issues, we must find a meaningful categorization of political issues. Traditionally, political competition has been oriented along cleavages in society towards the left–right (Lipset and Rokkan, 1967), focussing on economic issues such as employment, taxation, wages and the development of the welfare state (Aarts and Thomassen, 2008: 203; Pellikaan et al., 2007: 287–288). However, during the last two decades, other cleavages emerged (Caramani, 2008: 325–327). During the 1990s, politics focussed on a divide of conservative–orthodox positions versus more progressive and permissive stances of citizens. Across Europe, Kriesi et al. (2006) also found a globalization cleavage, dividing those who favour cultural liberalism from those who favour restrictive immigration policies (Caramani, 2008: 326). In the Netherlands, earlier studies show an increased number of political dimensions (Middendorp, 1989; Pellikaan et al., 2007). In this, we categorize all possible issues news into five dimensions and look how media attention increases or decreases:
The traditional social–economic division between left and right;
Green versus grey, focussing on a priority for the environment versus a focus on infrastructural projects when thinking of economic progress;
National versus global – this dimension deals with the question of whether the political focus is national or global;
Progressive versus conservative, where the position of the individual is posited opposite that of the collective (minority rights, medical–ethical questions and privacy versus the threat of terrorism);
Consensus issues: issues that can count on general support (economic growth, full employment) or on general rejection (crime).
Trends in political news coverage
In the last two decades, a process of mediatization has changed the relationship between politics and the media. In the words of Hjarvard (2008) ‘the media have become integrated into the operations of other social institutions, while they also have acquired the status of social institutions in their own right’ (p. 113). As a result of this increasingly powerful position, the media are more likely to follow their own logic over a political logic or a democratic logic (Brants and Van Praag, 2006). This, in turn, increases the chance of structural bias occurring.
The media logic thesis refers to the media’s ‘way of interpreting and covering social, cultural, and political phenomena’ (Strömbäck and Dimitrova, 2011: 33) that fits the media’s own values and formats and dominates the form and content of the news ever more strongly. Parties, politicians and issues that are mediagenic are likely to gain from this situation, while the others will lose out.
For politicians, mediatization means that media attention is increasingly important as well as something to actively struggle for, given its influence on electoral outcomes. Those politicians with the most power will be in the best bargaining position in this process, and as a result, appear in the media even more prominently (Van Aelst et al., 2010). These developments predict an increased attention for powerful parties (i.e. coalition parties and opposition parties) over structural opposition parties and new parties. As mediatization is an ongoing process, media attention will tend to concentrate more and more on the powerful political actors highest in news value, meaning that vertical diversity would decrease. Our hypothesis therefore reads as follows:
H1. Over time, news media will increasingly show traces of structural bias, that is, the over-representation of government parties in the news will increase over time.
Being part of the same media system, and fighting against the same tendencies of commercialization and competition, both newspapers and television news programmes show tendencies of media logic in their news coverage (Strömbäck and Van Aelst, 2010). Kriesi (2012) compared the degree of personalized coverage in various media and found ‘quite similar’ results for both newspapers and television news programmes (p. 7). In their study, Strömbäck and Van Aelst (2010) did not find any differences between newspapers and television with respect to the framing of the political news. Investigating three characteristics of news coverage indicating media logic, personalization, contest and negativity, Takens et al. (2013) did find some small differences between newspapers and television news coverage. Television broadcasters pay more attention than newspapers to individual politicians and party leaders, while they pay less attention to contest news and are less negative. She concluded that there are different logics: one logic guiding television news journalists, and a slightly different logic guiding newspaper journalists. The research question therefore, is formulated as follows:
RQ. Is there a difference in diversity between newspapers and television news?
Method
Selection of time period of election campaigns
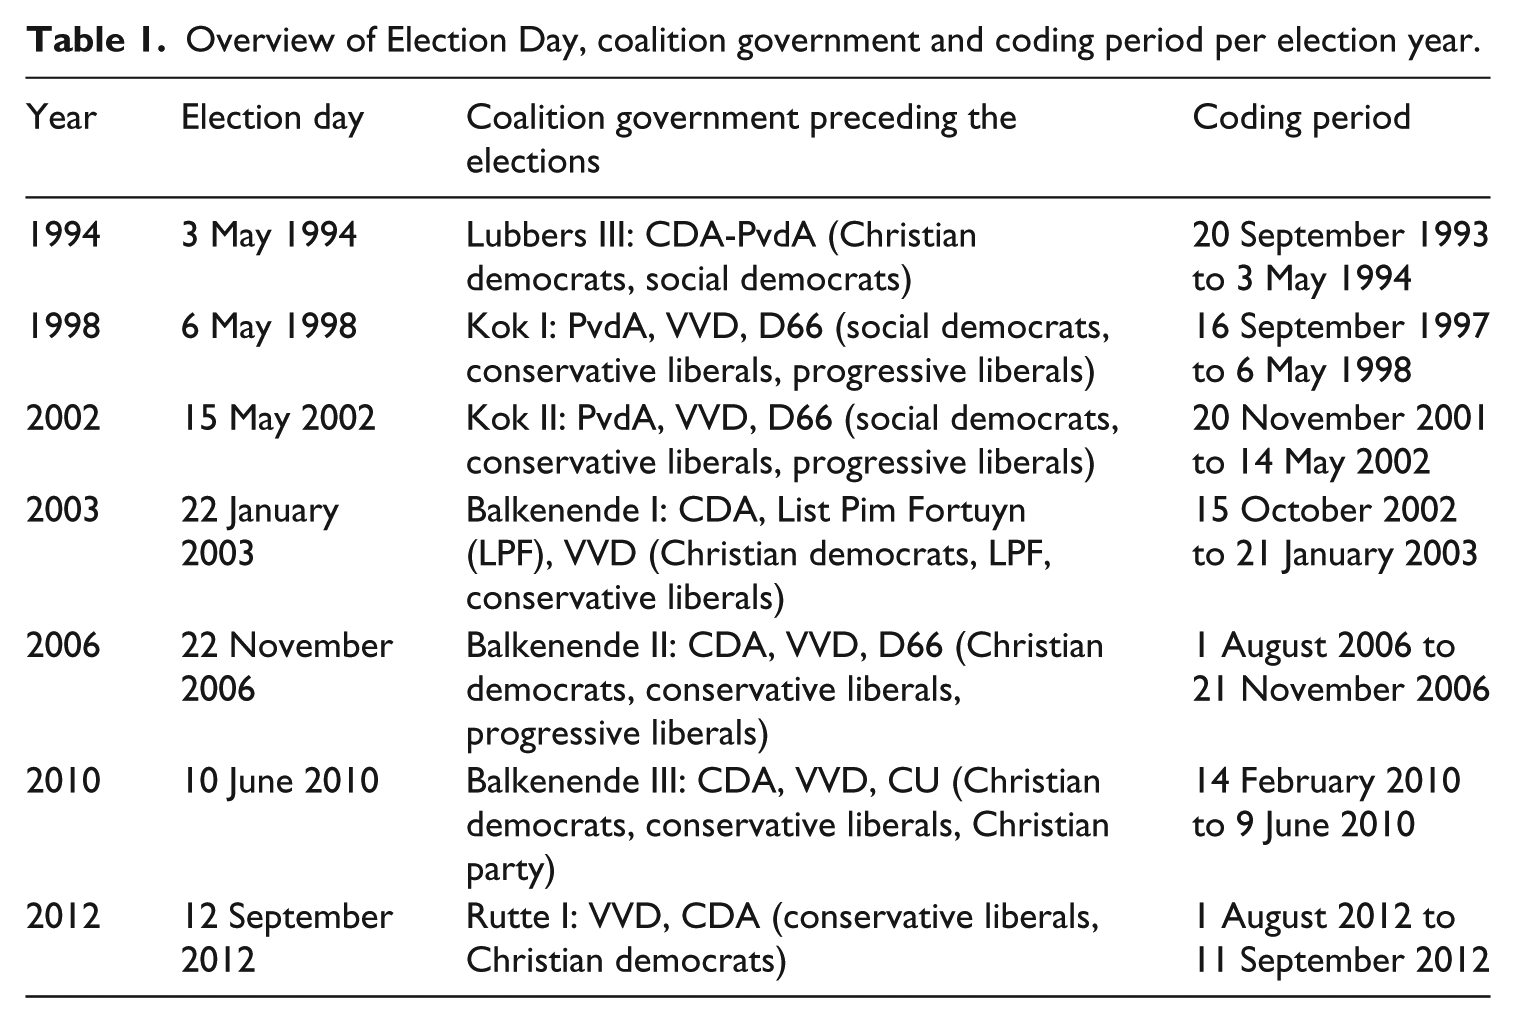
During all Dutch national election campaigns from 1994, diversity of political news coverage in newspaper articles and television news programmes were measured by means of content analysis. The selected period under study varied per election year according to the political situation at hand and funding possibilities. Table 1 shows an overview of the Election Days, the political parties that were members of a coalition government prior to the elections, and the coding period for each election campaign covered by our research. Each newspaper article and news item mentioning a party name, a politician or a political issue was analysed using manual coding by intensively trained coders.
Overview of Election Day, coalition government and coding period per election year.
Semantic network analysis
We used content analysis data that were gathered in the context of Dutch election studies performed at the VU University Amsterdam since 1994. The specific content analysis method that was applied in these studies is called the Network analysis of Evaluative Texts (NET) method (Van Cuilenburg et al., 1986), a method for Semantic Network Analysis (SNA) (Krippendorff, 2004). This method converts the text published in political news into a network of relations between objects such as actors and issues that represents the original news text as closely as possible (Van Atteveldt, 2008: 188). The coded bundle of objects can be rearranged in different network structures to make the analysis of different research questions possible. The big advantage of this method therefore is that it generates data that are also ideal for secondary analysis.
The coding of the news text starts with first identifying the objects and then identifying the relation between the objects (for this particular study, we used only the identification of the objects, not the relation between the objects). The recording unit is the nuclear sentence. A nuclear sentence represents a relation between two so-called ‘knowledge objects’: actors or issues that occur in the text. Each grammatical sentence can thus contain one or more nuclear sentences. Coding starts with identifying the knowledge objects from an ontology of predefined knowledge objects. In this ontology, actors and issues are structured hierarchically in a way that best represents the domain under investigation (in this case, election coverage). For more information about the NET method, see Van Atteveldt (2008).
The ontology that was used in the Dutch election studies represents all actors and issues that are mentioned within the context of Dutch politics. The list of objects is structured hierarchically from abstract, general knowledge objects (e.g. ‘infrastructure’, ‘government’) at the highest level to more concrete, specific objects (e.g., ‘road pricing’, ‘Balkenende’) at the lower level. The actors in the ontology include, among others, all Members of Parliament and Government grouped by party. The issues include all central issues in Dutch politics, for instance, ‘strike’, categorized into overarching categories, ‘employees’ interests’, and into a pole of an issue dimension, ‘left’ from the left–right dimension, for example. Table 3 in Appendix 1 gives an overview of the attention for the top three overarching categories of issues in each pole of the five issue dimensions (left–right, green–grey, national–global, progressive–conservative and consensus issues). The ontology that was used in the Dutch election studies between 1994 and 2012 contained a total of almost 2000 different knowledge objects.
Selection of news material
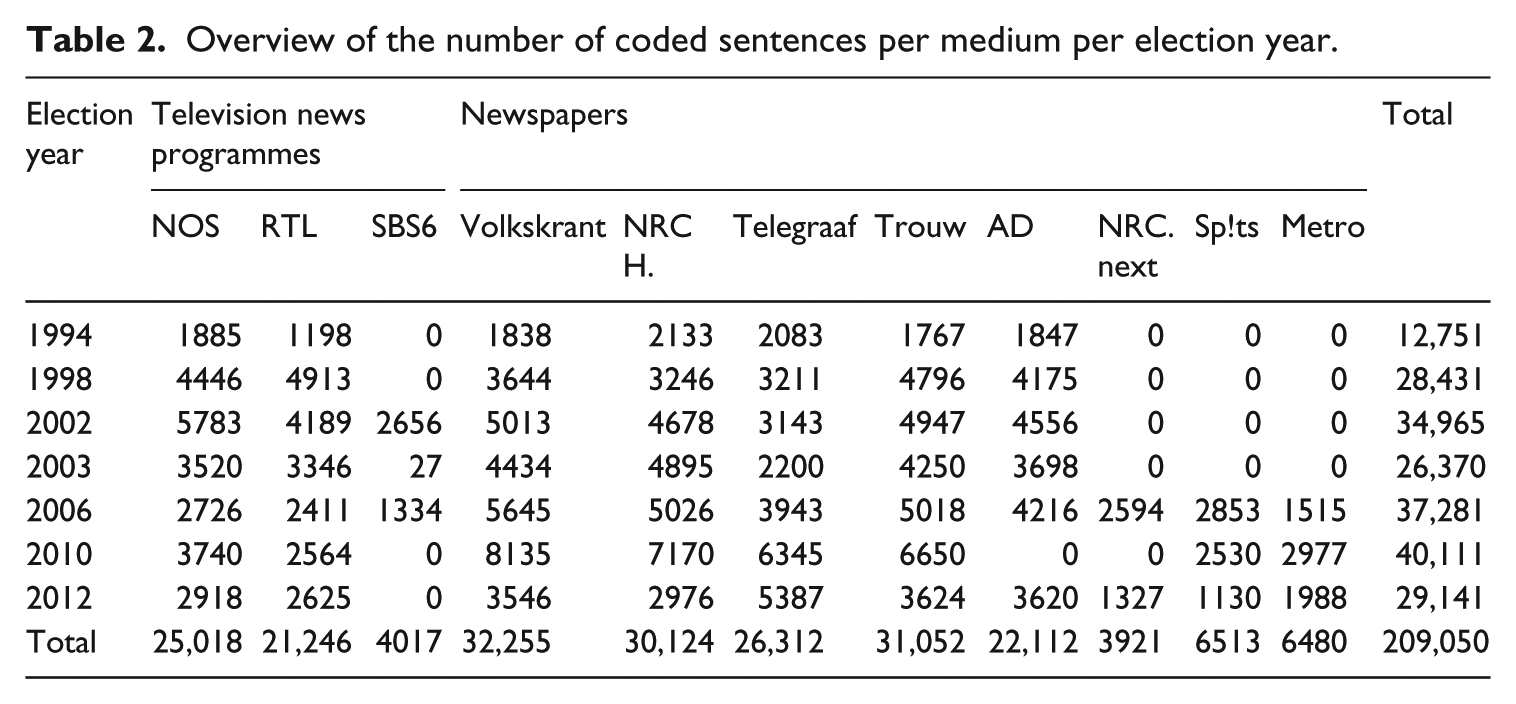
For newspaper articles, headline and lead were coded. In 1994, 1998 and 2002, television news items were coded in their entirety. From 2003 onwards, we restricted the coding of the television items to the introduction by the news anchor and the text of political commentators of the television news items. In all years under study, we selected the main news bulletin of the public broadcaster NOS and the commercial broadcaster RTL. In 2002 and 2006, we also included the news programme from a second commercial broadcaster SBS6. For the newspapers, we selected general newspapers with a national circulation. From 2006 onwards, we also included free dailies. Table 2 provides an overview of the number of coded nuclear sentences per medium per election year.
Overview of the number of coded sentences per medium per election year.
The data were coded during and right after the respective elections by a group of intensively trained coders. Reliability was assessed based on 128 articles from the 2010 elections coded by the four coders who together coded more than 60% of articles in the election. Krippendorff’s alpha for interval variables on the number of mentions per article of party type was .85, while for issue dimension this was .75, which we consider acceptable (cf. Lombard et al., 2002: 593). Since the same training and procedure were used in the other campaigns, reliability should be similar, but see Kleinnijenhuis et al. (2006) and Takens et al. (2010) for a detailed description of the reliability of the 2002–2006 campaigns.
Operationalization of news variables
The amount of attention paid to political parties in the news was measured by counting the number of nuclear sentences with a political party or any of its politicians in the nuclear sentence. The political parties were sorted into four categories. Coalition parties contained all parties that formed the coalition government prior to the election (see Table 1 for an overview of which parties belonged to the coalition government in which election year). New parties were defined as those parties that gained seats in Parliament for the first time in this year’s election or in the previous election. Structural opposition parties are those parties that never took part in a coalition government. All other parties were considered opposition parties.
Attention to issue dimensions was measured by counting the number of nuclear sentences with an issue belonging to the issue dimension category. Each issue in the ontology is placed under one of the poles of the five issue dimensions.
To assess the diversity of news coverage of political parties and issues dimensions during the Dutch general election campaigns from 1994 to 2012, we used the concepts vertical diversity and horizontal diversity as described by Hellman (2001). Vertical and horizontal diversity for both political actors and issue dimensions are evaluated by means of the norm of open diversity.
Vertical diversity with regard to party and issue dimension coverage was measured by calculating the entropy in number equivalents, a measure of open diversity indicating the number of parties or number of issues dimensions which receive a substantial and equivalent amount of attention in a group of news media (television versus newspapers) (Kleinnijenhuis, 2003). 1 The advantage of this measure is that it can be interpreted intuitively, as it represents the number of parties across which a newspaper distributes its attention (Takens et al., 2010). This means that diversity reaches its optimal level when the attention is distributed equally among all categories. With four categories of political actors, actor diversity can range from one through four. Likewise, with five dimensions of political issues, issue diversity can range from one through five.
Horizontal diversity was measured by calculating the entropy in number equivalents across all groups of news media. 2 This open diversity measure is based on the proportion of the total amount of attention that each of the parties or issues received across news media. Because of the differences in the attention distribution between news media, the level of horizontal diversity does not automatically equal the average level of vertical diversity of the individual news media. If, for example, half of the news media paid equal attention to five issue dimensions, while the other half of the news media paid equal attention to five different issue dimensions, the level of vertical diversity would equal five, while the level of horizontal diversity would equal 10. So, horizontal diversity represents the number of parties or issues receiving a substantial and equivalent amount of attention within the news media system as a whole.
Horizontal diversity of party types is also evaluated in terms of a reflective norm. This is done by comparing the relative news attention for each party type with the relative power base of these parties in Parliament prior to the elections.
Results
We will first describe the attention for party types (Figure 1a) and issue dimensions (Figure 1b) in the news over the past two decades, before testing the hypothesis and answering the research questions.
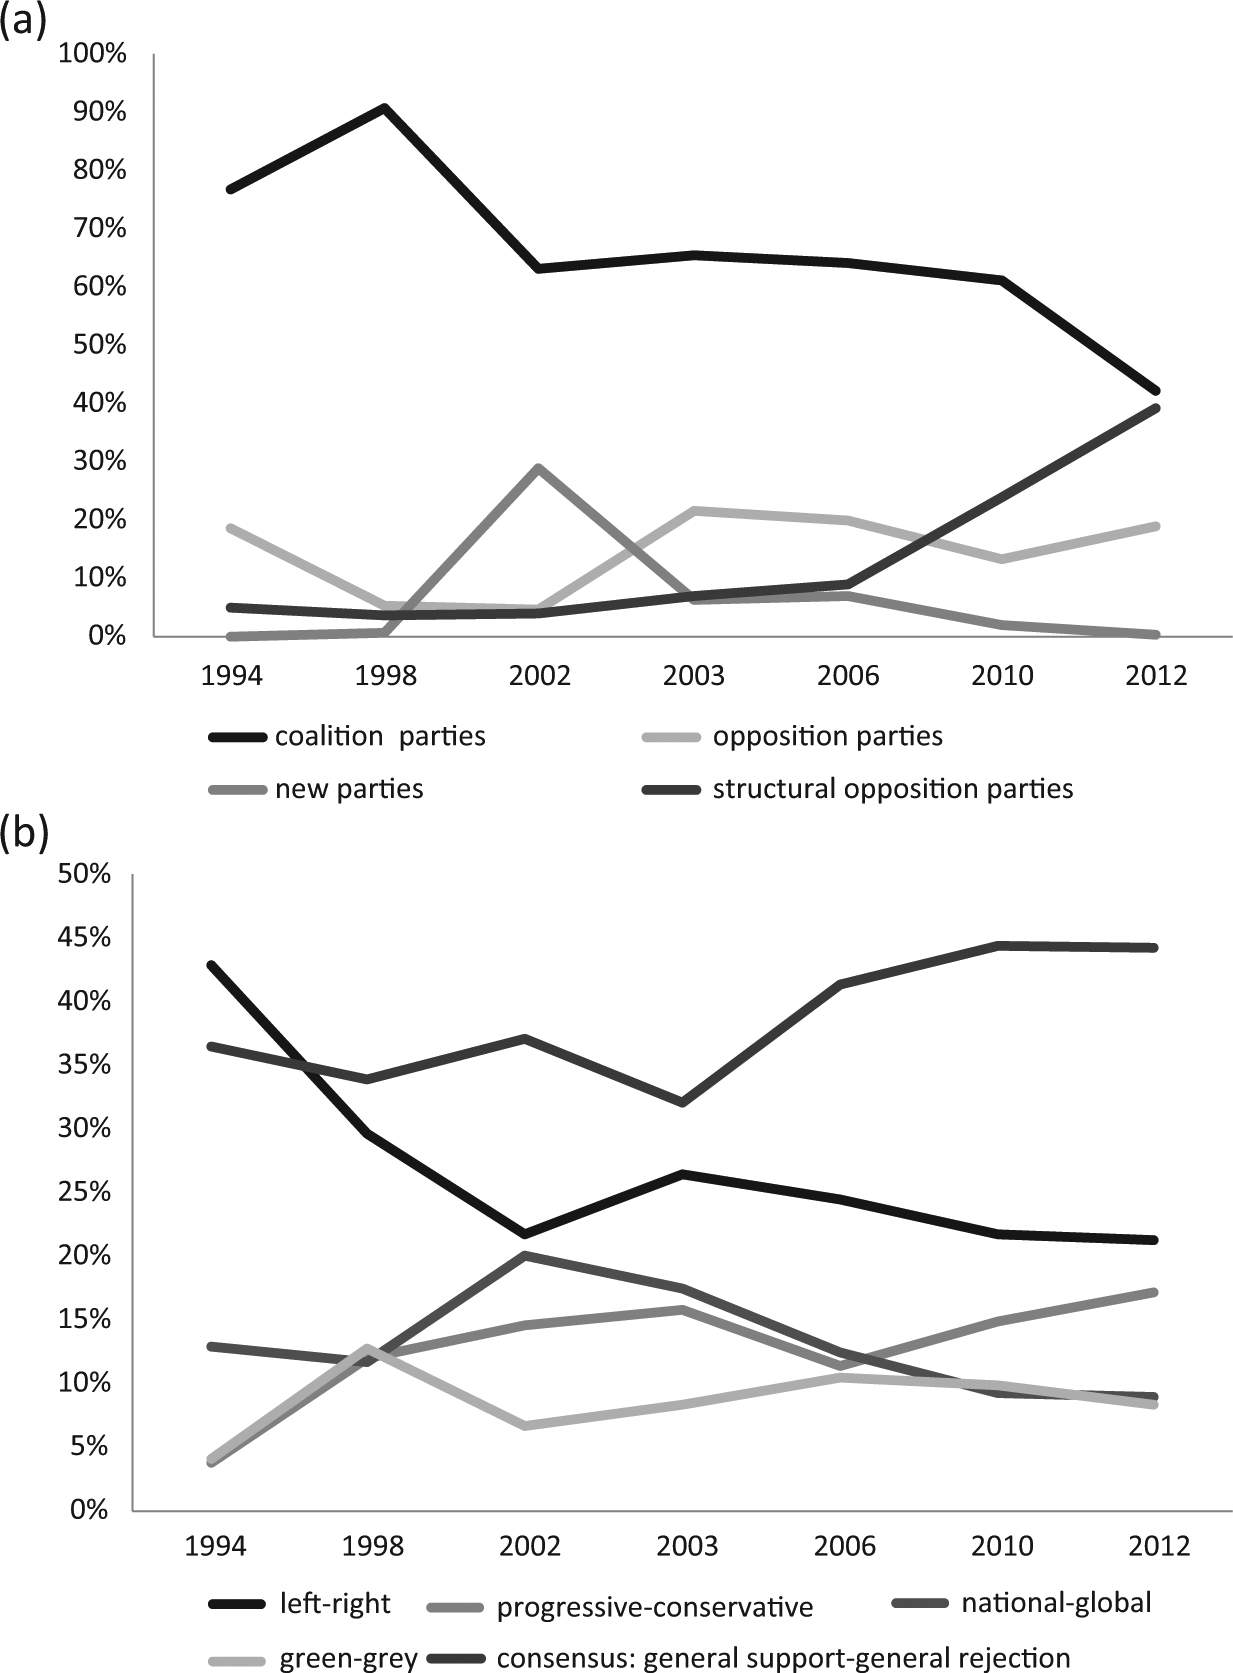
(a) Attention for party types and (b) issue dimensions in the political news during Dutch national election campaigns between 1994 and 2012.
Attention for party types and issue dimensions in two decades of campaign news
Figure 1a reveals some clear trends in news attention for party types and issue dimensions during the last two decades in political news during the election campaigns in the Netherlands. Coalition parties always receive most of the news attention with a peak in 1998 (91%) and a trough in 2012 (42%). Despite this fact, we found an overall negative linear trend (Y = 0.89 + −.058time, R2 = .70) for attention for coalition parties over time, providing room for attention for other party types. In 2002, there was a strong and unique increase for new parties. This was mainly caused by the spectacular rise of the new populist party Lijst Pim Fortuyn (LPF). The 2002 elections were characterized by the landslide victory of this party (the LPF gained 26 of the 150 seats in Parliament in 2002), whose charismatic but controversial leader Pim Fortuyn was assassinated 10 days before Election Day – an unprecedented event in Dutch Parliamentary history. Before 2002, new parties had never gained so much news attention, or since.
There is a weak positive trend for opposition parties (Y = 0.10 + .012time, R2 = .13). Figure 1a also illustrates a stronger positive trend for structural opposition parties (Y = 0.08 + −.053time, R2 = .72). Figure 1a reveals that the attention for structural opposition parties intensified after 2006. In 2010, this positive trend was further enhanced by the fact that another populist party, the Partij Voor de Vrijheid (party for freedom, PVV), was gaining more support during the campaign according to the opinion polls. The PVV first took part in the Parliamentary elections in 2006. This party is led by Geert Wilders, also a controversial politician who holds strong opinions on immigration, and Europe. In the election campaign preceding the election of 2012, it was not so much the PVV that attracted most news attention, but another structural opposition party, the Socialistische Partij (Socialist Party, SP). About 1–2 months before Election Day, the SP did so well in the polls that all kinds of speculation fed the news about the SP becoming the biggest party, and as a consequence leading a coalition government and providing the prime minister.
Additionally, with regard to attention for issue dimensions in the news, we have seen clear shifts in the last two decades (see Figure 1b). The left–right dimension and the consensus issue dimension (general support–general rejection) are the two most important dimensions over the entire period. On average, 25% of the news attention for issue dimensions was for the left–right dimension and 39% for the consensus issue dimension. But whereas both dimensions were almost as important in 1994, the consensus issue dimension became more important over the years (Y = 0.32 + .017time, R2 = .59), while news attention for the left–right dimension decreased (Y = 0.38 + −.028time, R2 = .61). This means that more attention in the news was given to general rejection issues like crime. But we also found a sharp increase in the news about the campaign itself, an issue we categorized under the general support pole of the consensus issue dimension. Additionally, the trend for news attention for the progressive–conservative dimension was positive (Y = 0.07 + .015time, R2 = .54).
All in all, Figure 1a and 1b show that the focus of the news evolved from a classical one on government parties and the left–right dimension to a broader spectrum of parties and issue dimensions. The findings indicate the Election Year 2002 to be the turning point, since for most party types and issue dimensions, the change in direction started during this election.
For news about party types, we can easily check whether attention in the news is preceded by changes in the power base for these parties in Parliament. In Figure 2, the attention for party types in the news during the election campaign is compared with the power base of these party types in Parliament, preceding the elections. Figure 2 shows that the power base for coalition parties in Parliament by and large decreased over the last two decades and even dropped under 50% in 2012 (following the elections of 2010, the Netherlands had a minority government). The deviance in news attention as compared with the power base of these parties in Parliament is largest in 1998 (the sum of the absolute numbers of deviance per party type adds up to 58.5 in 1998) and lowest in 2003 (14.0). The election years of 1998, 2002 and 2012 displayed high levels of deviance (respectively, 58.5, 57.3 and 54.2), while 1994, 2003 and 2010 demonstrated relatively low levels of deviance (respectively, 10.1, 14.0 and 17.7). An intermediate position was taken up by 2006 (38.0).
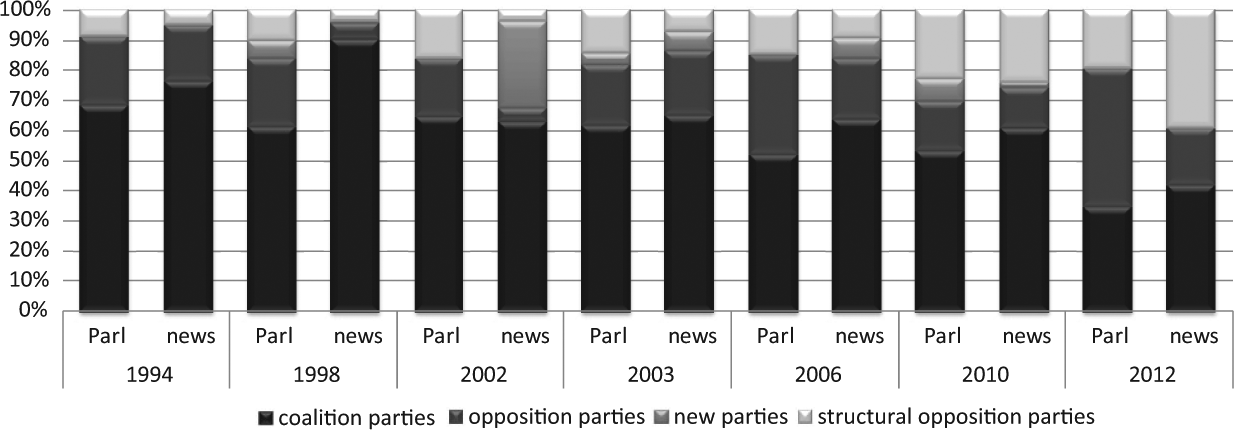
The power base of party types in Parliament (preceding election) and attention in news for party types during election campaigns, per election year.
In line with earlier research (Hopmann et al., 2012), we see that the amount of news coverage decreases when the power base of coalition parties decreases. However, we also see that news amplifies the trends in the political arena. When coalition parties are almost certain to win the elections, for example, in 1998, the coalition parties are extremely over-represented in the news. At times when opposition or new parties are deemed as having a fair chance of winning the elections, news attention for these parties increases, and these parties are over-represented in the news, as was the case in 2002 with the new party LPF and in 2012 with the structural opposition party the SP.
Trends in diversity of party types in the news
In Figure 3, the horizontal and vertical diversity for the party types are presented per election year. The dashed line indicates the overall or horizontal diversity, while the black line shows the vertical diversity for newspapers and the grey line the vertical diversity for television news. Horizontal and vertical diversity are measured as open diversity.
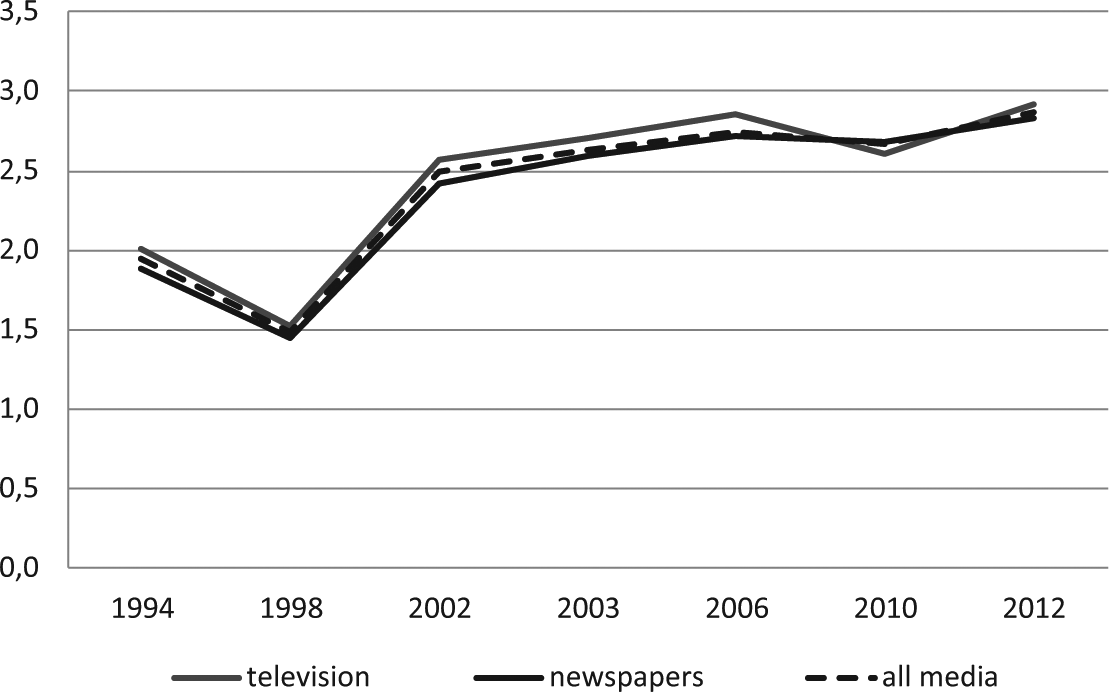
Vertical diversity (television news and newspapers) and horizontal diversity (all media) for political party types per election year.
The lowest level of diversity is found in 1998, when more than 90% of all news attention for political parties went to coalition parties. In the years that follow, we see a steady increase in the diversity leading to a score of 2.87 in 2012 (Y = 1.63 + .19time, R2 = .68). The diversity of news coverage with respect to political parties does not decrease but rather increases. The increase in diversity is caused by the fact that the attention for coalition parties decreases, allowing room for other party types. That means that our hypothesis (over time, news media will increasingly show traces of structural bias) has to be rejected.
The differences in trends in diversity between television news (Y = 1.72 + .18time, R2 = .62) and newspapers (Y = 1.57 + .20time, R2 = .71) are not strong. The horizontal diversity almost concurs with the diversity of newspapers. The diversity of television news is stronger than horizontal diversity, which means that people who watch news on television are on average confronted with a slightly broader offer of party types than people who read just the newspaper.
Trends in diversity for issue dimensions
Figure 4 shows the horizontal and vertical diversity for the five bipolar isssue dimensions per election year as number equivalents. Again, the dashed line refers to horizontal diversity, the black line to vertical diversity for newspapers and the grey line to vertical diversity for television news. Diversity was lowest in 1994, with an almost equal score for newspapers and television news. In 1998, a relatively sharp increase in diversity can be observed. Diversity remains at a similar level in 2002 and 2003 and decreases slowly afterwards. A linear trend is very weak, only explaining 7% of the variance in diversity of issue dimensions over time (Y = 4.04 + .04time, R2 = .07). The trend for television news is slightly negative (Y = 4.04 + −.02time), but again, very little variance is explained (R2 = .02). The most striking finding, however, is the fact that from 1998, diversity in issue dimensions is lower for television news than for newspapers. Readers of newspapers are thus confronted with a broader variety of issue news than people who solely watch television news. Television focuses on more types of political parties but at the same time on fewer issues. These results show, in line with Takens et al. (2013) research, that there are differences in the content of the news coverage in both medium types.
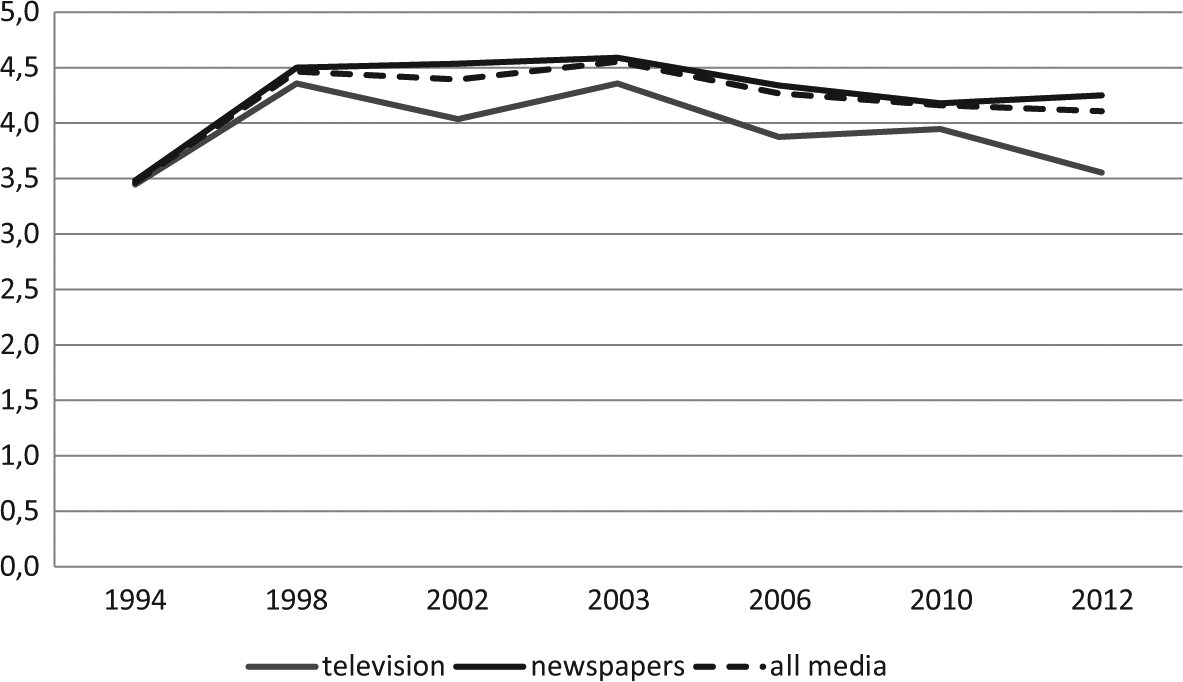
Vertical diversity (television news and newspapers) and horizontal diversity (all media) for issue dimensions per election year.
Conclusion and discussion
Diversity of political news is desirable from a normative perspective on democracy, offering information about the full range of political parties and political issues. It enables citizens to cast a vote that corresponds to their own political preferences, and can therefore be regarded as an indicator for the quality of democracy. This study of trends in the level and nature of news diversity in two decades of election news in the Netherlands helped to gain a better understanding of the developments of diversity.
Our study showed that diversity of political news is dynamic. The most important changes in political news were a decrease in news attention for coalition parties and the left–right issue dimension. The focus of the news evolved from this classical focus into a broader spectrum of parties and a change in issue dimensions.
These changes in the news offer lead to an increase in diversity for political party types. As measured against the standard of open diversity, diversity for political parties almost doubled between 1998 and 2012. We had expected that the news – following a media logic with a strong emphasis on elite sources – would have shown signs of structural bias. Since we found the opposite, the question remains how the increase in news diversity for political actors can be explained. Our findings on news diversity of party types viewed from a reflective norm and news diversity of issue dimensions can help answer that question.
Viewed from a reflective norm, an optimal level of news diversity is reached when news attention reflects the power base of these parties in Parliament. The findings showed that attention for coalition parties is always over-represented in the news. This is in line with the literature on media logic. However, the level of over-representation is not a constant. In some years, the over-representation is large, while in other years, it is virtually non-existent. The decreasing trend in attention for coalition parties therefore also reflects a decreasing trend in the power base of political parties in Dutch governments. At some points, non-elite political party types like new parties and structural opposition parties became highly newsworthy (as was the case in 2002 and 2012).
The situation is also complex with regard to diversity of issue dimensions. The content of the news changed strongly over time, but the level of diversity remained rather stable. Also, the differences between media types are rather small. Newspapers and television news differ in the level of diversity, especially with regard to issue dimensions, but not very strongly. News media make rather homogeneous choices within the context of an election campaign, which supports the hypothesis that structural bias does exist, but can change strongly between election years. This supports the idea discussed in the media logic literature of media increasingly focussing on the same actors and issues.
We conclude that media logic is a complex system that starts with news media following the political reality very closely, selecting certain aspects and augmenting these aspects. But such selection criteria do not hamper news diversity from an open norm. Viewed from this standard, the political news in the Netherlands now serves democracy better, that is, the news better reflects the diversity of party types than it did in the 1990s.
Footnotes
Appendix 1
Top three issue categories per issue dimension per year (in percentages per year).
| Election year |
|||||||||||||||||
|---|---|---|---|---|---|---|---|---|---|---|---|---|---|---|---|---|---|
| Left–right dimension |
|||||||||||||||||
| Main categories in left | 1994 | 1998 | 2002 | 2003 | 2006 | 2010 | 2012 | Cumulative total | Main categories in right | ||||||||
| Social security | 49.10 | 100.00 | 29.90 | 84.60 | 38.80 | 95.80 | 28.40 | 93.00 | 40.90 | 80.10 | 35.40 | 81.20 | 22.60 | 82.10 | 33.40 | 85.70 | Free market efficiency |
| Health care | 1.90 | 0.00 | 27.10 | 4.70 | 38.50 | 2.00 | 18.60 | 6.10 | 26.00 | 6.70 | 21.30 | 13.50 | 52.10 | 3.80 | 63.70 | 91.80 | Mortgage interest deductability |
| Employees interest | 15.20 | 0.00 | 18.80 | 1.80 | 6.70 | 0.00 | 21.60 | 0.10 | 16.00 | 7.40 | 14.80 | 3.50 | 6.30 | 10.20 | 77.10 | 96.40 | Privatize health care |
| Total N | 1390 | 1119 | 2235 | 1979 | 1854 | 1541 | 1733 | 1742 | 2697 | 2179 | 1741 | 3249 | 3660 | 4026 | 15,310 | 15,835 | |
|
|
|||||||||||||||||
| Progressive–conservative dimension |
|||||||||||||||||
| Main categories in progressive | 1994 | 1998 | 2002 | 2003 | 2006 | 2010 | 2012 | Cumulative total | Main categories in conservative | ||||||||
|
|
|||||||||||||||||
| Administrative reform | 55.50 | 25.00 | 43.50 | 18.70 | 50.90 | 55.60 | 60.10 | 53.20 | 73.60 | 56.60 | 58.60 | 37.80 | 57.20 | 40.30 | 56.90 | 44.10 | Law enforcement |
| Civil rights bill of rights | 11.00 | 50.00 | 19.00 | 65.10 | 8.30 | 24.80 | 12.10 | 28.80 | 12.40 | 23.50 | 31.70 | 25.20 | 21.10 | 28.90 | 75.80 | 73.90 | Norms and values |
| Physical self-determination | 33.50 | 0.00 | 34.20 | 6.10 | 19.00 | 1.70 | 3.60 | 0.00 | 7.40 | 8.00 | 7.50 | 16.30 | 20.20 | 16.30 | 92.50 | 84.10 | Sports movement |
| Total N | 182 | 48 | 1171 | 476 | 1264 | 656 | 858 | 819 | 1047 | 1002 | 1651 | 1327 | 2599 | 1672 | 8772 | 6000 | |
|
|
|||||||||||||||||
| Global–national dimension |
|||||||||||||||||
| Main categories in global | 1994 | 1998 | 2002 | 2003 | 2006 | 2010 | 2012 | Cumulative total | Main categories in national | ||||||||
|
|
|||||||||||||||||
| Immigration, immigrants | 67.70 | 0.00 | 63.20 | 84.90 | 63.10 | 43.40 | 64.20 | 99.20 | 57.70 | 61.30 | 27.50 | 49.50 | 10.30 | 26.30 | 45.00 | 57.90 | Armed forces |
| Pro-European integration | 14.40 | 10.50 | 13.10 | 0.00 | 14.20 | 56.60 | 23.60 | 0.80 | 7.80 | 23.90 | 19.80 | 43.70 | 62.30 | 42.30 | 71.00 | 91.30 | Defence, armaments |
| Immigration | 13.90 | 89.50 | 9.60 | 15.10 | 18.30 | 0.00 | 7.90 | 0.00 | 22.00 | 4.10 | 26.90 | 1.90 | 22.40 | 24.80 | 89.70 | 96.90 | Competitiveness Netherlands |
| Total N | 713 | 19 | 1106 | 345 | 1494 | 1135 | 1388 | 488 | 1979 | 543 | 1653 | 378 | 2474 | 331 | 10,807 | 3239 | |
|
|
|||||||||||||||||
| Green–grey dimension |
|||||||||||||||||
| Main categories in green | 1994 | 1998 | 2002 | 2003 | 2006 | 2010 | 2012 | Cumulative total | Main categories in grey | ||||||||
|
|
|||||||||||||||||
| Environment | 51.40 | 0.00 | 55.30 | 86.30 | 38.30 | 90.90 | 43.00 | 74.70 | 49.50 | 80.80 | 20.10 | 63.50 | 23.50 | 65.10 | 38.00 | 76.20 | Pro infrastructure |
| Public transport | 48.60 | 0.00 | 38.50 | 13.70 | 49.90 | 3.60 | 44.10 | 0.00 | 19.60 | 11.60 | 21.20 | 14.70 | 10.20 | 19.90 | 67.90 | 89.00 | Agriculture, farmers |
| Animal welfare | 0.00 | 0.00 | 2.10 | 0.00 | 7.00 | 0.00 | 8.40 | 25.30 | 11.40 | 4.30 | 20.50 | 19.80 | 26.20 | 12.20 | 80.60 | 97.90 | Housing, construction |
| Total N | 247 | 0 | 763 | 1013 | 856 | 361 | 783 | 261 | 1106 | 828 | 1120 | 864 | 916 | 723 | 5791 | 4050 | |
|
|
|||||||||||||||||
| Consensus issuesdimension |
|||||||||||||||||
| Main categories in general support | 1994 | 1998 | 2002 | 2003 | 2006 | 2010 | 2012 | Cumulative total | Main categories in general rejection | ||||||||
|
|
|||||||||||||||||
| Campaign | 53.70 | 100.00 | 50.60 | 76.10 | 28.80 | 87.20 | 32.90 | 74.20 | 48.60 | 47.30 | 62.90 | 69.50 | 58.60 | 55.20 | 53.80 | 69.40 | Crime |
| Pro-education | 0.00 | 0.00 | 16.50 | 0.90 | 21.90 | 3.80 | 21.50 | 12.70 | 17.90 | 14.20 | 10.20 | 3.90 | 7.90 | 5.70 | 65.80 | 76.40 | Pro-terror |
| Economic growth | 14.40 | 0.00 | 6.70 | 1.80 | 7.40 | 3.80 | 12.00 | 3.00 | 6.60 | 11.50 | 7.20 | 4.40 | 10.80 | 8.90 | 74.80 | 82.30 | Problems in education |
| Total N | 1880 | 237 | 3067 | 683 | 1835 | 2101 | 1806 | 951 | 5564 | 1645 | 7200 | 1049 | 11,694 | 1231 | 33,046 | 7897 | |
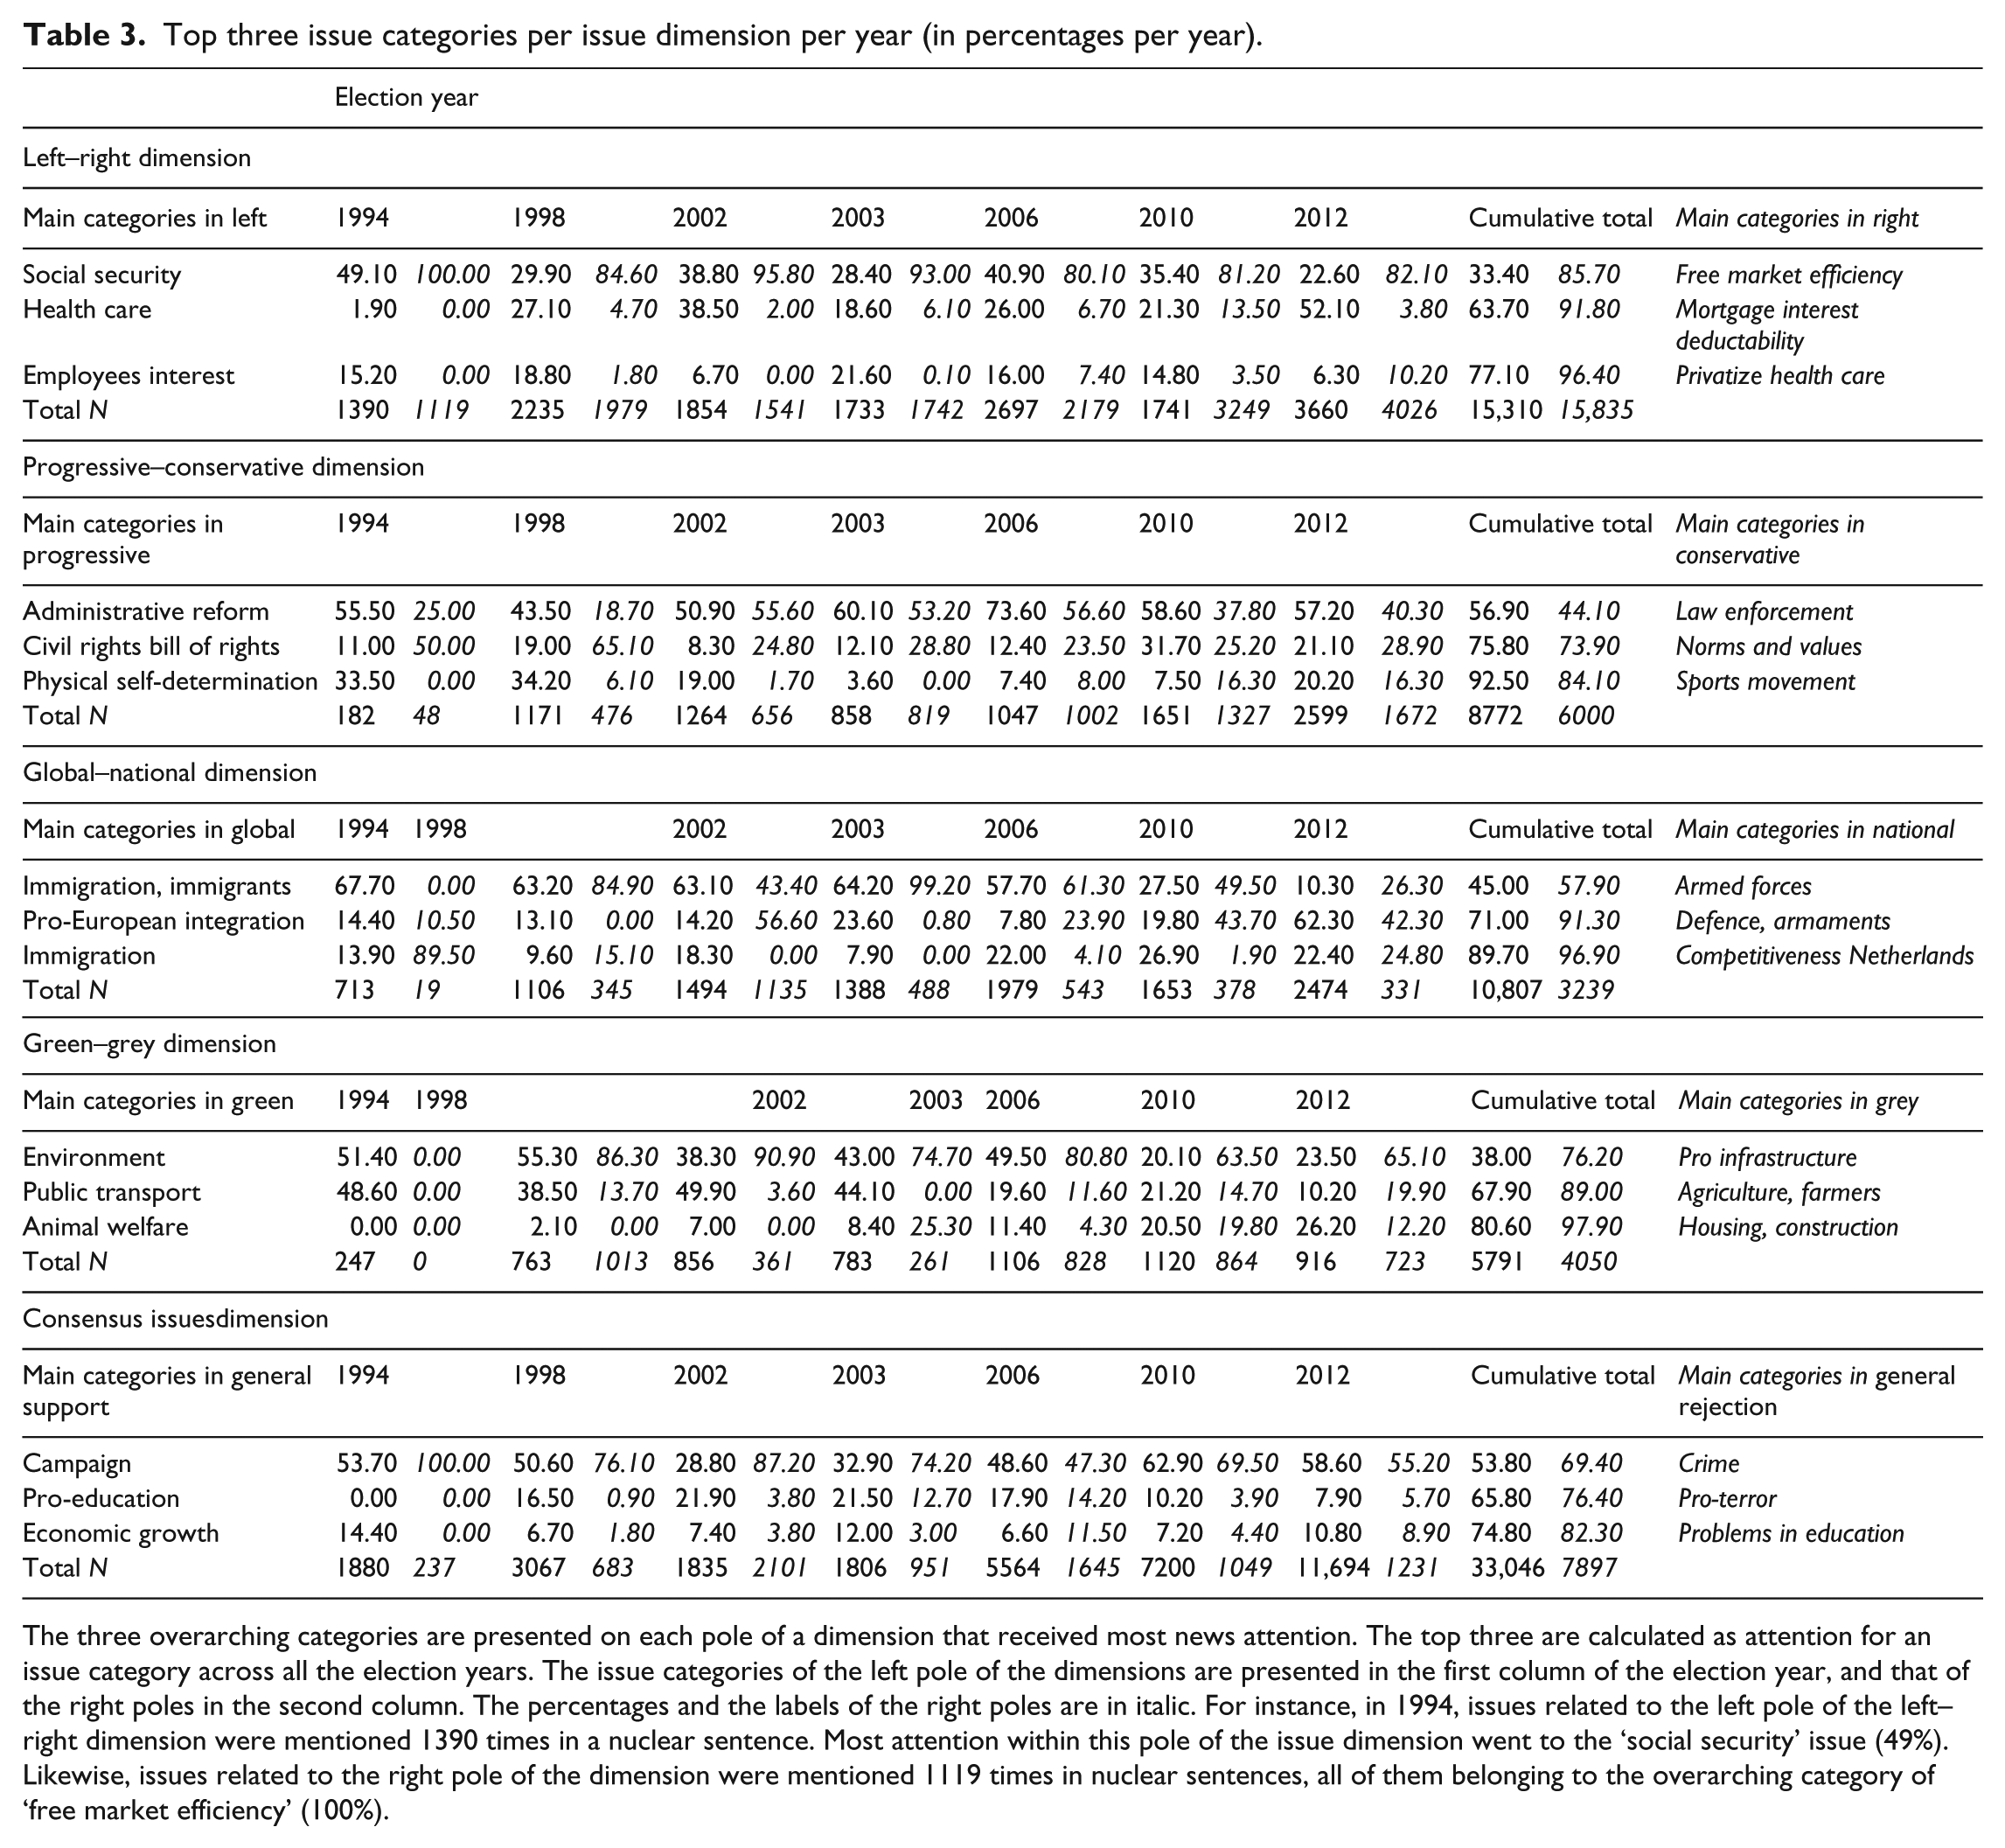
The three overarching categories are presented on each pole of a dimension that received most news attention. The top three are calculated as attention for an issue category across all the election years. The issue categories of the left pole of the dimensions are presented in the first column of the election year, and that of the right poles in the second column. The percentages and the labels of the right poles are in italic. For instance, in 1994, issues related to the left pole of the left–right dimension were mentioned 1390 times in a nuclear sentence. Most attention within this pole of the issue dimension went to the ‘social security’ issue (49%). Likewise, issues related to the right pole of the dimension were mentioned 1119 times in nuclear sentences, all of them belonging to the overarching category of ‘free market efficiency’ (100%).
Funding
The content analysis for the years 2010 and 2012 was facilitated by the Dutch Science Foundation NWO (Grant 311-99-17, research project “Short-Term Media Logic and the Long-Term Viability of Democracy”).