
Abstract
Objectives:
Predicting the post-dilution hematocrit is an important tool to avoid preventable anemia or unnecessary transfusion. Simplified empirical formulas currently used for such a prediction may lead to large errors. We aimed to improve the accuracy of these formulas by a better estimation of the dilution volume and the patient circulatory blood volume.
Methods:
We compared the estimation accuracy of two formulas, using fixed (formula A) versus estimated (formula D) dilution volume and patient circulatory blood volume for 100 cardiac interventions. The difference between predicted and measured HctT1 was considered as “good” if less than 0.5%, “moderate” between 0.5 and 2% and “poor” if higher than 2%. The influence of the body mass index (BMI) on patient blood volume estimation was explored by categorized groups’ comparison.
Results:
The mean difference between predicted and measured HctT1 differed significantly between formulas A and D. Formula A didn’t differ from HctT1 (p=0.19, IC95% [-0.89-0.18]), but a significant and higher underestimation was observed in the BMI⩽25 group compared to the other BMI groups (p<0.001). Formula D overestimated HctT1 (p<0.001, IC95% [1.01-1.93]) without a difference between the BMI groups. No difference was observed in their overall proportions of good (11 vs 10%), moderate (44 vs 46%) and poor predictions (47 vs 44%) (p=0.117).
Conclusions:
Formulas used for post-dilution hematocrit prediction lead to major estimation errors and a risk of inadequate transfusion practices. Estimations performed by experienced clinicians could not minimize these biases in all clinical cases as significant errors remain, with potential clinical impact. No estimation formula should be used as a hard tool for transfusing patients, but rather as a guide to predicting the probability of transfusion requirement.
Introduction
Cardiopulmonary bypass (CPB) with clear solution priming and crystalloid cardioplegia administration induces acute hemodilution in cardiac surgery patients. Although hemodilution may have beneficial effects, such as a decrease in blood viscosity with improved microcirculation, it may lead to anemia, which causes a decrease in blood oxygen transport. 1 Many recent studies have reported an association between low hematocrit values under CPB and postoperative morbidity and mortality. 2 However, the hematocrit threshold below which the risks related to anemia exceed the risks related to blood transfusion is unclear. 3 Current practice aims to reach an hematocrit >19% under CPB.2,4
Various materials and techniques are used to reduce hemodilution in the CPB context (retrograde autologous priming, miniaturized circuit, ultrafiltration, etc.). 5 However, these strategies are not applicable in all cases and require material resources or technical skills that are not available in all centers. Most commonly, the amount of clear volume administered is reduced and, in some cases, part of the clear priming volume is replaced by allogeneic packed red blood cells (RBC). The following formula is commonly used to estimate the hematocrit value that will be obtained after dilution (HctT1) and is based on the hematocrit value of the patient before dilution (HctT0), his/her circulating blood volume (PBV) and the volume of diluter to be administered (DV): 6

If HctT1 is anticipated to be lower than 20%, clinicians frequently reduce the volume of clear priming solution and/or replace part of it with red blood cells (RBC). Such hematocrit prediction is also very helpful in ordering RBC in time in centers with a decentralized blood bank.
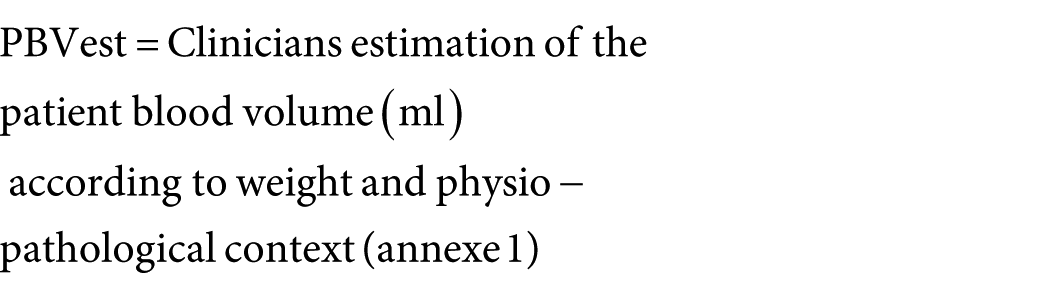
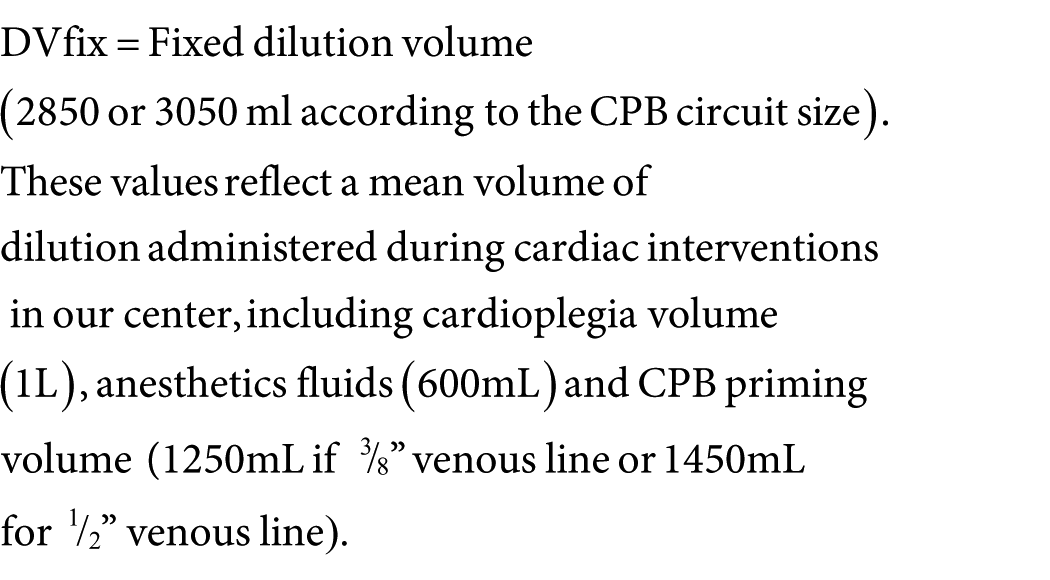
The accuracy of such a prediction formula is more critical when the predicted HctT1 is close to 20%. A 1% difference in HctT1 may indicate or allow avoiding a RBC transfusion and, thus, may lead to unnecessary transfusion or preventable anemia. Unfortunately, each variable of this formula contains biases. The hematocrit value (i.e. HctT0) is usually measured by a « Point-of-care » technology that offers a quick result, but includes an estimation bias depending on the device used. 7 The estimation of PBV in routine practice relies on various empirical formulas which are generally based on clinical parameters, such as weight, body surface area or body mass index.8–10 None of these formulas could be accurate in each cardiac surgery patient since the physio-pathological context and perioperative medical treatment may induce large PBV changes. 11 The value of the dilution volume is generally a mean fixed value, similar for all cases. Although a fixed value (DVfix) is convenient, it does not take into account the possible reduction in hemodilution volume or the distribution volume of the fluid used as a pump prime. 6 However, hardly predictable or estimable events may influence the dilution volume between T0 and T1, such as bleeding, perspiration and the influence of colloids that tend to remain in the intravascular space compared to crystalloids that cause leakage of fluid into the extracellular compartment. 12
We assume that the prediction of HctT1 in the CPB context could be improved by allowing clinicians to adjust the estimated values of PBV and DV according to their knowledge of the clinical and physio-pathological context of the patient and the type of procedure.
Therefore, the goal of this study was to compare the accuracy of two formulas estimating HctT1, using DV and PBV, both fixed, versus estimates by the clinicians.
Methods
This retrospective study was based on anonymized data from the electronic records of the patients and obtained with the approval of the ethics committee (Comité d’Ethique Hospitalo-Facultaire Universitaire de Liège 707, Sart Tilman B35, 4000 Liege Belgium) on 9 April 2013 (Ref B707201215631 - 2012/237).
The data of 100 consecutive adults patients referred for correction of valvular stenosis (“Stenosis”), insufficiency (“Insufficiency”) or coronary artery bypass grafting (CABG) under normothermic CPB (⩾35°C) were analyzed. Patients who received red blood cell transfusions into the CPB priming were excluded from the study.
Surgical and anesthetic management of all patients followed the institutional protocol. An intravenous infusion of Volulyte® (Fresenius-Kabi AG, Bad Homburg, Germany) was started at a rate of 50 ml.h−1 before induction of anesthesia. A pulmonary artery catheter was inserted after the induction of anesthesia and a second infusion of Volulyte® was started at a rate of 50 ml.h−1. An intravenous bolus of 2.5 g of tranexamic acid was given before the skin incision. The CPB circuit was primed with 1500 ml Volulyte® 6%, 150 ml mannitol 15%, 5000 IU of unfractionated heparin and 1 g of tranexamic acid. Before starting CPB, the prime volume in excess was eliminated. Cold crystalloid cardioplegia (Plasmalyte A® + St Thomas’ solution) was delivered after cross-clamping of the aorta, in an electrocardiographic activity-based volume with a minimum of 10 mL/kg.
Measured hematocrit values were obtained by co-oximetry, using the point-of-care Rapidlab® 1200 blood analyzer (Siemens, Brussels, Belgium). The pre-dilution hematocrit (HctT0) was measured on the arterial blood sampled 5 minutes after tracheal intubation and the measured post-dilution hematocrit (HctT1) on the first arterial sample on CPB following cross-clamping and cardioplegia first administration.
The predicted hematocrit values were calculated according to the following formulas:
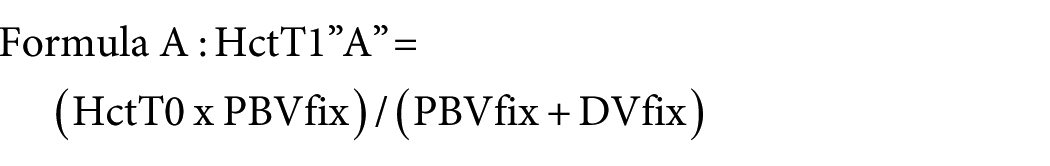

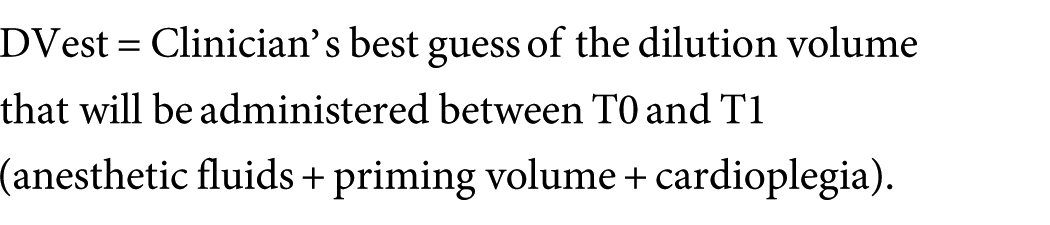
Where:


The accuracy of the HctT1 predictions were evaluated by Bland-Altman’s method. Predictions were considered as “good” if the difference between the predicted HctT1 (%) and measured HctT1 (%) was less than 0.5%, “moderate” between 0.5 and 2% and “poor” if higher than 2%. The difference between proportions of “good”, “moderate” and “poor” results of formulas A and D were compared two by two using a test of symmetry with a Bonferroni correction and were considered statistically significant at the α/6 critical level (p<0.0083). The difference between DVest and DVfix, as well as between PBVest and PBVfix, were explored using the Wilcoxon Signed-rank test.
These results were compared according to the BMI categorized group (⩽25, ]25–30] or >30 kg/m²) by a one-way analysis of variance and Scheffé’s method for multiple comparisons.
The results are expressed as the number of observations (n) and percentages (%), mean and standard deviation (SD) for normally distributed data or median and quartiles (P25 and P75) for non-parametric data. Normality was assessed using the Shapiro-Wilk test. Proportions were reported with 95% confidence intervals. The results were considered statistically significant at the 5% critical level (p<0.05). Statistical analyses were performed using Statistica 10 and SAS statistical package (version 9.3. for Windows)(Statsoft Benelux, Hamburg, Germany). Graphics were performed using R software.
Results
Table 1 presents the characteristics of the study sample (n=100). The proportion of male patients was predominant (71%). The median age was 70 years [63–77]. The intervention performed was CABG in 45% of the cases, valvular surgery in 42% and combined surgery in 13%. The median hematocrit value was 38% [35–41] before dilution and 25% [22-28] after dilution. The median volume of dilution administered to patients between T0 and T1 was 300 mL [240-400] of anesthesia fluids, 1300 mL [1200–1400] of priming volume and 785 mL [500–950] of cardioplegia. The median fixed value of dilution volume used for hematocrit estimation was 3050 mL [2850–3050] and the median dilution volume estimated by clinicians was 2302 mL [2050–2500] (p<0.001). The median patient blood volume calculated according to the patient’s weight was 5460 mL [4795–6440] and the median patient blood volume estimated by clinicians was 5000 mL [4500–5725] (p<0.001).
Characteristics of the study sample (n=100).
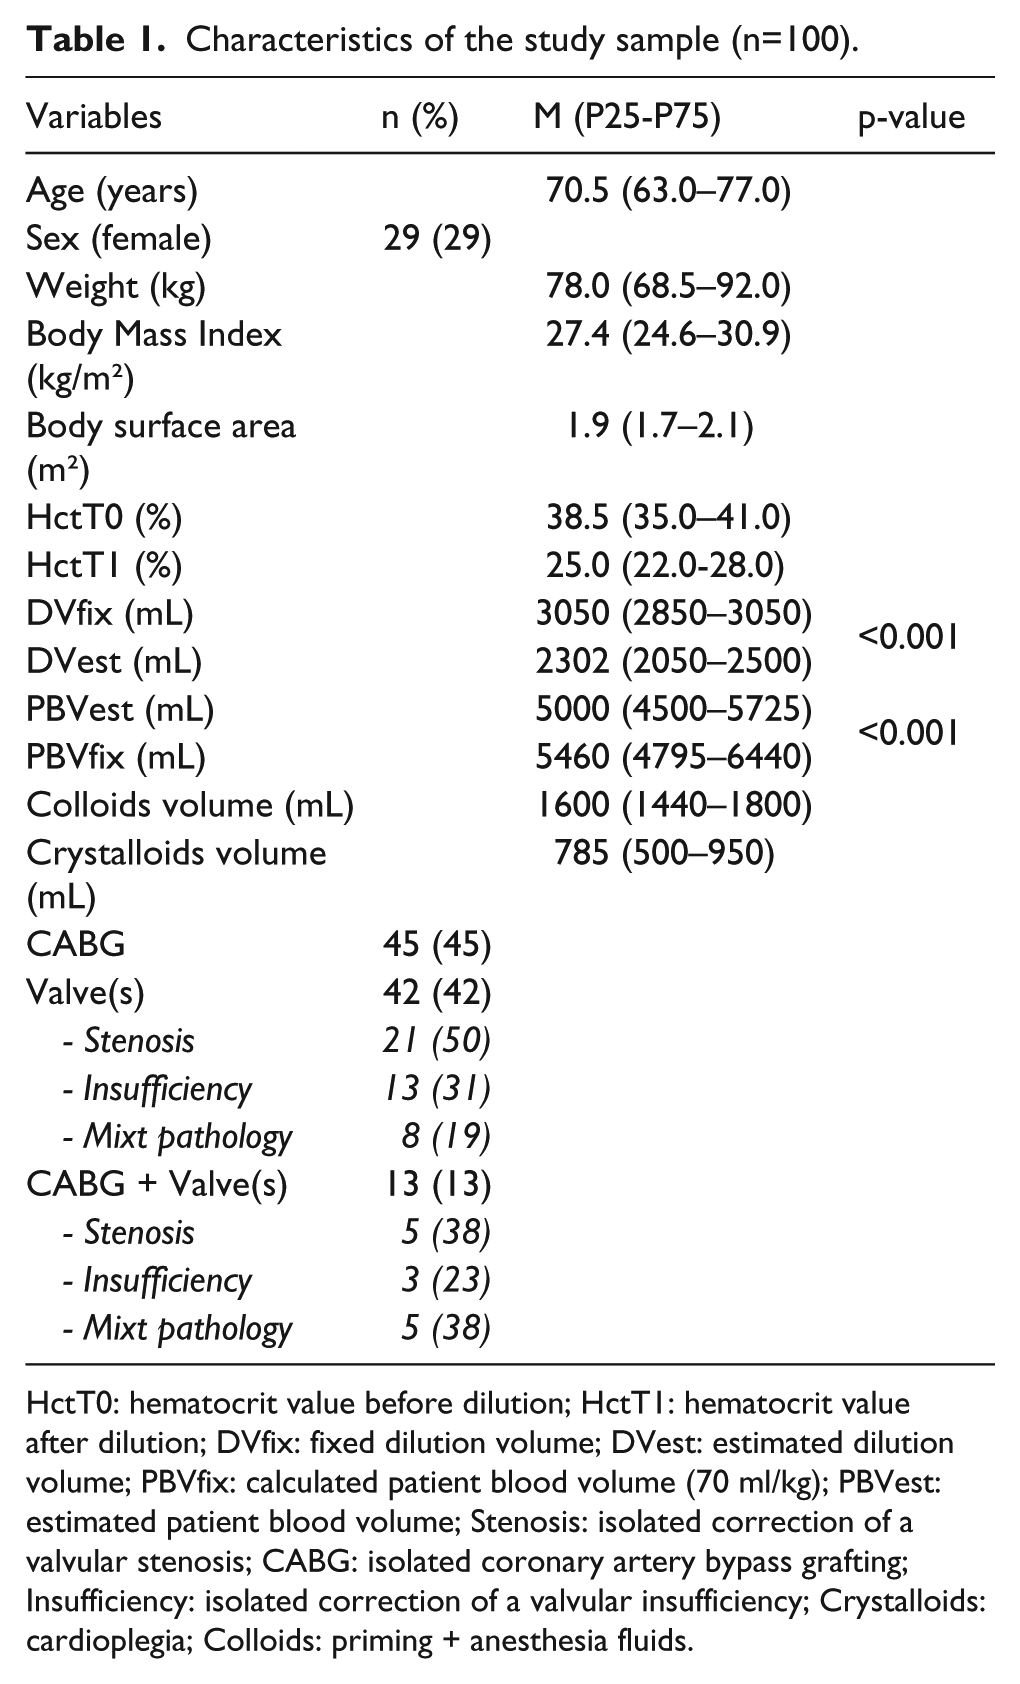
HctT0: hematocrit value before dilution; HctT1: hematocrit value after dilution; DVfix: fixed dilution volume; DVest: estimated dilution volume; PBVfix: calculated patient blood volume (70 ml/kg); PBVest: estimated patient blood volume; Stenosis: isolated correction of a valvular stenosis; CABG: isolated coronary artery bypass grafting; Insufficiency: isolated correction of a valvular insufficiency; Crystalloids: cardioplegia; Colloids: priming + anesthesia fluids.
The median difference between the predicted HctT1 and the measured HctT1 differ significantly between formulas A and D (p<0.002) (Table 2). Formula A estimations did not differ significantly from HctT1 (p=0.19, IC95% [−0.89–0.18]) while formula D significantly overestimated it (p<0.001, IC95% [1.01-1.93]). However, the underestimation of HctT1 by formula A was significantly higher in patients with a BMI ⩽25 than in the “]25-30]” BMI group (p<0.05, IC95% [−3.04 – −0.012]) and the “>30” BMI group (p<0.05, IC95% [−4.11 – −0.95]) (p<0.001). The overestimation of HctT1 by formula D did not differ between the BMI groups (p=0.140).
Difference between predicted post-dilution hematocrit and measured HctT1.
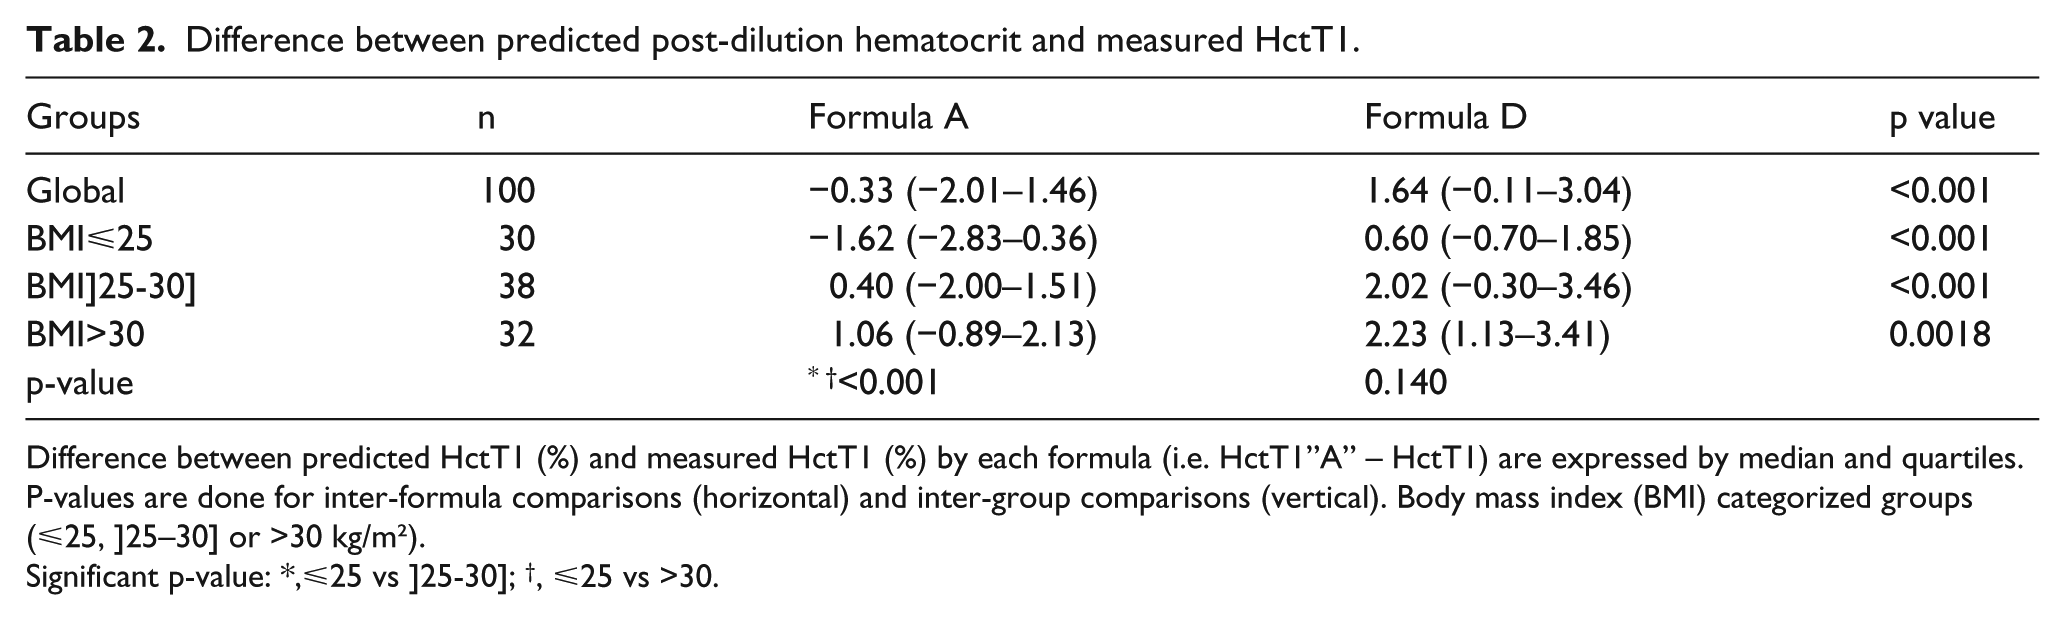
Difference between predicted HctT1 (%) and measured HctT1 (%) by each formula (i.e. HctT1”A” – HctT1) are expressed by median and quartiles. P-values are done for inter-formula comparisons (horizontal) and inter-group comparisons (vertical). Body mass index (BMI) categorized groups (⩽25, ]25–30] or >30 kg/m²).
Significant p-value: *,⩽25 vs ]25-30]; †, ⩽25 vs >30.
The Bland-Altman method for comparison of predicted and measured HctT1 is reported in Figure 1 and categorized prediction accuracy is detailed in Table 3. The overall proportion of “good” and “moderate” predictions did not differ significantly between the formulas. Formula D more frequently obtained a “poor” prediction in the BMI group “>30” and “]25–30]”, comparatively with the “⩽25” BMI group (p=0.027).
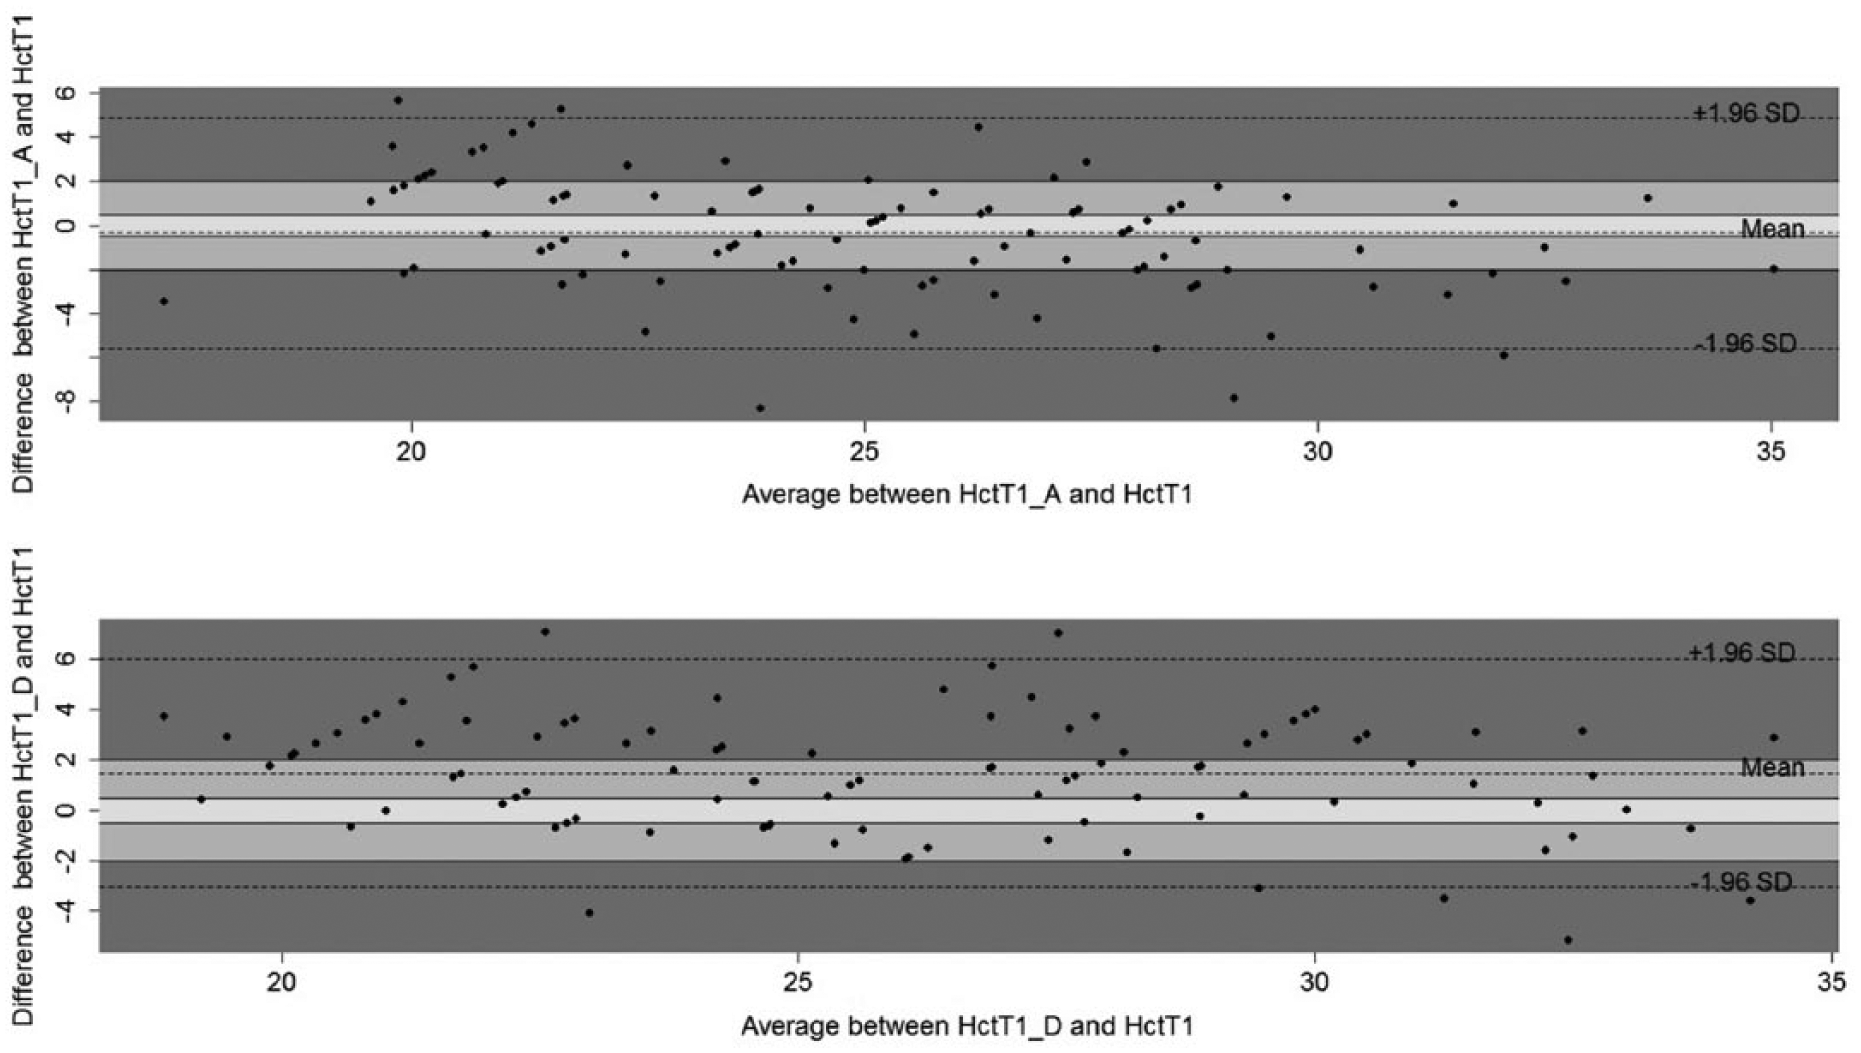
Bland-Altman for predicted post-dilution hematocrit (HctT1_A, HctT1_D) (%) and measured post-dilution hematocrit (HctT1) (%). Formula A underestimated HctT1, but not significantly, while formula D significantly overestimated it. The overall proportion of “good” predictions (difference <0.5 %), “moderate” predictions (difference [0.5- 2] %) and “poor” predictions (difference >2%) did not differ significantly between the formulas.
Prediction accuracy of each formula.
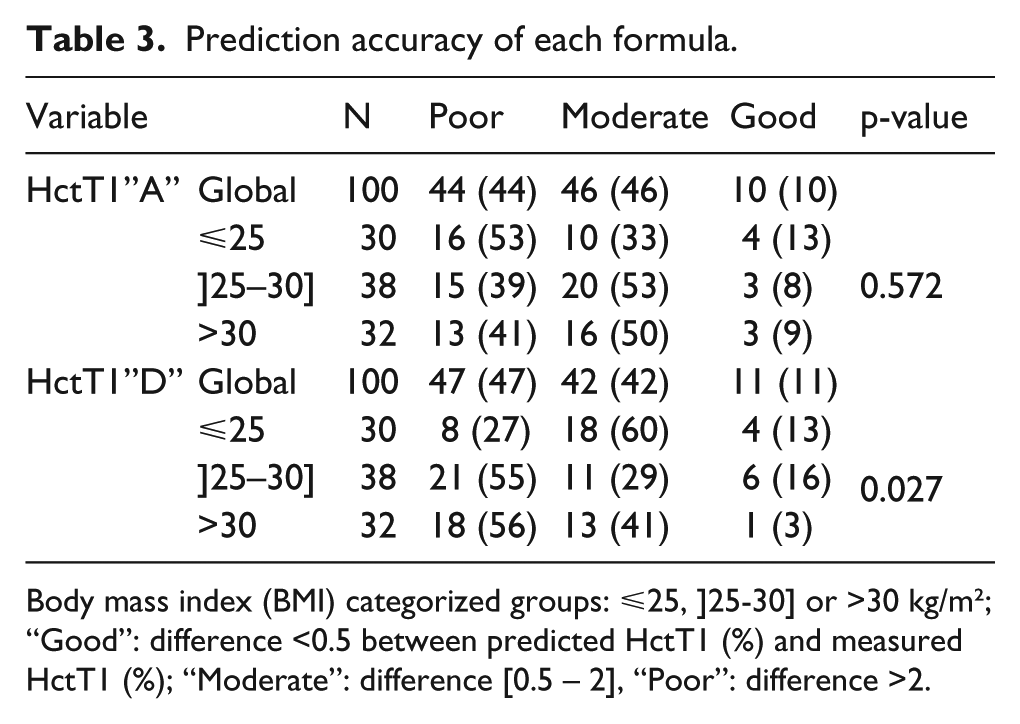
Body mass index (BMI) categorized groups: ⩽25, ]25-30] or >30 kg/m²; “Good”: difference <0.5 between predicted HctT1 (%) and measured HctT1 (%); “Moderate”: difference [0.5 – 2], “Poor”: difference >2.
Discussion
This study highlights the major impact of the dilution volume and the patient blood volume estimation accuracy on the post-dilution hematocrit prediction and warns clinicians about the oversimplified empirical formulas currently used for this prediction. Although some technical advances allow reducing the hemodilution in the context of CPB, these techniques are not applicable in all cases. Consequently, empirical formulas are still used in clinical practice to predict the hematocrit value that will be obtained after dilution and to order blood for transfusion. Few data are available on the accuracy of such predictions in the context of CPB. To our knowledge, only Coetzee et al. have reported results using the common formula:

In this study, the pre-dilution hematocrit, HctT0, was measured by « Point-of-care » analysis, the dilution volume DV was set to 4000 ml for all patients and the patient blood volume PBV was estimated as 70 ml/kg of patient’s weight. 10 Although the authors concluded that this simple equation can be used as a guide to provide blood supply for intervention, a considerable scatter of the data was observed. as well as a large inter-patient variability. In addition, authors emphasized the oversimplification of the PBV calculation, consisting of multiplying the patient’s weight in kilograms with a standard of 70 ml.
Cardiac surgery needs a large panel of techniques and specific material according to patient characteristics, which implies a large range of dilution volumes. Additionally, the clinical and physio-pathological context of cardiac surgery patients may largely influence the patient circulatory blood volume. Consequently, formulas based on a fixed dilution volume value similar for each intervention and a calculated patient blood volume according to the weight may lead to unreliable results and significant errors of predictions. We, thus, assumed that the prediction of the post-dilution hematocrit in the CPB context could be improved by allowing the assessment of the dilution volume (DV) by clinicians according to the operation and patient characteristics rather than using a fixed DV similar for each intervention. We also assumed that the estimation of the patient circulatory blood volume (PBV) could be improved by clinicians, if they take into account the clinical and physio-pathological context of the patient rather than use a calculated value only based on the patient weight.
We, thereby, constructed a formula using both estimated dilution volume and patient blood volume.

We compared its results with those of the formula currently used in our clinical practice (Coetzee et al.) and which is based on a fixed dilution volume and a calculated patient blood volume.

Formula D overestimated HctT1 (p<0.001, IC95% [1.01–1.93]) while formula A tended to underestimate it, with no significant difference overall (p=0.19, IC95% [−0.89–0.18]), but with a significant and higher underestimation in the BMI⩽25 group compared to the other BMI groups (p<0.001). A poor estimation, defined by a difference higher than 2% between the predicted and measured HctT1 was obtained in more than 40% of the cases with both formulas A and D, while a good estimation (difference lower than 0.5%) was obtain in only 10 and 11%, respectively.
As an overestimation of HctT1 could be due to an overestimation of PBV and/or an underestimation of DV and inversely, we explored the isolated influence of each parameter by intermediate cross-matched formulas: a “formula B” used fixed PBV and estimated DV [HctT1”B” = (HctT0 x PBVfix) / (PBVfix + DVest) ] and a “formula C” used estimated PBV and fixed DV [HctT1”C” = (HctT0 x PBVest) / (PBVest + DVfix)].
Formula B overestimated HctT1 even more than formula D (p<0.001, IC95% [0.52 – 0.81]) and formula C underestimated HctT1 even more than formula A (p<0.001, IC95% [0.60 – 0.92]).
As fixed DV was significantly higher than estimated DV and as HctT1 prediction formula using a fixed DV (formulas A and C) underestimated HctT1, while those using an estimated DV (formulas B and D) overestimated it, we suppose that the actual dilution volume was between fixed and estimated DV values. This is indeed confirmed by the volumes of colloids and crystalloids that have been administered (Table 1). Furthermore, as patients received higher volumes of colloids than crystalloids, we hypothesize that the errors of the estimated DV were due partly to the colloid effect on trans-capillary fluid exchange.
On the other hand, the calculated PBV was significantly higher than the estimated PBV (Tables 1) and predicted HctT1 based on calculated PBV (formulas A and B) tended to be higher than formulas using estimated PBV (formulas C and D). However, calculated PBV led to an overestimation of HctT1 only when associated with estimated DV (formula B). This reflects the agonist effects of these variables, leading to a poorer estimation of HctT1 when combined. In the same way, estimated PBV led to an underestimation of HctT1 only when associated with fixed DV (formula C).
Comparisons of estimation accuracy by the BMI groups sustain our hypothesis. The underestimation of HctT1 by formula A was significantly higher in patients with a BMI⩽25 kg/m² than in the other patients (Table 2), probably because the effect of the dilution volume overestimation by DVfix was not compensated for by an overestimation of the patient blood volume by PBVfix in these patients. In the same way, the overestimation of HctT1 by formula B was significantly higher in patients with a BMI>30 kg/m² than in the other patients, probably because the effect of the patient blood volume overestimation by PBVfix in these overweight patients was not compensated by a dilution volume overestimation by DVest (Table 4). The same observation was partially done with formula D, which more frequently produced a “poor” prediction in the BMI groups “>30” and “]25-30]”, comparatively with the “⩽25” BMI group (Table 3), highlighting that the weight also came into consideration in the estimation of the patient blood volume by the clinicians.
Difference between predicted post-dilution hematocrit and measured HctT1.
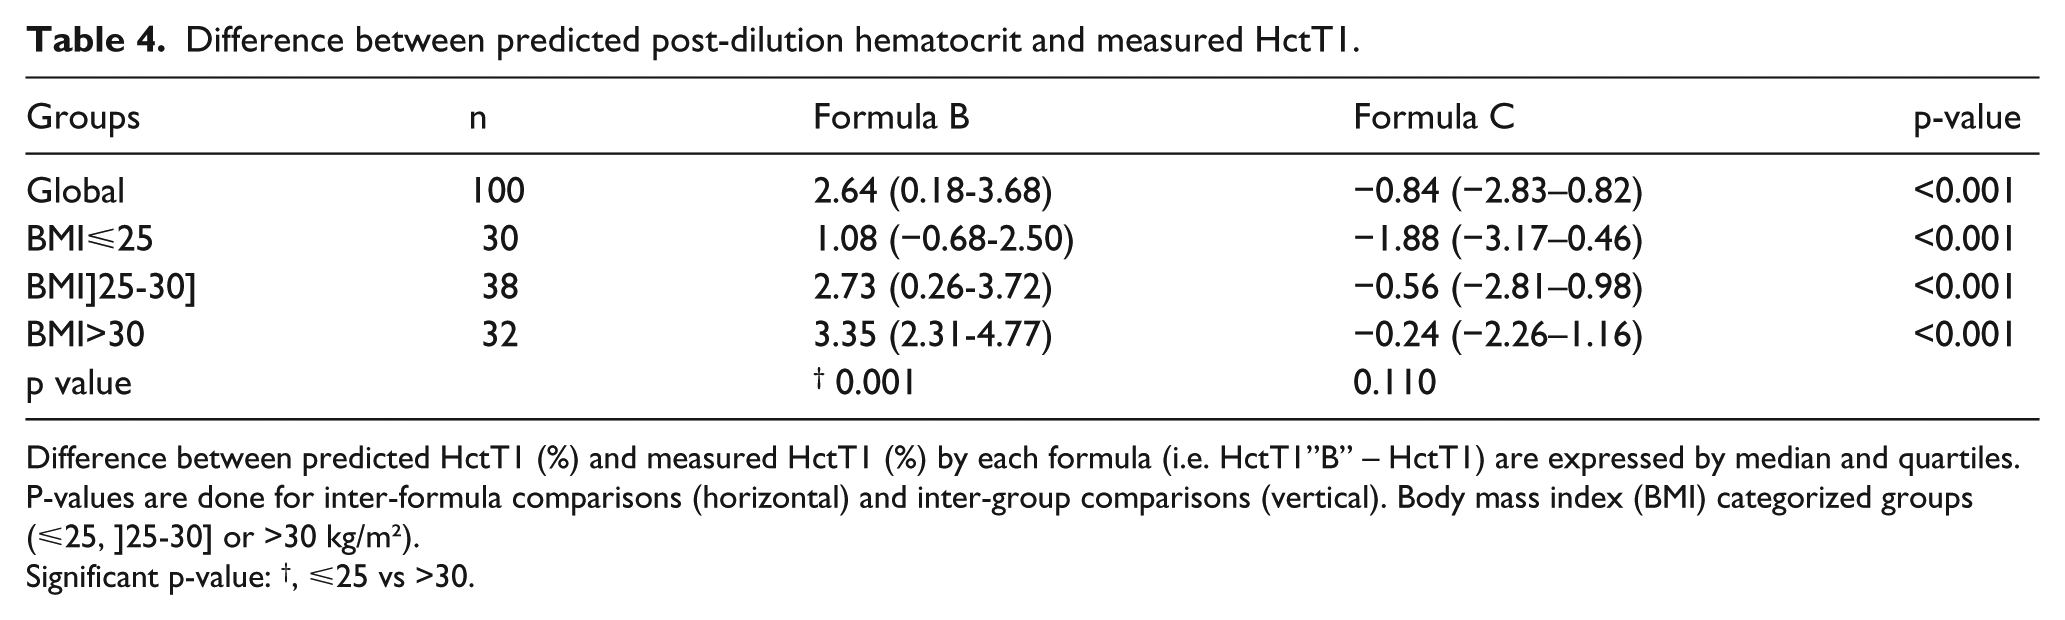
Difference between predicted HctT1 (%) and measured HctT1 (%) by each formula (i.e. HctT1”B” – HctT1) are expressed by median and quartiles. P-values are done for inter-formula comparisons (horizontal) and inter-group comparisons (vertical). Body mass index (BMI) categorized groups (⩽25, ]25-30] or >30 kg/m²).
Significant p-value: †, ⩽25 vs >30.
A recent study highlights the influence of the pathology on the patient blood volume by hemodilution measurements. The authors suggest a fitted adaptation of the Allen formula for their patients, based on their results by linear regression model. 13 Such adaptation would lead to a more accurate individual prediction of the post-dilution haematocrit if fitted for each pathology context.
In conclusion, both dilution volume and patient blood volume estimation accuracy are essential for the prediction of the individual post-dilution hematocrit, as overestimation of HctT1 could be due to overestimation of PBV and/or underestimation of DV and inversely. Significant errors remain in estimations produced by experienced clinicians using adjustable values of dilution volume and patient blood volume, with potential clinical impact. Furthermore, such estimations contain the large limitation of a clinician-dependent evaluation. Simplified formulas lead to a risk of inadequate transfusion practices and none should be used as a hard tool for transfusing patients, but rather as a guide to help predict the probability of transfusion requirement. Further investigations would focus both on the dilution volume estimation accuracy, with an eye on the type of fluids administered, and on the patient blood volume estimation accuracy, taking into account the pathology and the body mass index.
Footnotes
Appendix
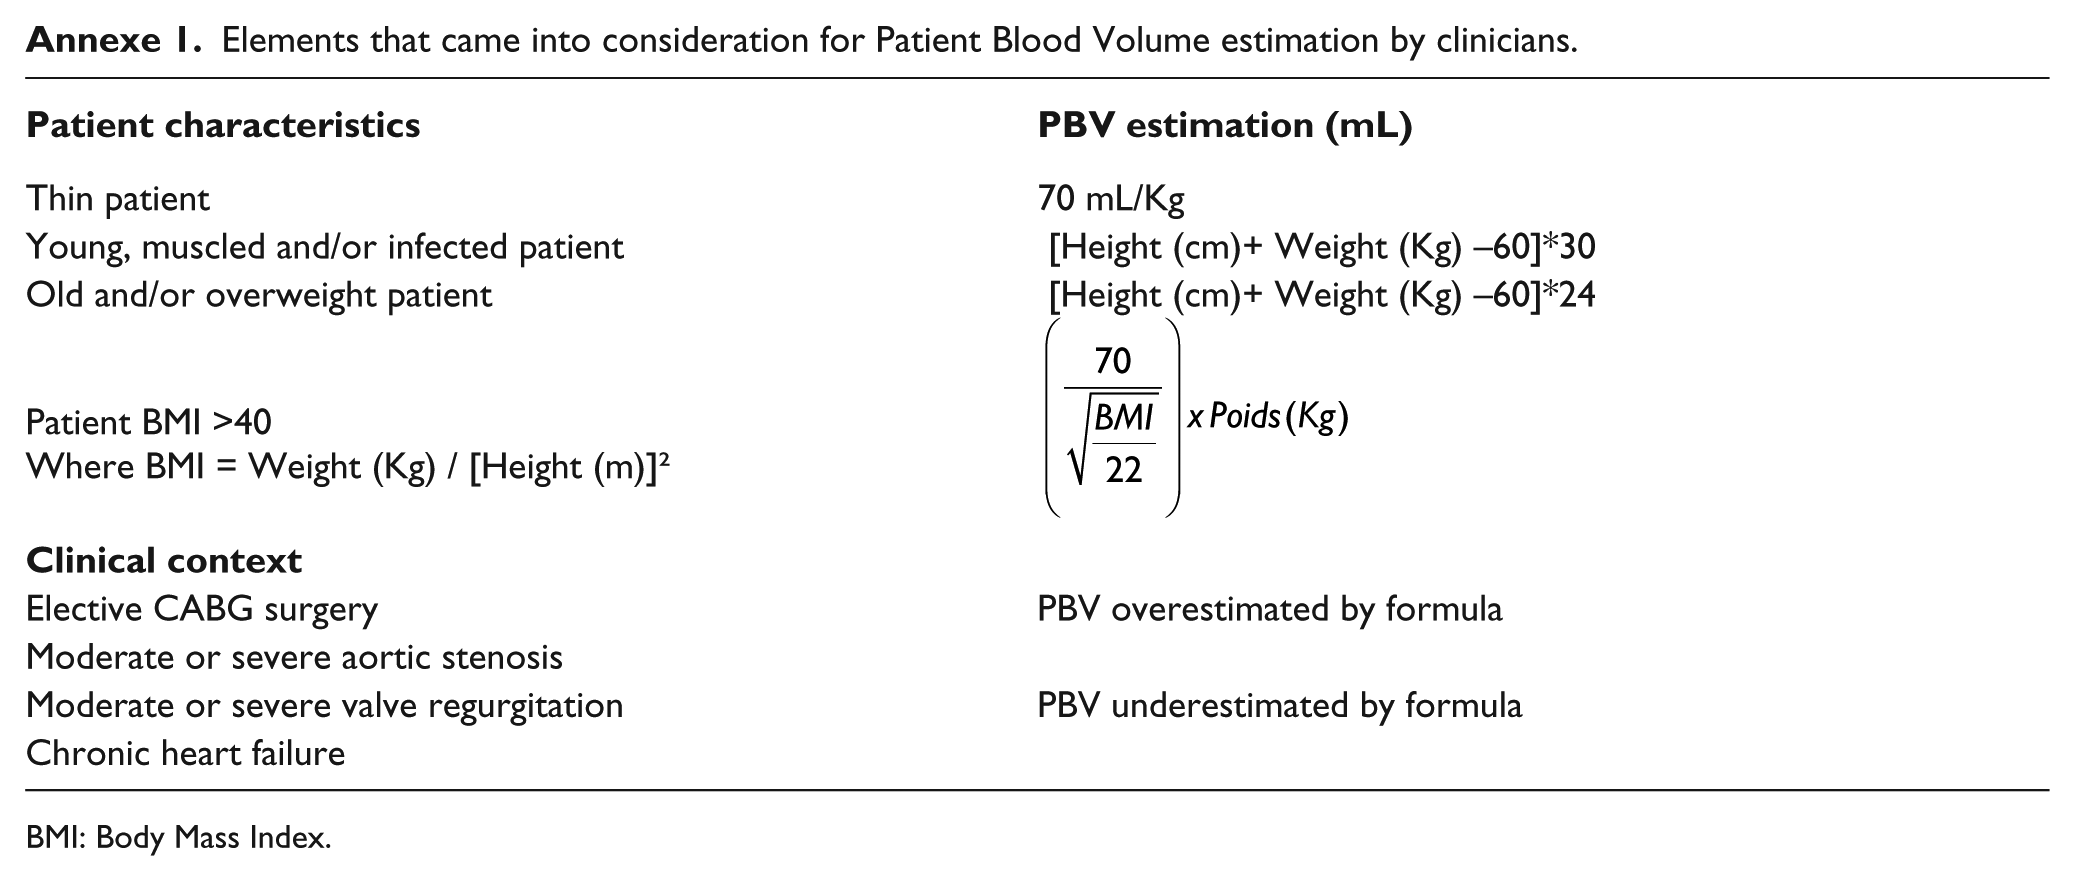
Elements that came into consideration for Patient Blood Volume estimation by clinicians.
|
|
|
| Thin patient | 70 mL/Kg |
| Young, muscled and/or infected patient | [Height (cm)+ Weight (Kg) –60]*30 |
| Old and/or overweight patient | [Height (cm)+ Weight (Kg) –60]*24 |
| Patient BMI >40 Where BMI = Weight (Kg) / [Height (m)]² |
|
|
|
|
| Elective CABG surgery | PBV overestimated by formula |
| Moderate or severe aortic stenosis | |
| Moderate or severe valve regurgitation | PBV underestimated by formula |
| Chronic heart failure |
BMI: Body Mass Index.
Acknowledgements
We thank the ECCP team (Théophile Amand, Francine Blaffart, Marie Pierre Fissette, Jean Noel Koch, Dominique Hella and Marc-Gilbert Lagny) for their input during data collection, Professor Georges Rorive for reviewing and Caroline Van Boven for help in translation.
Declaration of Conflicting Interest
The author(s) declared no potential conflicts of interest with respect to the research, authorship, and/or publication of this article.
Funding
The author(s) received no financial support for the research, authorship, and/or publication of this article.