
Abstract
Aim:
We explored the relationship between activated clotting time (ACT) and activated partial thromboplastin time (aPTT) when used to monitor anticoagulation in patients undergoing extracorporeal membrane oxygenation (ECMO) support.
Methods:
Data obtained in patients undergoing ECMO support between October 2012 and August 2013 in a single centre were reviewed. Clinical data were extracted from our Clinical Information System and ECMO database. ACT and aPTT values were paired when taken from the same patient, with the ACT preceding the aPTT and the heparin infusion rate was kept constant between samples. The aPTT and ACT were normalized by dividing by the mean of their respective reference ranges and are referred to as APR and N-ACT, respectively. Bivariate analysis and Bland-Altman plots were used to assess correlation and agreement. Mixed effects regression was used to model the effects of variables, including platelet count, creatinine and urea levels, plasma free haemoglobin, white cell count and ECMO flow rate on concordance between APR and N-ACT measurements.
Results:
The Pearson product-moment correlation coefficient in 15 patients was calculated as r=0.55. The Bland-Altman plot shows a mean difference between the APR and the N-ACT of −0.08. The 95% limits of agreement were −0.67 to 0.51. Results from mixed effects regression analysis on data from the 15 patients identified platelet count (and thrombocytopenia) and urea as significant independent predictors of concordance between APR and N-ACT.
Conclusion:
We report a moderate degree of positive correlation between APR and N-ACT. We conclude that there is poor agreement between the ACT and aPTT for the heparin concentrations in patients supported with ECMO. Our results indicate that platelet count and urea are significant independent variables affecting concordance between ACT and aPTT measurements.
Introduction
Patients undergoing extracorporeal membrane oxygenation (ECMO) support are usually anticoagulated with intravenous unfractionated heparin (UFH) to prevent clot formation through blood contact with non-biological surfaces encountered in the extracorporeal circuit. 1 Achieving correct control of coagulation is difficult and both haemorrhage and thrombosis are leading complications of ECMO. 2 The response to heparin is highly variable and no consensus exists on the tests that should be used to monitor the adequacy of anticoagulation. There are a number of additional complexities when optimizing anticoagulant control for circulatory assist circuits and devices, such as the length of tubing, surface coating of the tubing and oxygenator, the flow pattern (continuous vs pulsatile) and the intersection points of the circuit with the patient’s circulation. 3
Several assays can be used in the monitoring of unfractionated heparin. Most centres use any combination of activated clotting time (ACT), activated prothrombin time (aPTT) and anti-Xa levels. The results from these assays can vary from centre to centre, between types of patients and even within the same patient.
We present a retrospective study of the performance of aPTT compared to low range ACT in a single centre and explore possible confounding factors.
Methods
We conducted a retrospective service evaluation of data obtained in 34 consecutive adult patients who underwent veno-venous (VV) or veno-arterial (VA) ECMO support between October 2012 and August 2013 in a single centre in the UK. Given the retrospective nature and absence of treatment intervention or randomisation, ethical approval was not required by our ethics committee. Institutional approval to analyse these data was granted. Both VV and VA ECMO provide respiratory support to patients, with VA ECMO additionally providing haemodynamic support. Results from blood samples taken from all patients undergoing ECMO during this time period were extracted from the Clinical Information System and processed using Excel 2010 (Microsoft, Redmond, WA, USA). In accordance with our protocol, the ACT was sampled four times per day and the APR (aPTT ratio, calculated by dividing aPTT by the mean of the reference range) was sampled twice a day, when changes to the circuit were made and when the patient’s clinical condition changed.
The ACT was obtained at the bedside using Maxact ACT® (Helena Laboratories, Beaumont, TX, USA) containing an activator cocktail of glass particles, kaolin and cellite. The aPTT was measured in the laboratory using SynthasIL® (Colloidal Silica and synthetic phospholipid activator) reagent on an IL TOP analyser (Instrumentation Laboratory, Warrington, UK).
In order to allow direct comparison of the aPTT and ACT, results were normalized: the aPTT was normalized by dividing the actual value by the mean of the local reference range (31s) and is known as the APR (aPTT ratio) in UK clinical practice; the ACT was normalised (N-ACT) by dividing the actual result by 118s (mean of the reference range provided by the manufacturer). The APR and N-ACT were paired when taken from the same patient, with the ACT always preceding the aPTT, and the heparin infusion rate was kept constant throughout the time between samples as we used the aPTT/APR for heparin dosing in the clinical care of our patients.
Statistical analyses
Statistical analyses were carried out using Medcalc for Windows, version 13.1.2.0 (MedCalc Software, Ostend, Belgium) and Stata/SE 13.1 for Mac (StataCorp LP, College Station, TX, USA). For comparison of the N-ACT and APR measurements, pairs for all patients were plotted on scatter plots, bivariate analysis was carried out and the Pearson product-moment correlation coefficient was calculated. Bland-Altman plots 4 were constructed with 95% confidence intervals (CI) shown. To verify whether time interval between paired N-ACT and APR measurements affected the results, the analyses were repeated with the inclusion criteria amended such that the time between N-ACT and APR measurements was less than 2 minutes. For examination of variables affecting N-ACT and APR concordance, mixed effects regression was used to model the effects of platelet concentration (as well as thrombocytopenia, defined as platelets <80x109/L), creatinine, urea, plasma free haemoglobin, C-reactive protein (CRP), white cell count and ECMO flow rate on absolute difference between paired N-ACT and APR measurements across the 15 patients, with the patient included as a random effect. Analyses were adjusted for patient age and gender. P<0.05 was considered to be statistically significant.
Results
Comparison of N-ACT and APR
Of 34 patients identified, 15 were retained for analysis (19 were excluded as they had fewer than 5 matched pairs of N-ACT and APR available).
In the retained sample (N=15: 11 males, 4 females), the mean patient age was 45.8 (SD: 14.1). A total of 675 matched result pairs of N-ACT and APR were obtained from these 15 patients.
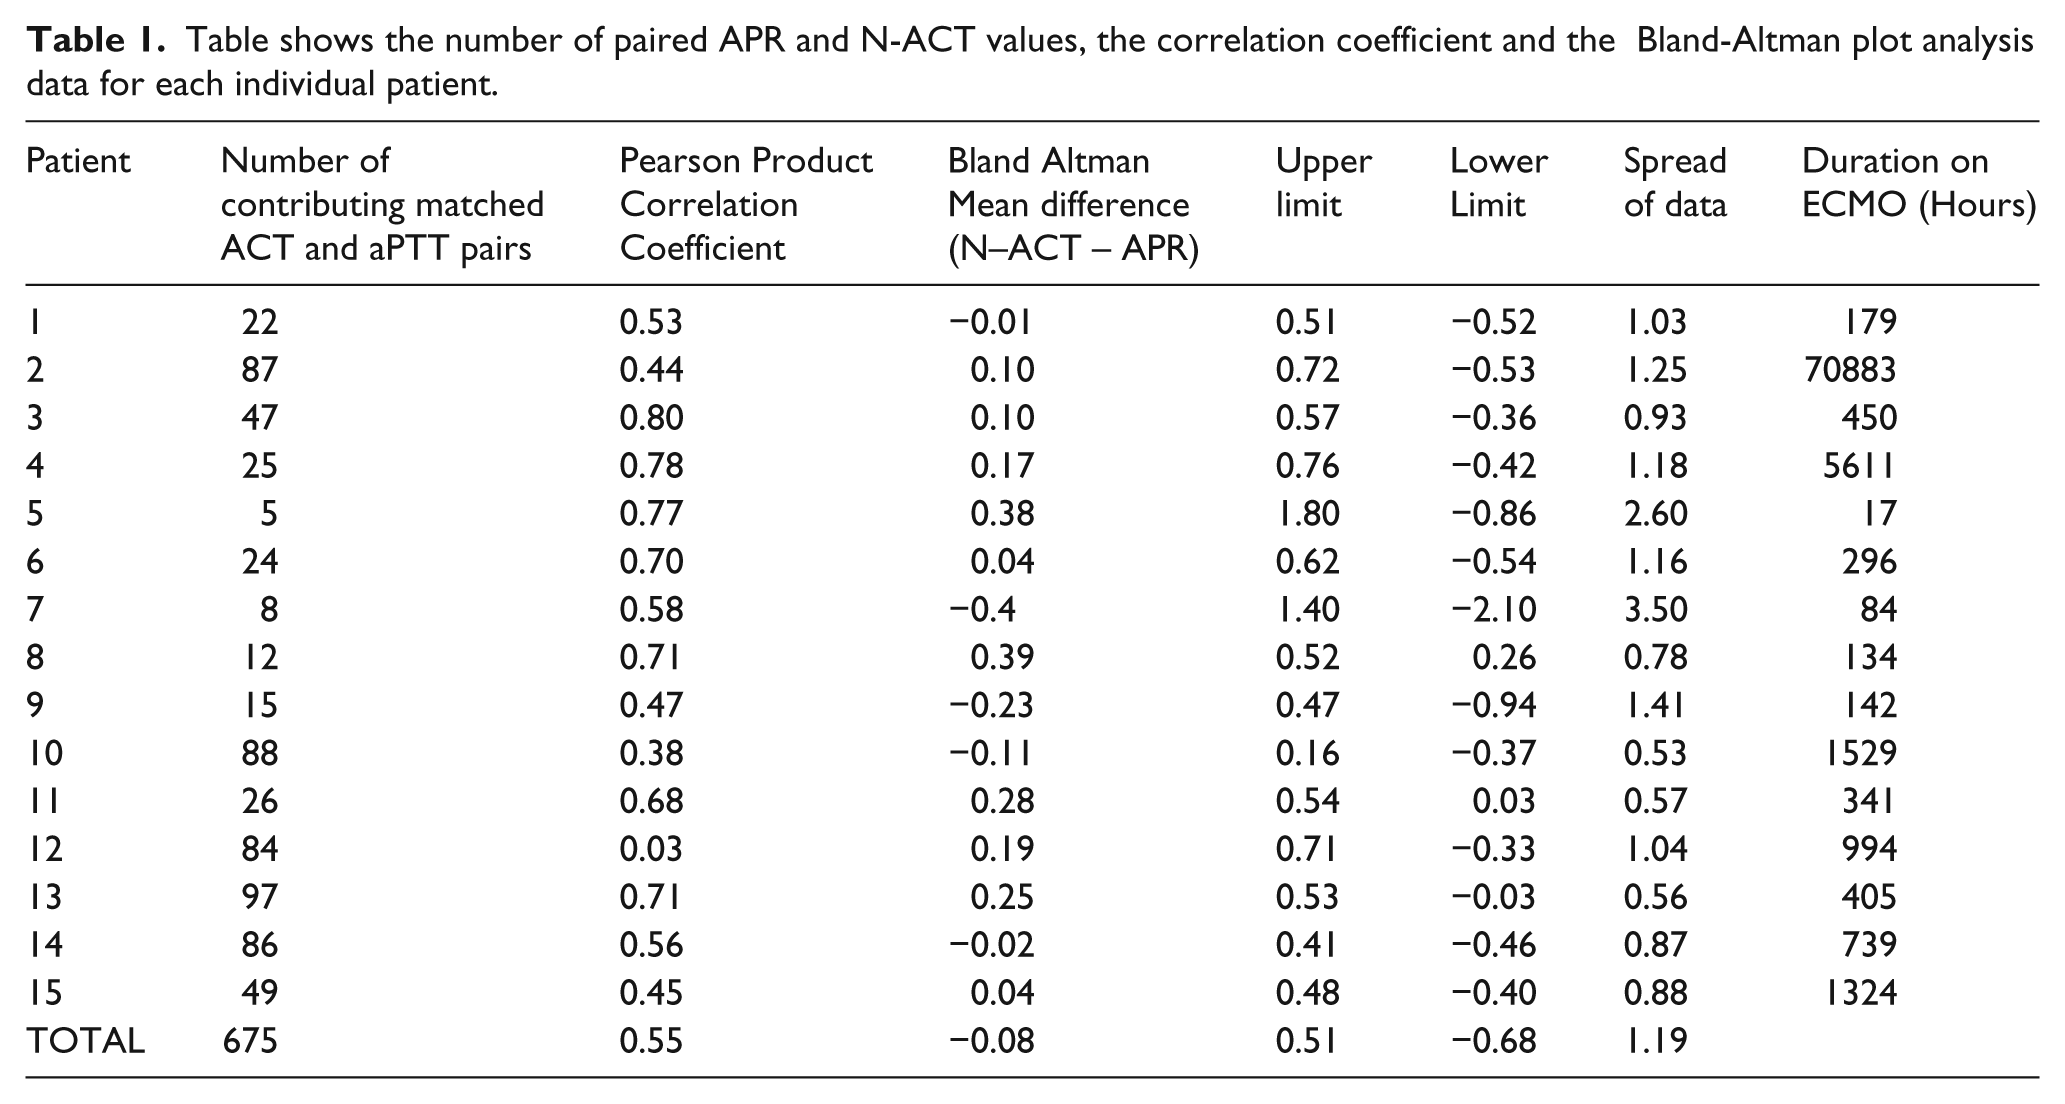
The data were pooled and the N-ACT was plotted against the APR (Figure 1). Table 1 shows the number of matched pairs each patient contributed to the pooled data and the correlation coefficient and results of the Bland-Altman analysis for each patient.
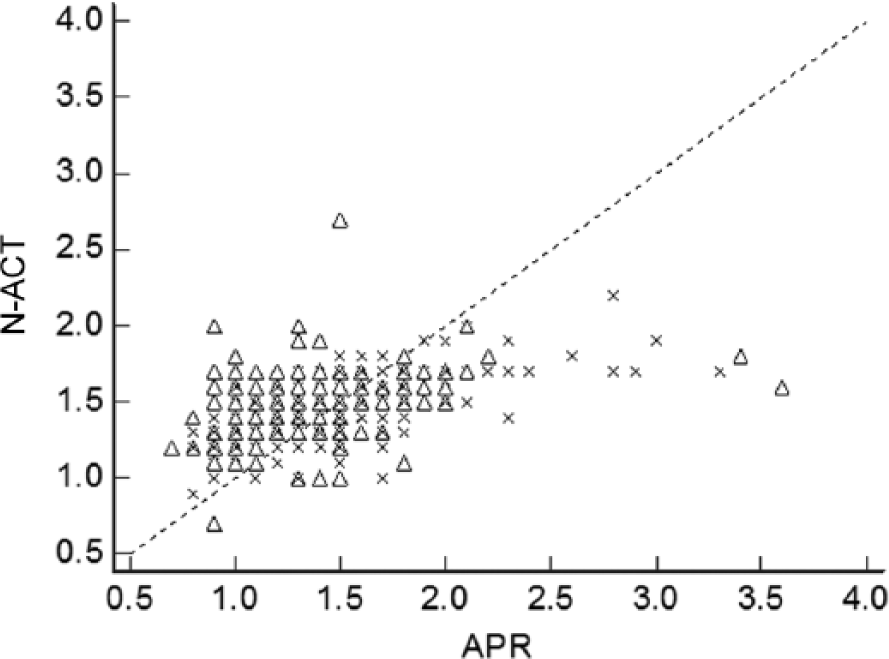
Graph showing the relationship between APR and N-ACT. Survivors are shown by crosses and non-survivors are shown by triangles. Note that the total number of crosses and triangles on the graph is less than the total 675 as some represent data with the same paired values.
Table shows the number of paired APR and N-ACT values, the correlation coefficient and the Bland-Altman plot analysis data for each individual patient.
Correlation between N-ACT and APR measurements was r=0.55 (95% CI 0.50 to 0.60; p<0.0001). Using the amended criteria (ACT and aPTT samples taken within 2 minutes of each other), a sample size of 178 was created and this demonstrated a correlation coefficient of 0.46 (95% CI 0.33 to 0.57; p<0.0001). From the analysis of the Bland-Altman plot (Figure 2), the mean difference between the calculated APR and N-ACT was −0.08 with the N-ACT being recorded (on average) as the higher ratio. The limits of agreement (mean difference +/− 1.96 standard deviations) demonstrate a wide spread of data (−0.67 to + 0.51) and suggests that agreement between APR and N-ACT is poor. When the analysis was repeated using the amended criteria, the Bland-Altman plots demonstrated a mean difference of −0.1 and a wide spread of data (−0.81 to +0.60). The mean absolute difference between paired N-ACT and APR measurements was 0.24 (SD: 0.20).

Bland-Altman plot of data collected from 15 individuals. Survivors shown by crosses and non- survivors shown by triangles. Note that the total number of crosses and triangles on the graph is less than the total 675 as some represent data with the same paired values.
Variables affecting N-ACT and APR agreement
Univariate analyses indicated that platelet count (as well as thrombocytopenia), creatinine and urea are potential variables affecting N-ACT and APR concordance. Mixed effects multiple regression analyses including the patient as a random effect and adjusting for age and gender revealed that platelet count (adjusted coef = −0.0006, 95% CI −0.0009 to −0.0003, p<0.0001) and urea (adjusted coef = 0.0071, 95% CI 0.0037 to 0.0106, p<0.0001) were independent predictors of concordance between N-ACT and APR measurements. When the platelet count was defined as “thrombocytopenia” as opposed to actual count, results from the same mixed effects model revealed that thrombocytopenia (adjusted coef = 0.0890, 95% CI 0.0300 to 0.1482, p=0.003) and urea (adjusted coef = 0.0062, 95% CI 0.0027 to 0.0097, p=0.001) revealed similar results, suggesting that, with every instance of thrombocytopenia, we can expect an increase of 0.0890 in absolute difference between a paired N-ACT - APR measurement. None of the other variables was significantly associated with N-ACT and APR agreement.
Discussion
We have demonstrated that, despite a moderate degree of positive correlation between the N-ACT and the APR, agreement between the assays is poor.
Both heparin-monitoring assays are based on activation of the intrinsic pathway of coagulation. Historically, the protamine titration assay is considered the gold standard assay; however, aPTT/APR measurements are now the standard assay used for the titration of UFH therapy. Most hospitals in the UK have a dosing flow chart for aPTT/APR to allow unfractionated heparin dosing per adjustment of infusion rate.
ACT is a point-of-care coagulation test, originating from the Lee-White coagulation time 5 and is used to monitor UFH therapy when intense short-term anticoagulation is required with levels of >1U/ml, such as during cardiac bypass. 5 The ACT is also used for UFH monitoring in some centres, even when UFH targeted levels are <1U/ml. The desired range for ACT varies between centres, but the aim is a similar relative prolongation of clotting time compared to baseline ACT as for the aPTT. 5
In a 2013 survey of Extra-corporeal Life Support Organisation (ELSO) registered ECMO centres, 97% of respondents use the ACT as a tool to monitor heparinisation. The aPTT was used by 94% in addition to the ACT on a regular basis, with a variation in therapeutic ranges between centres. 6 Despite being the most widely used assay, the aPTT is not standardized between hospitals like, e.g., the international normalized ratio (INR), with different sensitivities of reagents and reference ranges. 7
We have demonstrated for the first time in a regression model that platelet count and urea are independent predictors of agreement between the ACT and the APR.
Reducing platelet counts and increasing urea and creatinine concentrations are related to worsening of agreement between the assays. This could explain some of the discrepant results other investigators have found. ECMO patients are critically ill, with a proportion suffering from thrombocytopenia at some stage. The cause of respiratory failure and the degree of multi-organ failure will vary between patients and concomitant events, such as septic episodes, will introduce additional levels of complexity, 8 leading to intra- and inter-individual variation. Sepsis will upregulate clotting factors that are acute phase proteins, such as factor VIII. Microbial invasion of the bloodstream may cause disseminated intravascular coagulation, with consumption of clotting factors and platelets resulting in coagulopathy and organ failure. 9
Changes in the composition of whole blood and plasma volume (i.e., platelet count, haematocrit or a combination thereof), changes in platelet function and clotting factor levels over time and contact factor activation 10 are likely to affect plasma and whole blood assays in a slightly different fashion. It is well known that haemostasis is altered in uraemic patients. 11 The exact contributing mechanisms are unknown. However, it is possible that the platelet-fibrinogen interaction is disturbed in uraemic states.
A few studies have previously explored the relationship between the aPTT and the ACT in adult patients undergoing ECMO. Atallah et al. investigated the relationship between the heparin dose and the ACT and aPTT and concluded that the heparin dose correlated better to the aPTT. It was the ACT that was used to adjust the heparin dose in their patients in this study and the observed correlation between ACT and aPTT was 0.41. 12
Others have explored the relationship of ACT, aPTT and heparin/antiXa level outside the setting of ECMO. In adults, Koerber et al. found that the aPTT showed a better correlation to the heparin infusion rate than the ACT in unselected adult patients commencing intravenous UFH therapy. They noted good correlation, but significant differences between aPTT and ACT, with the aPTT generally correlating better to the plasma heparin concentration. 13 DeWaele et al. have analysed patients in the intensive care unit setting and found similar results showing a significant correlation between ACT and aPTT despite significant differences that varied dependent on the intensity of anticoagulation, making it difficult to substitute one method for another. 14
Bosch et al. examined factors that determined poor heparin response on cardiopulmonary bypass of the ACT to doses of 300-400 U/kg of UFH. They found that 10% of patients showed reduced responses and that those patients often had higher platelet counts, lower haemoglobin and equivalent antithrombin levels compared to the normal responders, but that this was not statistically significant. 15
Conclusion
We have demonstrated that, despite a moderate degree of positive correlation between the N-ACT and the aPTT, agreement between the assays is poor.
We have shown for the first time in a regression model that platelet count and urea are independent predictors of agreement between the ACT and the APR.
Reducing platelet counts, increasing urea and creatinine concentrations are related to worsening of agreement between the assays.
A comparison of results should be made with caution. Centres must carefully decide on which test to base their heparin-dosing regimen and this will have to be reviewed on an individual basis.
Footnotes
Declaration of Conflicting Interests
The author(s) declared the following potential conflicts of interest with respect to the research, authorship, and/or publication of this article: MW Besser received an honorarium from GlaxoSmithKline.
Funding
The authors received no financial support for the research, authorship and/or publication of this article.