
Abstract
Introduction:
By analyzing epidemiological trends in cardiovascular disease (CVD), key stakeholders can make informed decisions on the future of disease burden and treatment. Accordingly, the cardiovascular perfusion community would benefit from data that would help predict future professional resource utilization.
Methods:
In 2003, the changes in the number of hospital discharges for CVD from 1990 to 2000 were published, based on data from the National Center for Health Statistics (NCHS). In this study, the NCHS database was reviewed, as well as other resources, to compile the procedure data.
Results:
Deaths due to heart disease and the number of hospital admissions for CVD have decreased over the last decade in contrast to the previous decade. Acute myocardial infarction (AMI), cardiac catheterization and angioplasty rates have also decreased. However, the percentage of the population older than 65 years of age is increasing at a much faster rate than the population growth in general. As a result, there has been a consistent increase in cardiac services utilization, such as transcatheter aortic valve replacement (TAVR), ventricular assist devices and extracorporeal life support (ECLS).
Conclusions:
There are many different factors affecting the need for perfusionists in the future. An increasing and aging population with a higher prevalence of CVD, an increased number of hospitals offering cardiovascular services and increased access to care increases the need for perfusion services. It is important for the perfusion profession to follow these changing trends in CVD and treatment in order to plan for the future.
Introduction
The World Health Organization (WHO) defines epidemiology as “the study of the distribution and determinants of health-related states or events (including disease) and the application of this study to the control of diseases and other health problems”. By analyzing epidemiological trends in cardiovascular disease (CVD), key stakeholders can make informed decisions on the future of disease burden and treatment. Therefore, the measurement and tracking of disease in a population is enormously important for policy planning. Accordingly, the cardiovascular perfusion community would benefit from data that would help predict future procedural and professional resource utilization.
In 2003, data was published to compare the changes from 1990 to 2000, based on the number of hospital discharges related to CVD. 1 Findings of the previous study demonstrated that the surgical treatment rates for ischemic heart disease had increased 36.2% between 1990 and 2000. The volume of coronary artery bypass graft (CABG) procedures increased 40.2% and valve procedures increased 53% over this 10-year period. Between 1990 and 2000, there was a 43% increase in the number of patients admitted for congestive heart failure. 1 The 1990s was a period of growth for cardiac surgery and the number of perfusion schools and perfusion graduates peaked in the middle of the decade. The purpose of this study was to review the epidemiology of CVD in the United States since 2000 and project treatment patterns and the need for perfusionists in the future.
Methods
Discharge data from the National Center for Health Statistics (NCHS) were used to determine numbers and rates of patients treated for CVD. Hospital discharge rates for various categories of CVD were reviewed to establish the changing patterns of hospitalization of patients requiring treatment. These data were recorded in terms of both the total volume change over the time period as well as the hospital discharge rate per 100,000 population. Unfortunately, the annual hospital discharge data from NCHS was discontinued after 2010. Therefore, other references were used to provide updated trend data. Data from the Society of Thoracic Surgery Database Reports were used for surgical data and The Society of Thoracic Surgeons (STS)/Transcatheter Valve Therapy (TVT) Outcome Reports were used for compiling the number of transcatheter aortic valve (TAVR) procedures. The Extracorporeal Life Support Organizations (ELSO) International Summary Report in January 2015 was used to estimate ECLS growth. Data from the American Board of Cardiovascular Perfusion Annual Report was used to determine the increase in the number of perfusionists and attrition rate/year.
Results
Epidemiology of CVD in the U.S.
Heart disease remains the number one cause of death in the U.S., with 23.5% of all deaths attributed to heart disease (650,000 annually). In the last two decades, there has been a significant decrease in deaths from heart disease, with a 37% decrease in death rates in the non-Hispanic white population and a 20% decrease in the death rate in the African American population. 2 The projected annual cost for the treatment of heart disease in the U.S. is estimated to be $71 billion. 3 Heart failure today affects 5.7 million people and is projected to reach more than 8 million by 2030. 4
There have been some interesting changes in the diagnosis and treatment of heart disease during the past decade. Between 1995 and 2010, there was a 36% decrease in the number of doctors’ office visits related to angina from 3.6 million 1995 to 2.3 million in 2010. The mean age of a first myocardial infarction increased to 65 years of age for men and 72 years of age for women. 5
Population growth and aging
Between 2000 and 2010, the population of the U.S. increased by 32.6 million, the greatest increase in any decade. In 2016, the U. S. population was 326 million. 6 The population over 65 years of age was 45 million and is expected to increase to 70 million by 2030. The U.S. population >75 years of age will quadruple over the next 50 years. It is estimated that two-thirds of Americans >65 will have some form of heart disease.7,8
Rates of hospital discharges
The total number of hospital discharges related to CVD decreased from 2000 to 2010 by 15% in contrast to a 23% increase over the previous decade. (Table 1) The rate per 100,000 population also decreased by 22%. The number of patients discharged related to ischemic heart disease decreased by 49%, with a rate/100,000 decrease of 59%. However, hospital discharges related to heart failure continue to increase and the increase for the last decade was 2%. 9
Comparison of the total number of hospital discharges related to cardiovascular disease from 1990 to 2010, with a breakdown by ischemic heart disease and congestive heart failure from the Hospital Discharge Summary Report 2010, National Center for Health Statistics.
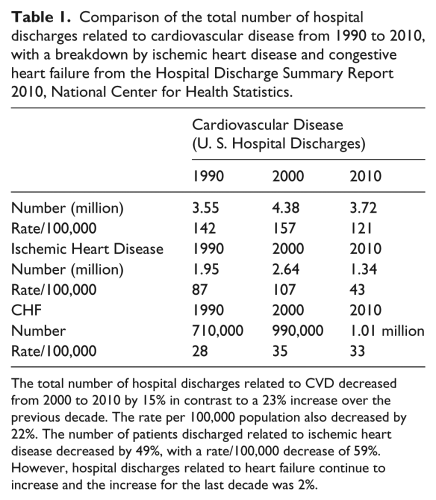
The total number of hospital discharges related to CVD decreased from 2000 to 2010 by 15% in contrast to a 23% increase over the previous decade. The rate per 100,000 population also decreased by 22%. The number of patients discharged related to ischemic heart disease decreased by 49%, with a rate/100,000 decrease of 59%. However, hospital discharges related to heart failure continue to increase and the increase for the last decade was 2%.
Rates of interventional procedures
From 2000-2010, cardiac catheterization procedures have declined 19% and the rate/100,000 population by 24%. The number of angioplasty procedures between 2000-2010 decreased by 7% and the rate/100,000 population by 42%. 9 (Table 2)
Comparison of the total number of cardiac catheterization and angioplasty procedures from 1990 –2010 from the Hospital Discharge Summary Report 2010, National Center for Health Statistics.
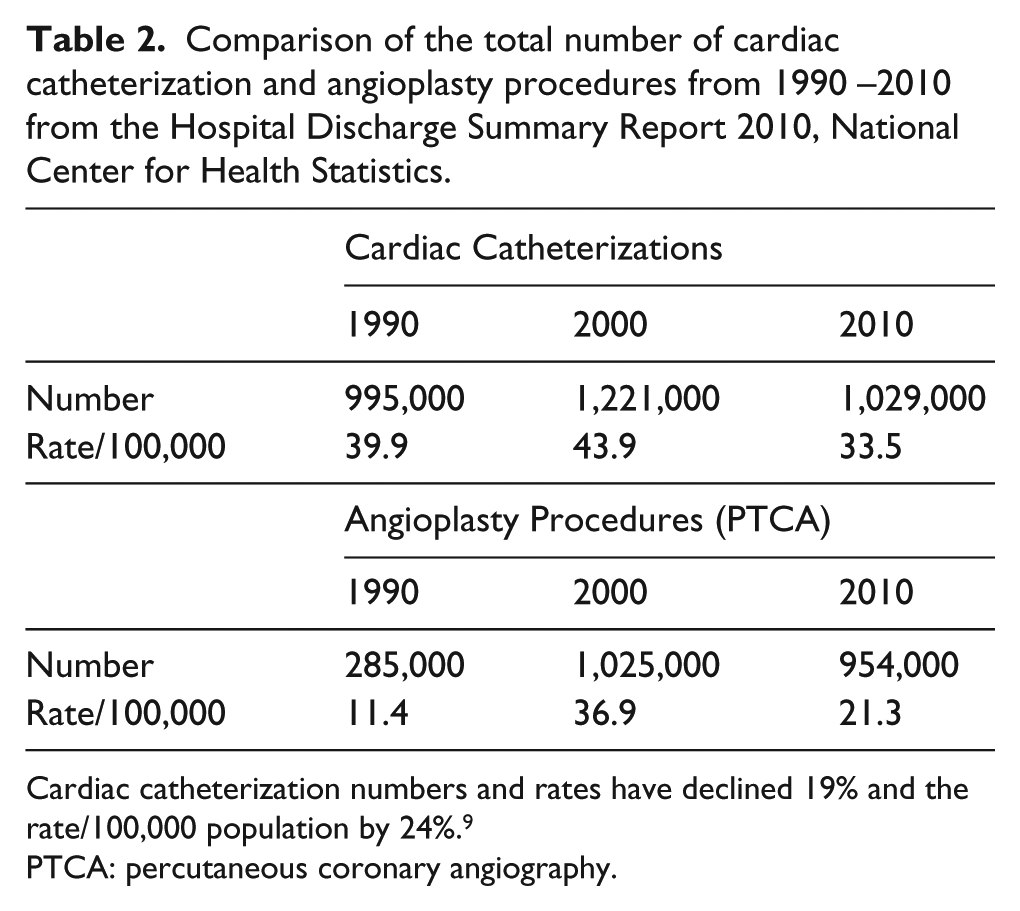
Cardiac catheterization numbers and rates have declined 19% and the rate/100,000 population by 24%. 9
PTCA: percutaneous coronary angiography.
The impact of TAVR (transcatheter aortic valve replacement) and catheter-based mitral valve (MV) repair or replacement is not fully known at this time; however, it is increasing the population of patients eligible for treatment and deferring some patients who were surgical candidates for valve replacement in the past. The number of TAVR procedures has increased every year since starting in 2012 with 4,627 procedures. In 2013, there were 6,075 TAVR procedures and increased to 24,808 TAVR procedures in 2015. In addition, from 2013 to 2015, 3,745 transcatheter mitral clip (TMC) procedures were performed. 10 (Table 3)
Number of Transcatheter valve procedures 2012-2016 from the Annual Report of the Society of Thoracic Surgeons/American College of Cardiology Transcatheter Valve Therapy Registry.
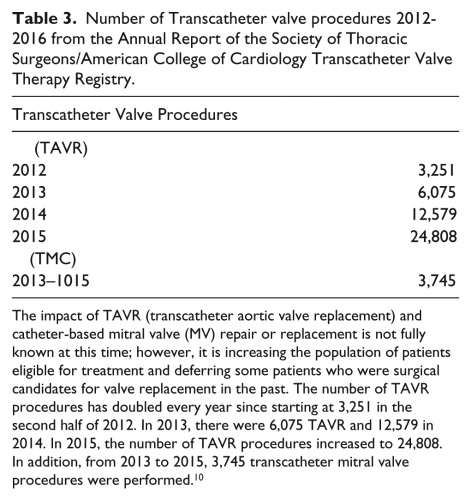
The impact of TAVR (transcatheter aortic valve replacement) and catheter-based mitral valve (MV) repair or replacement is not fully known at this time; however, it is increasing the population of patients eligible for treatment and deferring some patients who were surgical candidates for valve replacement in the past. The number of TAVR procedures has doubled every year since starting at 3,251 in the second half of 2012. In 2013, there were 6,075 TAVR and 12,579 in 2014. In 2015, the number of TAVR procedures increased to 24,808. In addition, from 2013 to 2015, 3,745 transcatheter mitral valve procedures were performed. 10
Rates of surgical procedures
After peaking in 1996, isolated coronary artery bypass (CABG) procedures have shown a steady decline since 2000 by approximately 46%. Valvular disease is estimated to have a prevalence in the population of 2.9%. The incidence rates/100,000 population is stable for valve replacement and the increase in cases is due to increases in the number of the elderly population. 7 Aortic aneurysm surgery has reportedly shown steady increases from 10 to 20% across cardiothoracic (CT) surgical programs. 7 Heart failure continues to increase with the aging population. At 80 years of age, the lifetime risk of heart failure is 20%. Heart failure today costs $30.7 billion and projected to cost $67 billion by 2030. 4
STS surgical volumes
Data entry into the Society of Thoracic Surgeons (STS) database is voluntary, but participation has increased from 380 cardiac surgical centers in 1999 to 1046 in 2015. The STS database is estimated to capture 90-95% of the adult cardiac surgical volume and 95% of the pediatric cardiac surgical volume. 11 In 2015, the total number of adult cardiac surgical procedures was 286,149. As the number of cardiac centers participating in the STS database has continued to increase, the average number of cardiac cases/institution has decreased from 553 in 1999 to 274 in 2015. 12 The total number of isolated coronary artery bypass graft (CABG) procedures decreased slightly from 161,733 to 151,474 over the last 10-year period (2006-2015). 10 The result was that the number of isolated CABG procedures per center decreased from 203 to 145. (Table 4). Over the past 10 years, the mean number of surgical valve procedures (not including TAVR) per center has increased slightly from 72 to 78, with a total number of 81,895 surgical valve procedures (not including TAVR) in 2015. (Table 5) 12
Number of isolated coronary artery bypass procedures from 2006-2015 from the STS Adult Cardiac Surgery Database Executive Summary 10 Years 2016.
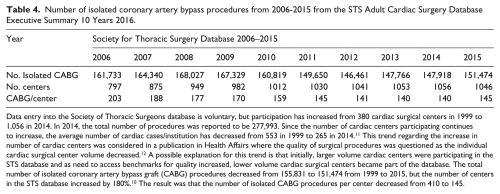
Data entry into the Society of Thoracic Surgeons database is voluntary, but participation has increased from 380 cardiac surgical centers in 1999 to 1,056 in 2014. In 2014, the total number of procedures was reported to be 277,993. Since the number of cardiac centers participating continues to increase, the average number of cardiac cases/institution has decreased from 553 in 1999 to 265 in 2014. 11 This trend regarding the increase in number of cardiac centers was considered in a publication in Health Affairs where the quality of surgical procedures was questioned as the individual cardiac surgical center volume decreased. 12 A possible explanation for this trend is that initially, larger volume cardiac centers were participating in the STS database and as need to access benchmarks for quality increased, lower volume cardiac surgical centers became part of the database. The total number of isolated coronary artery bypass graft (CABG) procedures decreased from 155,831 to 151,474 from 1999 to 2015, but the number of centers in the STS database increased by 180%. 10 The result was that the number of isolated CABG procedures per center decreased from 410 to 145.
Number of surgical valve procedures (excluding TAVR) from 2006-2015 from the STS Adult Cardiac Surgery Database Executive Summary 10 Years 2016.
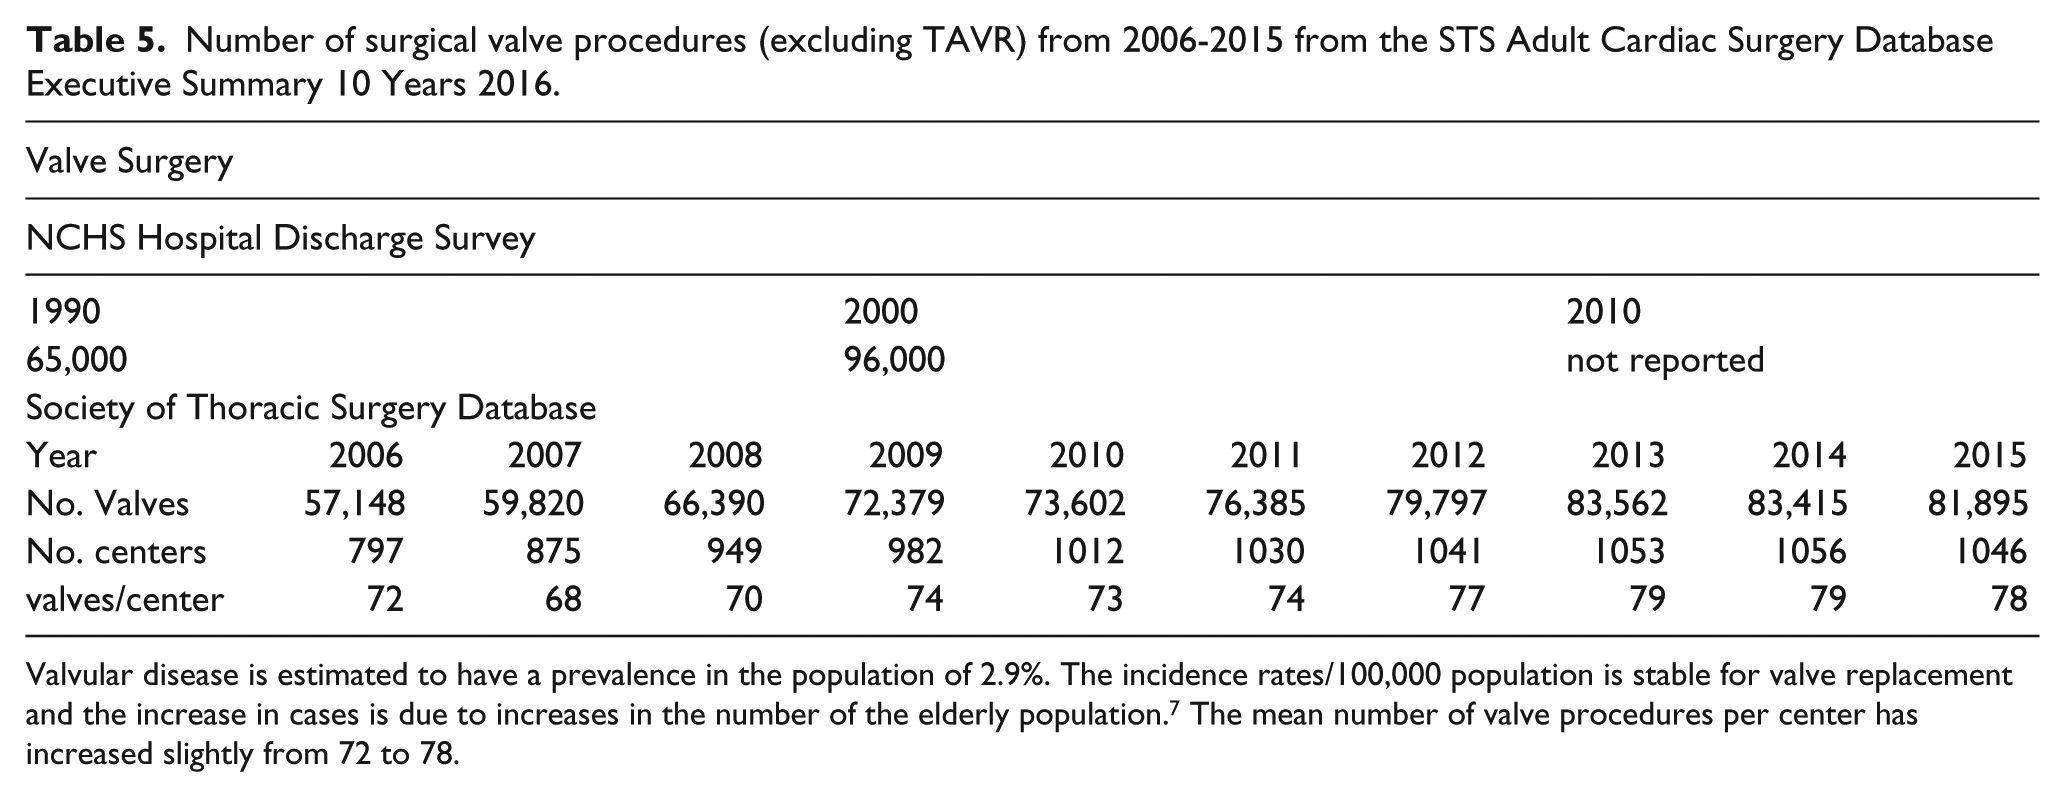
Valvular disease is estimated to have a prevalence in the population of 2.9%. The incidence rates/100,000 population is stable for valve replacement and the increase in cases is due to increases in the number of the elderly population. 7 The mean number of valve procedures per center has increased slightly from 72 to 78.
Since 2010, the number of centers participating in the STS database annually has exceed more than 1000 centers and is leveling off. The total number of ventricular assist devices reported in the STS database implanted in 2015 was 5,274 which is a 23% growth rate per year since 2010. Cardiac transplants also increased from 1367 to 1687, a 5% increase per year since 2010. The number of aortic aneurysm surgical procedures in the STS database from 2010 to 2015 decreased by 5% from 13,947 to 13,113. 12
According to the Extracorporeal Life Support (ECLS) International Summary Report, the annual number of ECLS procedures has increased from 3,410 in 2010 to 7901 in 2015. That represents a 131% increase over this time period or 26% per year. The number of ECLS centers also increased from 178 to 310 (15% per year) over the same time period. 13
Perfusion manpower
The total number of certified perfusionists by the American Board of Cardiovascular Perfusion increased by 20% from 3,375 in 2000 to 4,135 in 2015, which is an annual growth rate of 1.4%. New certifications average 143 per year and the attrition rate of “lost certifications” is a mean of 84/year over the past 15 years. 14
The future of the cardiothoracic surgery profession
After peaking in 1992 at 1.2% of the medical school graduates applying, in 2004, only 0.3% of medical school graduates applied to CT residency programs. The number of CT residency positions filled/available decreased from 100/132 in 2007 to 88/113 in 2010. The total number of CT surgeons has decreased since 2003. Cardiothoracic surgeons are older than other specialties with >50% older than 55 years of age. The average age of retirement for CT surgeons is now 61 years of age, with 60% retiring by 65 and only 15% still active between 65 and 74. The reality is that, by 2025, there is expected to be a shortage of at least 1500 surgeons or 25% of the projected number of surgeons needed to care for the patient population. 15
Discussion
The trends showing a decrease in the incidence of hospitalizations and treatment for CVD are striking, considering the aging of the populations. An important marker for coronary artery disease in a population is the incidence of acute myocardial infarctions (AMI) and this has also decreased 4.23% from 1996-2006. Interestingly, the rate of CABG declined at a similar rate of 4.9% per year during the same time period. Explanations for this decline in death rates due to heart disease and angina may be related to the decline in smoking, better treatment of hypertension with beta blockers and angiotensin converting enzyme (ACE) inhibitors and healthier lifestyles, including diet and exercise. However, other explanations for the decline may also include barriers to treatment, such as access to care and lack of health insurance. Underuse of treatment is defined as “failure to provide a health care service when it would have produced a favorable outcome”. 7 Reasons for underuse of treatment may be attributed to a lack of a cardiology referral due to inadequate medical insurance. Studies have demonstrated that Medicaid patients are less likely to receive percutaneous coronary angiography (PTCA) or CABG than non-Medicaid patients. 7 In addition, the availability of comprehensive and advanced care services factor into treatment patterns. Patients with AMI who have to be transferred to another hospital or admitted on weekends have a higher mortality rate and a lower incidence of invasive cardiac procedures. 7 A recession in the US economy occurred between 2007 and 2010. Unemployment increased from just under 5% to 10%. The uninsured non-elderly population increased from 16% to more than 18%. This may have resulted in decreased access to care and delayed treatment, which reduced the number of admissions for CVD in 2010. 16 These trends may have reversed due to the Affordable Care Act. The Affordable Care Act has reduced the number of the uninsured non-elderly population to 10.7%; however, the lower rate of uninsured non-elderly is not evenly distributed among the states because some states have not participated in Medicaid expansion under the Affordable Care Act.
When the STS database was started, larger-volume cardiac centers started to participate in the beginning. As the need to access benchmarks for quality improvement increased, lower-volume cardiac surgical centers joined the database. The number of cardiac surgical centers is increasing due to the number of centers performing interventional procedures. This trend regarding the increase in the number of cardiac surgical centers was also considered in a publication in Health Affairs where the quality of surgical procedures was questioned as the individual cardiac surgical center volume decreased. 17 The shortage of perfusionists in some areas of the country that we are currently experiencing may be related to the expansion in the number of cardiac centers.
Since the perfusion profession is so intimately linked to the practice of cardiothoracic (CT) surgery, it is essential to recognize the same issues that are challenging our surgical colleagues. One surgeon wrote that the “excitement in the field is no longer apparent”. 15 In order to address this projected shortage, CT Surgery Residency programs have adopted an alternative training process of six years. Prior to that, the average training for a CT surgeon was 8.6 years after medical school. A recent survey of CT residents stated that 25% would not choose CT surgery again and 50% would not recommend the field to others. 17 Most perfusionists are aware of some of the challenges facing CT surgeons. They include an aging surgical population with multiple comorbidities requiring more complex surgical procedures. 15 Surgeons have been encouraged to learn minimally invasive and catheter-based technologies. Cardiothoracic surgery is known for significant work hours, poor job prospects and dwindling reimbursement. Reimbursement for a CABG was reduced 50% by Medicare in 1990 and 38% in 2002. Medicare is the major funding source for CABG procedures, insuring 56% of the CABG patients in 2006 and is projected to increase to 67% of the adult surgical population by 2025. 19
Some of the suggested solutions to increasing the number of cardiac surgeons have been described in the literature. They include, first, a change in professional behavior from individualized care to team approach. This would include linking basic research to clinical application (translational medical research) through partnerships between healthcare providers and universities in an academic health science center environment. In this environment, researchers work alongside their clinical counterparts to ensure that research and education is effectively disseminated at the point of care. Other proposed ideas would include developing innovative techniques and simulation for clinician training, catheter-based training and the continued adoption of online learning applications and resources. 20
Conclusions
There are many different factors affecting the need for perfusionists. An increasing and aging population with a higher prevalence of CVD, an increased number of hospitals offering cardiovascular services and increased access to care through the Affordable Care Act will increase the need for perfusion services. Additionally, increasing use of ventricular assist devices and ECLS will also drive up the demand. On the other hand, a decreasing number of cardiac surgeons, a lower rate of acute MI and cardiac catheterization will decrease the rate of surgery/100,000 population. An important unknown is the impact of catheter-based technologies such as TAVR and TMVR. If perfusionists continue to stand by TAVR procedures, then this will influence the need for perfusionist. At the present time, the 1.4% rate of growth for the perfusion profession is consistent with the need for perfusionists, as evidenced by the case mix and number of jobs available.
Footnotes
Declaration of Conflicting Interests
The authors declared no potential conflicts of interest with respect to the research, authorship, and/or publication of this article.
Funding
The authors received no financial support for the research, authorship, and/or publication of this article.