
Abstract
Introduction:
Clotting is one of the major causes of mortality and morbidity during extracorporeal membrane oxygenation (ECMO). A large meta-analysis study suggests that 29% of patients require the oxygenator to be replaced during ECMO. As clots usually form in the oxygenator, the oxygenator blood volume (OXBV) decreases over time. The currently used pressure gradient as a predicator of clot formation is unreliable.
Objective:
The aim of this study was to develop and validate ultrasound dilution technology in a quantitative assessment of clotting, using measurements of OXBV.
Methods:
OXBV was measured using the ELSA monitor (Transonic Systems Inc., Ithaca, NY, USA) from the transit time of a saline bolus passing through the oxygenator as recorded by a sensor placed after the oxygenator. The accuracy and reproducibility (coefficient of variation [CV]) of OXBV measurement and its independence from ECMO flow was assessed in vitro in lambs and from a clinical data archive.
Results:
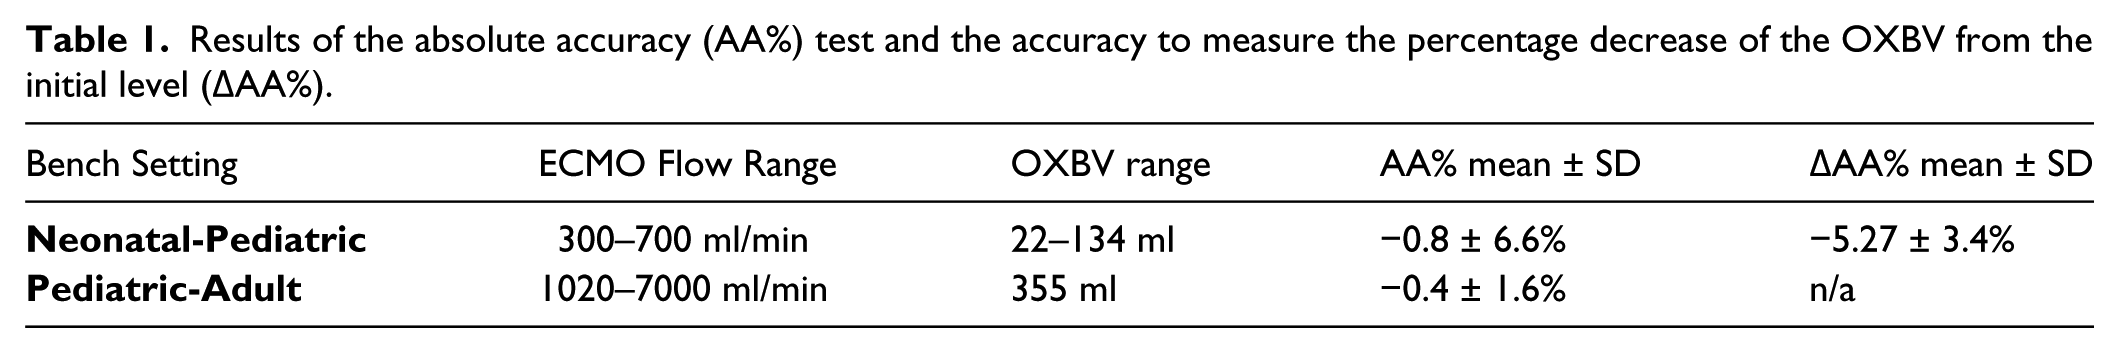
The in vitro accuracy compared with volumetric measurements of OXBV of 22-134 ml at flows of 300-700 ml/min was −0.8±6.6%. For an OXBV of 355 ml at flows of 1020-7000 ml/min, accuracy was −0.4±1.6%. In 88 animal OXBV measurements, the CV was 1.49±1.12%. For an OXBV of 153 (range 42-387 ml), clinical measurements at flow ranged from 210-5960 ml/min, with a CV of 3.20±2.44 %.
Conclusion:
Dilution technology has the ability to accurately and reproducibly assess the clotting process in the oxygenator. Larger studies are needed to establish guidelines for the prediction of imminent clotting and may help to avoid unnecessary circuit changes.
Introduction
Complications of coagulation, such as clotting and bleeding, are major causes of mortality and morbidity in ECMO, particularly in pediatric and neonatal patients. Clot formation can affect both the patient and the circuit, with decreased oxygenator performance, which may lead to thrombocytopenia, elevated D-dimer and decreased fibrinogen. Clot formation can lead to sudden interruptions in ECMO flow. Among neonatal patients requiring ECMO, 33% experience bleeding complications and 29% experience thrombotic complications, with higher rates in older patients. 1 In a large meta-analysis study of adult ECMO patients (946 patients), 29% of the patients experienced oxygenator dysfunction requiring the oxygenator to be replaced during the course of ECMO support. 2
Currently, four parameters are considered by physicians in evaluating the necessity of an oxygenator exchange: an increase in the pressure gradient across the oxygenator, the magnitude of decrease in gas exchange, the platelet consumption and the hemolysis level. The pressure gradient is expected to represent the magnitude of the clot formation in the oxygenator. Due to the nature of flow distribution in the oxygenator, pressure gradient as a quantitative predictor of clot formation is unreliable as its relative changes are not proportional to the amount of clot.
Oxygenator blood volume (OXBV) is the total amount of blood that flows through the oxygenator compartment. As a clot develops, OXBV decreases. Therefore, a measurement of a decrease in OXBV is a direct measure of the volume of clots formed in the oxygenator.
Ultrasound Dilution Technology Methodology
Dilution methods have long been known to quantitatively assess blood volumes. 3 Ultrasound dilution technology, introduced in 1995, 4 measures the changes in the ultrasound velocity of blood (a function of protein concentration) after an injection of isotonic saline. This technology has been used over the past 20 plus years to measure critical hemodynamic parameters in hemodialysis patients, including blood volumes. 5 The technology conventionally uses clamp-on flow/dilution sensors, not only to assess the hemodialysis parameters, but also to assess the fiber-bundle volume of the hemodialysis dialyzers. 6
Purpose
The purpose of this study was to develop and validate ultrasound dilution technology for oxygenator clotting quantity assessment.
Theoretical analysis
The blood volume (BV) of a compartment can be calculated as in Equation 1: 4

Where Q - blood flow through blood compartment; MTT - mean transit time of an indicator moving through the compartment.
Equation 1 can be modified to measure OXBV as in Equation 2:

Where Q - ECMO blood flow; MTTa - mean transit time of indicator travel between the place of injection (Figure 1) and the place of recording (Figure 1, arterial sensor) and can be calculated as:
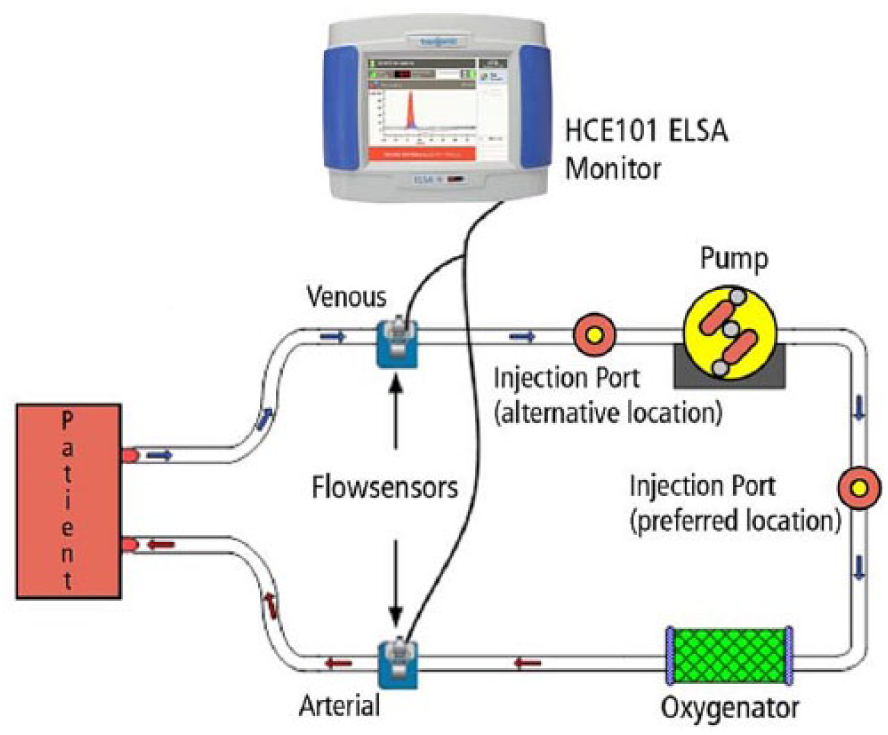
Schematic of OXBV measurement. Vin (in Eq. (2)) refers to the priming volume between the preferred place of injection and the oxygenator. Vs (in Eq. (2)) refers to the priming volume between the oxygenator and the arterial flow sensor.
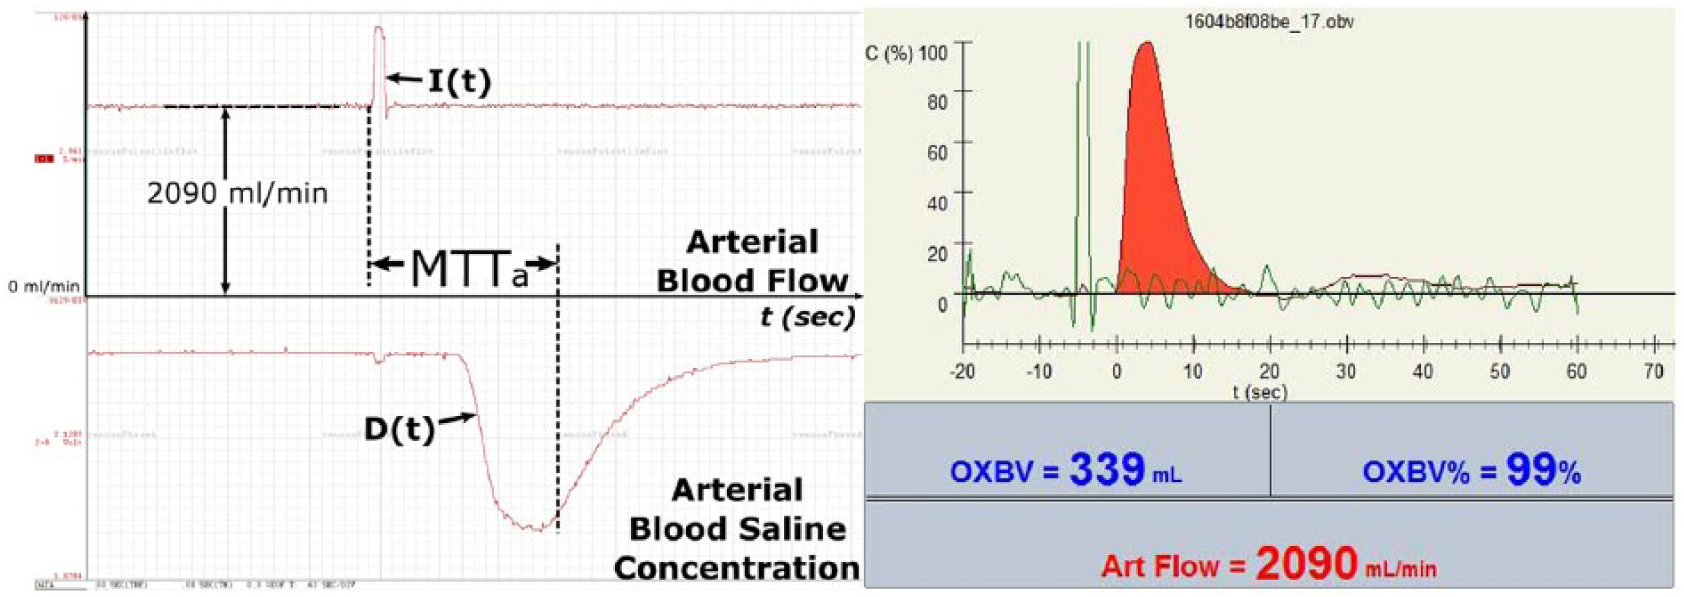
(Left) Raw data recorded from the arterial sensor. (Right) Actual screen-shot displayed on ELSA monitor. Note: Actual raw dilution curve that represents the decrease of blood ultrasound velocity due to saline injection (going down) is reversed on the screen-shot for user convenience. The green curve in the screen-shot represents the shape of the injection.
Methods
Bench Test
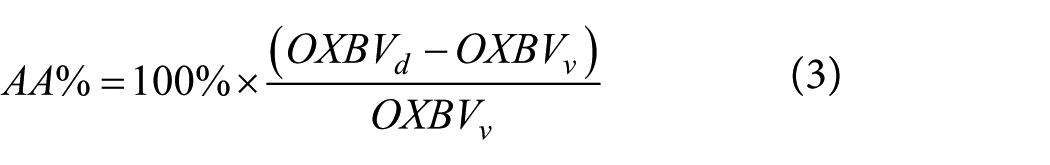
To validate the accuracy of Equation 2 to measure OXBV, the ELSA monitor (Transonic Systems Inc.) was used. Experiments were performed on a custom-designed tubing system composed of multiple tubing, with different known priming volumes, connected in parallel to each other (Figure 3). Saline (5%) was used as a blood substitute as it has the same ultrasound velocity as blood. 4 The total priming volume of the system was varied, depending on what branches were opened and closed during the dilution test. The volume of tubing under testing was varied from the initial value OXBVv =143 ml (OXBVv=100%) down to 22 ml (OXBVv% =15% from the initial level). This went through 4 step decreases (123 ml (OXBVv=86%), 104 ml (OXBVv=73%), 74 ml (OXBVv=52%), 44 ml (OXBVv=31%), mimicking the clotting process. Dilution measurements of these volumes (OXBVd) were performed at pump flows of 300 ml/min, 500 ml/min and 700 ml/min for a total of 56 measurements. Absolute accuracy (AA) was calculated using Equation 3:
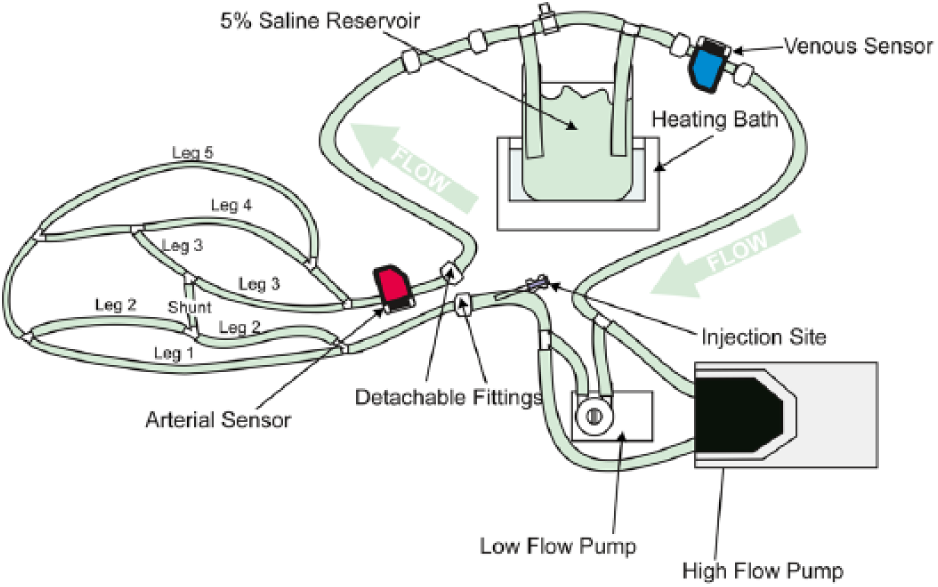
Bench setup for the accuracy test. Legs 1 to 5 with known volumes were clamped in particular orders to mimic the clotting process. Injections of 5-20 ml of saline were performed to measure OXBV.
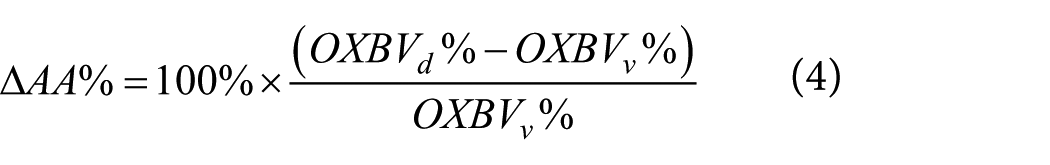
The accuracy of the measurement of percentage decrease (ΔAA%) was calculated using Equation 4:
A large volume of OXBVv= 355 ml was measured by dilution at flows of 1020 ml/min, 3090 ml/min, 5030 ml/min and 7000 ml/min and AA% was calculated.
Animal Experiment
An in vivo experiment was performed on six newborn lambs in the animal research facility at Children’s National Medical Center in Washington, DC and approved by IACUC (Animal Welfare Assurance # D16-00219 [A3338-01]) as part of large study related to recirculation and central hemodynamic assessment during veno-venous (VV) ECMO. 7 The protocol was twofold:
Part 1: Newborn lambs were placed on VV ECMO using a Jostra Rotaflow Centrifugal Pump (MAQUET Cardiopulmonary AG, Hirrlingen, Germany) and a Quadrox-iD pediatric oxygenator (MAQUET Cardiopulmonary AG). Circuits were primed with heparinized ovine blood. ELSA flow-dilution sensors were attached to the blood lines and isotonic saline 3-5 ml was injected to measure the OXBV and recirculation. The blood flow was varied at 200 – 600 ml/min and the dependence of flow on the OXBV measurement was investigated. The coefficient of variation (CV) of OXBV consecutive measurements was used to evaluate the reproducibility of the data, calculated using Equation 5:
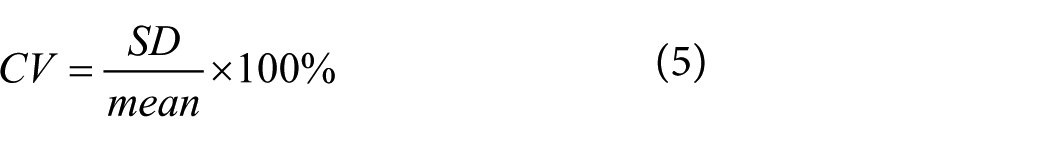
Where SD – standard deviation of the measurements.
Part 2: After completion of Part 1 of the animal experiments for each ECMO experiment, the lamb was removed from the circuit, which was then transitioned to a blood recirculating loop. Fixed known volumes of petroleum jelly (Vaseline), from 5 to 40 ml, were injected into the oxygenators to mimic clot formation of varying size and the OXBV was measured. The measured changes in OXBV by the ultrasound dilution method were compared with the actual volume changes from the injected petroleum jelly.
Clinical Data
To assess the reproducibility of the data, the Transonic clinical data archive was used to calculate the coefficient of variation (CV) of consecutive measurements using Equation 5.
Results
The results of the bench accuracy test are presented in Table 1.
Results of the absolute accuracy (AA%) test and the accuracy to measure the percentage decrease of the OXBV from the initial level (ΔAA%).
A total of 88 OXBV measurements were taken during six separate lamb experiments (Part 1). A high precision (coefficient of variation) of 1.49±1.12% was observed in consecutive measurements of OXBV.
OXBV measured at different pump flows (Figure 4) showed a variation of 0.11±2.86% from the mean flow of 400 mL/min.
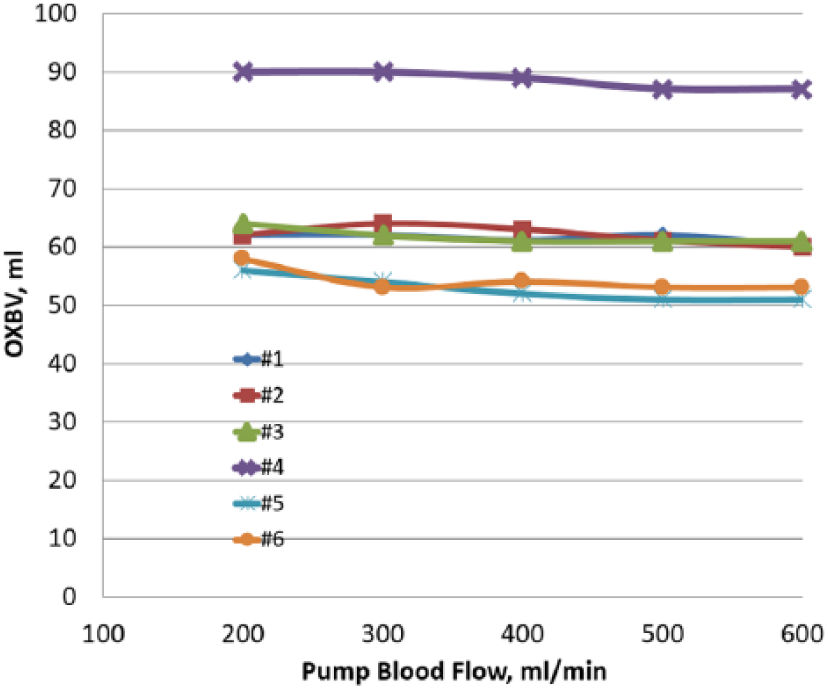
OXBV measurements at different pump flows in 6 lambs during VV ECMO study. In lamb 4, the tubing segment was also included in the OXBV measurement.
The in vitro arm of the study (Part 2) showed a strong relationship (R²= 0.85) between the volume of petroleum jelly injected into the oxygenators and the percentage decrease of the oxygenator blood volume measured by ultrasound dilution (Figure 5).
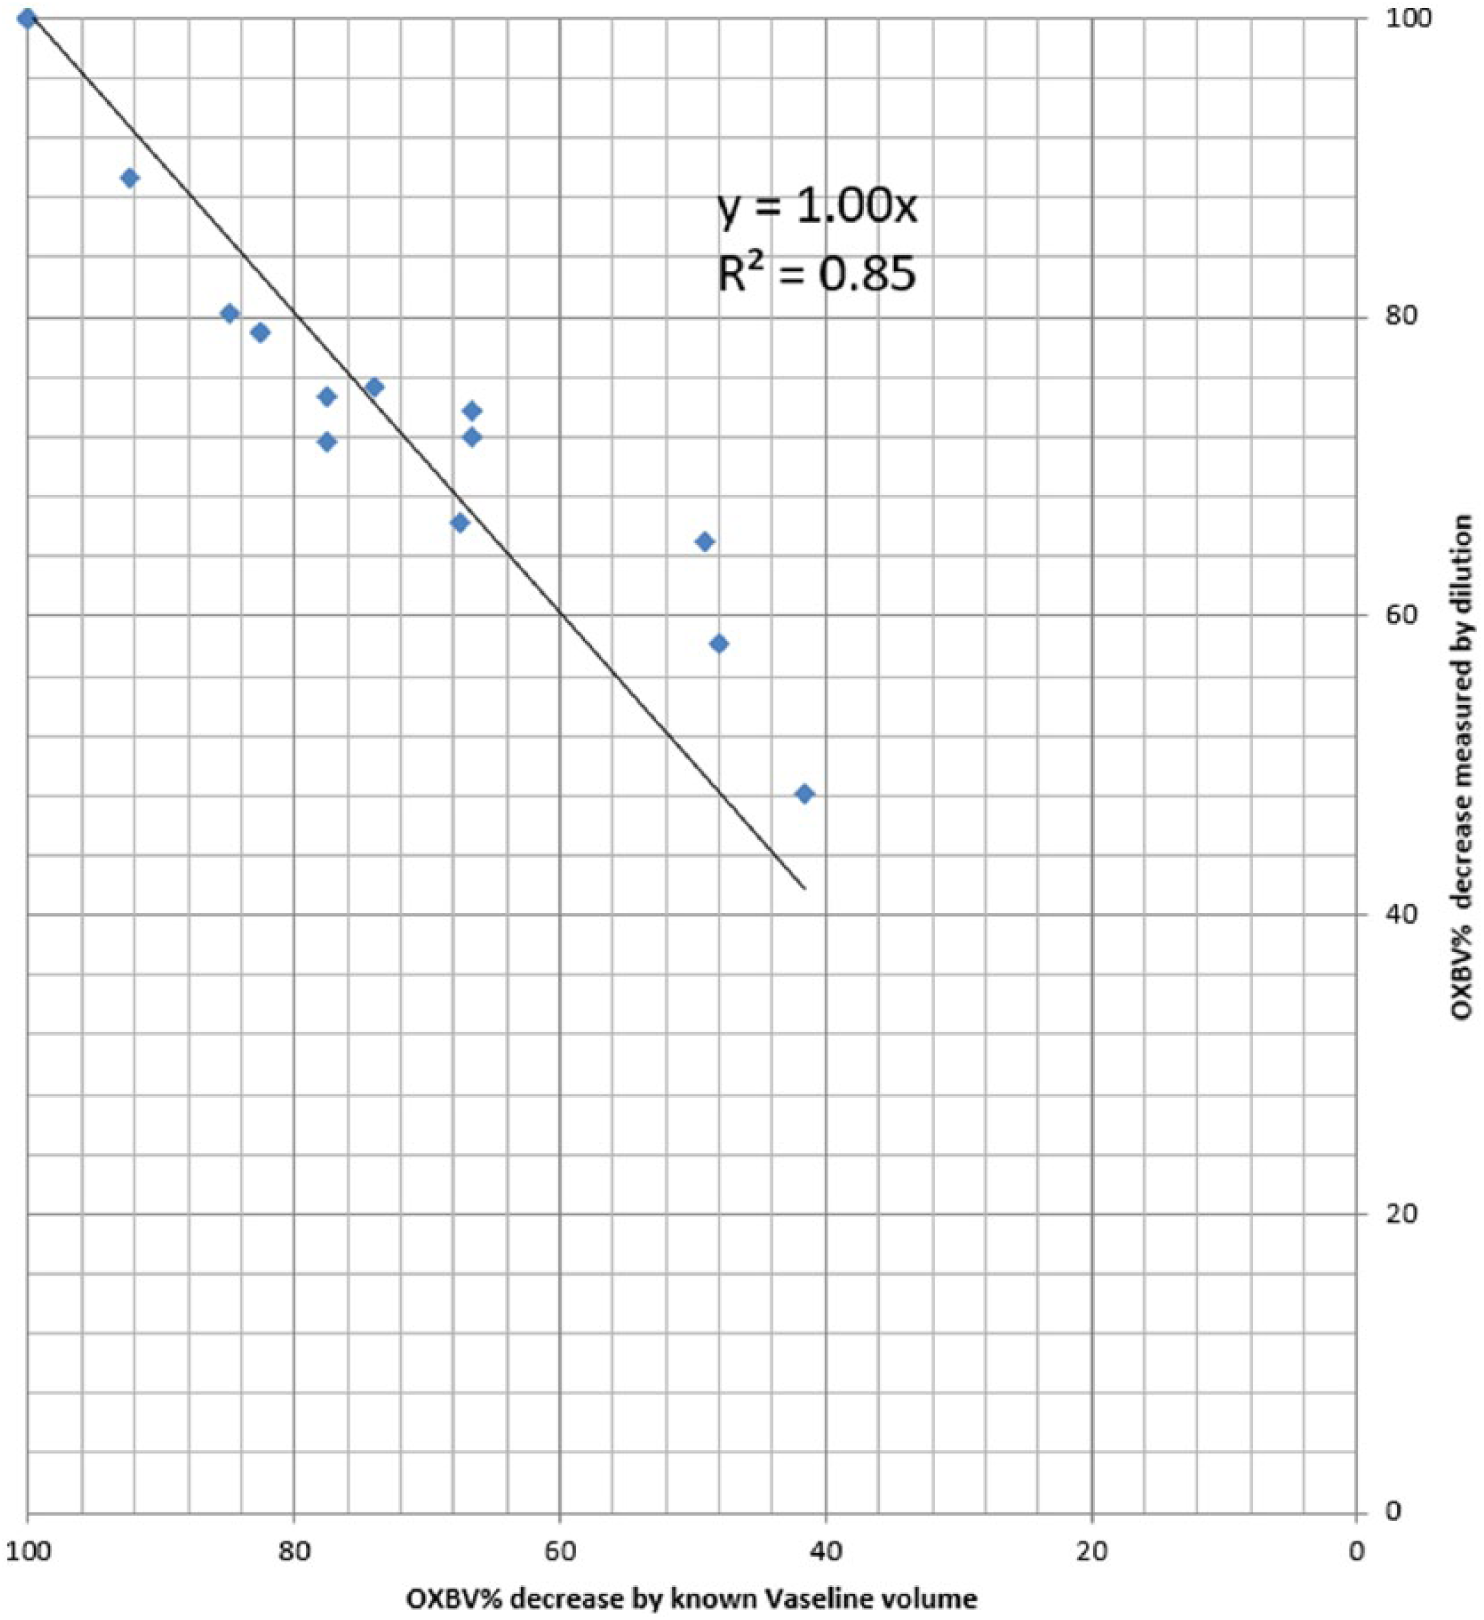
Correlation between OXBV% decreases by dilution versus known volume of Vaseline injections.
The coefficient of variation was calculated for a total of 153 OXBV clinical measurements. The saline injection volume was 1 ml/kg up to a maximum of 20 ml. The OXBV ranged from 42- 387 ml; ECMO flow ranged 210-5960 ml/min; the coefficient of variation was 3.20±2.44 % (range 0.2% -9.6%).
Discussion
There are two major reasons to change out an oxygenator: the potential danger (increased probability) of circuit clots traveling into the patient and a dramatic decrease in gas exchange. In order to assess whether the change should be performed, the physician will usually consider four parameters: the increase in the pressure gradient across the oxygenator, the magnitude of the decrease in gas exchange, the platelet consumption and the hemolysis level. Sometimes, though, the clot size can be seen visually. While the decision of changing out the oxygenator relies on the amount of clot formation in the oxygenator, both pressure gradient and the magnitude of change in gas exchange do not provide a quantitative assessment. Gas exchange may not be considerably affected by the clot formation, for example, in large surface area exchange oxygenators. Due to the nature of flow distribution in the oxygenator, the pressure gradient and how it changes (dependent on the model of oxygenator) are not proportional to OXBV changes, but are related to the location of the clot. The same clot located on the major flow pathway will have a larger impact on the pressure gradient than the formation of a clot in the periphery of the oxygenator. A change in ECMO flow will also change the pressure gradient, making it even more irrelevant, particularly in regards to low flow during weaning from ECMO when clots are more likely to form.
The ability to accurately measure OXBV and its dynamic behavior may provide an opportunity for the perfusionist and physician to observe the beginning stages of the clotting process with a simple one-minute measurement. Larger future studies may help to develop guidelines to predict imminent oxygenator clotting based on the OXBV trend. This could help to avoid unnecessary changes in the circuit from concern regarding clotting.
High absolute accuracy demonstrated on the bench and, even more importantly, high reproducibility and relative independence from pump flow suggest that a decline of OXBV by 7-10% from its baseline is a reliable signal to indicate the onset of a clotting process.
The observed high accuracy of OXBV measurements is independent of the operator and their precision with the injection volume. The requirement of a saline injection volume of 1 ml/kg up to a maximum of 20 ml is based on the necessity to receive high quality (high signal/noise ratio) curves (Figure 2). The injection volume itself is not part of Equation 2 and, thus, it does not matter how precisely the operator injects the chosen saline volume. It is the time of travel of the saline that matters.
The current single sensor concept of OXBV measurement is simpler than described for dialyzers. 5 In hemodialysis, an injection of saline is performed upstream from the first sensor located before the dialyzer while the second sensor is located after the dialyzer. In an ECMO setting, it is not always possible to have a sensor immediately before the oxygenator because, in some oxygenator brands, the only injection port prior to the oxygenator is on the oxygenator. Therefore, in some cases, only one sensor can be used to measure OXBV. At the same time, the location of the venous sensor (that is not needed for OXBV) close to the patient allows for the measurement of recirculation on VV ECMO from the same saline injection.
Conclusion
Dilution technology utilized by the ELSA Monitor has the capability to accurately and reproducibly assess the clotting process in an oxygenator. Larger studies are needed to establish guidelines for the prediction of imminent clotting and to avoid unnecessary circuit changes.
Footnotes
Declaration of Conflicting Interests
The author(s) declared the following potential conflicts of interest with respect to the research, authorship, and/or publication of this article: Nikolai Krivitski, Gregory Galyanov, and Deborah Cooper are employees of Transonic Systems Inc. who is the manufacturer of the product discussed in this manuscript. The remaining authors declared no potential conflicts of interest with respect to the research, authorship, and/or publication of this article.
Funding
The author(s) disclosed receipt of the following financial support for the research, authorship, and/or publication of this article: Transonic Systems provided equipment for this study. The author(s) received no financial support for the authorship and/or publication of this article.