
Abstract
Objective:
The criteria and process for liberation from extracorporeal membrane oxygenation in patients with severe acute respiratory distress syndrome are not standardized. The predictive accuracy of the oxygen challenge test as a diagnostic test in determining weaning and decannulation from venovenous extracorporeal membrane oxygenation was tested.
Design:
A single-centre, retrospective, observational cohort study.
Setting:
Tertiary referral severe respiratory failure centre in a university hospital in the United Kingdom.
Patients:
253 adults with severe acute respiratory distress syndrome requiring extracorporeal membrane oxygenation.
Intervention:
None
Measurements and Main Results:
Patients had median age: 43 years (interquartile range: 32-52) years, extracorporeal membrane oxygenation days: 9 (interquartile range: 6-14) and acute physiology and chronic health evaluation II score 17.5 (interquartile range: 15-20). Oxygen challenge test value (PaO2-OCT) with best prediction was 31 kPa (232 mmHg; sensitivity 0.74; specificity 0.70; area under curve 0.77 (confidence interval: 0.73-0.81)). PaO2-OCT did not perform well as a prospective test to identify readiness to decannulation. Only 24 patients (10%) were decannulated 48 hours after their first positive oxygen challenge test (true positive) and 73.4% patients were false positives (positive oxygen challenge test but not decannulated). True positives had higher tidal volume (541 ± 218 vs 368 mL ± 210; p < 0.05) and minute ventilation (9.34 ± 5.36 vs 6.33 L/min ± 4.43; p < 0.05). Blood flow (3.17 ± 0.23 vs 3.53 L/min ± 0.56; p < 0.05), sweep gas flow (1.42 ±1.83 vs 3.74 L/min ± 2.43; p < 0.05) and extracorporeal membrane oxygenation minute volume at time of first positive oxygen challenge test was lower in true positives (1.66 ± 2.26 vs 4.82 ± 3.43 L/min). This was a strong predictor for decannulation within 48 hours (area under curve: 0.88, confidence interval: 0.88-0.89).
Conclusions:
In severe acute respiratory distress syndrome requiring venovenous extracorporeal membrane oxygenation, the PaO2-OCT is a poor predictor of readiness to decannulate from extracorporeal membrane oxygenation. Additional factors involved in the control of respiratory drive and carbon dioxide clearance, particularly native lung dead space and total minute ventilation, should be assessed.
Keywords
Introduction
The use of venovenous extracorporeal membrane oxygenation (VV ECMO) for severe respiratory failure is increasing year on year, with improved survival rates. 1 A recent randomized trial and its subsequent post hoc Bayesian analysis have shown that ECMO improves survival when initiated early and particularly in patients with less severe disease.2,3 These benefits have been further confirmed in meta-analyses and propensity-matched studies.4–8 The effect of ECMO on survival is mainly due to two main factors: (1) the improvement in technology that allows lower levels of anticoagulation and less need for transfusion of blood products and (2) the possibility to achieve lung rest through a reduction of mechanical power both in terms of tidal volume (and therefore driving pressure) and respiratory rate (RR), allowing the lungs time to recover.9,10
While initiation criteria for ECMO are well defined by national and international societies as well as clinical trials, 2 the criteria and the process for weaning and subsequent decannulation are not standardized.2,6,11 In general terms, as the native lung function improves extracorporeal blood flow (QEC) and sweep gas flow (QG) are gradually reduced. Sweep gas flow is then ‘trialled off’ and if lung function is sufficient to maintain an acceptable gas exchange and work of breathing, decannulation can occur after >1-24 hours, depending on local protocols and clinical judgement. 12 Testing for readiness to wean is important to identify the patient who may no longer benefit from ECMO and reduce the exposure to the adverse effects of ECMO.
The prediction of readiness to wean – similarly to weaning from mechanical ventilation – requires criteria and tests to ascertain whether native lung function has recovered enough to support gas exchange necessary to meet metabolic demands. One of the tests that is often employed as a marker of lung recovery is the oxygen challenge test (OCT), where the arterial partial pressure of oxygen (PaO2) is measured 10-15 minutes after increasing the inspired oxygen fraction delivered by the ventilator (FiO2) to 1.0 (Cilley Test). Although this test is often reported in the ECMO literature and in the Extracorporeal Life Support Organization (ELSO), Ann Arbor, MI, USA guidelines, 13 there is little data to support its use in clinical practice and its predictive value as indicator of readiness to decannulation. The aim of this study was to test the predictive accuracy of the OCT as a diagnostic test in determining weaning and decannulation from VV ECMO.
Methods
Patients
This was a single-centre, retrospective observational cohort study of adult patients admitted to the severe respiratory failure and ECMO service at Guy’s and St Thomas’ Hospital (GSTT), London (United Kingdom), who required VV ECMO between January 2014 and December 2017 and were successfully decannulated. The study had institutional approval (institutional research governance reference number 7820). The need for individual informed consent was waived as this was a retrospective analysis of data collected prospectively for usual clinical care, with no breach of privacy or anonymity. Data were reviewed from our electronic patient record (ICIP; Philips, Eindhoven, The Netherlands). The study qualified as a service evaluation as defined by the United Kingdom National Health Service (UK NHS) Health Research Authority and therefore did not require review by the Research Ethics Committee (http://www.hra.nhs.uk).
ECMO management
The criteria used for VV ECMO initiation is as per the conventional ventilation or ECMO for severe adult respiratory failure (CESAR) trial. 6 Our standard approach of bifemoral percutaneous cannulation (25 F multi-stage access cannula and 23 F return cannula (BioMedicus, Medtronic Inc, Minneapolis, USA) with ultrasound and fluoroscopy use has previously been described.14,15 Once stability is achieved, rest ventilator settings are employed (FiO2: 0.3, positive end-expiratory pressure (PEEP): 10 cmH2O, plateau pressure 20 cmH2O, RR 10) while keeping the membrane oxygenator FSO2 at 1.0. Daily assessment for weaning and titration of QG and QEC is managed by the intensive care team. Once tidal volume improves to >2-3 mL kg−1 predicted body weight (PBW), with the ventilation settings as decided by the treating clinical team, OCTs are performed daily. Patients are usually trialled off sweep gas flow for 12-24 hours prior to decannulation.
Data collection
Collected data included demographics, duration of ECMO, all documented arterial blood gas results including OCTs, ventilatory parameters (pulmonary minute volume (Ve), tidal volume (VT), RR), and ECMO settings (QEC and QG)). Patients included in the study had OCTs performed prior to decannulation.
We defined and calculated the following:
Corrected pulmonary minute volume (VeCORR)
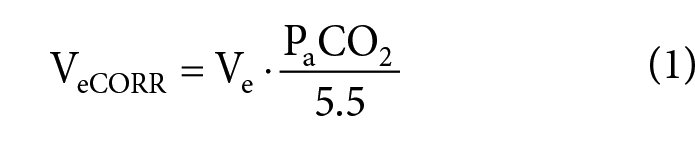
where Ve is the pulmonary minute volume (L min−1) and PaCO2 is the arterial partial pressure of CO2 (kPa).
ECMO minute volume (VECMO)

ECMO corrected minute volume (VECMO-CORR)

where VECMO is the ECMO minute volume (L min−1; equation (2)) and PaCO2 the arterial partial pressure of CO2 in kPa.
Total corrected minute volume (VTOTAL-CORR)
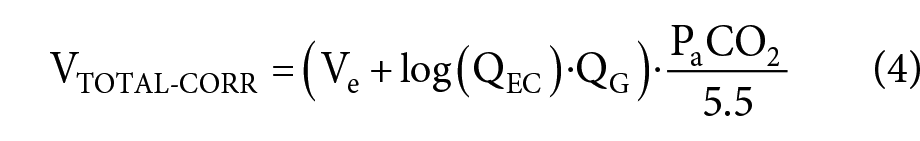
where Ve is the pulmonary minute volume (L min−1), QEC is the ECMO blood flow, and QG is the ECMO sweep gas flow in L min−1.
VeCORR (equation (1)) is a recognized proxy of physiological dead space of the native lung, calculated as the pulmonary minute volume (Ve) adjusted to achieve a PaCO2 of 5.5 kPa (41.3 mmHg).16,17 Further variables were calculated to adjust for the relative contribution of ECMO and native lung on the readiness to wean. We reasoned that the CO2 removal (VCO2) of the membrane lung, for any given pre-membrane PCO2 (PpreCO2), can be roughly determined as proportional to the product of QG and the logarithm of QEC. This is because the effective ventilation (VEFF) of the membrane lung (in L min−1) is proportional to VCO2 (i.e. VEFF = VCO2/PCO2 × K; or if we consider the fraction and PCO2 constant, VEFF is directly proportional to VCO2). The product of QG and the logarithm of QEC may therefore represent a measure of ECMO minute volume (VECMO; equation (2)). We also estimated the corrected ECMO minute volume (VECMO-CORR) required to obtain a PaCO2 of 5.5 kPa (41.3 mmHg; equation (3)) in a fashion analogous to the corrected pulmonary minute volume (equation (1)). It follows that the corrected total minute volume
Statistical analysis
Diagnostic test evaluations (sensitivity, specificity, area under the curve (AUC), and Youden J statistic) were performed by the construction and evaluation of receiver operating characteristic (ROC) curves. Ventilation and ECMO parameters were compared between differing OCT outcome groups. The assumption of homogeneous variance between groups was assessed and one-way analysis of variance (ANOVA) performed if homogeneous and Welch’s ANOVA if not. If statistically significant between-group differences were found, subsequent post hoc comparisons were made with Tukey’s honest significance test and pairwise comparisons or Games-Howell post hoc comparisons in the case of heterogeneous variance between groups. Two group comparisons employed Welch’s T-test to assess for statistically significant differences. Ventilation and ECMO parameter means are reported with standard deviations for OCT outcome groups. Multivariable logistic regression models were constructed using a pragmatic forward variable selection strategy (see Online Additional Information) to examine the predictive ability of multiple combinations of ventilation and ECMO parameters. All data extraction, cleaning and analysis routines were performed using the R project for Statistical Computing. 18
Results
Patient characteristics
ECMO was performed in 310 patients, of whom 253 (81.6%) survived to decannulation. An OCT was not performed in 12 patients (4.7%), and therefore, these patients were excluded from the study (See Online Additional Information). Baseline characteristics are shown in Table 1.
Baseline characteristics.
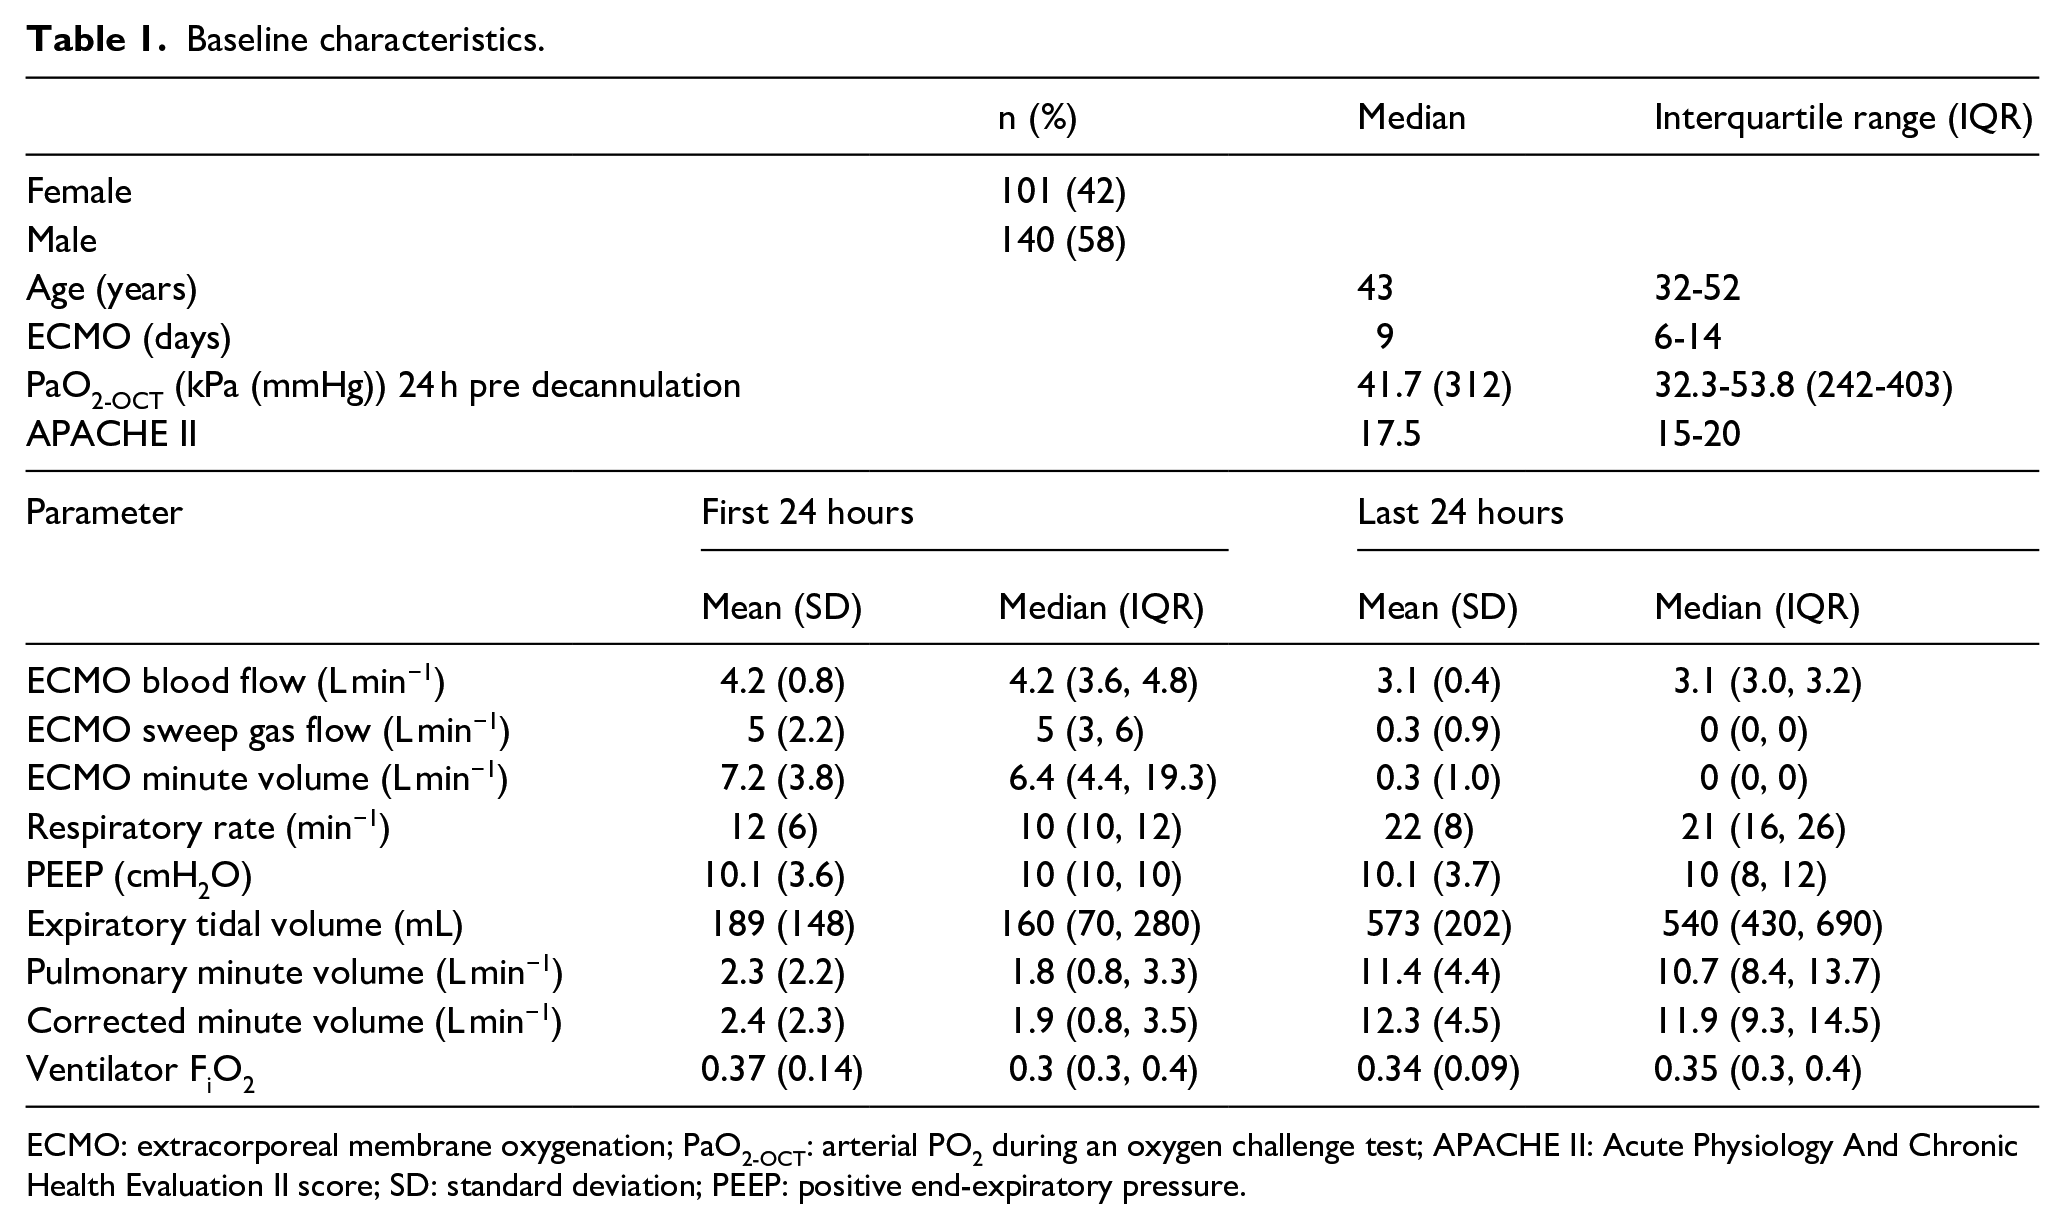
ECMO: extracorporeal membrane oxygenation; PaO2-OCT: arterial PO2 during an oxygen challenge test; APACHE II: Acute Physiology And Chronic Health Evaluation II score; SD: standard deviation; PEEP: positive end-expiratory pressure.
OCT as a decannulation predictor
We reviewed all OCT results, considering whether they were within the 48 hours prior to decannulation, to identify the cut-off value of OCT (PaO2-OCT) with the best prediction for successful decannulation. Using ROC curve analysis, we identified a threshold PaO2-OCT value of 31 kPa (232 mmHg; sensitivity: 0.74; specificity: 0.70; AUC: 0.77 (CI: 0.73-0.81)).
Prospective evaluation of PaO2-OCT as a predictor of ECMO decannulation
We defined positive OCT as an PaO2-OCT > 30 kPa (225 mmHg). We then tested the PaO2-OCT prospectively to understand the power to predict decannulation after the first positive PaO2-OCT. OCT results were defined according to subgroups. A true positive was defined as a positive OCT achieved within the 48-hour period prior to decannulation; a false positive when a positive OCT occurred more than 48 hours prior to decannulation and a negative OCT where a positive result was never achieved, but the patient was successfully decannulated from ECMO. A period of 48 hours prior to decannulation was utilized because at our institution, patients are off sweep gas flow for 12-24 hours before proceeding to decannulation. True positives were found in 24 (10%) patients, false positives in 177 (73.4%) and negative in 40 (16.6%).
Comparisons of observations were reviewed from the 12-hour period before and 12-hour period after the first positive OCT. Comparison between the true positive and the false positive patient groups showed higher mean tidal volume (541 ± 218 vs 368 ± 210 mL; p < 0.05) and higher mean pulmonary minute volume (9.34 ± 5.36 vs 6.33 ± 4.43 L min−1; p < 0.05) in the true positive group. When comparing VeCORR, however, we found that it was also higher in the true positive compared to false-positive group (9.95 ± 5.46 vs 6.97 ± 4.8 L min−1; p < 0.05; Figure 1). This result was associated with a statistically lower QEC (3.17 ± 0.23 vs 3.53 ± 0.56 L min−1; p < 0.05) and QG (1.42 ± 1.83 vs 3.74 ± 2.43 L min−1; p < 0.05) in true positives (i.e. patients who were decannulated 48 hours after the first positive OCT).
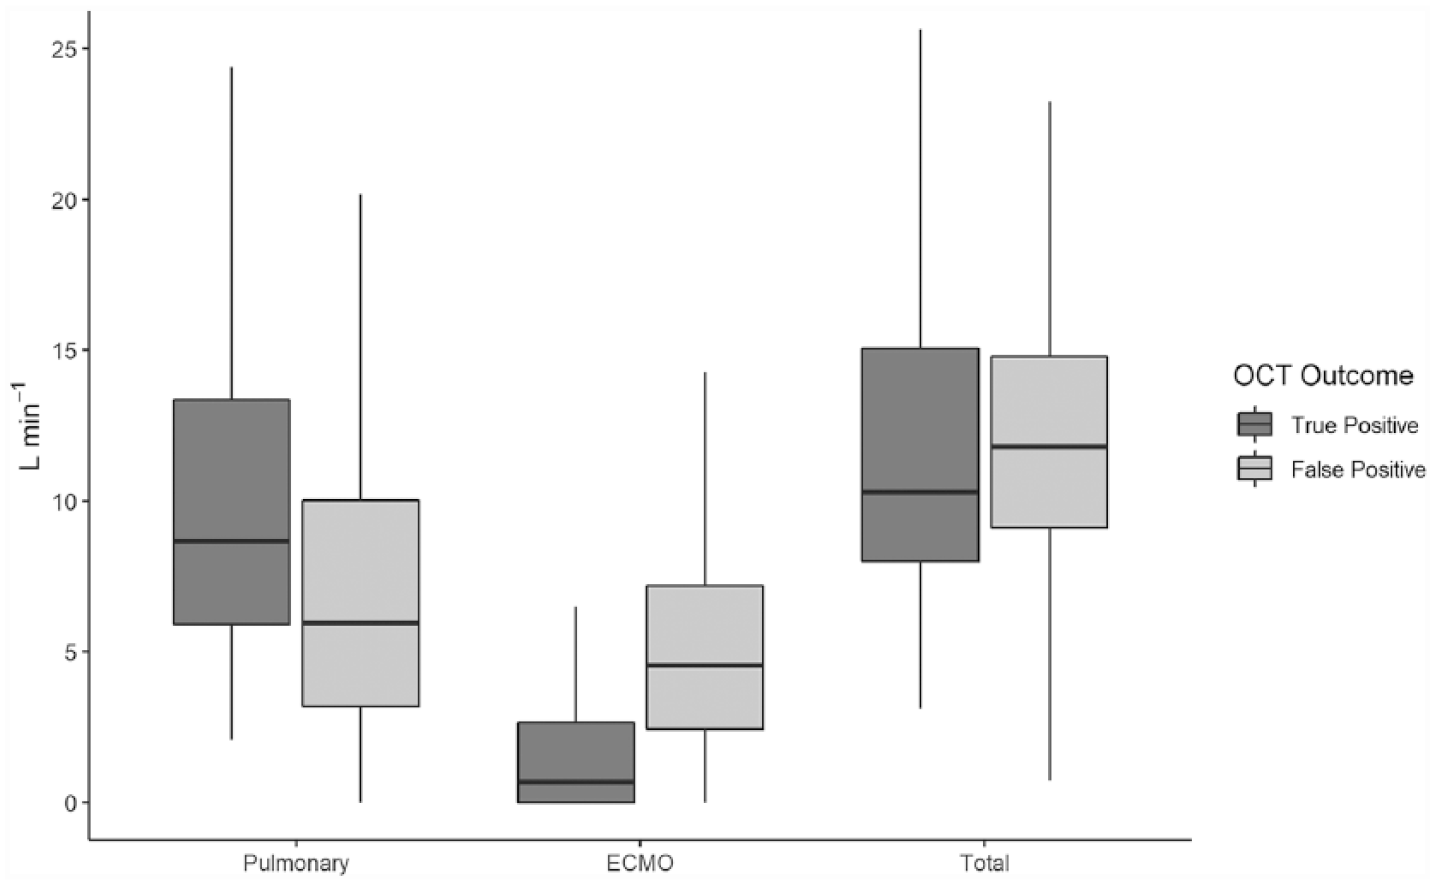
Pulmonary, ECMO and total corrected minute volumes at the time of first positive OCT.
Pre-decannulation data
Ventilator and ECMO settings were reviewed for the 24 hours prior to decannulation. Mean tidal volumes of true-positive to false-positive group (597 ± 209 vs 576 ± 201 mL; p = 0.05), mean minute volume (11.23 ± 4.84 vs 11.68 ± 4.4 L min−1; p = 0.05) and mean corrected minute volume (11.82 ± 5.11 vs 12.66 ± 4.45 L min−1; p < 0.05) were all clinically similar. ECMO settings were clinically similar for true-positive to false-positive groups: mean QEC (3.1 ± 0.16 vs 3.06 ± 0.38 L min−1; p = 0.032) and QG (0.26 ± 0.85 vs 0.22 ± 0.84 L min−1; p = 0.609).
ECMO minute volume as a decannulation predictor
Given the poor predictive power of the OCT when applied prospectively, we used similar ROC analysis to identify single parameters which might better predict decannulation. As predicted, the mean ECMO minute volume, within 12 hours of first positive OCT, was higher in patients with a false-positive OCT compared to true positive (4.82 ± 3.43 vs 1.66 ± 2.26 L min−1; Figure 1) and was a strong predictor for decannulation within 48 hours (AUC: 0.88, CI: 0.88-0.89).
Composite criteria were examined by construction of multivariable logistic regression models and ROC analysis of their respective outcome predictions. In particular, the performance of the models that included the ECMO contribution (as ECMO minute volume) and the contribution of native lung either as PaO2-OCT (AUC: 0.89 (95% CI: 0.888-0.897)) or as expiratory minute volume (AUC: 0.89 (95% CI: 0.887-0.896)) (Figure 2), were statistically nearly identical (Table 2), demonstrating that PaO2-OCT does not add to predictive models that include minute volumes alone (see Online Additional Information).
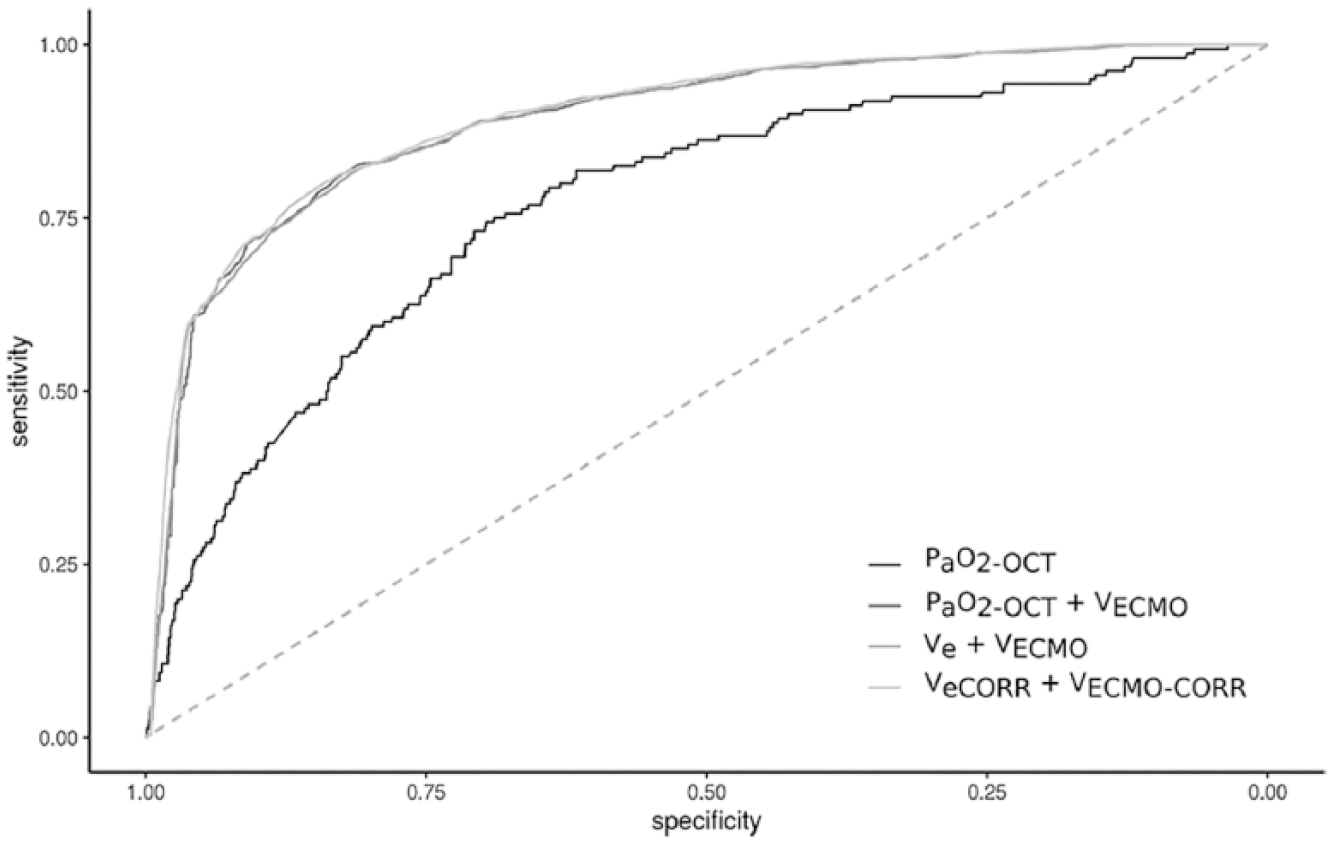
Receiver operating characteristics (ROC) curves for prospective PaO2-OCT values and logistic regression models of corrected and non-corrected pulmonary and ECMO minute volumes.
ROC AUCs for prospective PaO2-OCT values and logistic regression models of corrected and non-corrected pulmonary and ECMO minute volumes, with odds ratios for logistic regression model parameters.
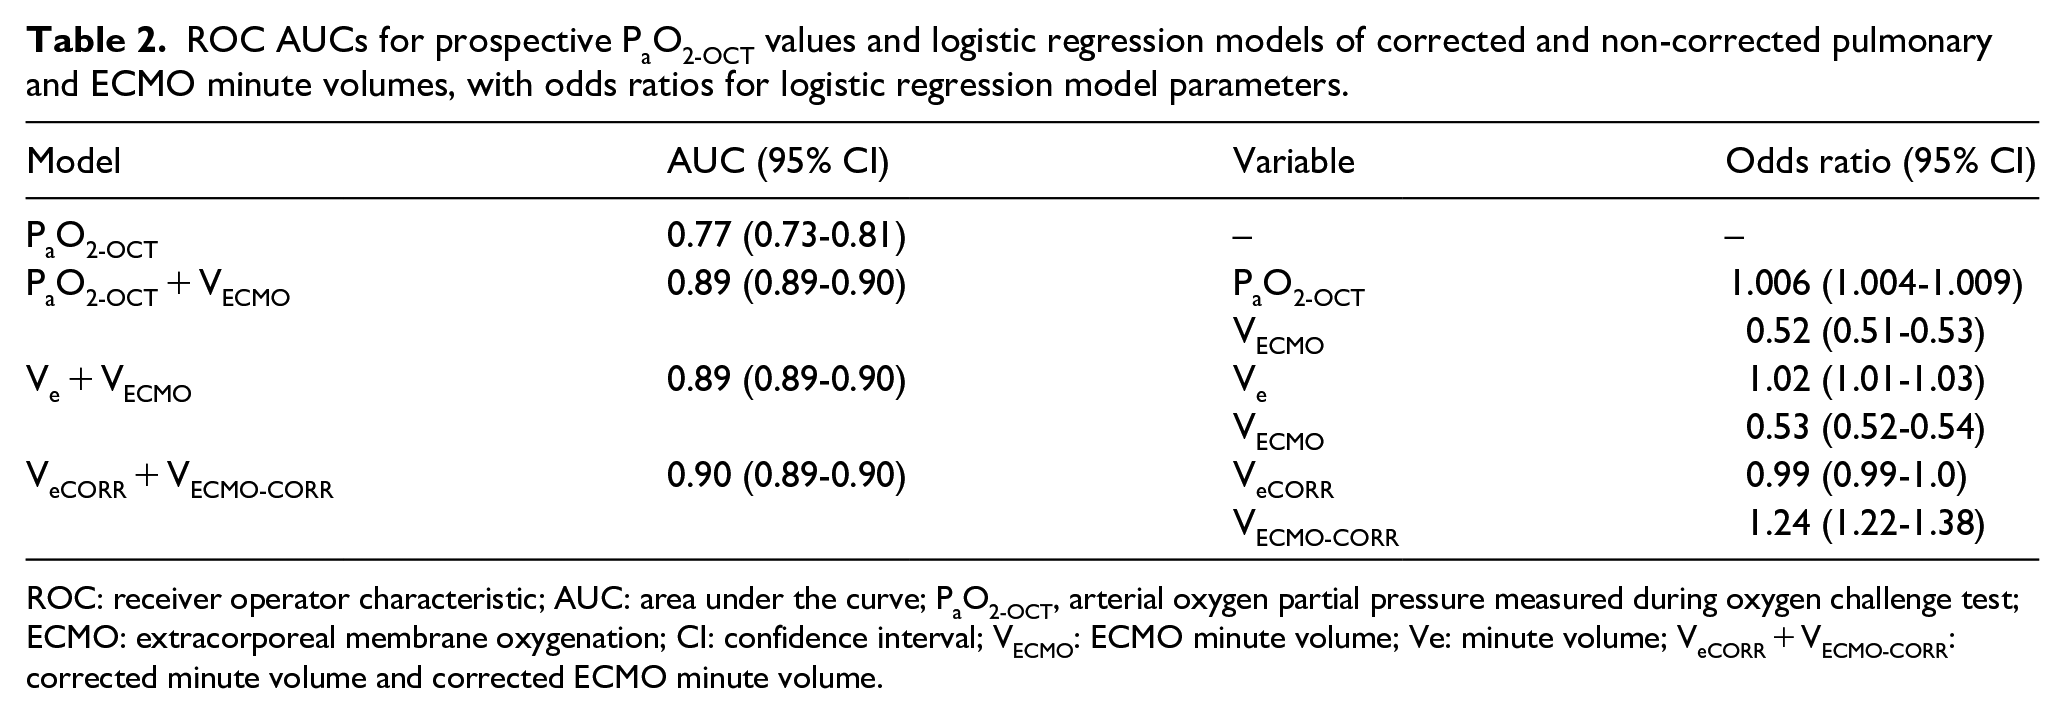
ROC: receiver operator characteristic; AUC: area under the curve; PaO2-OCT, arterial oxygen partial pressure measured during oxygen challenge test; ECMO: extracorporeal membrane oxygenation; CI: confidence interval; VECMO: ECMO minute volume; Ve: minute volume; VeCORR + VECMO-CORR: corrected minute volume and corrected ECMO minute volume.
Discussion
Testing for readiness to wean is important to identify the patient who may no longer benefit from ECMO and reduce the exposure to the adverse effects of ECMO. In this study, we show that in patients with severe acute respiratory distress syndrome (ARDS) requiring VV ECMO, the PaO2-OCT is a poor predictor of readiness to wean from ECMO. The performance of PaO2-OCT may have also unintended consequences of increasing the risks for lung tissue and arterial hyperoxia, particularly in patients with false-positive OCT test, as they may be exposed to more prolonged cumulative doses of hyperoxia.19–21 The poor positive predictive value highlights three points: (1) ECMO dependency is not necessarily related to oxygenation, (2) testing oxygenation on ECMO may not predict sufficient PaO2 once the patient is trialled off ECMO and (3) prediction of readiness to weaning and decannulation from ECMO requires the assessment of additional factors involved in the control of respiratory drive and carbon dioxide clearance, particularly native lung dead space and total minute volume.
Regarding the first point, PaO2-OCT does not predict decannulation because oxygenation may not be the primary reason for ECMO dependency. This is consistent with data from ECMO to rescue lung injury in severe ARDS trial (EOLIA) that shows the conventional and ECMO groups have similar oxygenation but different carbon dioxide post randomization. 2 Extracorporeal membrane lung may affect oxygenation through various mechanisms. One is the effect of ECMO on the hypoxic pulmonary vasoconstriction (HPV). HPV physiologically aims to reduce blood flow to poorly ventilated lung preserving ventilation perfusion (V/Q) ratio. However, HPV is impaired in ECMO because of the increased mixed venous oxygen (PmixO2).22,23 The abolition of this physiological response results in increased effective shunt fraction and can result in arterial desaturation and increased venous admixture if V/Q matching is profound and there is no time for restoring HPV. 11 Another factor is the effect of CO2 removed extracorporeally on the native lung function and reduction of the alveolar PO2 based on modification of the respiratory quotient and change in the pulmonary hypoxic vasocontriction.24,25 Finally, in a subgroup of patients, ECMO may cause re-opening of a foramen ovale which can cause a positive OCT but severe arterial desaturation during trialling off ECMO. 26
The second point is that PaO2-OCT does not reflect just the function of the native lung, but it results from the interaction between ECMO and native lung. Therefore, a positive OCT may not guarantee sufficient oxygenation to allow decannulation from ECMO. In particular, ECMO increases SpreO2, and therefore, for the same native lung shunt fraction and QEC to cardiac output ratio, PaO2-OCT will be higher while the patient is on ECMO. When the ECMO is trialled off, the reduction in SpreO2 plays a role in increasing venous admixture with consequent decrease in PaO2. If we use an example of a patient with a cardiac output of 5 L min−1, an oxygen consumption of 300 mL min−1, a native lung shunt fraction of 30% and a QEC of 3 L min−1 (assuming a recirculation fraction (Rf) of 20% and an intramembrane shunt fraction of 10%), the PaO2-OCT would be 37.9 kPa (284 mmHg; SaO2: 98.1%) with a SmixO2 of 83% and a PO2 of final mixture (PmixO2) of 6.6 kPa (49 mmHg). This patient would have a positive OCT. However, when the FSO2 of the membrane lung is reduced to 0.21, but the FiO2 of the ventilator left at 1, the PaO2-OCT will decrease to 25.7 kPa (193 mmHg; SaO2: 97.7%) with a SmixO2 of 75.2% and a PmixO2 of 5.6 kPa (42 mmHg). If this patient is decannulated from ECMO, the PaO2 at FiO2 of 1 would further drop to 9.6 kPa (72 mmHg; SaO2 93%) with a SpreO2 of 50.8% and a PvO2 of 3.7 kPa (28 mmHg). If the FiO2 on the ventilator is reduced to 0.6, the PaO2 would be 7.3 kPa (55 mmHg) in the absence of a change in hypoxic vasoconstriction. If, as a consequence of better V/Q matching and HPV, the functional shunt fraction decreases to 20%, PaO2 may improve overtime to 10.7 kPa (80 mmHg). Still this is far from the original 37.9 kPa (284 mmHg; calculations using http://www.ecmomodel.unimi.it/p/index.php).
In addition, given the lower SmixO2 off ECMO, the same amount of the native lung oxygen consumption (VO2) will have first to be spent in increasing oxygen saturation by a quantity that is equal to (1.39 × (100-SpreO2) × haemoglobin (Hb)). This condition, by definition, will reduce the amount of dissolved oxygen (PaO2).
The final point is that ECMO CO2 removal depends on sweep gas flow and blood flow for a given membrane size and function and a PpreCO2. 27 Clearance of CO2 by the native lung is essential for weaning and decannulation from ECMO; however, we have no data on the precise artificial and native lung CO2 transfer (VCO2). Therefore, we used a proxy estimate of the contribution of ECMO on the CO2 elimination (ECMO minute volume) and as a surrogate for physiological dead space and impaired ability for native lung to eliminate CO2. We found that ECMO minute volume was higher in false-positive OCTs. This result indicates, as evident in daily clinical practice, a greater contribution from the membrane lung and indicates that the majority of patients require ECMO not for oxygenation but mainly for CO2 removal.
This study has the strengths of including a large cohort of patients, protocolised care and a well-documented electronic physiological and clinical data. The study combines a physiological hypothesis with a ‘big data/data puddle approach’ (see online Additional Information).
There are clear limitations to this study particularly the retrospective design, and the lack of clear documentation on whether patients who were not decannulated after the first positive PaO2-OCT (false positive) remained on ECMO because of desaturation during a trial off test or because of hypercapnia. In addition, we have no routine data on the VCO2 of the membranes and native lungs. However, we believe that the results of this large data approach show the importance of the interaction between artificial and native lung and the role of functional dead space or CO2 removal in ECMO dependence. In addition, repeated OCT may expose patients, particularly the group we defined as ‘false positive’ to additional cumulative hours of hyperoxaemia with possible, although unquantified, effects of short-term outcomes.
Conclusion
In patients with severe ARDS requiring VV ECMO, the PaO2-OCT is a poor predictor of readiness to decannulate from ECMO. Additional factors involved in the control of respiratory drive and carbon dioxide clearance, particularly native lung dead space and total minute volume should be routinely assessed.
Supplemental Material
Sup_Material_908115_-_Prediction_of_readiness_to_decannulation_from_venovenous_extracorporeal_membrane_oxygenation – Supplemental material for Prediction of readiness to decannulation from venovenous extracorporeal membrane oxygenation
Supplemental material, Sup_Material_908115_-_Prediction_of_readiness_to_decannulation_from_venovenous_extracorporeal_membrane_oxygenation for Prediction of readiness to decannulation from venovenous extracorporeal membrane oxygenation by Emma L Hartley, Barnaby Sanderson, Francesco Vasques, Kathleen JR Daly, Maria Lozinski, Nicholas A Barrett and Luigi Camporota in Perfusion
Footnotes
Acknowledgements
We are grateful to all the members of the Severe Respiratory Failure team at Guy’s and St Thomas’ Trust for the collection of data, retrieval and subsequent care of these very sick patients.
Declaration of Conflicting Interests
The author(s) declared no potential conflicts of interest with respect to the research, authorship and/or publication of this article.
Funding
The author(s) received no financial support for the research, authorship and/or publication of this article.
Supplemental Material
Supplemental material for this article is available online.
References
Supplementary Material
Please find the following supplemental material available below.
For Open Access articles published under a Creative Commons License, all supplemental material carries the same license as the article it is associated with.
For non-Open Access articles published, all supplemental material carries a non-exclusive license, and permission requests for re-use of supplemental material or any part of supplemental material shall be sent directly to the copyright owner as specified in the copyright notice associated with the article.