






Abstract
Introduction:
This study aimed to test a computer-driven cardiovascular model for the evaluation of the visceral flow during intra-aortic balloon pump (IABP) assistance.
Methods:
The model includes a systemic and pulmonary circulation as well as a heart contraction model. The straight polyurethane tube aorta had a single visceral while four windkessel components mimicked resistance compliance of the brachiocephalic, renal and sub-mesenteric, pulmonary, and systemic circulation. Twelve flow probes were placed in the circuit to measure pressures and flows with the IABP on and off.
Results:
With the balloon off, the meantime to reach the steady state was 48 ± 16 s; with the balloon on, this figure was 178 ± 20 s. The stability of pressure and flow signals was obtained after 72 ± 11 min. The number of cycles of stability of the system was 93 [86–103]. Measurements were reliable either with samples of 10 or 20 beats. Bland Altman method demonstrated the reliability of measurements. Finally, all measurements were comparable to published in vivo data.
Conclusion:
The presented mock circulation was reliable and gave values with high accuracy both at baseline and during mechanical assistance. This system allows evaluation of the mesenteric flow during IABP, under different clinical/hemodynamic conditions. Nonetheless, its translational potential needs to be further evaluated
Introduction
The Intra-Aortic balloon pump (IABP) has been used worldwide to assist the failing heart since its introduction by Kantrowitz et al. 1 nearly 50 years ago. Despite clinical evidence confirming the beneficial effect of IABP,2,3 vascular complications related to its use remain an important issue. 4 Among them, bowel ischemia remains a potentially life-threatening complication. 5
The use of the mock circulation allows devices to be tested under controlled circulatory settings 6 and to gain mechanistic information that could not otherwise be obtained by clinical or in vivo research. 7
A model has been previously created by researchers of our group to test the hemodynamic effects of the IABP. 8 Nevertheless, the influence of the balloon on visceral circulation is still not fully understood,9–11 and, as far as we know, this aspect has not been explored in an in vitro model to date.
In the present study, we have implemented a computer-driven cardiovascular system model featuring a systemic and pulmonary circulation, as well as an elaborate heart contraction model. This system should enable the evaluation of the visceral flow during IABP under different clinical/hemodynamic conditions.
This study aimed to validate this mock system to ensure realistic parameters are generated by the system and also to confirm system stability. For these purposes, both clinical12–14 and experimental data11,15 were utilized.
Methods
The system
The mock system consists of both a heart and a circulation model (Figure 1). A heart contraction model controls the integrated simulated circulation system as described by Bovendeerd et al. 16 and a “lead-lag” controller, as reported by Van de Molengraft and colleagues. 17

The mock system circulation.
The left and right ventricles were modeled following Arts et al. 18 and Bovendeerd et al. 16 Both ventricles are modeled as thick-walled spheres, consisting of a set of nested thin shells. Muscle fiber stress and strain are assumed to be homogeneously distributed. The dimensionless ratio of muscle fiber stress to ventricular pressure depends on the dimensionless ratio of cavity volume to wall volume.8,19
We assumed that myocardial tissue was incompressible and that no stress can be transmitted to the tissue.8,19 At baseline, left ventricular contractility (c) was set to 1, whereas c may be altered to study pathological cases.
The circulation model generates signals for both ventricular pressures and volumes as a function of time. The ventricular pressures and heart frequency are generated by ventricular volumes and average aortic pressure and are updated at the start of each cardiac cycle. The controller set-point is the difference between the actual and instantaneously required ventricular pressures, which consists of three components: (a) an integral control action that is used for disturbance rejection at low frequencies. (b) A lead compensator employed for phase advance in the resonance frequency region. (c) A second-order low-pass filter ensures that there is noise reduction at high frequencies.
The circulation is driven by a servo-pump consisting of two servomotor-operated piston pumps which mimic left and right ventricles. 20 Water was used as the circulating fluid.
Each piston pump has a variable stroke volume (maximum of 180 mL) and was driven by a linear actuator (ETB32, Parker Hannifin, The Netherlands). To ensure the correct direction of the flow three-leaflet flexible polyurethane valves (Life Tec Group, Eindhoven, The Netherlands) were put on the ventricular outlets
Electromagnetic flowmeters measured flows (T410 system, Transonic, Ithaca, US) positioned upstream to the related valves. The integration of aortic flow subsequently computed cardiac output. Ventricular volumes were obtained from the recorded time series of the position of the two-piston pump. 16 Also, ventricular pressures were assessed by P10EZ pressure sensors (Beckton Dickinson, Sint-Niklaas, Belgium), which functioned as the input parameter.
Matlab/Simulink (Matlab R2006a, Mathworks, MA, USA) running on a 64-bit Linux system was employed to implement the control algorithm.8,19
A multi-IO acquisition system was used as an interface with the mock loop (PCI-6602 counter board, PCI- 6040 multi-I/O board, and PCI-6713 analog output, all by National Instruments, Austin, TX, USA). The frequency rate of the control loop was 1024 Hz.
The circuit
The circuit is shown in Figure 2.

A schematic representation of the in vitro mock circulation model.
The aorta was composed of a straight polyurethane tube (22 mm diameter, 0.1 mm wall thickness, and 45 cm length; Life Tec Group, Eindhoven, The Netherlands) with a single visceral branch (Vis). The size of the aorta was chosen based on our previous measurement on healthy volunteers and hypertensive patients. 21 Appropriate wall thickness was required for resisting high pressure at expenses of lower compliance. Four windkessel systems mimicked resistance, impedance, and inheritance of brachiocephalic, systemic, pulmonary, and visceral circulation. Each system had a module for peripheral resistance to take into account the influence of this parameter on any district. The components of the windkessel systems were physiologically corrected. 19 The myocardium was modeled as a resistive circuit: a collapsible, silicone rubber tube collapsing under higher levels of left ventricular pressure, mimicked resistance, and volume of the sub-endocardial myocardium. A single rigid tube connected the myocardial venous outlet to the compliance chamber represented the right atrium and had no additional resistance. 19
The circulating fluid flows into a cylindrical reservoir (height of 500 mm; the cross-sectional area of 5542 and 6708 mm2) functioning as left and right ventricular preload vessels, respectively.
Ultrasonic flow probes (T410 system, Transonic, Ithaca, US) were used to measure flows (relative accuracy ± 1–2%) whereas specific sensors were employed to record pressure (P10EZ, Becton Dickinson, Sint-Niklaas, Belgium; Range −50 to 300 mmHg; Non-linearity ± 1.5 mmHg from 0 to 300 mmHg).
The IABP balloon
The IABP Balloon catheter (8FR, 40 ml Xemex Balloon Plus, Zeon Medical, Tokyo, Japan) was connected to a Datascope System 97 console (Maquet/Datascope Corp., Fairfield, NJ, USA). The balloon length was 243 mm, and its diameter was15.1 mm. A guidewire was introduced via the central lumen inside the inner tube.
The distal part of the balloon was placed 1 cm below the brachiocephalic branch in all experiments. Measurements were performed with the balloon off or on and set 1:1 ratio.
Experimental setup
The water level in the mock system was matched, and the flow and pressure sensors were set to zero at the start of each experiment. The circulation system was primed to a pressure level of 7.0 mmHg. Proximal and distal input conditions to pressure and flow patterns were fine-tuned. Systemic arterial and peripheral resistance were adapted to human physiological values.12–14
Twelve simulations were performed in total. In each one, the following parameters were measured (Figure 3): proximal aortic pressure (PAOprox), proximal aortic flow (QAOprox), carotid (brachiocephalic) pressure (PCAR) pressure, mid-aortic pressure (PAOMID; pressure between the balloon and the aortic wall at mid balloon length), distal aortic pressure 1(PAODIST1), distal aortic flow1 (QAODIST1) measured after the distal tip of the balloon, distal aortic pressure 2 (PAODIST2), distal aortic flow 2 (QAODIST2) measured before the mesenteric branch, visceral pressure (PVIS) and visceral flow (QVIS), distal aortic pressure 3 (PAODIST3), distal aortic flow 3 (QAODIST3) after the mesenteric branch.

Placement points of the 12 pressure and flow probes.
Validation
For validation both the steady-state enhancement and signal stability were evaluated (see Appendix 1).
The stability and reliability of the system were assessed. Signals before and during IABP assistance, were firstly “smoothed,” and the gradient (GRAD) was calculated as follows:
GRAD = ∂ f(t)/ ∂t, where f(t) is the “smoothed function” of each signal.
The system was deemed stable when in all 12 signals, the steady-state was reached, defined as an absolute variation of the GRAD < 3 × 10⁻⁴ for at least 16 s. Measurements of multiple flows and pressure signals with the required corresponding adjustment of the compliance were carried out for 30–90 min until the beginning of data acquisition.
Also, the agreement of system data with clinical data was tested. For this purpose, the following parameters were examined: SV, HR, CO, PAOmean, QMES, and PMES. Referring data came from our previous in vivo and in vitro experiences and other related literature.9–12,15
Statistical analysis
During stable phases, five intervals of 10 and 20 beats, were randomly chosen with the balloon off and on, respectively. Data were tested for normality with the Kolmogorov-Smirnov test. Data normally distributed is expressed as the Mean ± 1 SD. When the data were not normally distributed, the median [Interquartile Range] is reported. The Mann-Whitney test was utilized to compare reference and simulation data tests, and a value <0.05 was deemed significant. The Bland Altman method was employed to test the reliability of measurements paired t-test and Pearson’s Correlation test. 22 The analysis was performed with R 3.6.3 (R Foundation for statistical computing, Wien, Austria) and Mat Lab (The MathWorks Inc, Natick, MA)
Results
With the balloon off, the meantime, to reach the steady state was 48 ± 16 s (range 40–97 sec.). With the balloon on, this figure was 178 ± 20 s (range 140–206 s). The stability of pressure and flow signals was obtained after 72 ± 11 min. The number of cycles of stability of the system was 93 [86–103] (range 20–150) cycles and 62 [35–78] (range 22–112) cycles, with the balloon off and on, respectively.
As shown in Figure 4, the measurements were reliable either with intervals of 10 or 20 beats without any difference in all parameters between 10 and 20 beats.

Bland Altman plot with Ballon Off (A) and On (B).
The model (Table 1) shows relatively good agreement with clinical reference values for SV, HR, CO, and PAOmid. 12 Furthermore, visceral flow and pressure were comparable to previously published data. The system’s Response to IABP support indicates a proper implementation of a counterpulsation balloon (Figure 5).
Comparison of reference values and simulated values.
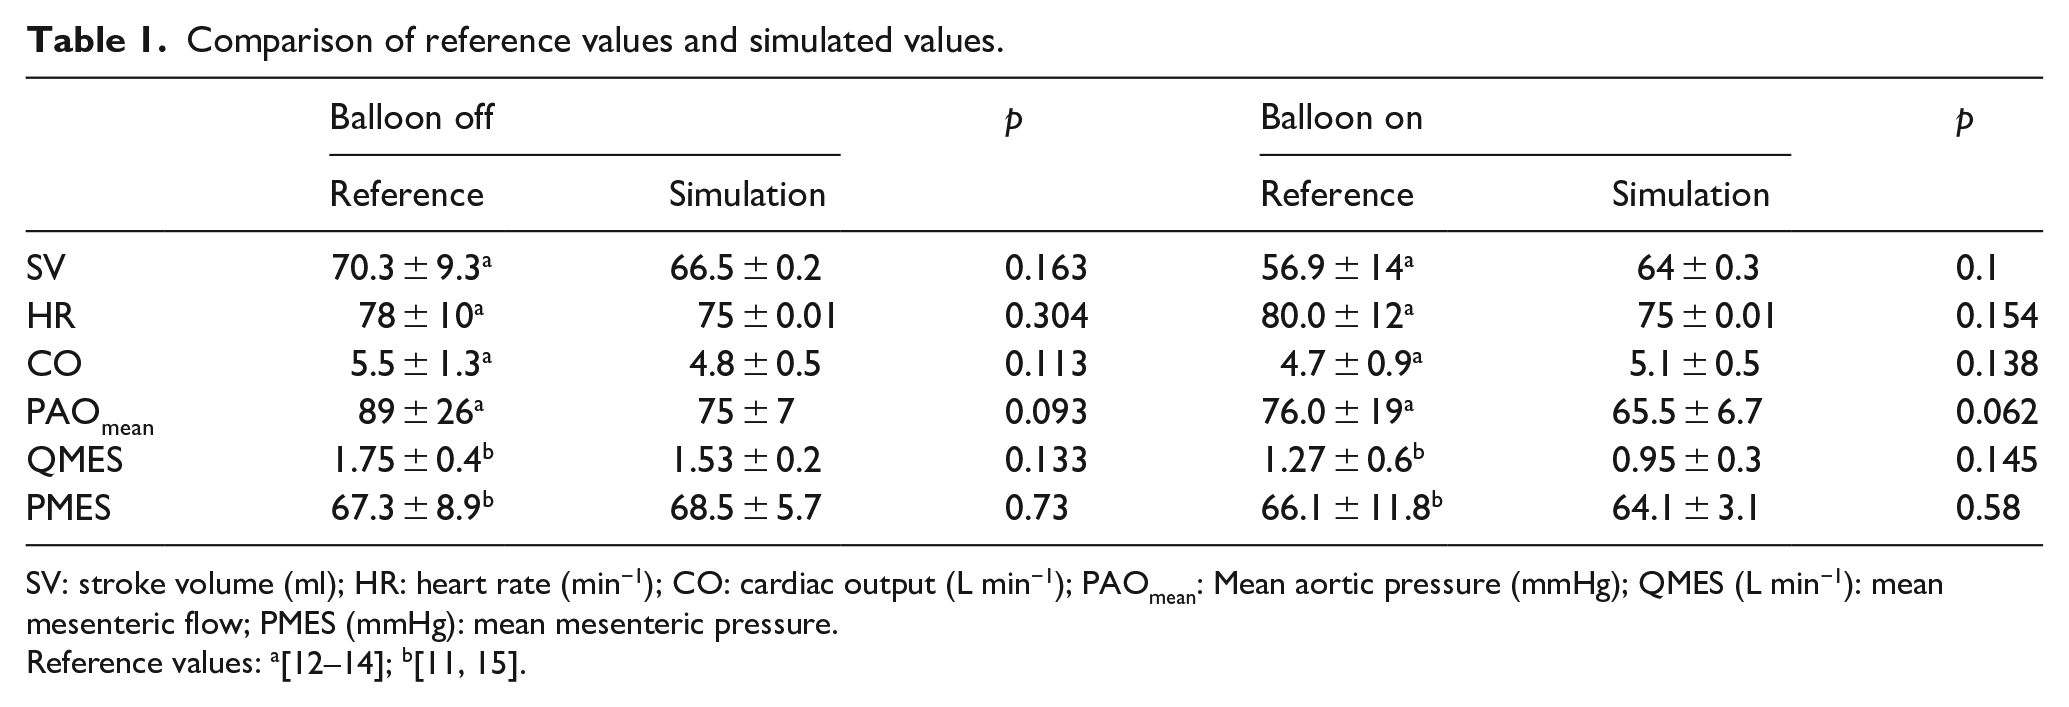
SV: stroke volume (ml); HR: heart rate (min−1); CO: cardiac output (L min−1); PAOmean: Mean aortic pressure (mmHg); QMES (L min−1): mean mesenteric flow; PMES (mmHg): mean mesenteric pressure.

Sample of the 12 signals acquired for mesenteric pressure and flow with balloon off. Pressure and flow with balloon off (a, c) and on (b, d) is true.
Discussion
During the past decade, several mock devices have been proposed for studying and optimizing on the topic of IABP, with specifications depending on the research objective.23–26 They were using different aortic designs,23,26 testing different aortic balloon designs under different conditions 26 mainly focusing on the proximal side of the balloon. Kolyva et al. 26 employed an “aortic root” of a real size silicone rubber aortic model (Hemo Lab, Eindhoven, The Netherlands) with 11 main branches that were connected to an extracorporeal left ventricular assist device (BVS 5000 blood pump, Abiomed Inc., Danvers, MA, USA). The physiological distribution of terminal resistance was implemented across the model with capillary tubes of different size fitted at the outlets of all branches. The ends of the “aortic” branches were attached to a standard tube that simulated the venous system and was connected to an overhead reservoir open to the air.
The objective of the present study was to validate a mock system to ensure it functions physiologically to allow testing the visceral flows during the use of IABP under well-controlled circumstances. The pathophysiology of the proximal part of the balloon has been well studied, whereas, below the distal portion of the balloon, it has been poorly investigated, and it is still far from being fully understood. 27 Within the system described, it is possible to focus in-depth on the flow characteristics below the distal part of the balloon, focusing on system resistance, compliance, and inheritance properties of brachiocephalic, systemic, pulmonary, and visceral circulation mimicked by windkessel models. This model-controlled mock circulation was capable of generating pressure and flow curves that closely mimicked systemic and pulmonary flow and pressure. The behavior of the presented system was tested in Response to Changes in left ventricular contractile states, loading conditions, and heart rate.8,19 The model was implemented in a servomotor driven mock loop, together with a relatively simple lead-lag controller. The pressure and flow signals measured closely mimicked human pressure under both physiological and pathological conditions. Also, the system’s response to changes in preload, afterload, and heart rate indicate a proper implementation of the incorporated feedback mechanisms (frequency and cardiac function control). Therefore, the presented mock circulation allows for generic in vitro testing of the distal aortic flow below the IABP under well-controlled circumstances.
Since IABP ischemia mainly occurs in the mesenteric artery 11 we built a one-branch aorta to study the flow below the balloon accurately. A windkessel model mimics the visceral circulation under physiological and pathological conditions making our system simple but, at the same time, reducing the bias despite including multiple branches approximating their single physical characteristics of the flow.
Moreover, the aorta was modeled as a straight, rigid tube to withstand the general pressure generated within the mock system. A rigid tube better reflects the stiffness od a diseased aorta of patients needing counterpulsation. Indeed, it is well known that changes of aorta occur due to age and gender and cardiovascular disease and calcification 28 and that the mechanical properties of the aorta influence the aortic Response to IABP performance.29–31 This reason mainly made us exclude a fully flexible aortic model. Nonetheless, the tube still showed to allow some degree of aortic distension since a complete uncompliant tube would have had a more substantial influence on the free radial blood volume pattern next to the balloon, even in a horizontal position, 6 leading to different blood flow and pressure outcomes toward the visceral vessels.
The aortic dimensions were based on our previous observations on both healthy and hypertensive subjects, 21 to address as much as possible a chronic pathological aorta. The use of water as flowing medium in setups used for IABP testing is common in the literature.17,32
Therefore, we have chosen an aorta as close as possible to the human cardiac setting with the limits of the in vitro setup, shared with other published mock systems. Hence, to transfer to the system and data obtained to clinics needs further tests.
The model, together with the controller, was shown to be stable under both baseline conditions and when the IABP was used. This stability was obtained in a relatively fast time, even in the presence of the balloon, and it was well maintained throughout the experiment. The average tracking errors were 1–2% for flow and 1.5 mmHg for pressure probes.
We confirmed that the highest tracking errors occurred when the cardiac valves in the model opened or closed, inducing steep pressure rises or drops, and this was considered acceptable. 32 A further contributor to the error was a relatively high-frequency disturbance generated by the linear actuator. 32 This is in accordance with data from Colacino et al. 33 They used a similar controller, in combination with a time-varying elastance heart model, and realized an excellent tracking performance as well.
However, the stability was obtained in the system either with 10 or 20 samples; therefore, for future applications, we will use ten samples of 5 intervals of beats, as this is the smallest interval showing the stability of the system.
The mock circulation system was also reliable in all 12 parameters measured. Indeed, in the present study, the reliability of the mock system, as indicated by Cronbach α, was very close to one in all parameters. This was also confirmed by the inter-item correlation matrix and intra-class correlation coefficient values.
This reliability is vital in such a system in which only small variabilities are observed for the repeatability and reproducibility of the experiments.
Finally, values obtained for the hemodynamic parameters with the balloon on and off were comparable to those seen in patients under the same conditions.13–15 Visceral flows and pressures are not obtainable in our cardiothoracic patients. Therefore, we compared the values obtained with the simulator to our previous experimental IABP data.9–11 The visceral pressure and volume were not significantly different from those from the animal model.
Pathophysiological and clinical applications
Despite the improved design of balloon catheter and implantation techniques over the years, visceral ischemia is still a challenging and insidious complication, resulting in irreversible organ damages and unfavorable prognosis. 5 In our previous work, 9 we have demonstrated the importance of the correctly implanted balloon length on mesenteric flow. In these studies, a shorter balloon improved visceral flows when compared with conventional IABP catheters. Our mock circulation system will allow us to obtain further mechanistic insights into the reasons behind the variable performances with regards to the abdominal flow by balloons of different lengths. Also, it will be possible to utilize the system to study pressures and flows around the balloon and to test whether, and maybe more importantly, how the lower volume around a larger or- shorter balloon influences hemodynamics. 11
Moreover, the use of the IABP has been questioned over the last few years by the SHOCK II trial. 34 This study has opened a debate that has been recently re-ignited by new literature in favor of the use of the IABP in cardiogenic shock.35,36 Our system allows variation in the “cardiac contractility,” which can then mimic patients with different degrees of cardiac failure that can be tested for advantages gained with the use of different IABP. This, apart from providing new insights into whether heart failure patients may benefit or not from IABP, will help us in trying to identify the pathophysiologic mechanism behind its potential beneficial effects. Likewise, there is the possibility of testing beta-blockers in heart failure simulation to verify the impact of this intervention in combination with mechanical support.
Furthermore, malpositioning of the IABP balloon is one of the leading causes of ischemia in the visceral arteries. 5 Although anatomic landmarks on plain chest radiography have been established to define correct proximal IABP position and to avoid blockade of the visceral arteries during balloon inflation, malpositioning is still not infrequent. 5 In addition to the mechanical consequences of malpositioning (i.e. the overlap of the mesenteric vessels), little is known about the real influence of IABP misplacement or to what extent this depends on an incorrect synchronization of the balloon. The model described in this study could be used to answer some of these pressing questions.
Limitations
Our system has several limitations that must be acknowledged. First of all, it only allows us to generically test cardiovascular devices (i.e. not patient-specific in vitro modeling). Secondly, the “aorta” was a straight polyurethane tube, whereas a more refined phantom might be employed. 37 Thirdly, peripheral resistances were assumed constant, and the baroreflex regulation was not included. Indeed, although a decrease in systolic aortic pressure during IABP support indicates systolic unloading and an afterload reduction, this could be the result of alteration in baroreceptor response during IABP. 38 Fourthly we did not include coronary flow in our system to reduce the complexity of the model and because this is a well-studied effect of the IABP. 15 Fifthly, the influence of the venous blood volume was not included. Besides, water was used as the solution to fill the mock circulation system, that has a viscosity approximately three times as low as for blood. 39 Sixthly, comparisons between balloon on and off were not accomplished. This was beyond the aim of the study, and it will be the object of future research.
Finally, reference values of mesenteric pressures and flows were taken from our animal studies as human data in this regard are not currently available to our knowledge.
Conclusion
The presented mock circulation was reliable and was highly accurate under both baseline conditions and during IABP assistance. This system includes a systemic circulation, pulmonary circulation, and a heart contraction model, and it allows a correct evaluation of the mesenteric flow during IABP. Future studies will concentrate on testing various balloons under different clinical/hemodynamic conditions.
Footnotes
Authors Contributions
Declaration of Conflicting Interests
The author(s) declared no potential conflicts of interest with respect to the research, authorship, and/or publication of this article.
Funding
The author(s) disclosed receipt of the following financial support for the research, authorship, and/or publication of this article: The work partially supported by XEMEX (Tokyo, Japan)

Appendix
System reliability.

| Signals | p † | p ‡ | p § | p ¶ |
|---|---|---|---|---|
| PAOprox | 0.63 | 0.2 | 0.8 | 0.36 |
| PAOmid | 0.42 | 0.13 | 0.9 | 0.63 |
| PCAR | 0.49 | 0.51 | 0.91 | 0.56 |
| P dist1 | 0.2 | 0.32 | 0.44 | 0.42 |
| P dist2 | 0.3 | 0.9 | 0.18 | 0.13 |
| P dist3 | 0.6 | 0.87 | 0.7 | 0.77 |
| PMES | 0.16 | 0.23 | 0.83 | 0.13 |
| QAOprox | 0.32 | 0.83 | 0.68 | 0.86 |
| Qdist1 | 0.89 | 0.24 | 0.46 | 0.87 |
| Qdist2 | 0.24 | 0.4 | 1 | 0.93 |
| Qdist3 | 0.2 | 0.22 | 0.86 | 0.7 |
| QMES | 0.2 | 0.21 | 0.59 | 0.3 |
PAOprox: proximal aortic pressure; PAOMID: Mid aortic pressure (pressure between the balloon and the aortic wall at mid balloon length); PCAR: Carotid (brachiocephalic) pressure; PAODIST1: distal aortic pressure 1; PAODIST2: distal aortic pressure 2; PAODIST3: distal aortic pressure 3; PMES: Mesenteric Pressure; QAOprox: proximal aortic flow; QAODIST1: distal aortic flow 1 (measured after the distal tip of the balloon); QAODIST2: distal aortic flow 2 (measured before the mesenteric branch); QAODIST3: distal aortic flow 3 (measured after the mesenteric branch).
Paired t-test on.
Paired t-test off.
Pearson’s correlation on.
Pearson’s correlation off.