
Abstract
Introduction
There is a lack of data supporting rationale drug use with extracorporeal membrane oxygenation (ECMO). The aim of this study was to externally validate a previously developed population pharmacokinetic model of meropenem in neonatal ECMO and continuous renal replacement therapy.
Methods
A total of twenty-eight neonates with a body weight of 3.81 (3.45–4.11) kg, median (interquartile) and a postnatal age of 3 (2–4) days were enrolled. One hundred plasma concentrations of meropenem were used for external validation by a published population pharmacokinetic analysis model using NONMEM V7.3.0 (ICON Development Solutions, Ellicott City, MD, USA) and PsN v3.4.2, both running in Pirana 2.9.0. Prediction error analyses, and NPDE diagnostics were performed to assess the model’s extrapolative capability. Bayesian forecasting was conducted to determine the impact of prior concentration information on predictive performance.
Results
Population-based predictions showed minimal overall bias but limited accuracy, with substantial variability between predicted and observed concentrations and less than half of predictions falling within an acceptable deviation range. After incorporating one prior measured concentration through Bayesian forecasting, predictive performance improved markedly. Most predictions were then close to the values observed, and overall accuracy increased substantially.
Conclusions
The meropenem population pharmacokinetic model provides unbiased but imprecise population-level predictions and is therefore not suitable for a priori dosing in neonatal ECMO patients. Including just one prior concentration greatly improves prediction, supporting the use of this model for Bayesian, therapeutic drug monitoring–guided dosing of meropenem in this vulnerable population. (The study identification number is K 2026-0116).
Introduction
Extracorporeal membrane oxygenation (ECMO) has been used since the 1970s. 1 However, the impact of ECMO on rational drug use is still a matter of debate.2–5 For meropenem, studies in adults have shown conflicting results with minimal increase or no effect on volume of distribution (Vd), minimal circuit loss and reduced clearance (CL).6–8 It is believed that physicochemical properties of a drug contribute to the relevant pharmacokinetic (PK) changes of the drug administered during ECMO. 9 Pharmacological evidence is lacking in the neonatal population treated with antimicrobials, ECMO, and continuous renal replacement therapy (CRRT). 10 For meropenem, a widely used hydrophilic antibiotic with a logarithmic partition coefficient (log P) of −0.6, predominantly distributed extracellularly and excreted by the kidneys, it is known that the main determinants of dosage adjustment in neonates are body weight (BW) and postnatal age (PNA), together with glomerular filtration rate (GFR). 11 Meropenem exhibits significant interindividual PK variability, 12 particularly in patients with altered renal function or in patients receiving CRRT, making therapeutic drug monitoring (TDM) valuable in ensuring effective and safe treatment. 13
Measured serum meropenem concentrations can be used to evaluate the exposure–response relationship, with the pharmacodynamic target defined as maintenance of free drug concentrations above the minimum inhibitory concentration (fT>MIC) for 40–100% of the dosing interval, depending on infection severity. Population pharmacokinetic (pop PK) models may further assist in optimizing individual dosage regimens. Furthermore, external evaluation is necessary to determine whether pop PK models are applicable and reliable in high-risk populations (critically ill neonates and children).9,14 The aim of this project, which was carried out by a team of collaborators consisting of General Faculty Hospital in Prague, Karolinska University Hospital in Stockholm, Erasmus MC Rotterdam in Rotterdam, was to externally validate our previously published pop PK model for meropenem in neonatal and pediatric ECMO and CRRT, with the goal of supporting targeted therapy in neonates. 15
Methods
Study design, setting and population
The project was conducted according to a protocol approved by the Ethics Committee of the Department of Ethics of the General University in Prague (February 29, 2024) in collaboration with the Karolinska University Hospital in Stockholm, Sweden. The protocol was also approved with the identification number K 2026-0116 at the Karolinska University Hospital in Stockholm, Sweden, while the ethics committee was approved by the Swedish Council for Research Ethics with the protocol identification number Dnr. 2024-05,548-02 (October 15, 2024). External validation included retrospective records of neonates treated with meropenem using the patient data management system (Take Care digital journal system, Compu Group, Stockholm, Sweden; Centricity Critical Care Clinisoft, GE Healthcare Europe, Stockholm, Sweden) from ECMO Centre at the Astrid Lindgren Children´s Hospital, Karolinska University Hospital, Stockholm, Sweden, from January 2022 to December 2023. Inclusion criteria were as follows: (1) neonates admitted within 0-28 days of age treated with meropenem and ECMO, and/or CRRT due to pneumonia, sepsis or septic shock, acute respiratory distress, meconium aspiration syndrome, congenital diaphragmatic hernia or persistent pulmonary hypertension; (2) with at least two measurements of meropenem plasma levels during ECMO treatment. Exclusion criteria were as follows: (1) refusal of the general informed consent letter; (2) incomplete data set.
CRRT was performed using Prismaflex 8 system (Prismaflex, Baxter/Vantive, Sweden) equipped with HF20 haemofilter (HF20, Baxter/Vantive, Sweden). CRRT outflow and return lines were connected to the low-pressure side of the ECMO device. Continuous venovenous hemodiafiltration (CVVHDF) modality was used, with Hemosol (Baxter/Vantive, Sweden) used as both dialysate and as replacement solution fluid. The initial prescribed dialysis dose was 30 mL/kg/h, and anticoagulation was administered.
Characteristics of the patient populations used for external validation of the pop PK model of meropenem.
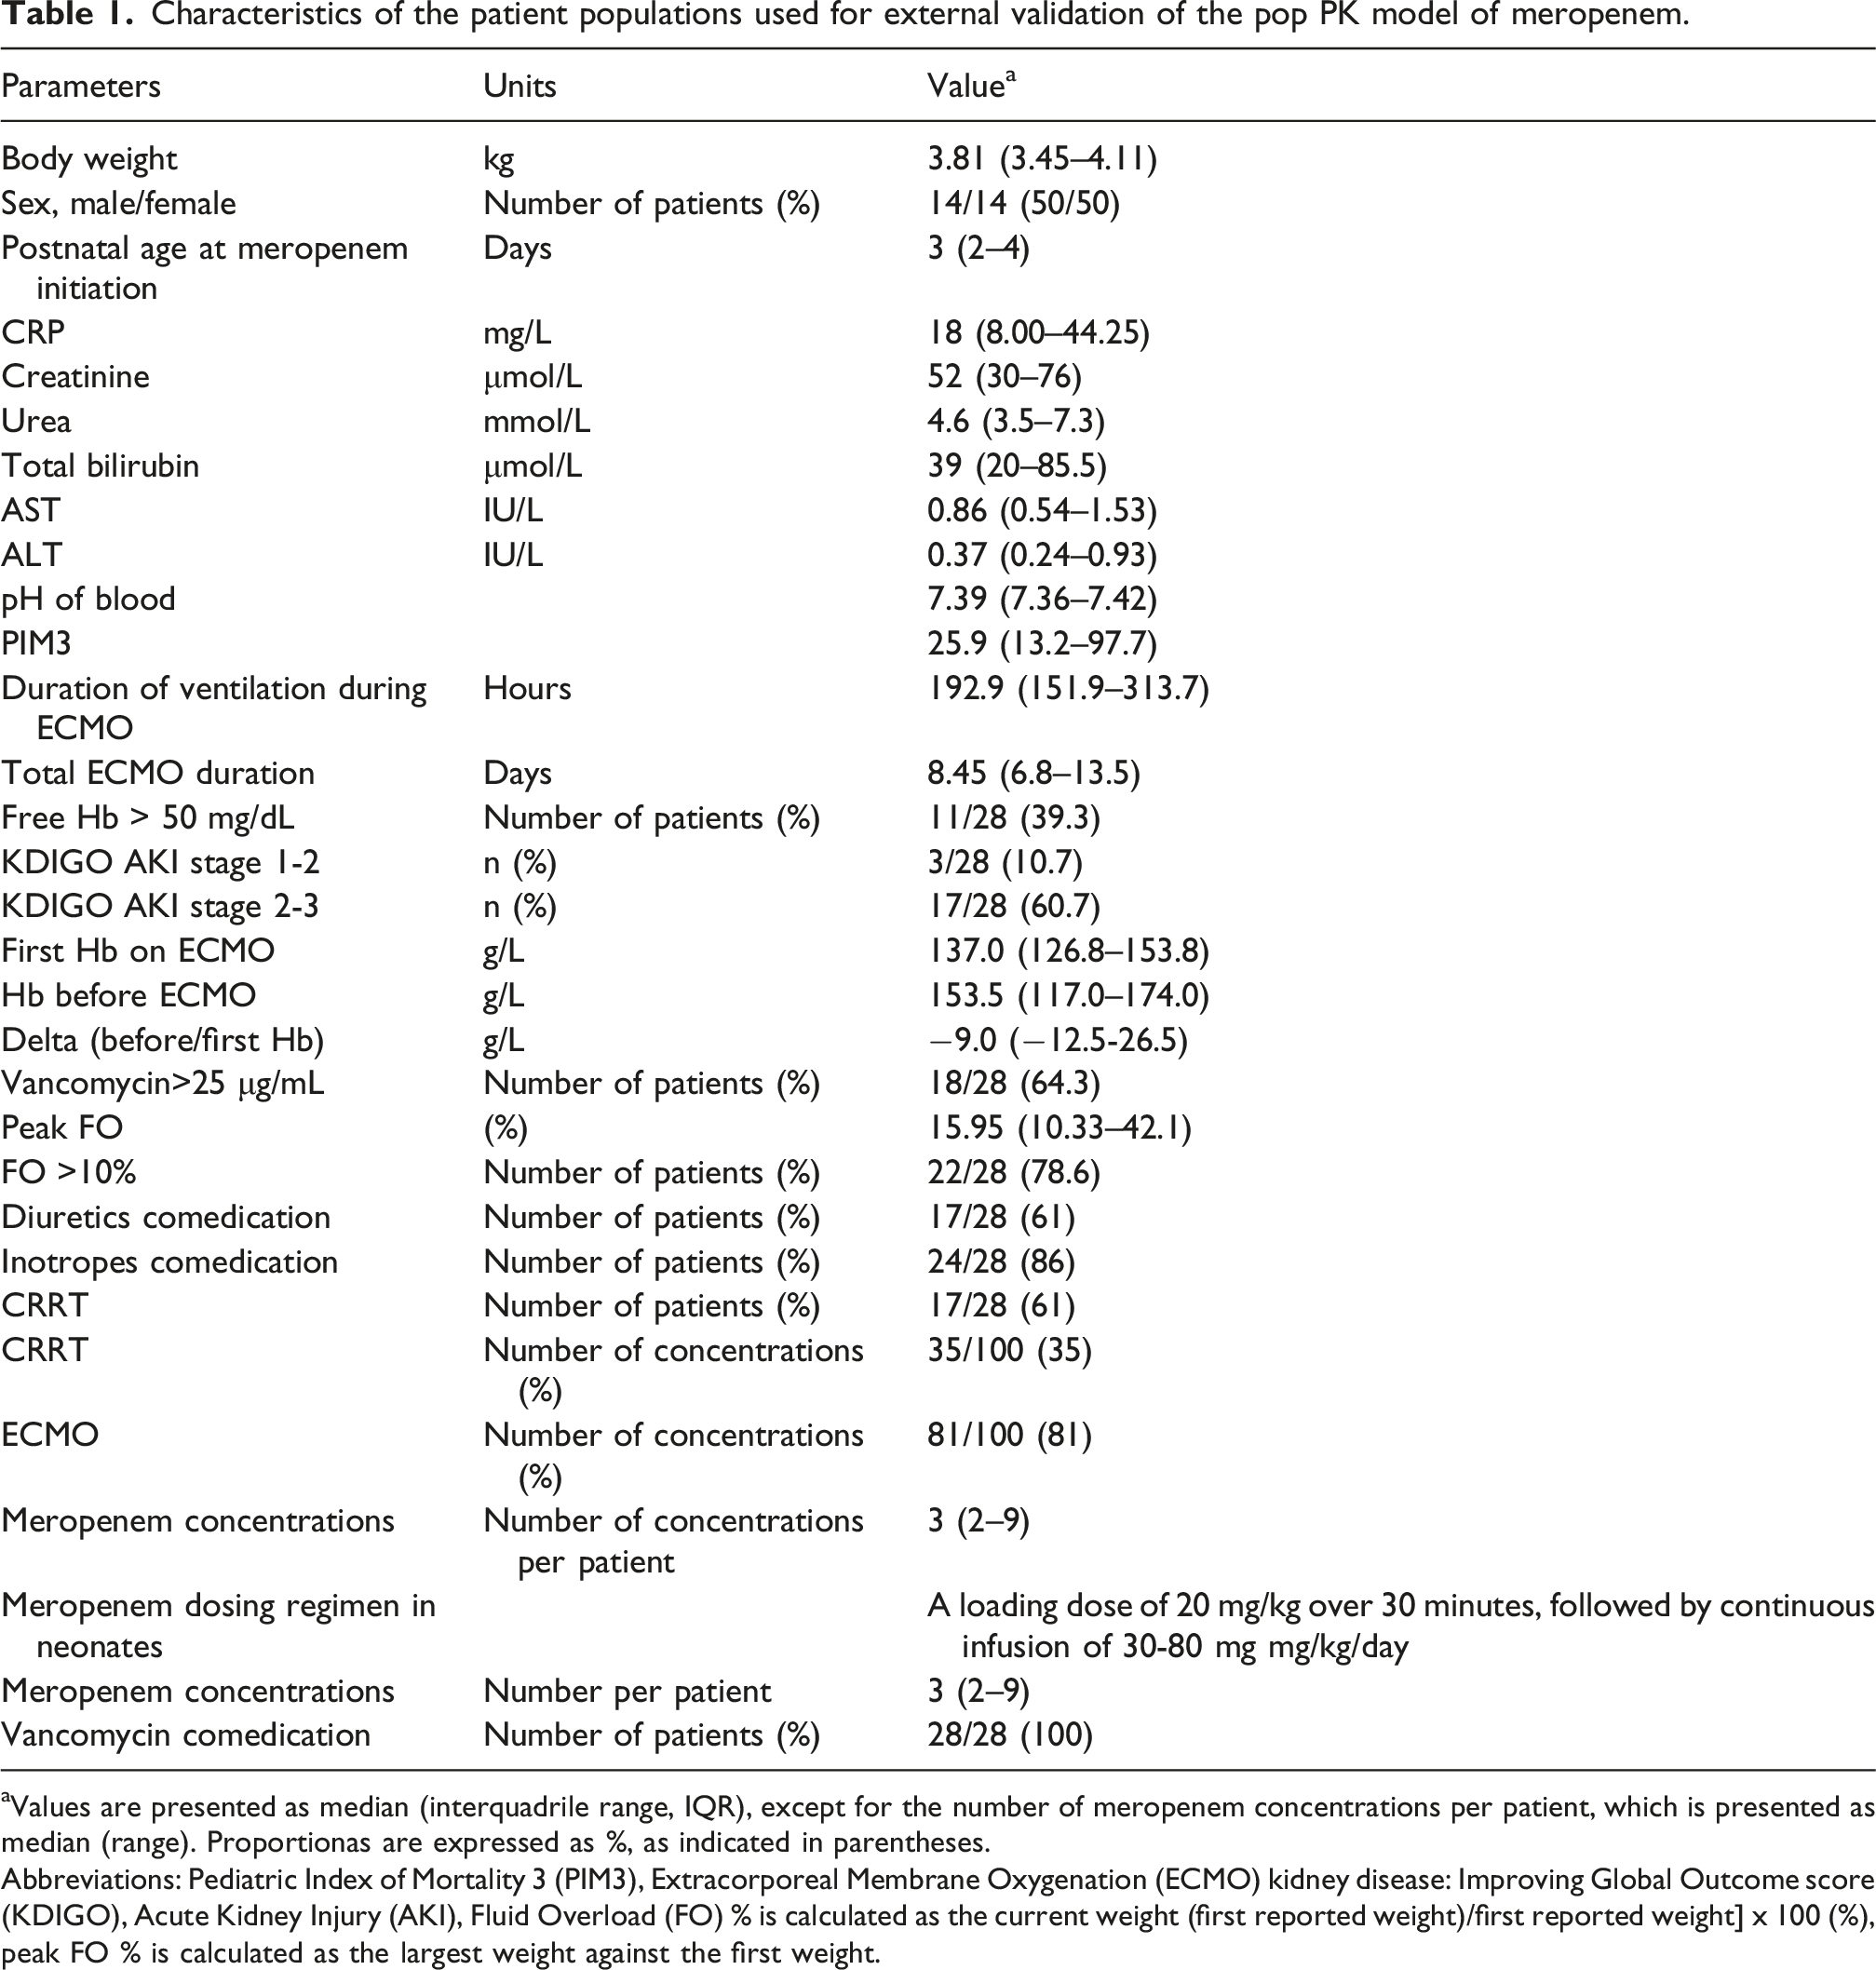
aValues are presented as median (interquadrile range, IQR), except for the number of meropenem concentrations per patient, which is presented as median (range). Proportionas are expressed as %, as indicated in parentheses.
Abbreviations: Pediatric Index of Mortality 3 (PIM3), Extracorporeal Membrane Oxygenation (ECMO) kidney disease: Improving Global Outcome score (KDIGO), Acute Kidney Injury (AKI), Fluid Overload (FO) % is calculated as the current weight (first reported weight)/first reported weight] x 100 (%), peak FO % is calculated as the largest weight against the first weight.
Data collection
The exact times of dosing and blood sampling were recorded. Sex, postnatal age at start of the treatment, body weight (BW), serum urea, creatinine, total bilirubin, alanine aminotransferase, aspartate aminotransferase, pH of blood, C reactive protein, free haemoglobin, haemoglobin, also paediatric index of mortality-3 (PIM3), duration of ECMO treatment, ICU stay, and ventilation were recorded in each patient. Meropenem concentrations were collected from the arterial line as part of the routinely performed TDM (the minimum sample requirement was 5 microliters) and measured using a validated liquid chromatography/tandem mass spectrometry (LC-MS/MS) method. 15 In our local protocol, meropenem TDM is used sparingly. Standard dosing of meropenem was adjusted by the clinician when CRRT was started or stopped.
MICs were determined in the Microbiology Laboratory of Karolinska University Hospital in Stockholm. MICs for meropenem were determined with the solid-phase culture diffusion method. If the MIC was not available, the epidemiological cutoff value was defined by the European Committee for Antimicrobial Susceptibility Testing (EUCAST) and used for the identified pathogens to achieve the targeted therapy with meropenem (fT 40-100% >MIC). 15
External validation of the population pharmacokinetic model
The external validation of the previously published pop PK model 15 was conducted with NONMEM v7.3.0 (ICON Development Solutions, Ellicott City, MD, USA) and PsN v3.4.2, both operated within Pirana 2.9.0.16,17 Data visualization and model diagnostics were carried out using R v4.2.2. Our previously published population pharmacokinetic model was reproduced by implementing its structural equations and parameter values in the NONMEM control file and running them with zero estimation steps (MAXEVAL = 0). 15 Model performance was evaluated using both prediction-based and simulation-based diagnostic methods. Classic goodness of fit (GOF) plots were generated, including observed concentrations (DV) versus population predicted concentrations (PRED), observed concentrations versus individual predicted concentrations (IPRED), conditional weighted residuals (CWRES) versus time, and CWRES versus PRED. These plots were reviewed for systematic bias, trends over time, or heteroscedasticity.
Prediction-based diagnostics
Model predictive performance was evaluated using standard prediction-error metrics. For each observation i, the prediction error (PE) was calculated as: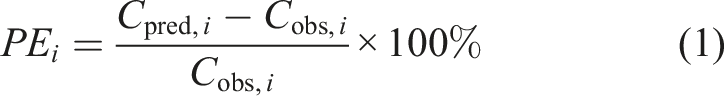
The mean prediction error was calculated as: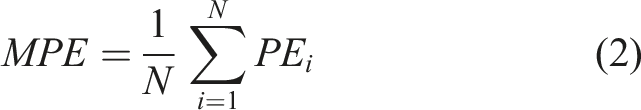
This represents the average % bias. 95% Confidence Interval (CI) for MPE was also calculated as: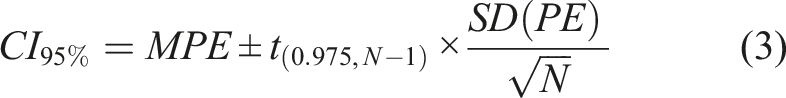
Model bias was assessed using the median prediction error (MDPE), representing systematic under- or overprediction. It was calculated as:
Imprecision was quantified using the median absolute prediction error (MAPE), and calculated as:
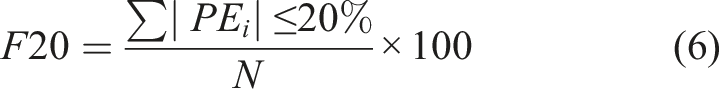
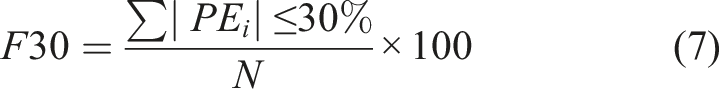
A model was considered to have acceptable predictive performance if MDPE ≤ ±20%, MAPE ≤30%, F20 ≥ 35%, and F30 ≥ 50%, consistent with commonly applied pop PK validation criteria.18,19
In addition to relative error metrics, absolute predictive accuracy was evaluated using the root mean square error (RMSE):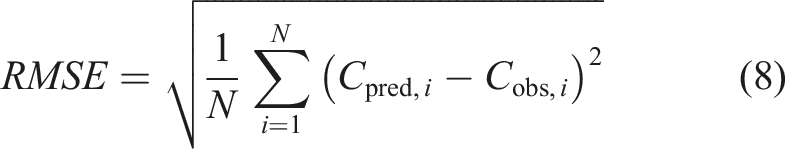
RMSE quantifies the average magnitude of prediction error in concentration units and is interpretable relative to the drug’s typical concentration range. Lower RMSE values reflect better absolute predictive accuracy.
Simulation-based diagnostics: Normalized prediction distribution errors
Distribution-based diagnostics were performed using normalized prediction distribution errors (NPDE), implemented in the NPDE R package. 20 The final NONMEM model was used to simulate 1,000 replicate datasets under the same design (subject IDs, sampling times, and data structure) as the observed dataset. NPDE standardizes the predictive distribution by accounting for heteroscedasticity and nonlinear relationships between variance and predictions.
NPDE were expected to follow a standard normal distribution (mean 0, variance 1) in a well-specified model. The following statistical tests were applied: Wilcoxon signed-rank test for mean NPDE = 0; and F-test for variance = 1. Graphical diagnostics included NPDE histograms, quantile–quantile (Q–Q) plots, and NPDE versus time and NPDE versus predictions plots.
Bayesian forecasting
The maximum a posteriori Bayesian (MAPB) approach was used to evaluate the performance of individualized model predictions (IPRED). 21 As all patients contributed with at least two measured meropenem concentrations, all were eligible for this analysis. For each patient, the earliest available concentration was used to update the individual PK parameters through Bayesian estimation, and the individualized prediction for the subsequent concentration (second observation) was generated based on this prior observation. These individualized predictions were then compared with the corresponding measured concentrations.
Individual prediction error (IPE%) was calculated as: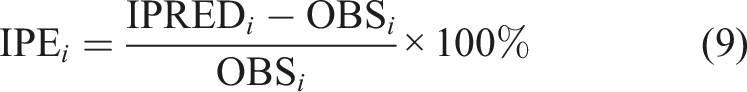
Model performance under the Bayesian framework was assessed using the median individual prediction error (MDIPE) for bias, the median absolute individual prediction error (MAIPE) for precision, and the proportions of predictions within ±20% (IF20) and ±30% (IF30) of the observed concentrations.
Results
Patient population and therapeutic drug monitoring
Twenty-eight neonates (14 males, 14 females) treated with ECMO and meropenem were ultimately enrolled in the study. Demographics, laboratory, clinical characteristics, and co-treatment are shown in Table 1.
Meropenem concentrations did not reach therapeutic targets of 20–40 µg/ml in 27 of 28 neonates (96.4%), and treatment was adjusted (Figure 1). Meropenem concentrations versus time after last dose stratified according to extracorporeal membrane oxygenation (ECMO) and continuous renal replacement therapy (CRRT) status.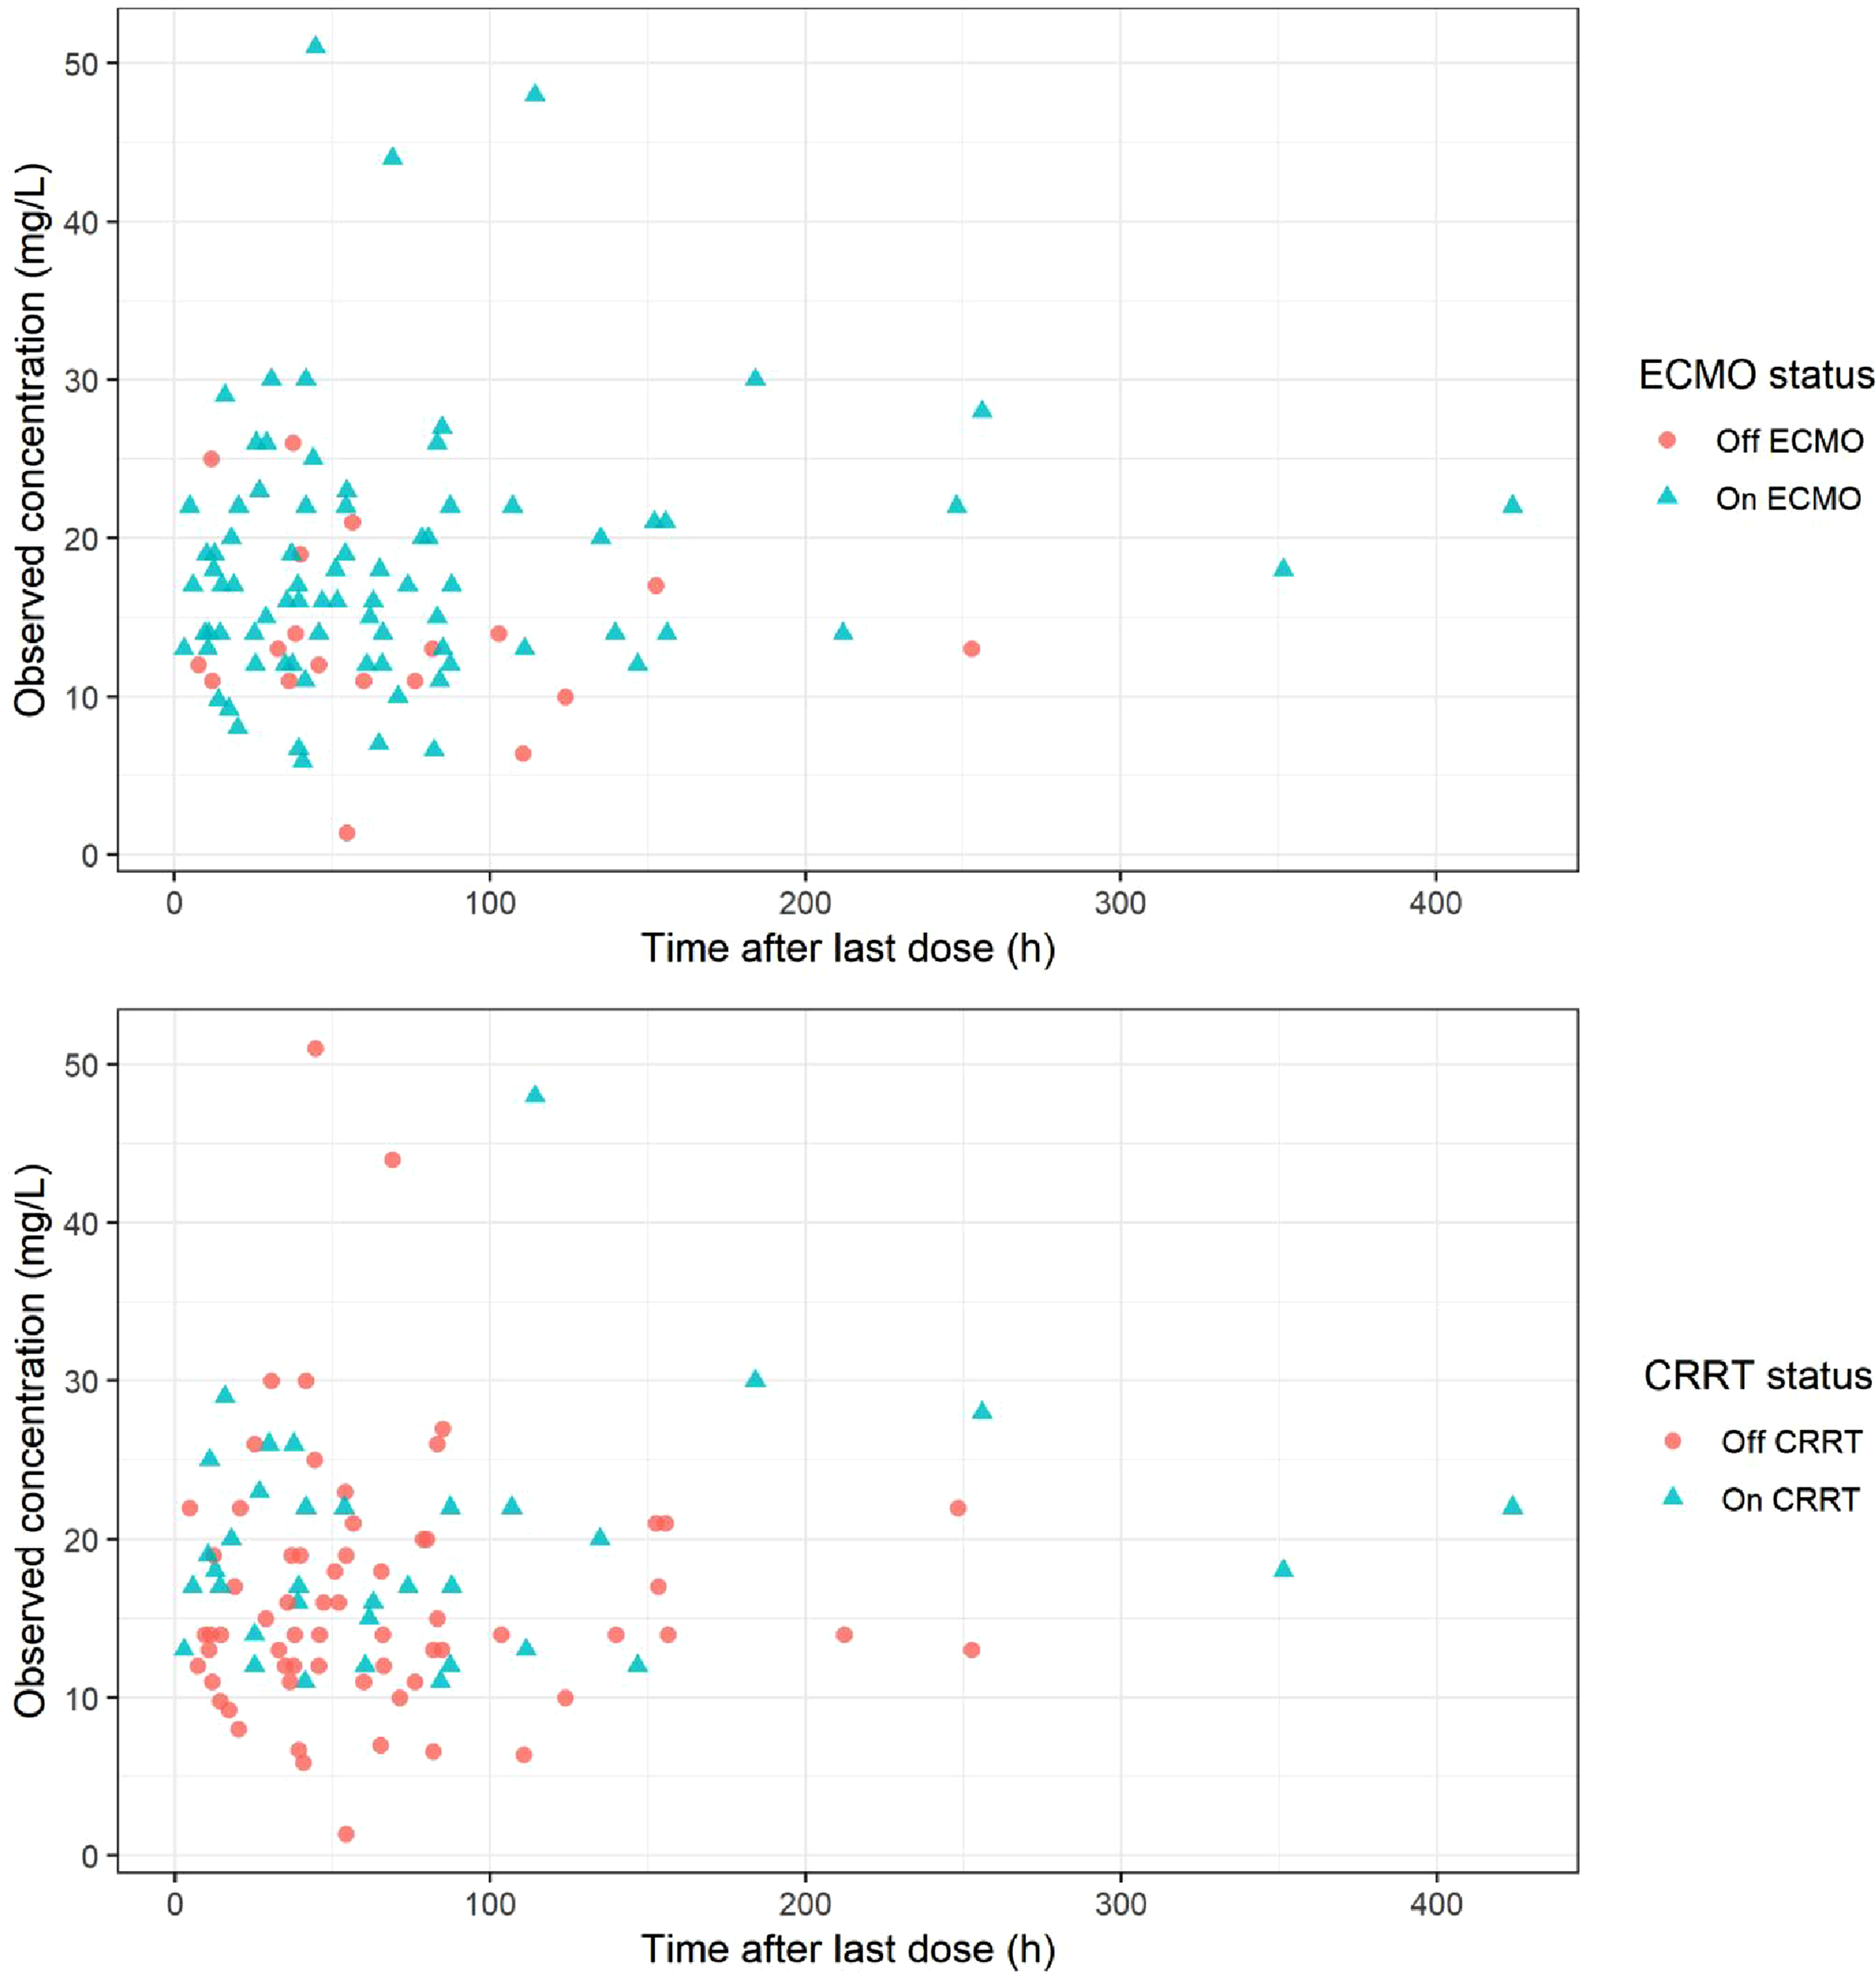
Negative blood cultures were determined in 18/28 (64.3%) neonates, while positive blood cultures were found in 10/28 (35.7%) neonates as follows: Coagulase negative staphylococci 4/28 (14.3%) with MIC >4 mg/L, Escherichia coli 2/28 (7.1%) with MIC = 2 mg/L, susceptible sensitivity for Meropenem (EUCAST), Stenotrophomonas maltophilia 2/28 (7.1%), Micrococcus luteus 1/28 (3.6%), both pathogens were considered ineffective against meropenem, and Bacillus cereus 1/28 (3.6%) with MIC = 0.25 mg/L.
Goodness of fit plots of the final model in the external validation cohort
GOF plots of the final model in the external validation cohort indicated that the model captured the overall PK behaviour reasonably well. The observed concentrations plotted against individual predictions (DV vs IPRED) aligned closely with the line of identity, demonstrating a strong individual fit. In contrast, the DV versus PRED plot showed greater dispersion, particularly at higher concentration values, suggesting some degree of underprediction of peak levels. The CWRES were centred around zero across time, with no systematic temporal trends, indicating an adequate residual distribution. However, a slight negative slope in the CWRES versus PRED plot suggested a minor misspecification in the residual error model. Overall, the GOF diagnostics support an acceptable model fit, with some limitations in predicting higher concentrations (Figure 2). No systematic bias was observed between samples obtained on and off CRRT (Figure 2). Similarly, no systematic bias was observed between samples obtained on and off ECMO (Figure S1 in supplementary material). Goodness of fit plots for the final model of meropenem pharmacokinetics in neonatal population (a) Individual predicted meropenem concentration versus observed meropenem concentration (b) Population predicted meropenem concentration versus observed meropenem concentration (c) Conditional weighted residuals (CWRES) versus Time after last dose (d) Conditional weighted residuals (CWRES) versus population predicted concentrations.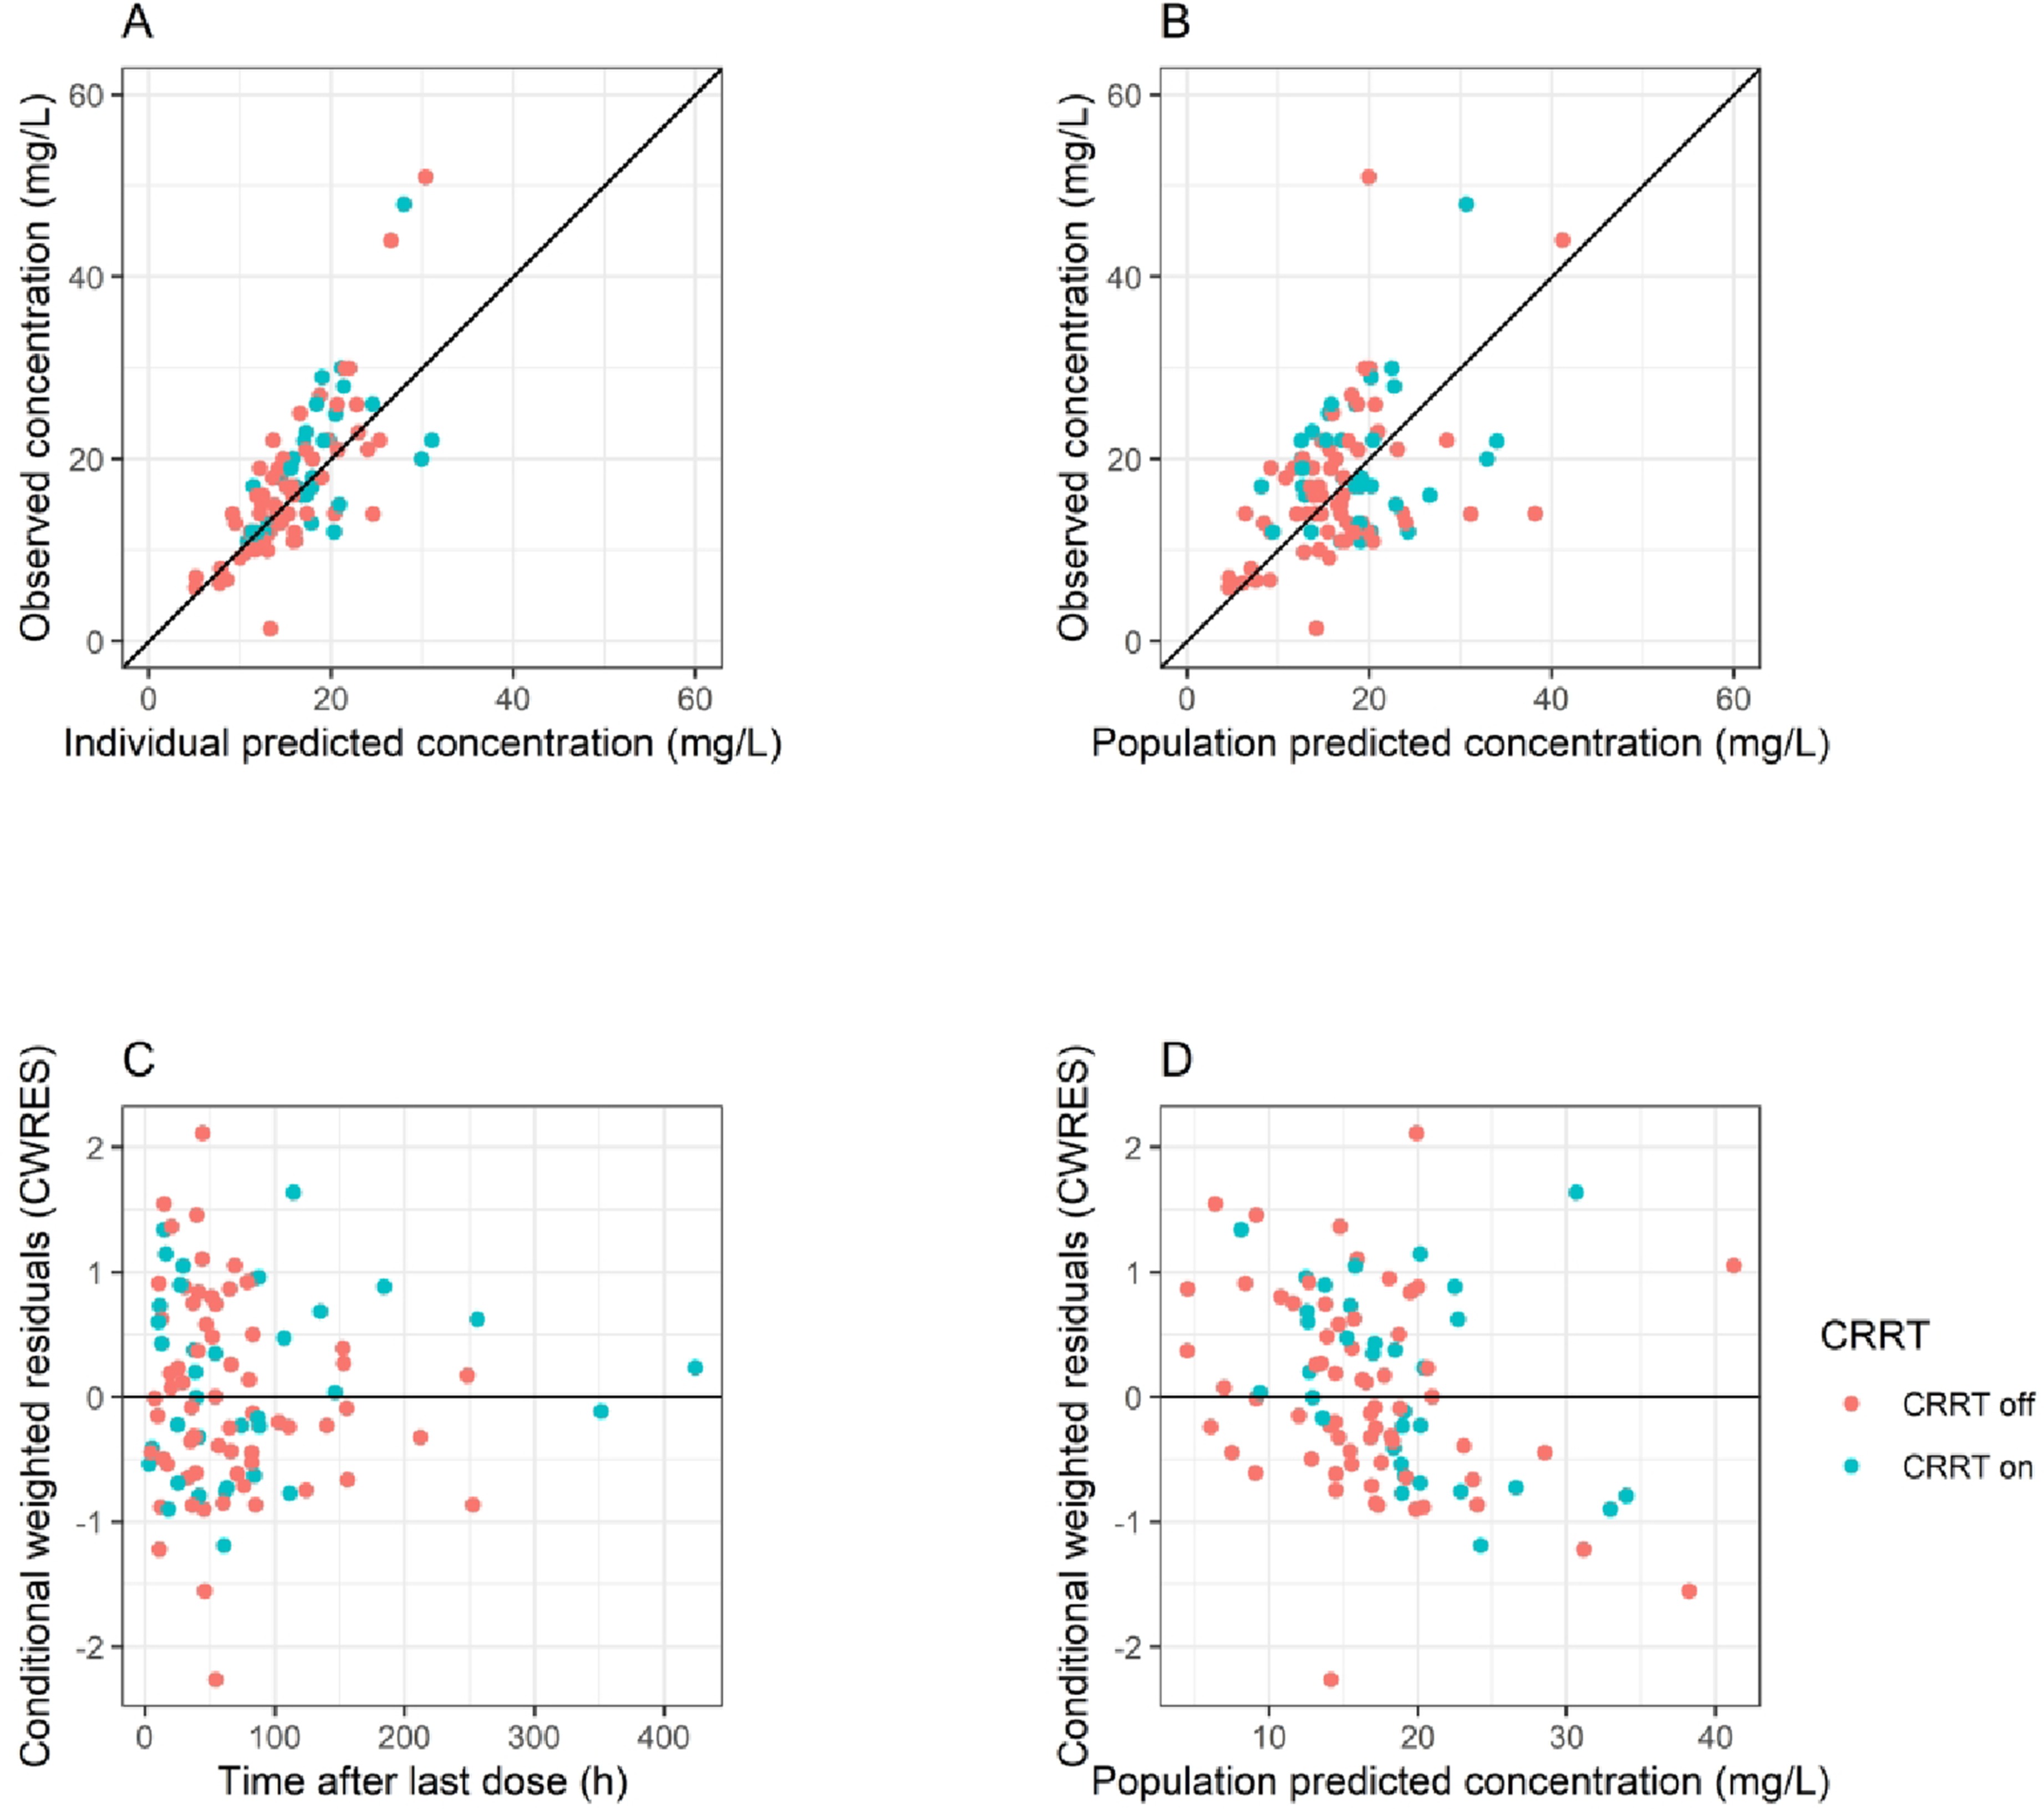
Prediction-based diagnostics
Diagnostic parameters used for external validation of the pop PK model of meropenem.
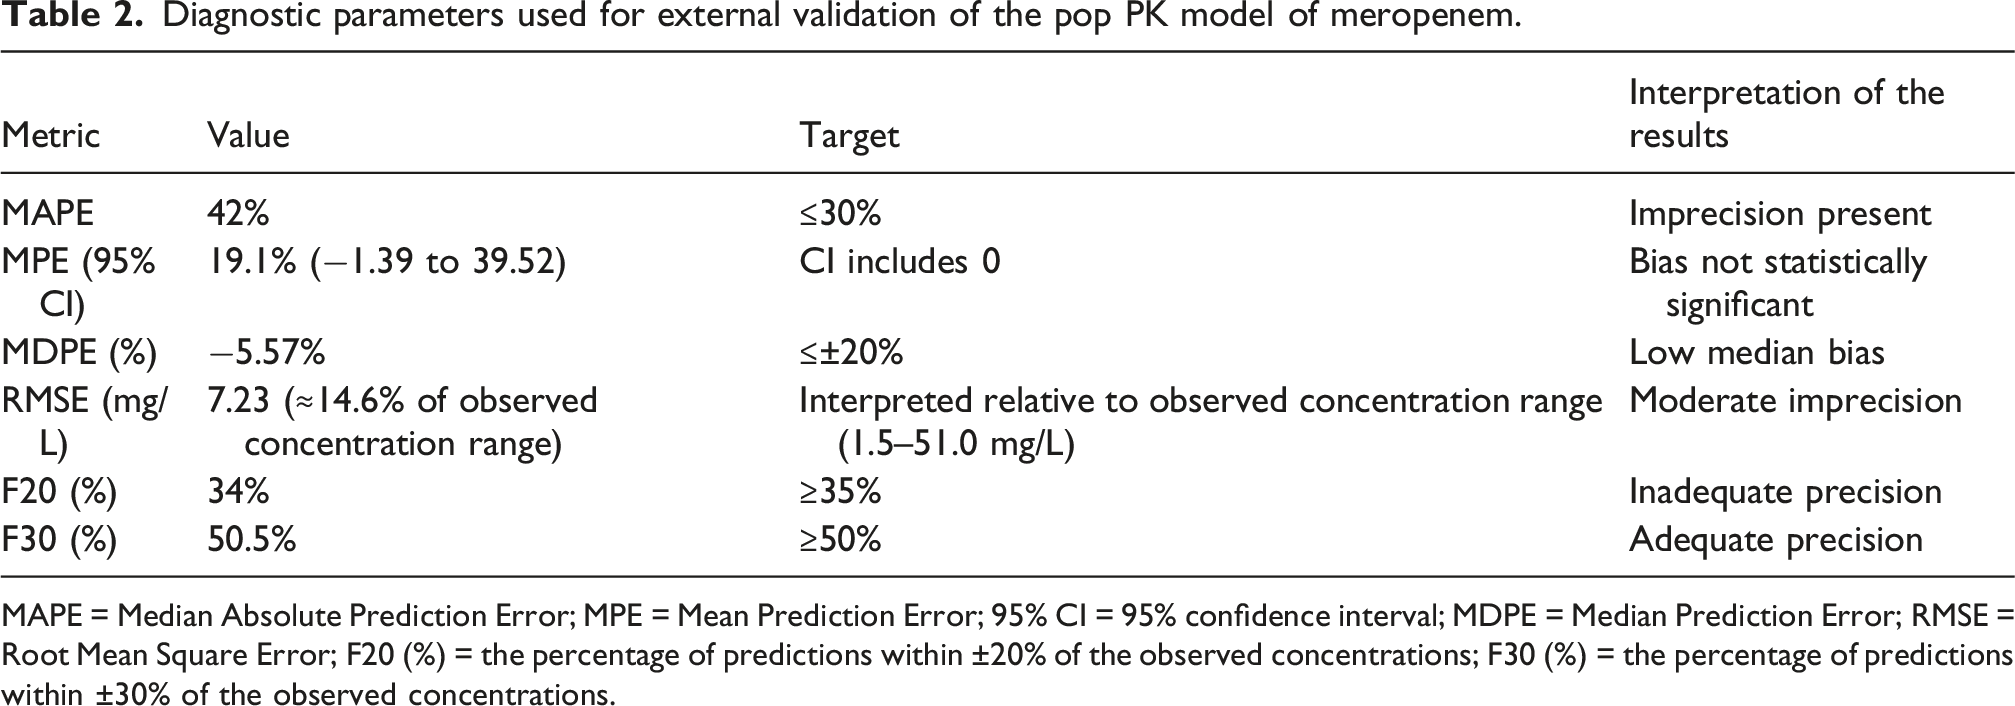
MAPE = Median Absolute Prediction Error; MPE = Mean Prediction Error; 95% CI = 95% confidence interval; MDPE = Median Prediction Error; RMSE = Root Mean Square Error; F20 (%) = the percentage of predictions within ±20% of the observed concentrations; F30 (%) = the percentage of predictions within ±30% of the observed concentrations.
Prediction-based diagnostics showed low model bias but suboptimal precision. The MDPE was −5.57%, indicating slight underprediction and lying well within the commonly accepted ±20% threshold. Similarly, the MPE was 19.1%, and its 95% confidence interval (−1.39 to 39.52) included zero, demonstrating that systematic bias was not statistically significant.
In contrast, the MAPE was 42%, which exceeded the typical target of ≤30%, suggesting imprecision. Moreover, 34% of observations fell within ±20% of predictions (F20), slightly below the desired ≥35% criterion. The F30 value was 50.5%, meeting the minimal acceptance threshold (≥50%). Collectively, these metrics indicate that although the model was not biased, its precision was limited, particularly at the tighter ±20% level.
The RMSE was 7.23 mg/L. Interpretation of RMSE is concentration-scale dependent; given the observed concentration range of the drug (1.51–51.0 mg/L), this value represents moderately absolute prediction error, corresponding to 14–15% of the observed concentration range.
Simulation-based diagnostics: Normalized prediction distribution errors
NPDE indicated that the model described overall PK behaviour adequately, although performance was less accurate at lower concentration levels (Figure 3). The mean NPDE was −0.052 (SE 0.081), which is close to zero, indicating the absence of systematic bias. The NPDE variance was 1.009 (SE 0.15), essentially identical to the expected value of 1, suggesting that residual variability was appropriately captured by the model. Consistently, the statistical tests showed no evidence of model misspecification: the t-test for mean NPDE yielded p = 1, indicating no significant bias, and the Fisher variance test (p = 1) confirmed that the dispersion of the NPDE was acceptable. Taken together, these findings support that the structural and error models adequately represent the observed data, with some limitations in the lower concentration range. Normalized prediction distribution error (NPDE) diagnostics for the evaluated models: Histogram of normalized prediction distribution errors (NPDE) overlaid with the theoretical normal distribution; quantile–quantile plot comparing empirical NPDE with the theoretical distribution and simulation-based 95% confidence intervals; NPDE versus time after dose with empirical percentiles and corresponding simulation-based confidence intervals; and NPDE versus predicted concentrations with empirical percentiles and simulation-based confidence intervals.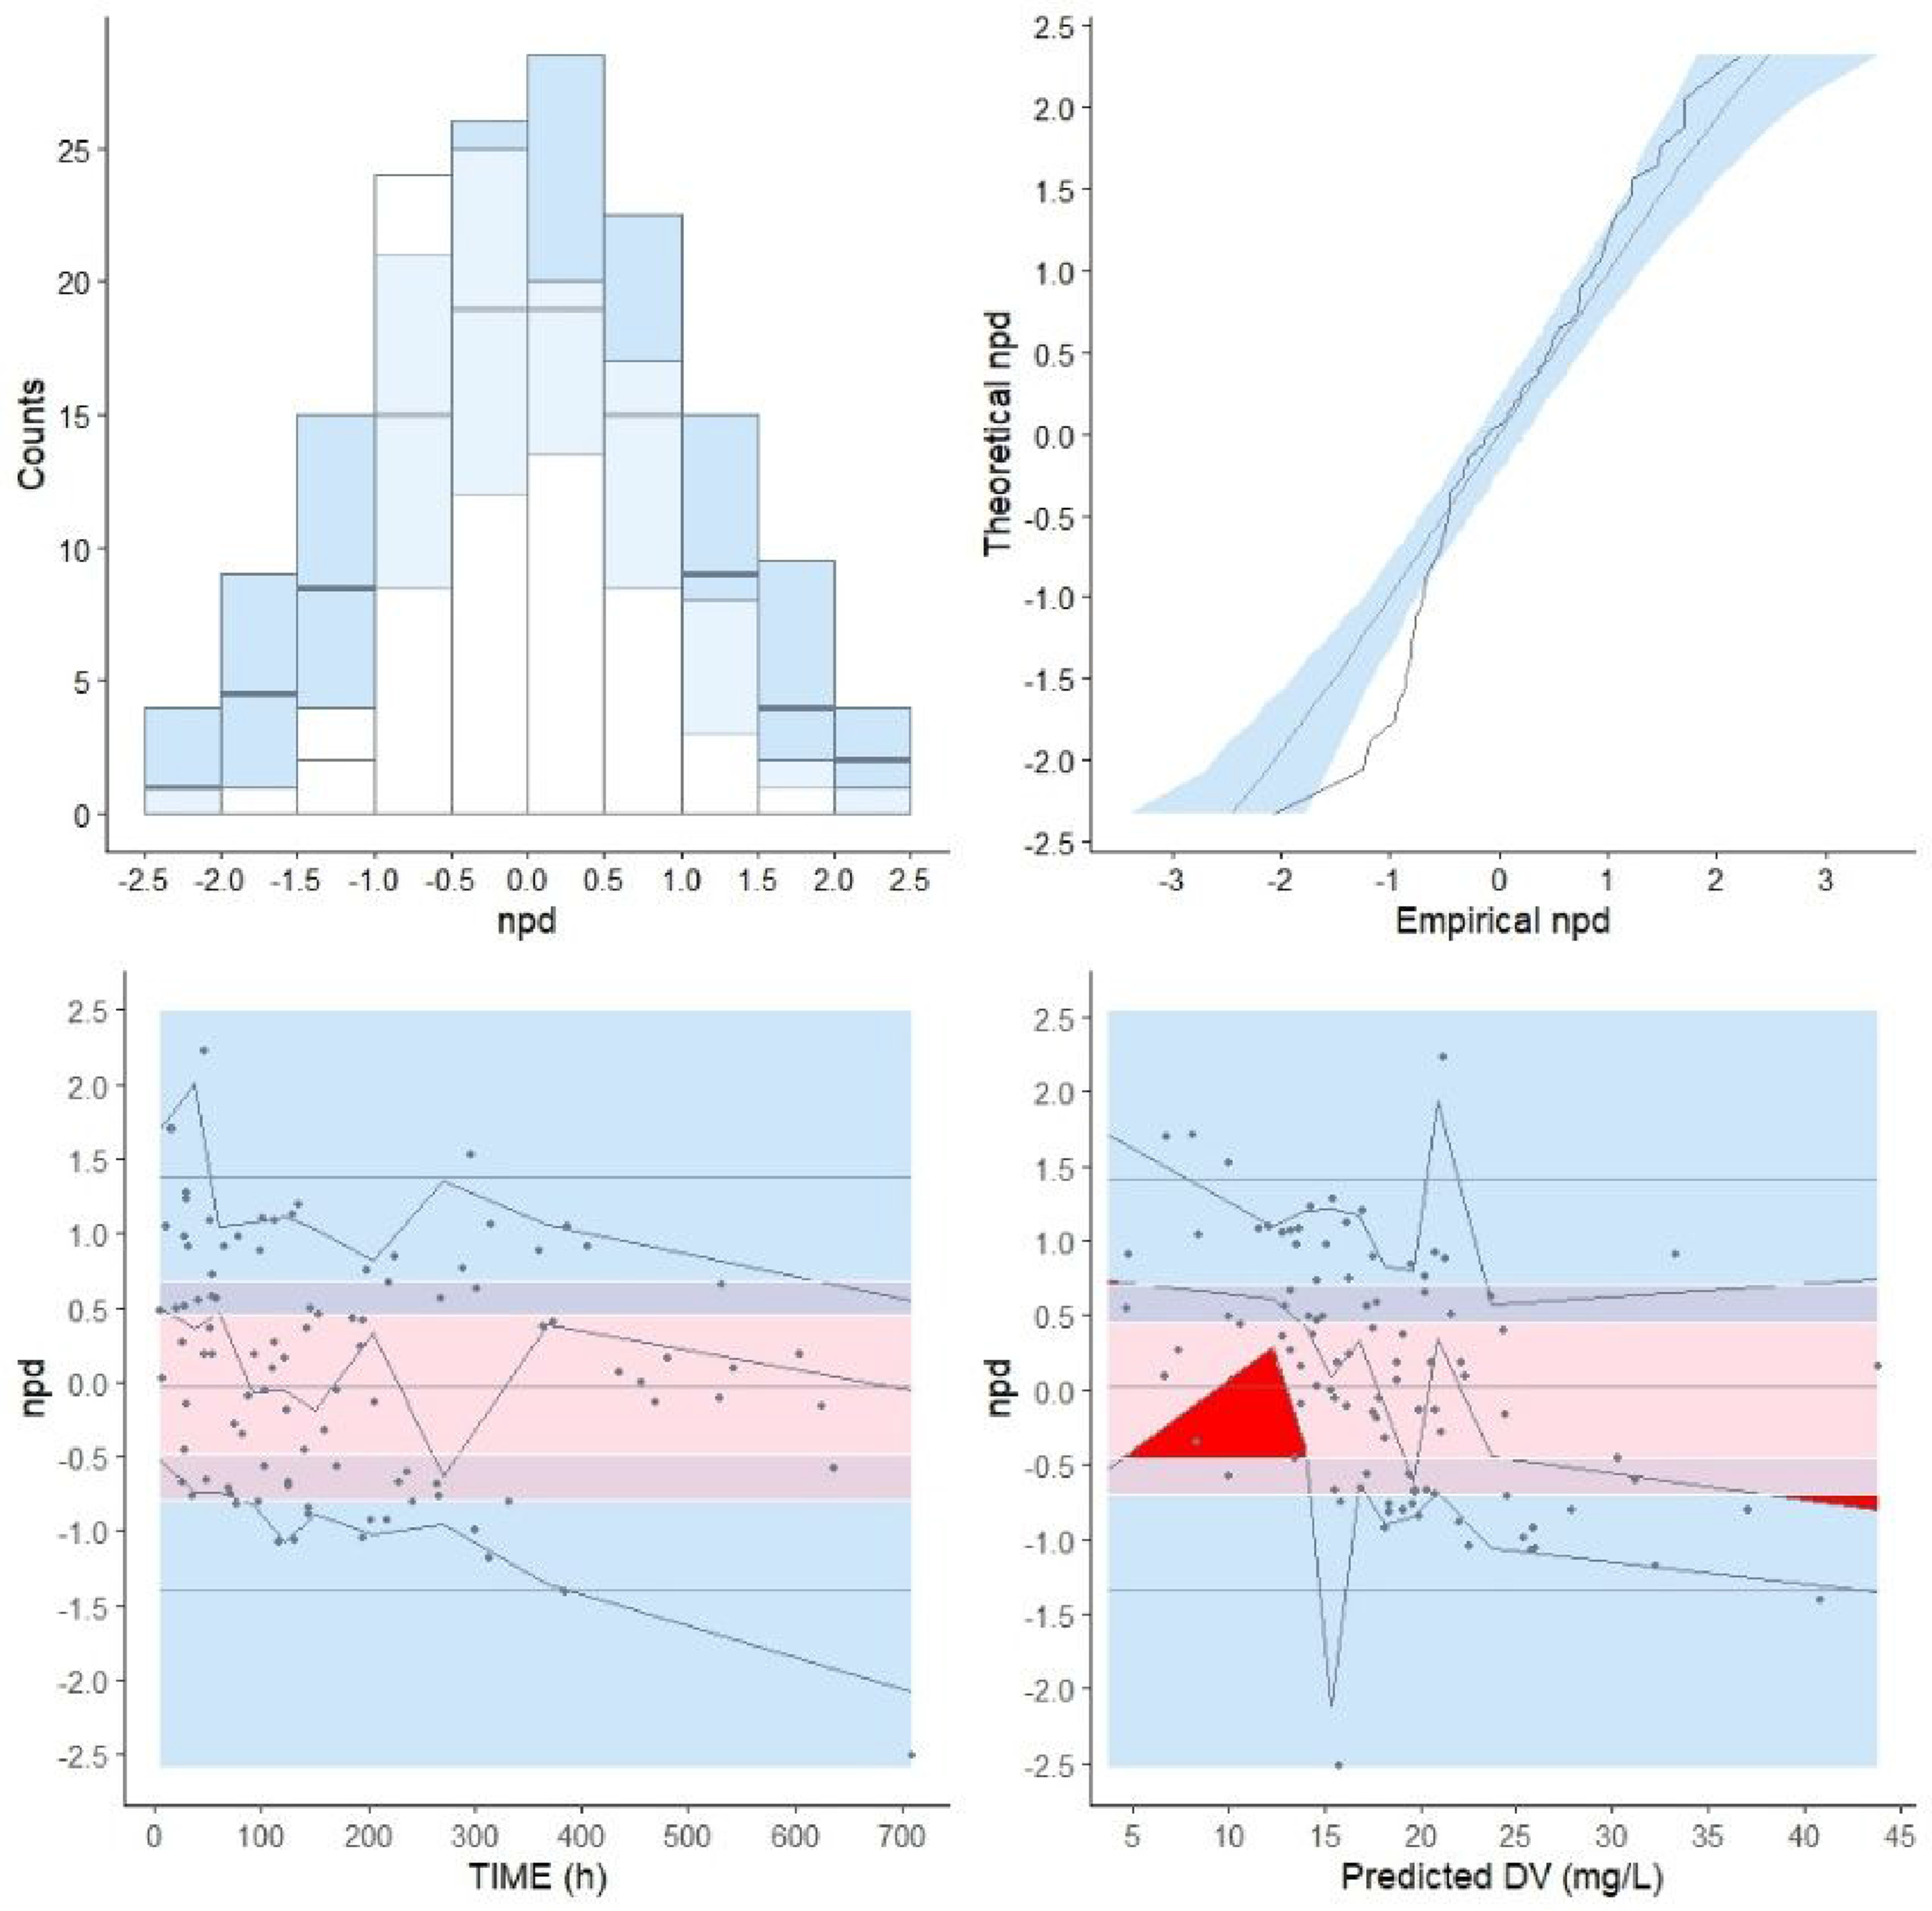
Bayesian forecasting
The Bayesian forecasting results of the pop-PK model.
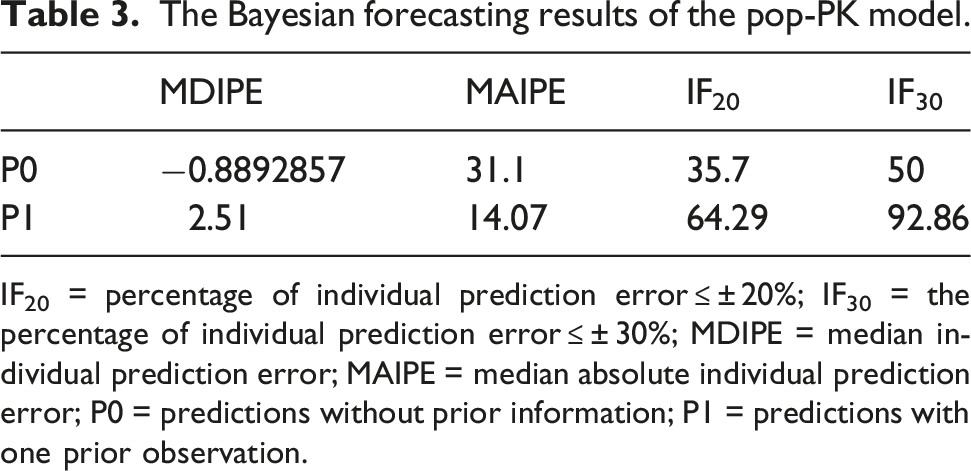
IF20 = percentage of individual prediction error ≤ ± 20%; IF30 = the percentage of individual prediction error ≤ ± 30%; MDIPE = median individual prediction error; MAIPE = median absolute individual prediction error; P0 = predictions without prior information; P1 = predictions with one prior observation.
Discussion
To our knowledge, this is the first study to externally evaluate previously published population pharmacokinetic model of an antibiotic in pediatric and neonatal patients undergoing ECMO and CRRT. We assessed the predictive performance of our previously published pop PK model of meropenem using an external validation dataset comprising 100 meropenem concentrations from 28 patients undergoing ECMO. Model performance was evaluated using prediction-based and simulation-based diagnostics.
In the external validation, the model did not meet the combined accuracy and precision criteria (MDPE ≤ ±20%, MAPE ≤30%, F20 ≥ 35%, F30 ≥ 50%). Overall, prediction-based diagnostics, GOF plots, and NPDE results indicated low bias but limited precision. MDPE values and NPDE means were close to zero, and DV versus IPRED and CWRES plots showed that the structural model adequately described overall PK behaviour. However, elevated MAPE values, low F20, and dispersion in DV versus PRED—particularly at higher concentrations—demonstrated substantial imprecision. Minor trends in CWRES versus PRED and NPDE variance discrepancies suggested small residual error misspecifications, with reduced accuracy in the lower concentration range.
Clinically, the model captures general PK trends but lacks sufficient precision for a priori dose individualization based solely on covariates. Nonetheless, because the model is unbiased and structurally sound, it is well suited for Bayesian forecasting. Incorporating a single prior concentration markedly improved predictive performance. While population predictions showed modest precision (MAIPE >30%, IF30 ≈ 50%), Bayesian updating reduced MDIPE to 2.5%, MAIPE to 14.1%, and increased IF30 to 93%. Thus, although the model alone is insufficient for a priori dosing, it performs very well for model-informed precision dosing once at least one TDM sample is available.
A major strength of this study is its focus on one of the most challenging patient groups in antimicrobial PK—neonates undergoing ECMO. To date, no published meropenem population PK model developed in ECMO patients has undergone external validation, and our original model remains the only one constructed specifically for neonates supported by ECMO. All other available meropenem PK studies in ECMO have examined older pediatric populations or mixed-age cohorts and have not been externally validated.22–24 The present work therefore fills a critical knowledge gap by assessing how a model developed in neonatal ECMO patients performs when applied to an independent real-world dataset. This type of evaluation is essential before population PK models can be used reliably for dose optimization in clinical practice.
The limited precision observed in population-based predictions likely reflects the extreme physiological variability present in critically ill neonates and children on ECMO. Factors such as rapid maturational changes, profound alterations in renal function, capillary leak, dynamic fluid shifts, inflammatory response, and potential drug sequestration within ECMO circuits all contribute to high interindividual variability.2–5,25 These processes can change substantially over short time intervals and are often not captured by baseline covariates collected at the time of admission. This biological complexity helps explain why a structurally adequate, unbiased model may still fail to accurately predict individual concentrations a priori in this population. In addition to true biological variability, study design likely contributed to imprecision: early post-dose sampling was sparse and heterogeneous, limiting characterization of the distribution phase and reliable individual estimates of volume of distribution. Because most samples were collected during continuous infusion—when concentrations primarily reflect clearance rather than distribution, the model had limited information on volume, likely inflating between-subject variability and increasing uncertainty in population predictions.
Importantly, the strong performance of Bayesian forecasting in this study suggests that, once an initial concentration is obtained, the model can accommodate much of the underlying variability and provide reliable individualized dosing recommendations. This supports the clinical need for early TDM in ECMO patients receiving meropenem, particularly in neonates where PK variability is greatest.
Several limitations should be considered. First, the sample size was relatively small, although comparable to other PK studies in neonatal and pediatric ECMO patients. Second, sampling was performed in routine clinical care, resulting in variable sampling times and sparse PK profiles, which may have limited ability to fully evaluate time-dependent changes in meropenem PK. Third, because the validation cohort consisted solely of neonates, the validation results apply only to this population, and additional validation is needed for older infants and children.10,26
Given the dynamically changing physiology in neonatal and pediatric ECMO/CRRT patients, future research should place greater emphasis on the optimization of the meropenem loading dose in addition to the better-understood maintenance regimens.
Because the distribution phase is critical for determining the volume of distribution—one of the major contributors to variability in this population—TDM around the initial dose may be particularly informative. In practice, this could be achieved by collecting one or two plasma concentrations within the first 1–4 h after the loading dose (e.g., at 1 and 2 h following a 30-min infusion of the meropenem loading dose of 20 mg/kg), which is feasible in patients with arterial access. Such early sampling would substantially improve the characterization of the distribution phase, reduce uncertainty in volume estimates, and ultimately support more accurate Bayesian dose individualization in subsequent therapy. Designing future trials to incorporate these early samples, together with steady-state measurements during continuous infusion, would strengthen model precision and allow a more robust prospective evaluation of TDM-guided dosing strategies.
Conclusion
This study presents the first external evaluation of a meropenem population PK model developed for neonates undergoing ECMO and CRRT. While the model showed low bias, population-based predictions were imprecise and did not meet predefined performance criteria, limiting its use for a priori dose adjustment. In contrast, Bayesian forecasting using a single prior concentration markedly improved accuracy and precision, achieving all acceptance thresholds. These findings support the use of this model primarily within a TDM-guided, Bayesian dosing framework to optimize meropenem therapy in neonatal ECMO patients.
Supplemental material
Supplemental material - External validation of the population pharmacokinetic model of meropenem in patients undergoing neonatal extracorporeal membrane oxygenation and continuous renal replacement therapy
Supplemental material for External validation of the population pharmacokinetic model of meropenem in patients undergoing neonatal extracorporeal membrane oxygenation and continuous renal replacement therapy by Pavla Pokorná, Danica Michaličková, Jan Bělohlávek, and Jonas Berner in Perfusion
Footnotes
Acknowledgements
Authors are thankful to ECMO colleagues, nurses, perfusionists, and to Prof. MD Dick Tibboel PhD3) Department of Pediatric Surgery, Erasmus Medical Centre Sophia Children’s Hospital, Rotterdam, The Netherlands.
Funding
The authors disclosed receipt of the following financial support for the research, authorship, and/or publication of this article: The authors received financial support for the research from the grant application Drug Disposition of Selected Drugs during Neonatal and Pediatric ECMO (Euro ELSO Grant 2023/Reg.no. 09335480) and Ministry of Health, Czech Republic – conceptual development of research organization (DRO-VFN64165).
Declaration of conflicting interests
The authors declared the following potential conflict of interest with respect to the research, authorship and/or publication of this article supported by the Euro ELSO Grant: A retrospective study of the drug dsiposition of selected drugs used during neonatal and pediatric ECMO from model drugs to prospective validation -Euro ELSO Grant 2023/Reg.no. 09335480.
Supplemental material
Supplemental material for this article is available online.
References
Supplementary Material
Please find the following supplemental material available below.
For Open Access articles published under a Creative Commons License, all supplemental material carries the same license as the article it is associated with.
For non-Open Access articles published, all supplemental material carries a non-exclusive license, and permission requests for re-use of supplemental material or any part of supplemental material shall be sent directly to the copyright owner as specified in the copyright notice associated with the article.