
Abstract
Objectives
The aim of this study was to assess inter‑ and intra‑observer agreement of detection and grading of oedema measured by vascular physicians using ultrasonography.
Method
In this observational study, three investigators read 113 videos of ultrasonography of the medial lower leg of 77 patients using a 15–18 MHz linear probe and reported whether oedema was present or not and, if present, to what extent. The videos were selected by the coordinator and sent every two months for a period of six months to the three investigators. Intra‑ and interobserver agreements were calculated using the Fleiss Kappa coefficient, reported with their 95% confidence interval and interpreted using the Landis and Koch values.
Results
Inter-observer agreement as to whether oedema was present or not was 0.88 (0.77–0.98), 0.96 (0.89–1.0) and 0.91 (0.80–1.0) for the first, second and third readings, respectively. The concordance was considered to be “excellent.” Inter-observer agreement as to the severity of oedema was 0.52 (0.38–0.65), 0.53 (0.39–0.66) and 0.61 (0.47–0.75) for the first, second and third readings, respectively. The concordance was “moderate”. Intra-observer reliability for the diagnosis of oedema was only 0.89 (0.70–1.0), 0.93 (0.75–1.0) and 0.92 (0.74–1.0) for the first, second and third reader, respectively, which was “excellent”.
Conclusions
The inter-observer agreement interpreting ultrasound videos using standard probes was excellent. Only moderate agreement in grading the severity of the edema using our arbitrary criteria was shown.
Keywords
Introduction
Lower limb oedema is a frequent condition, linked to disorders such as hepatic, renal or cardiac failures, superficial or deep chronic venous disorders and lymphoedema. It also occurs in apparently healthy people in a form known as occupational edema.1,2 In lymphoedema, persistent and untreated oedema is one of the prominent causes of skin changes such as stiffness, reduced ankle movement and infection.3,4
Despite a continued absence of standardization, the recommended diagnostic test for oedema detection is the pitting test.5,6 Although it is easy to use, it has poor sensitivity and, in addition, may be uncomfortable or even painful. These limitations are likely the cause of the high variability of lower limb oedema frequencies evaluated in epidemiological studies on superficial venous disorders.7–10
Moreover, since lower limb oedema increases during the course of a day and/or following long standing or sitting, it has been suggested, in order to homogenize the study populations, that the examination of patients occurs within a few hours after night rest.11,12
Attempts to find an objective and reliable while non-invasive and sensitive tool to diagnose oedema have more recently been oriented toward the use of duplex ultrasound testing (DUS).13–16 The first experiments have used high frequency probes with convincing results, diagnosing lower limb subcutaneous fluid.13,14 Then, it has been shown that standard-operating frequencies for venous DUS were able to do so as well. 15 Consequently, skin structures can be easily and routinely observed in detail using a 10–18 MHz US probe. 12 DUS permits oedema to be detected in patients with a negative pitting test, and can be repeated as often as necessary with no time constraint or discomfort to the patient. Although DUS is likely a more appropriate diagnostic tool, the performance of DUS remains to be precisely assessed in this condition.
As a consequence, the object of this study was to assess intra- and inter-observer agreement as well as the reliability of ultrasound B-mode to detect distal mild to moderate leg oedema.
Material and method
Design
This was a comparative study by three investigators of two sets of videos of ultrasound testing (DUS) of lower legs, one set with DUS signs of subcutaneous fluid and one set without.
Oedema diagnosis using DUS, physician interpreter
Diagnosis of subcutaneous fluid using ultrasound B-mode was based on the detection of anechoic strips which are considered as oedema in reference to previous works. Anechoic strips are black elongated images of different shapes which are always parallel to the skin, not coloured by Doppler (Figure 1).
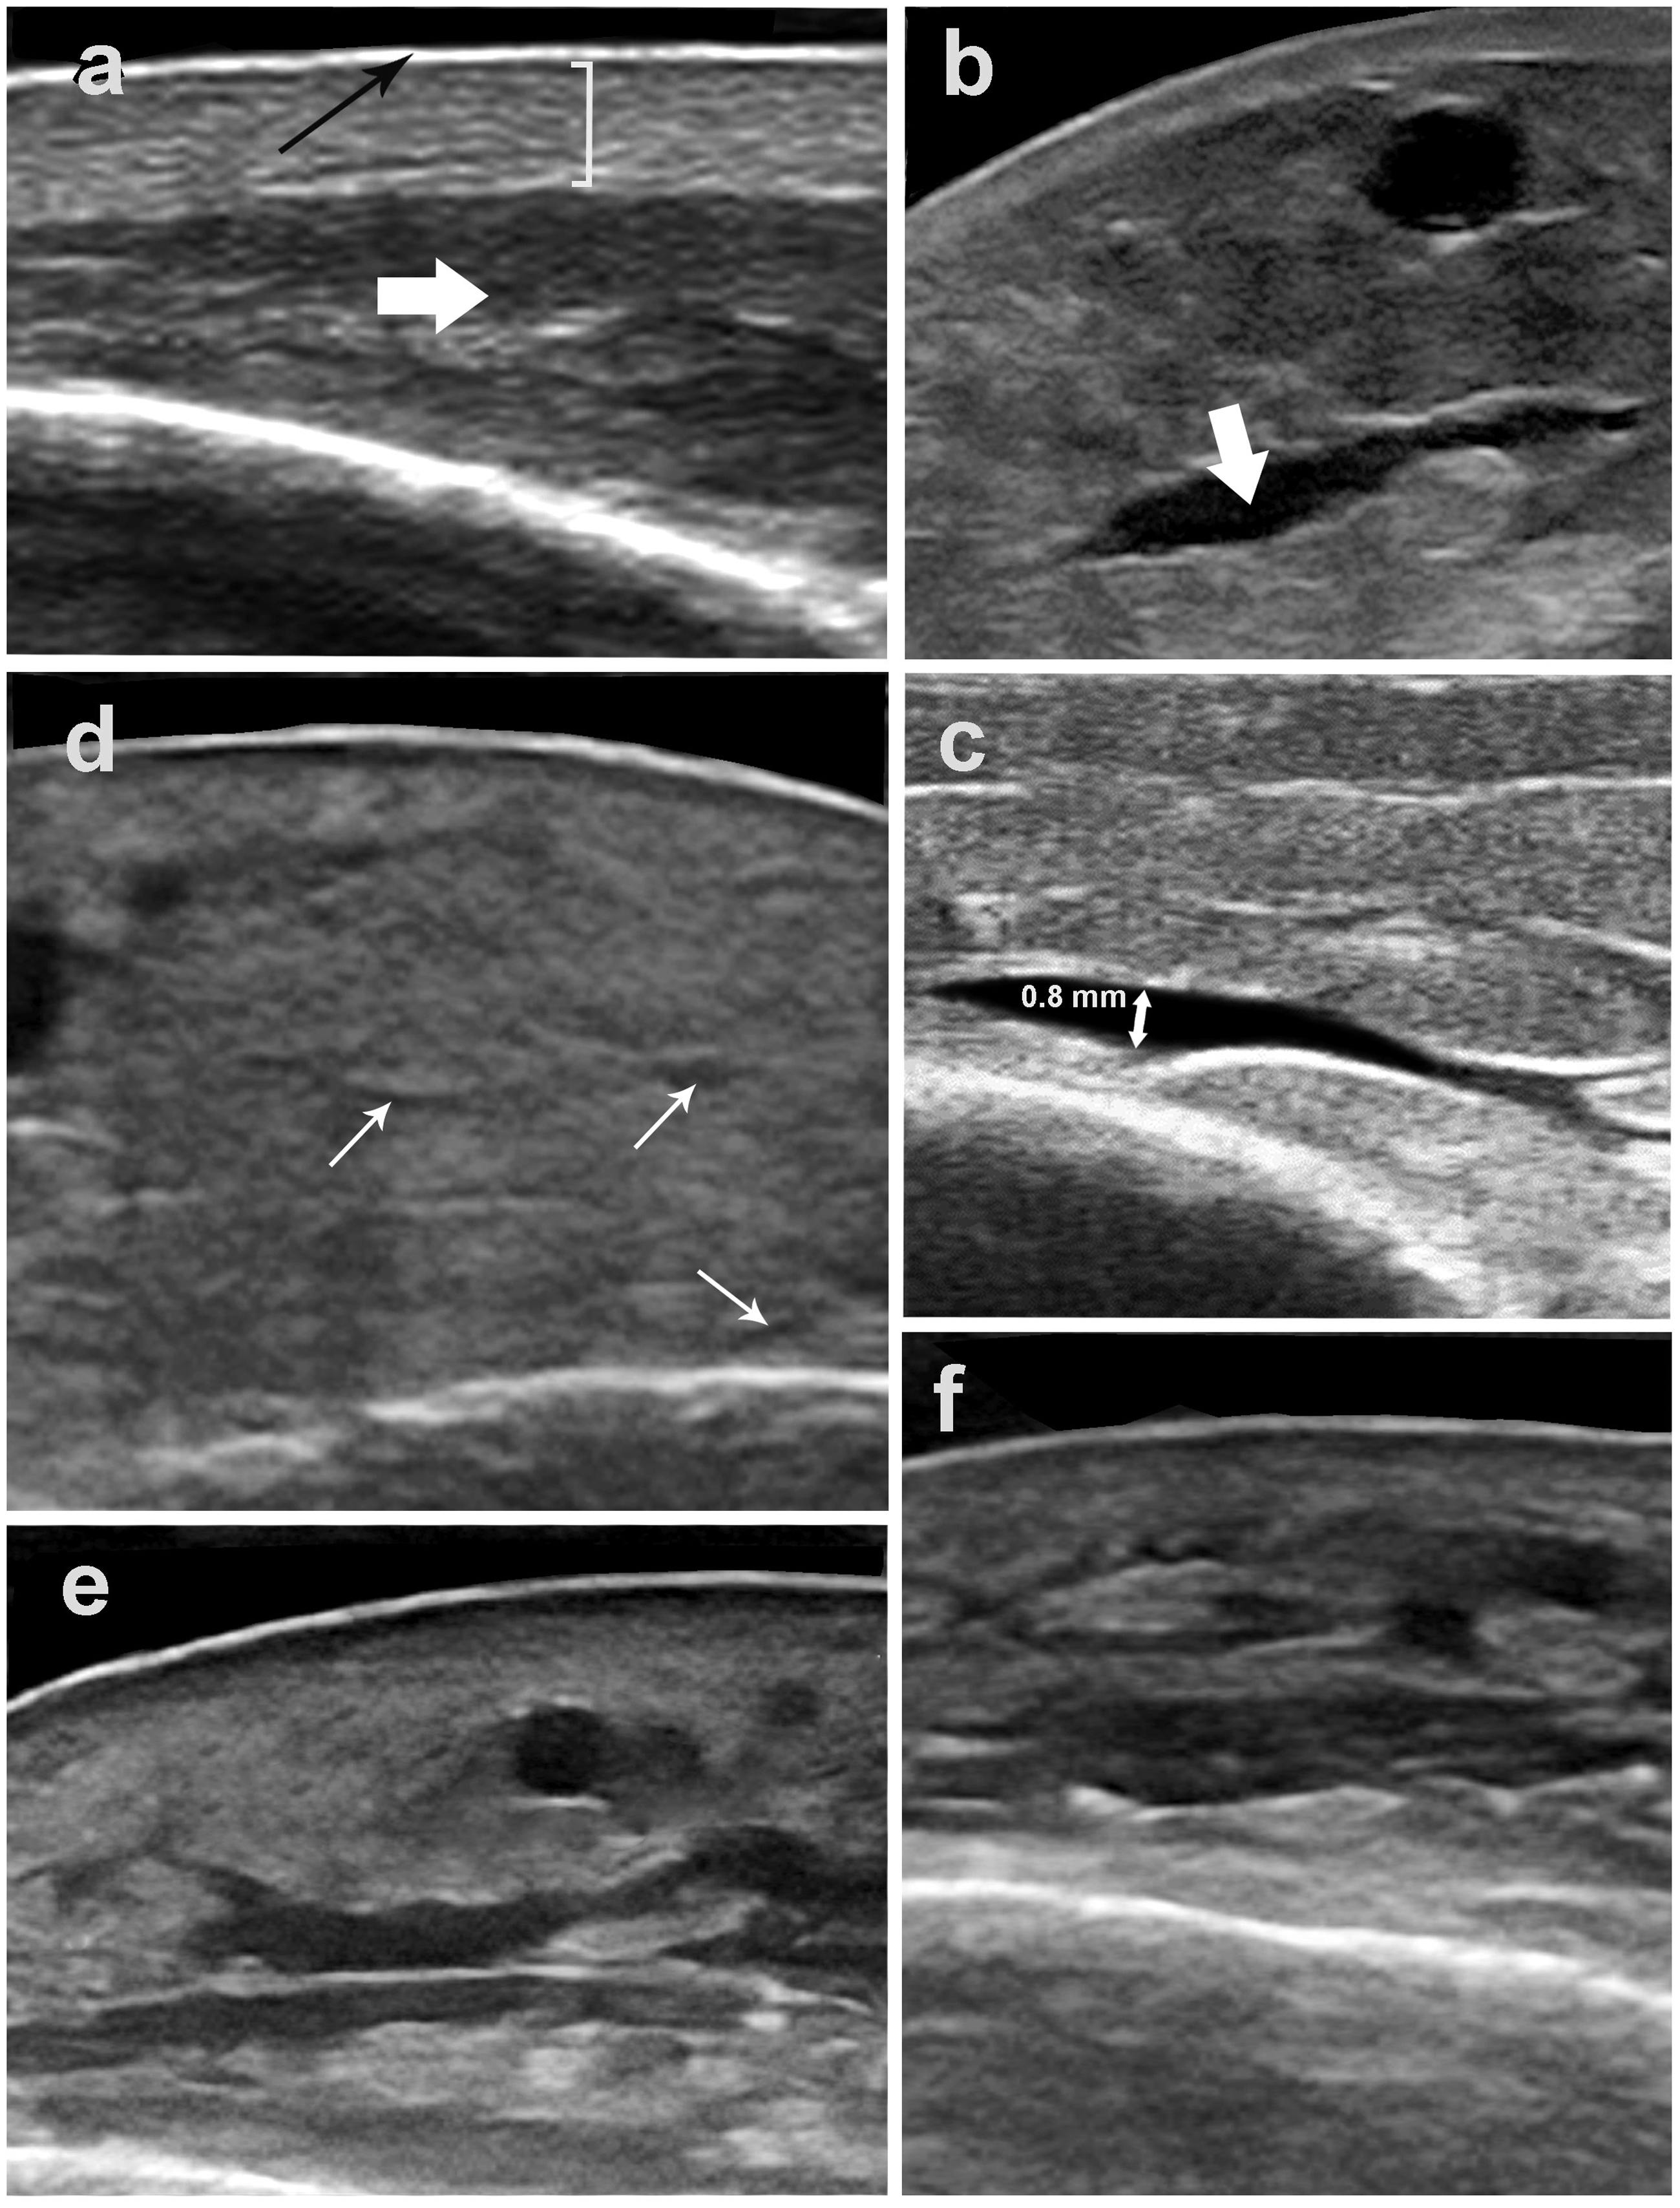
B-mode ultra-sound images of the medial aspect of the ankle showing skin tissues with and without oedema. All images are recorded using a 10–18 MHz multifrequency linear probe. (a) Normal skin: black arrow, the epidermis layer; white bracket, dermis layers; white arrow, subcutaneous tissue. (b) White arrow, hypodermic anechoic band which corresponds to oedema. (c) Arbitrary cut-off value of 0.8 mm of anterio-posterior dimension of the anechoic band chosen for the diagnosis; a few bands are considered as grade 1 oedema. (d) Example of a thick skin without oedema; white arrows indicating small anechoic structures that are not considered as oedema. (e) Grade 2 oedema (moderate): many anechoic bands are visible defining a moderate oedema. (f) grade 3 oedema (extended): anechoic bands occupying the whole thickness of the sub-dermis tissue.
The videos recorded examinations of the medial aspect of the lower leg, in which the ultrasound B-mode was used. During the examination, the probe was moved with large sweeping movements from about 5 cm above the malleolar tip and up to 15 cm proximally. The cutaneous and subcutaneous layers examined were imaged on the transverse plane using a linear probe selected at 15 MHz (reference VF 13-5; MyLab 25 Gold, Esaote, Genoa, Italy). The B-mode was set at a gain of 80, dynamic range of 65, penetration depth of 20 mm, and focus of 0.5 cm. Each ultrasound recording consisted of a video sequence of 9 s saved as an audio-video interleaved file.
This threshold of a 0.8 mm thickness was arbitrarily selected to be appropriate to define the presence of oedema 12 (Figure 1).
Population
Patients were prospectively recruited during routine phlebological consultations if they were between 20 and 75 years old with anechoic strips at the DUS whatever the pitting test status was for the presence of oedema, or a negative pitting test and no anechoic strip for the absence of oedema, regardless of the cause of oedema. Symptoms such as of leg tension or feeling of swelling were not taken into account for the diagnosis of oedema.
Exclusion criteria were acute venous thrombosis or taking a long-term anticoagulant treatment, pregnancy, a less-than-three months lower limb trauma, or acute lower leg pain.
No ethical committee approval was required considering that first, filming is currently performed during the phlebological consultation; and secondly, films were registered under an anonymous code for study purposes with no possibility, once registered, to retrieve the patient’s name. Consequently, the patients gave only their spoken consent to use these videos in a study of which they had been orally informed.
Organization
Three vascular physicians referred to as the investigators were asked to independently rate three times, 113 videos which had been obtained during routine phlebological consultations conducted by the fourth vascular physician, referred to as the coordinator.
The three investigators rated each video according to two criteria: whether or not DUS signs of oedema were present and if so its severity, rated as mild, moderate or severe.
The same 113 videos were sent to each of the three participating vascular physicians every two months for a period of six months. The order of the videos was changed each time they were sent to avoid any risk of the phlebologists remembering what they had noted on the previous occasions. Each video was thus read and rated by each of the three vascular physicians who use ultrasound on a regular basis in the diagnosis and follow-up of various vascular pathologies. They reported the results on an Excel file that had to be returned to the coordinator within 15 days. A training file containing videos of each of the situations, oedema/no oedema and grades, was sent to each of the investigators before the start of the test. The investigators were able to refer to these training files all along the course of the study, if necessary.
Once the videos were received by the three investigators, the rating could begin. Upon viewing the video, as soon as the investigator detected a subcutaneous anechoic strip, the image was frozen by the investigator who had to measure the antero-posterior dimension of the anechoic strip. If the dimension was greater or equal to 0.8 mm of antero-posterior dimension, the investigator declared that the DUS sign of oedema was present (Figure 1). The detection of only one strip of such dimension was enough for the diagnosis. When no anechoic strip or strips less than 0.8mm of anterior dimensions were observed, it was declared that there was no oedema. Arbitrarily, the grading was stated as mild when only one strip was observed, moderate when more than one strip was present and limited to the half deeper part of the subcutaneous tissue, and severe when anechoic strips were throughout the subcutaneous tissue, located in the entire hypodermis (Figure 1).
The coordinator rated independently all the video recordings for diagnosis and grading before sending them to the three investigators. These ratings were defined as the correct answer by which we could assess accuracy. Accuracy was only tested to diagnose oedema.
The coordinator selected 79 (69.9%) videos as having oedema of which 27.8% were mild, 39.2% moderate and 33% severe, while 34 videos showed no oedema.
The answers found by the investigator had to be the same as the evaluation given by the coordinator for the videos to be accurate. The coordinator rating was preferred to the use of an image analysis software for two reasons (1) a software analysis also needs human intervention regarding the choice of a grey-chart cut-off level, and (2) from a logistics and cost point of view, because this study was funded personally by the participants.
Statistics
The number of 113 was chosen, primarily taking into account the time availability of each of the three investigators to read the videos within 15 days.
Inter-investigator reliability (between observers) was assessed by observing how investigators compared with each other for the 113 original videos and intra-investigator reliability (within observers) was assessed by measuring the investigator’s agreement with their previous interpretations because each of the 113 videos was presented three times, giving a total of 339 results for each investigator. The data were assessed using the Fleiss Kappa statistical tool (absolute agreement) and interpreted using the Landis and Koch table.17,18 The Kappa tool is defined as: Κ = P0 −Pe/1−Pe. P0 demonstrates the actual probability of agreement, while Pe is the expected agreement by chance. In contrast to Cohen’s Kappa test, Fleiss Kappa works when assessing the agreement between more than two investigators. All data were analysed using the online Kappa calculator guide (http://www.real-statistics.com/reliability/fleiss-kappa on Excel; Microsoft Corporation, Redmond, WA). Missing data were considered as an incorrect response. The confidence interval was calculated at 95% for each value. In order to help estimate the clinical value of the test, an interpretation was given according to the Landis and Koch scale. 19 Consequently, agreement was rated as poor (<0.0), slight (0.0–0.20), fair (0.21–0.40), moderate (0.41–0.60), substantial (0.61–0.80), and excellent (0.81–1.00).
Accuracy was measured by counting the number of identical diagnoses between the investigator and the coordinator (on the 339 readings), then transformed into percentages. Incorrect answers were analysed separately.
The agreement between pairs of investigators has not been examined for the mere reason that all three phlebologists have the same practice, are close in age to each other and are similarly trained.
Results
The 113 videos of the ankle aspect were recorded on 113 lower legs on 77 patients of whom 76.6% were females. Population age (mean ± SD) was 64.2 ± 13.7 years and BMI (mean ± SD) was 28.3 ± 5.7. Legs were observed 5 ± 2.6 h (mean ± SD) after patients got up in the morning. Patients had isolated reticular vein dilations in 64.7% of cases, 33.4% had varicose veins with no trophic change and 1.9% had varicose veins and dermatitis. None had healed or active ulcers or acute or chronic lipodermatosclerosis. Two patients had deep vein reflux with one having a moderate post-thrombotic syndrome on both legs, with a Villalta score inferior to 5. None had hepatic, renal or cardiac failures or lymphoedema. Three patients had moderate peripheral arterial diseases and 20 of them (25.9%) had antihypertensive drugs of which the side-effect could have been lower limb oedema. Eight patients wore compression stockings on a daily basis
Inter-observer agreement considering the oedema-no oedema diagnosis (Kappa, confidence interval 95%) was 0.88 (0.77–0.98), 0.96 (0.89–1.0) and 0.91 (0.80–1.0) for the first, second and third readings, respectively. According to the interpretation of Kappa values proposed by Landis and Koch, the concordance was “excellent” (Figure 2).
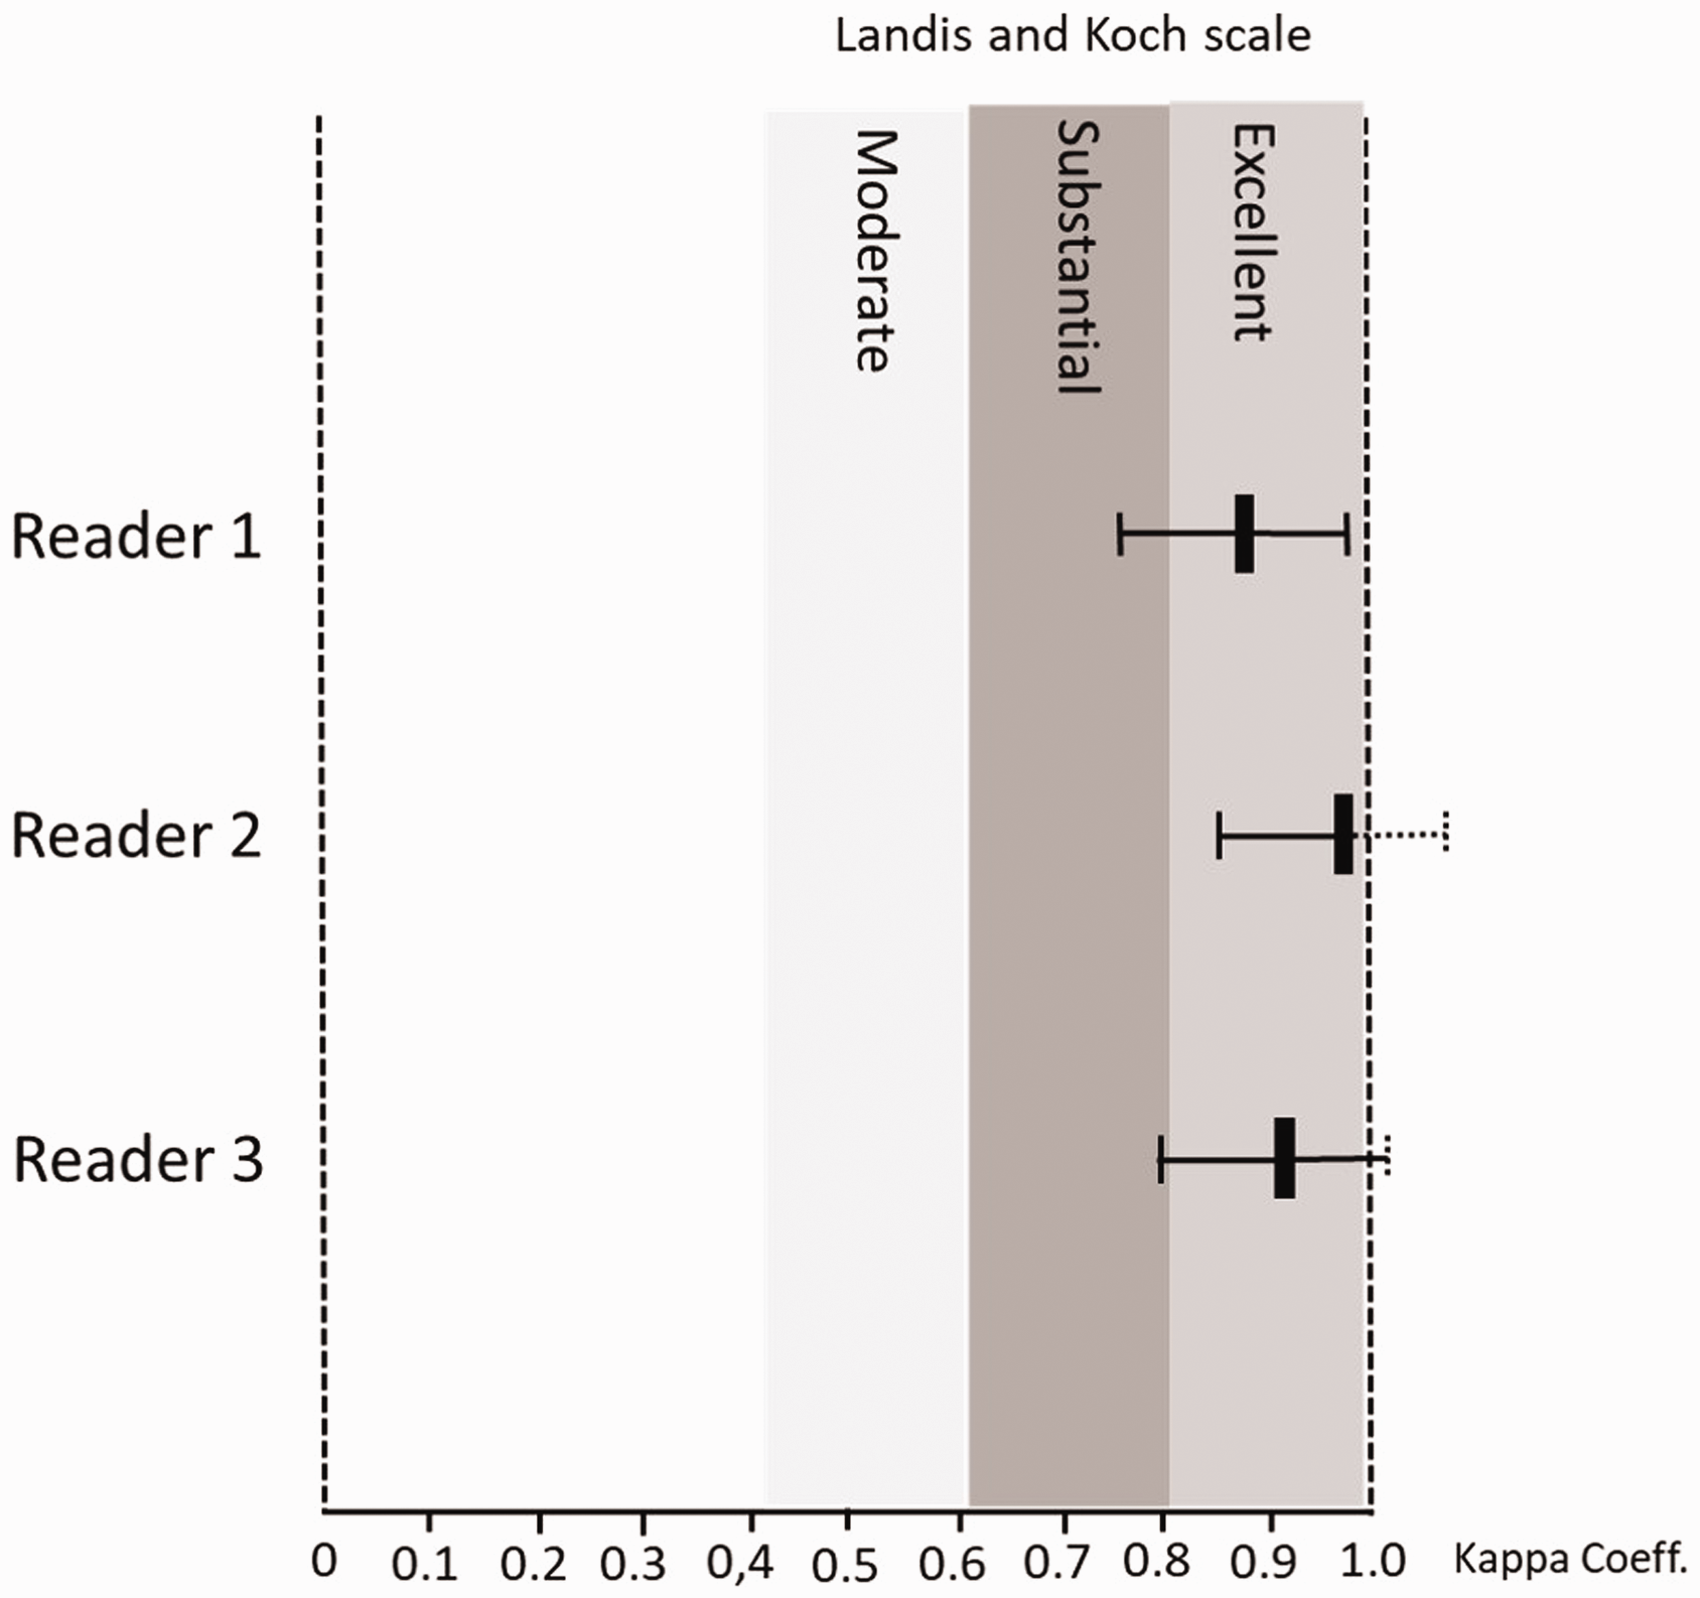
Inter-observer rating results. Kappa coefficients are shown (vertical small black bars) and their 95% confidence intervals (horizontal “T” lines) for each reader. Landis and Koch interpretations are shown (vertical grey bars).
Inter-observer agreement considering the grading (Kappa, confidence interval 95%) was 0.52 (CI95%: 0.38–0.65), 0.53 (CI95%: 0.39–0.66) and 0.61 (CI95%: 0.47–0.75) for the first, second and third readings, respectively. According to the interpretation of Kappa values proposed by Landis and Koch, the concordance was “moderate” (Figure 3).
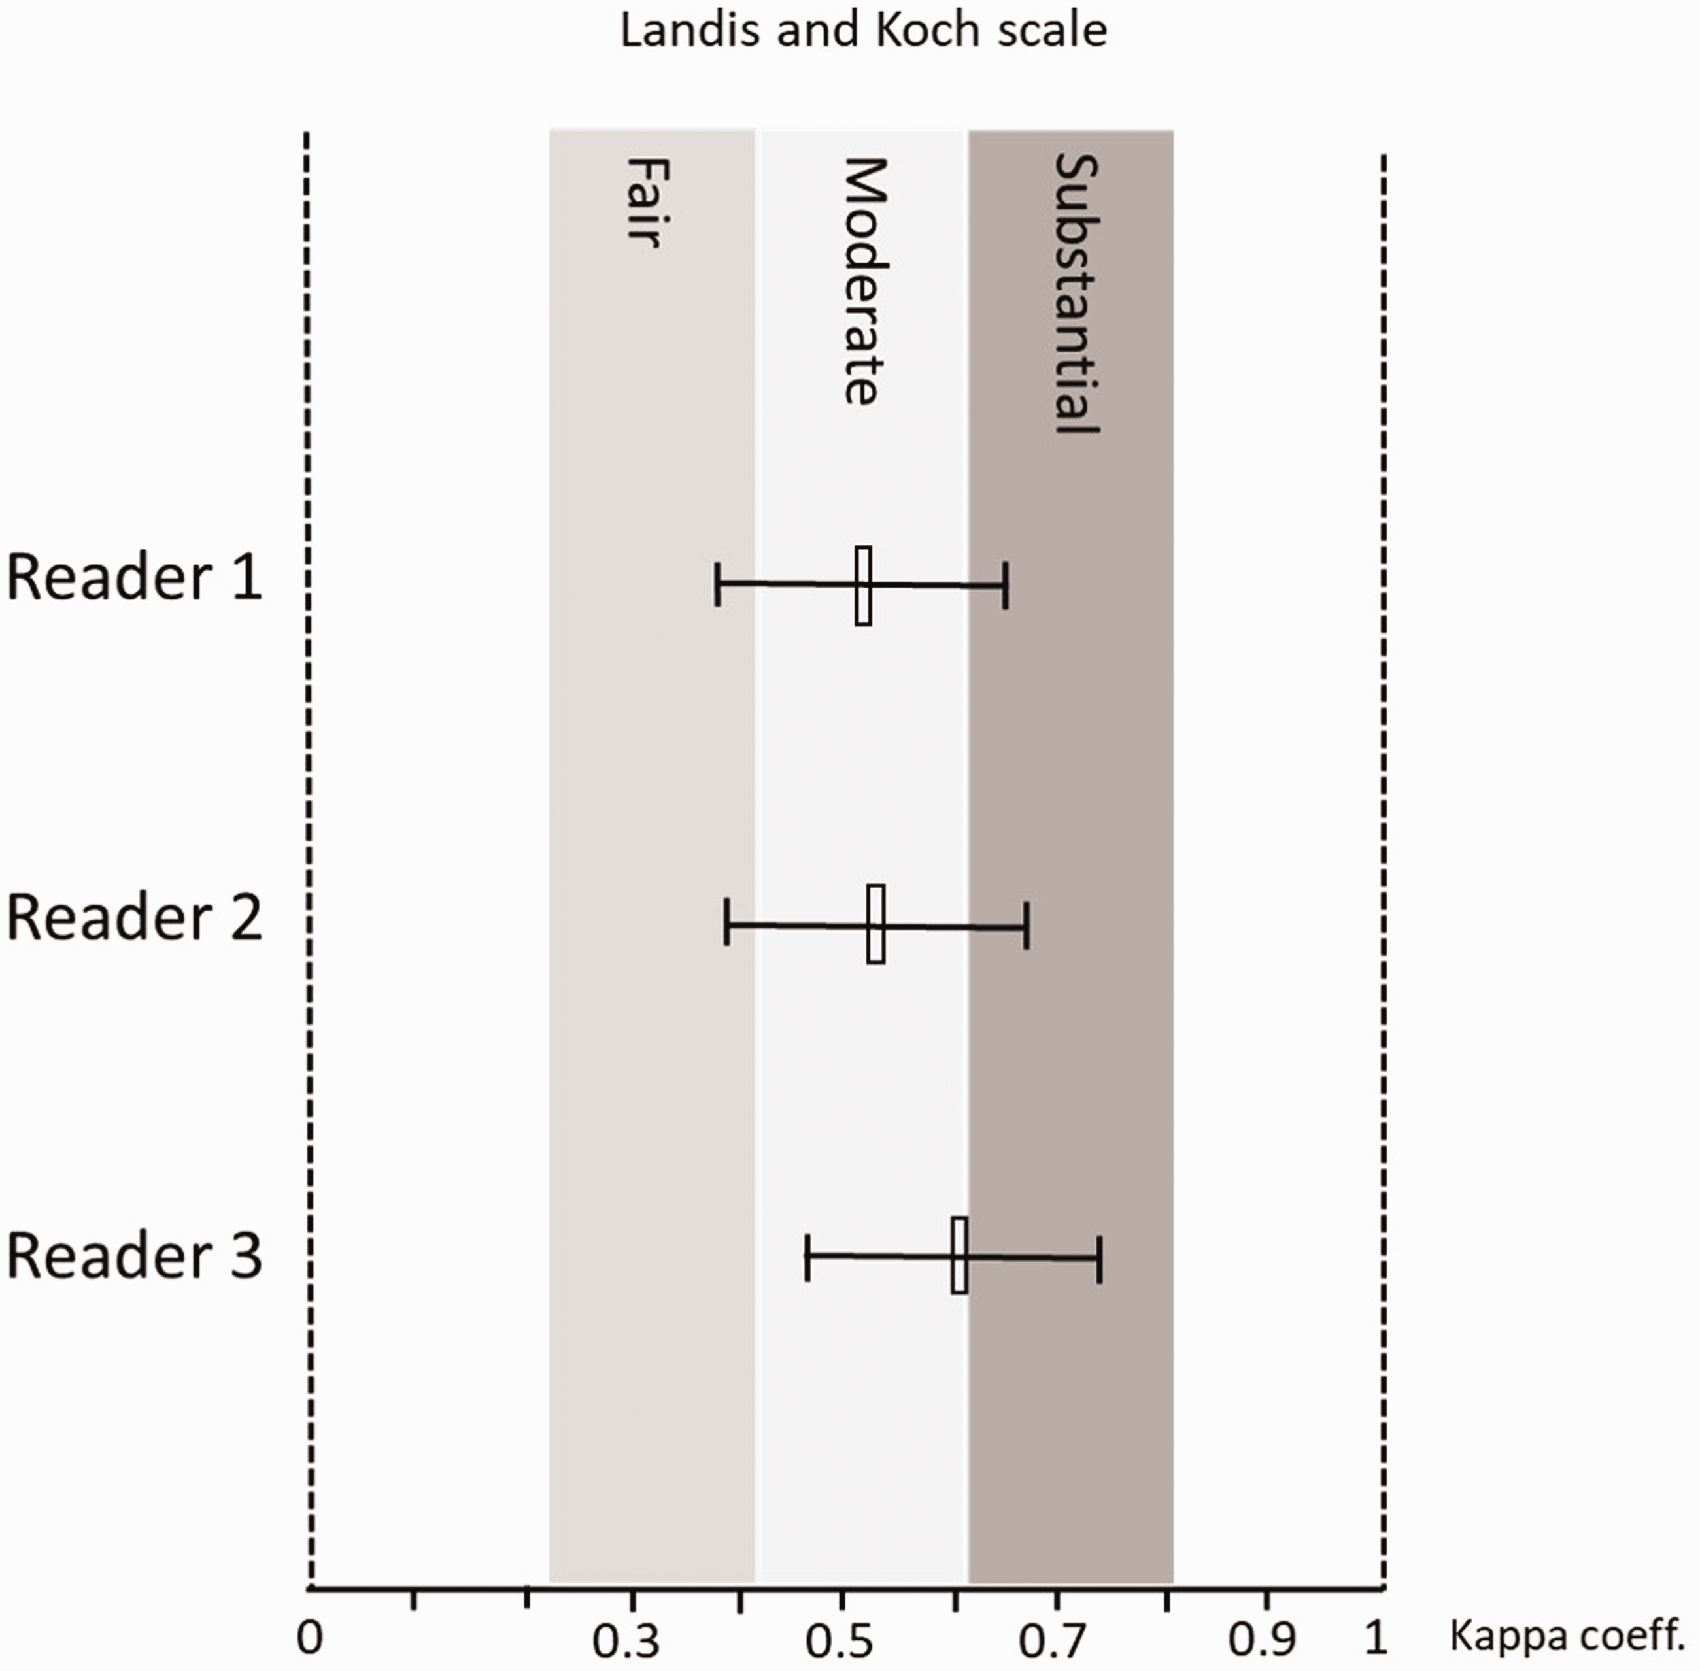
Intra-observer rating results. Kappa coefficients are shown (vertical small open bars) and their 95% confidence intervals (horizontal “T” lines) for each reader. Landis and Koch interpretations are shown (vertical grey bars).
Intra-observer reliabilities (Kappa, confidence interval 95%) were 0.89 (0.70–1.0), 0.93 (0.75–1.0) and 0.92 (0.74–1.0) for the first, second and third readings, respectively, which was “excellent”.
Accuracy was 97%, 93.2%, 91.2% for the first, second and third readings, respectively. None of the 113 videos showed discordances concerning all three readers and seven videos only showed discordances concerning two readers. An analysis of the discordant results revealed that there was no trend as to whether or not oedema was present. All cases of misdiagnosis were from mild oedema and never concerning moderate or severe oedema (Figure 4).
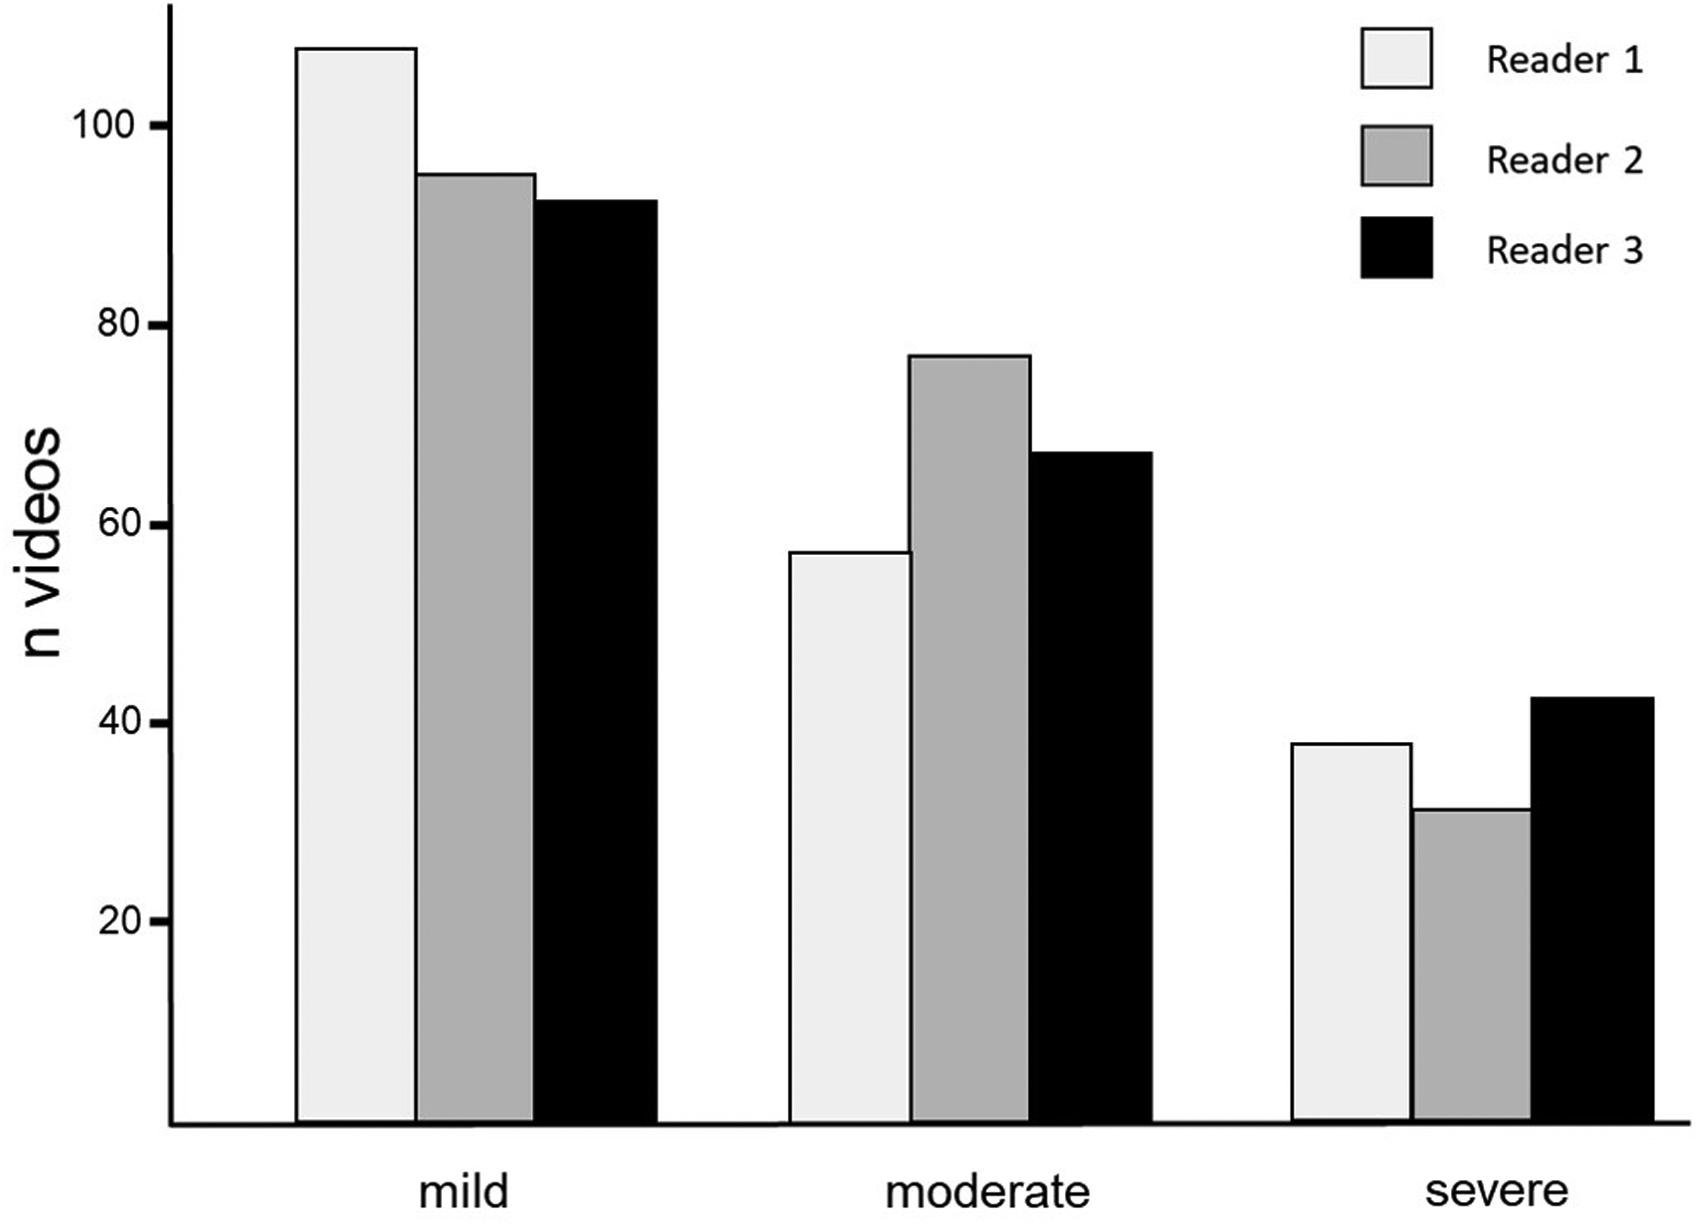
Distribution of oedema grading (in numbers of videos) according to the three readers. The bars are compiling the results of the videos of the three readings.
Discussion
The main result of this study is a high level of intra and inter-observer reliability in detecting lower limb subcutaneous anechoic bands considered as fluid when DUS is used in a selected population according to the Landis and Koch scale with a Kappa coefficient higher than 0.85. The three phlebologists who read the videos were in agreement with the choice established by the main investigator by at least 85% which represents a satisfactory accuracy.
At the present time, there are many tests for the follow-up of oedema, measuring the variation of volume (e.g. water-displacement, tape-measurements, impedance-based measurement, laser), but to our knowledge, there is only one test to diagnose oedema: the pitting test.
By applying pressure to the skin with a finger, both the dermal fluid content of the skin and the sub-dermal tissues move and the finger impression are more or less a direct manifestation of the presence of oedema. The pitting test, which is a non-standardized test that requires training, does not seem quite as simple to interpret. Nevertheless, the pitting test is routinely recommended in clinical studies to determine if oedema is present.
The epidemiological studies using CEAP classification (Clinical-Etiology-Anatomy-Pathophysiology) showed discrepancies in diagnosing oedema that was from 2.2% to 13.4%.7–10 Rabbe and Pannier recognized the difficulty in oedema diagnosis and finally, in an agreement study, the concordance was weak for C3 (oedema) when using the pitting test, with a Kappa coefficient of 0.17.20,21
In contrast, the three phlebologists had to agree on the presence of at least one anechoic strip of more than 0.8 mm of anterior-posterior dimension considered as oedema. Although arbitrary criteria were used to diagnose the presence of sub-dermal fluid, these criteria were measurable. This was considered as an indirect presence of oedema restricted to the deep part of the skin, visible by the enlarged water content having to be drained by the lymphatic system. 12
Concerning grading, results show only a moderate agreement with a Kappa coefficient ranging from 0.52 to 0.61 taking into consideration the three phlebologists and a 95% confidence interval ranging from 0.38 to 0.75.
If the Kappa test is the most commonly used test to evaluate inter-observer reliability, the interpretation using Landis and Koch’s table is more problematic when agreement is not “excellent,” depending on the clinical application of the test. 22
Similarly, based on the results found in other studies, ultrasound examination for other disorders seems to give better results in diagnosing than grading. 23 , 24 It was for this reason that grading in the study was limited to only three stages in an attempt to provide a satisfactory result.
Other limitations of the study are related to different points. First, besides the fact that this article is the first report on the inter- and intra-observers’ reliability in diagnosing and grading mild to moderate ankle subcutaneous fluid using DUS, the study was not carried out under routine conditions. Watching a video is not the same as using real-time DUS in patients, so we do not know exactly how our findings may be translated to an everyday clinical usage. Similarly, the time spent in reading the videos was not limited or even reported by the readers who were free to repeat their readings as many times as they wished.
Furthermore, the patients in the study were not consecutively enrolled but selected by the main investigator. Consequently, results could have been different since oedema that may be encountered by phlebologists in routine clinical practice is much less frequent than the 69.9% of oedema in the present trial.
The rating of the videos was preceded by an instructional session on the diagnosis and scoring systems to be used which was based on a video tutorial as opposed to a real-time, face-to-face interview with the main investigator which probably would have been of higher value.
Characterization of oedema using DUS has already been performed in the past. Gniadecka and Quistorff and Caggiati 14 , 15 demonstrated that high-frequency ultrasound precisely showed excess skin fluid content, and a more recent study highlighted that fluid content can be seen in routine studies.
In our study, the decision to record images with a lower frequency DUS probe than the one used in the Gniadecka studies was based on the fact that it is used by vascular physicians rather than higher frequency probes. Nevertheless, the multifrequency 15 to 18 MHz linear probe we used was able to provide sufficient data to detect ankle oedema as has already been shown by other authors. 15
One major question that arises from this study is the clinical application of the results. Among patients suffering from chronic venous disorders, permanent lower limb oedema is a complication and treatment should be considered. When the pitting test is used, only patients who have a certain extent of oedema are diagnosed and, when seen at the end of the day, can hardly be differentiated from occupational oedema, the pathological status of which is still under discussion. Should all these patients be treated knowing that (1) if not treated, permanent oedema could lead to skin modifications and disability over a long period of time of evolution no matter what the symptoms are (as seen in lymphoedema patients), (2) occupational oedema is not always accompanied by symptoms, and consequently does not necessarily need treatment, and (3) compression therapy which is an efficient long-term treatment to reduce oedema in the case of chronic venous disorders, has a poor compliance and tolerance, and therefore the selection of patients who will benefit from this kind of treatment must be as precise as possible?
The basic CEAP classification has been recommended by many national and international scientific associations as the gold standard to document venous disorders. A more precise way to define the presence of oedema is needed. The C3 definition as well as the oedema grading items in the Venous Clinical Severity Scores could be improved. 25
We hope that further studies will be initiated in order to teach us more about what routine DUS can demonstrate in dealing with oedema complicating CVI and its clinical applications. For example, these studies could focus on the characterization and the measurement of thickness using DUS of the dermal layers in patients with and without oedema. One improvement would have been to measure leg volume variation over the course of day then to evaluate patients, using US, at the end of the day and compare presence and extension of anechoic bands to leg volume variations
Conclusions
The results show an excellent inter-observer agreement interpreting ultrasound videos using standard probes but only moderate agreement in grading the severity of the edema using our arbitrary criteria. Additional research is encouraged to define objective ultrasound criteria for grading the severity of calf edema.
Footnotes
Authors’ note
The coordinator, statistician and each of the investigators participated to this work as part of their vascular medicine work being all engaged to document venous disorders.
Declaration of Conflicting Interests
The author(s) declared no potential conflicts of interest with respect to the research, authorship, and/or publication of this article.
Funding
The author(s) received no financial support for the research, authorship, and/or publication of this article.
Ethical approval
No need for Ethical committee approval. Study carried out in the frame of the vigilance inquiries under the auspice of the ANSM (Agence Nationale de Sécurité du Médicament).
Guarantor
DR.
Contributorship
DR: design, data collection, analysis, writing. VC, DR, BM: data collection, manuscript reading and comments
Acknowledgements
Thanks to Susan Sinclair and Karen Moulton who revised the English version.