
Abstract
In recent decades, income inequality has soared in the United States, but few studies utilize experimental methodologies to assess whether having reliable information on income concentration affects the formation of redistribution attitudes. We advance this emerging literature through an analysis of information on the income owned by the top 1% of the income distribution – a group that is socio-politically meaningful and axial to the recent rise of inequality. The empirical evidence draws on a novel split-sample survey experiment (N = 4,000). The results indicate that having the real value of income concentration does not have an average, significant effect on redistribution attitudes. Neither does it moderate the positive association between prior perceptions of concentration and these attitudes. However, the analysis suggests that intense cognitive effort is related to preference revision. This is because, information reduces pro-redistribution attitudes among extreme overestimators who process the information more intensely.
In recent decades, most post-industrial societies have undergone substantial increases in income inequality (Dabla-Norris et al., 2015; Piketty, 2018). Specifically concerning the United States, since the 1980s economic inequality has expanded substantially whether it is measured as (1) the income share of the richest population, (2) the overall income distribution, or (3) the wealth share of the richest population (Chancel et al., 2021; Milanovic, 2016). Rising inequality has led to a burgeoning literature on the socio-psychological processes underlying the formation of attitudes toward inequalities and redistribution. In particular, many studies assess (1) public perceptions of objective levels of inequality, (2) popular concern over rising inequalities, and (3) attitudes toward state-driven redistribution (for reviews, see Ciani et al., 2021; Hauser and Norton, 2017; Marandola and Xu, 2021).
This micro-level research has greatly expanded our understanding of these three dimensions. It has shown, for instance, that Americans are generally concerned and displeased with the level of economic inequalities (McCall, 2013); redistribution preferences are responsive to shifts in inequality at the local or state but not federal levels (Newman et al., 2018); and Americans misperceive the level of inequalities because, for instance, they largely underestimate the salaries of CEOs (Page and Jacobs, 2009).
Several prior studies on Americans have also examined the influence that information on inequality has on support for redistribution. In a recent meta-analysis, Ciani et al. (2021: 26) document that ‘the average effect is positive and statistically different from zero, but small’ (see also Stantcheva, 2021). Recent studies on information effect, for instance, show that providing multifaceted information on trends and levels of inequality (Kuziemko et al., 2015), income gaps across gender, ethnic, and educational groups (Becker, 2020), and income earned by different income groups (Boudreau and MacKenzie, 2018; McCall et al., 2017) is correlated with pro-redistribution preferences. Although prior research has greatly improved our understanding of information effects on redistribution attitudes, it has some limitations. First, several experimental studies seeking to assess the exogenous effects that non-partisan information on economic inequalities has on support for redistribution (Becker, 2020; Hoy and Mager, 2021a; Kuziemko et al., 2015; McCall et al., 2017; Trump, 2018) present treated participants with texts that combine different kinds of information and therefore make it impossible to determine which aspect is most relevant. Several studies also use (non-representative) convenience samples (Becker, 2020; Trump, 2018). More importantly, some prior experimental studies do not collect the perception of the level of inequality for participants in the control group (Kuziemko et al., 2015; McCall et al., 2017) or do not assess whether the information treatment has heterogeneous effects across respondents with different prior beliefs (Trump, 2018). As a result, a potential average information effect could actually reflect either learning processes linked to sheer internalization of new information, or priming processes linked to the mere evocation of the topic of inequality (Radl and Fernández, 2022).
In response to these three limitations, this study advances the literature on information effects on support for redistribution by focusing on the economic position of a distinctively important group – the 1% of the population with the highest income – and a single dimension – the overall yearly income accumulated by this group. The novelty of this study relies on the combination of three different aspects. First, by focusing on the top 1% (TOP), our study overcomes references to generic inequality and brings to light popular attitudes and beliefs toward a concrete group and a concrete aspect of income distribution (Jachimowicz et al., 2023). Second, we consider the role that cognitive effort in information processing plays in the moderation of treatment effects. Finally, our study relies on a representative sample and leverages an analytical strategy that minimizes the possibility of a priming effect. 1
Changes in the economic standing of Americans in the TOP of the income distribution – hereafter referred to as the TOP – are axial to the longitudinal increase and the currently high level of economic inequality in contemporary America (Hirschman, 2021; Kenworthy, 2017). As a result, this group has unsurprisingly received substantial attention in the media (McCall, 2013). Nevertheless, we have a limited understanding of the effect of relevant, non-partisan, objective information on this group. On this matter, while reporting that Americans largely underestimate the annual income of CEOs, Page and Jacobs (2009: 37–38) wonder how would Americans react if they understood that the gap between what their neighbors earn and the jackpot lottery that corporate bosses win every year is nearly thirty times as great as they think? One can imagine that the existing opposition to inequality would be even greater.
This article heeds this call with the first study specifically concerned with Americans’ popular perceptions of income concentration in the TOP and whether providing reliable information on this group shifts policy preferences. In this study, we address three key questions: Are Americans generally informed about the proportion of yearly income accrued by the richest 1% of the population? If they are not well-informed, do they generally underestimate or overestimate this level of concentration? More importantly, does providing accurate, non-partisan information on the income concentration in this group affect Americans’ preferences toward policy-driven redistribution?
To answer, we draw on a large online representative survey (N = 4,000) conducted in November–December 2021 and specifically designed for this study. The survey includes a questionnaire item that collects perceptions of the level of income concentration in the TOP in both the control and treatment groups. Relying on a split-sample, control-treatment experimental approach, the randomly selected treatment group is then provided with non-partisan and reliable information from the World Inequalities Dataset (2023) on the effective income concentrated in this group.
The analysis reveals that Americans are poorly informed about the level of income concentration in the TOP. Six in 10 respondents substantially overestimate income concentration and only 1 in 10 respondents underestimate it. Moreover, prior beliefs on the level of income concentration are strongly related to redistribution preferences. Perceived income concentration is linearly related to demand for redistribution but only because extreme overestimators of the level of concentration stand out in their pro-redistribution attitudes. More importantly, providing non-partisan, reliable information on income concentration in the TOP does not significantly affect redistribution attitudes. In addition, learning the real value of income concentration does not change the association between prior perceptions and the outcome. However, the results indicate a local information-attitude link concerning extreme overestimators who engaged in an intense processing effort of the treatment. For this group (representing 11% of treated participants), learning the real value is actually related to lower pro-redistribution demands.
Previous research
Motivated by rising inequalities across post-industrial economies, an emerging interdisciplinary empirical literature examines the interplay of objective economic inequality, popular perceptions of inequality levels, and public policy preferences in high-income countries. A few of these studies have a cross-national focus or involve case studies of European or Latin American countries (Cruces et al., 2013; Fernández-Albertos and Kuo, 2018), but – in part due to the particularly large increases in economic inequality that have occurred in the United States – most of this work focuses on American society (Ciani et al., 2021). This latter emerging literature addresses two main issues: first, whether Americans are informed about core aspects of income inequality (descriptive question); second, whether the accuracy of perceptions affects redistribution attitudes (reactiveness question).
Concerning the descriptive question, most authors conclude that Americans are misinformed about the central parameters of economic inequality in the United States (Gimpelson and Treisman, 2018; Trump, 2019). In a recent review, Hauser and Norton (2017: 24) state categorically that ‘the bulk of the current evidence suggests that people around the world hold incorrect perceptions of inequality in their country’, an argument they also apply to the US case. Previous work shows that Americans underestimate the income of low- and medium-income occupations (Gimpelson and Treisman, 2018; Niehues, 2014) and, more importantly for the purposes of this study, grossly underestimate the income of CEOs. In 2009, survey respondents asked for a guesstimate of the salary of the ‘CEO of a large national corporation’ provided an average value of $500,000, when the real value is over $14,000,000 (Page and Jacobs, 2009). Other surveys reveal equivalent gaps between guesstimates of top incomes and the actual ones (Kiatpongsan and Norton, 2014). Given this widespread misinformation about the remuneration of very highly paid occupations, it is not surprising that Americans tend to understate the overall gap in salaries across the spectrum of occupations (Page and Goldstein, 2016). However, Americans do not consistently underestimate all dimensions of inequality. A few studies also show that Americans overestimate the wealth accumulated by the TOP and the top 20% (Eriksson and Simpson, 2012; Gimpelson and Treisman, 2018; Norton and Ariely, 2011).
Additional nuance is provided by the strand considering longitudinal shifts. At the country-level, agreement with statements such as ‘the rich get richer and the poor get poorer’ actually peaked in the 1990s and has declined since then, despite the fact that inequality increases have continued since 1980 (Bartels, 2008; McCall and Kenworthy, 2009). But at the sub-national level, objective levels or changes in inequality at state and local level are positively related to perceptions of inequality (Newman et al., 2018). Along these lines, using surveys for 1987–2010, Franko (2017) shows that US states with high levels (larger growth) of income share held by the richest 1% and 10% display higher levels (increases) of perceptions of growing inequality. The overall picture of Americans’ knowledge of income inequality is therefore complex: their perceptions of changes reflect shifts in local (but not national) trends; they underestimate the income of top earners; while they also overestimate the wealth concentrated in the wealthiest Americans.
Several studies have addressed the reactiveness question concerning the relationship between knowledge of economic inequality and redistribution preferences. These studies generally rely on split-sample, experimental designs in which only treated respondents are provided with reliable, non-partisan information on inequalities and treated and non-treated participants indicate their policy preferences. For instance, Kuziemko et al. (2015), ask treated respondents to read an article about their relative position in the income distribution, changes in salaries by income group and information on changes in the top tax rates. McCall et al. (2017) instead provide treated participants with information on the average income growth for different income groups between 1979 and 2007. Becker (2020) informs respondents of income gaps across gender, racial and educational groups and Settele (2022) of wage gaps between men and women. These four studies report significant average information effects: treated respondents display significantly higher support for government-based redistribution than respondents in the control group.
However, other studies report null, opposite, or only local effects. Hoy and Mager (2021b) assess information effects for individuals in the lowest two quintiles in 10 countries (including the United States). They show that treated participants who are informed that they are in the treated group are not significantly more supportive of re-distribution than those who are not informed of that fact. Hoy and Mager (2021a) report that information on differences in wealth and income mobility has an average negative effect on redistribution attitudes. Trump (2018) shows that reading information on the mean annual salary of six occupations does not shape redistribution preferences. Finally, Boudreau and MacKenzie (2018) inform treated participants of the yearly income earned by the top income quintile in California and show that for Republicans this information increases their support for a progressive income tax.
Prior research on the reactiveness question has greatly improved our understanding of the link between knowledge of inequality and attitudes toward inequality. However, three relevant limitations can be identified in each of these studies. First, three studies rely on non-representative, convenience samples (Becker, 2020; Cansunar, 2018; Trump, 2018). Second, Becker (2020), Hoy and Mager (2021a), Kuziemko et al. (2015), McCall et al. (2017), and Trump (2018) treat respondents with information on several economic actors and/or indicators of income inequality. Under those conditions, the distinct impact of each single piece of information cannot be determined.
More importantly, the key studies of McCall et al. (2017) and, especially, Kuziemko et al. (2015), which report significant information effects, may overestimate the latter by conflating learning and priming effects. 2 This conflation may happen because these two studies do not (1) ask control group respondents for guesstimates of levels of inequality or (2) warn control group respondents that their studies focus on attitudes toward inequality before answering questions on policy preferences. Under those conditions, only treated participants are thus able to retrieve considerations on this topic from long- or short-term memory before answering the questions on policy preferences. General inequality frames (e.g. extreme high-income groups enjoying undeserving riches (McCall, 2013)) already held in the long-term memory may constitute such considerations and ultimately color the average responses of treated participants, independently of the hard information they receive. 3 Given their research design, these two studies cannot explore conditional treatment effects that depend on prior belief. Similar to Trump (2018), they do not assess the possibility of information effects restricted to respondents who underestimated, overestimated, or accurately estimated the level of inequality.
Our project seeks to avoid the aforementioned limitations in prior research by (1) using a representative sample, (2) leveraging an analytical strategy that minimizes the asymmetric activation of pre-existing considerations, and (3) focusing on one key social actor and a single piece of information: income concentration in the TOP.
Works on the consequences of the rise of economic inequality in the United States offer compelling reasons to explore the attitudinal effect of information on the TOP in the income distribution. There is now a broad academic consensus that shifts at the top end of the income distribution account for the general rise in economic inequalities observed over the last four decades (Hirschman, 2021; Piketty, 2018). Between 1979 and 2018, the pre-tax income among households in the lowest and third quintiles grew by 60% and 17%, respectively. By contrast, the net income among households in the TOP grew by as much as 243% (Congressional Budget Office, 2018). As a result of these unbalanced levels of income growth, income concentration at the top tier has increased substantially. Using individual-level data, the TOP, which held 10% of the yearly income in 1980, held as much as 19% of the total income in 2020 (Figure 1) (World Inequalities Dataset, 2023). As economic inequality in recent decades has been mostly driven by the concentration of income at the very top of the distribution (Hoffmann et al., 2020), especially in the case of the United States (Heathcote et al., 2010, 2023), public perception of growing inequality has gone hand in hand with a feeling that the very rich and the rest of society are drifting apart.
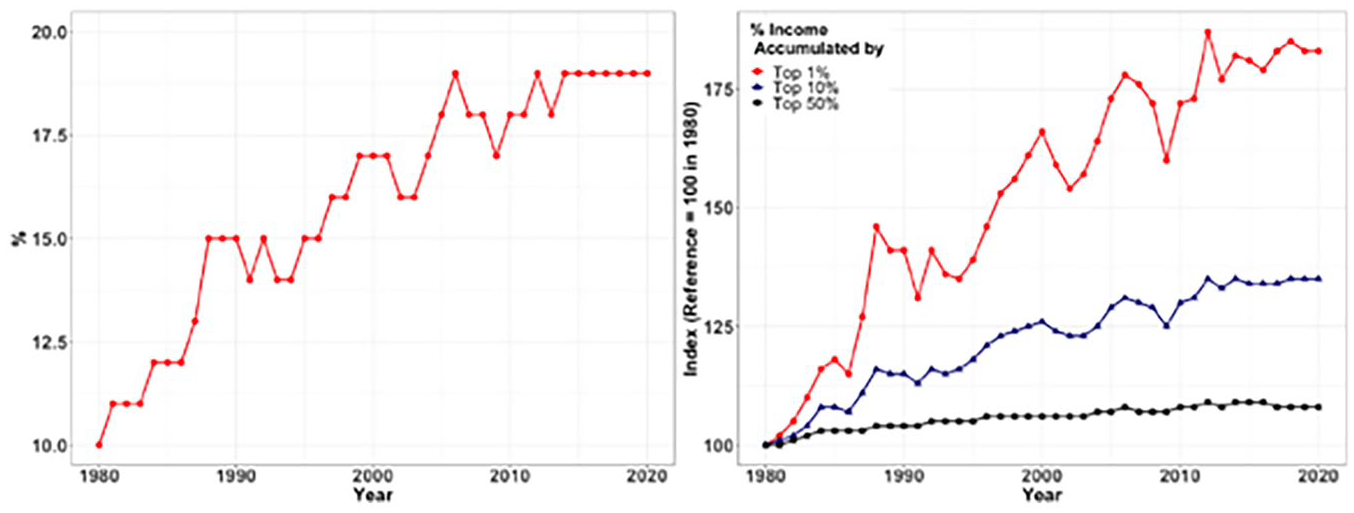
The trend of percent income accumulated by the top 1% (left) and the trends of income share growth by the top 1%, top 10%, and top 50% (right).
Hypotheses
In this section, we draw on principles of cognitive psychology, political economy, and the literature on perceptions of inequality to formulate four hypotheses on the interplay between objective inequality, perceptions of inequality and support for redistribution. The hypotheses specifically address (1) accuracy in perceptions of income concentration in the TOP, (2) the link between perceptions of income concentration and redistribution preferences, and (3) the moderating influence of non-partisan information on the perceptions–preferences link.
As noted above, previous research shows conclusively that Americans misperceive the effective levels of inequality. Moreover, perceptions of income concentration in the TOP are probably especially inaccurate because indicators of this concentration are rarely discussed by the mainstream media, and average citizens rarely have personal interactions with this social group to provide hints on the latter’s income position (Phillips et al., 2020). In the absence of knowledge of the status of the TOP, we expect individuals to establish their perceptions based on cognitive heuristics, especially an anchoring-and-adjustment heuristic. Cognitive psychology conclusively shows that when actors do not have reliable considerations to make guesstimates, they generate descriptive perceptions by relying on an anchor value, which acts as a cognitive benchmark that heavily influences quantitative guesstimates (Epley and Gilovich, 2006; Tversky and Kahneman, 1974). Moreover, cognitive psychology gives reasons to suggest that, facing a 0–100% range, the cognitive anchors used by respondents will probably revolve broadly around 50%. Individuals in general tend to have a ‘binary bias’ (Fisher and Keil, 2018) so that they usually conceptualize distributions in dichotomous terms – for example, ‘more/less than’—, which in contexts of high uncertainty means that they are prone to use the middle point in the range as an anchoring value. In line with this, extensive research also shows that respondents have ‘response contraction bias’: they tend to select central values in a given distribution, overestimating low effective values and underestimating high effective values (Jou et al., 2004; Poulton and Poulton, 1989). We hence expect respondents to disproportionately select guesstimates between 40% and 60%. Since the ultimate real value – the income concentrated in the TOP in 2020 – is 19%, our expectation is therefore that respondents will largely overestimate income concentration in the TOP.
H1: Individuals tend to overestimate income concentration in the TOP.
Our main interest, however, lies in the determinants of redistribution preferences. Americans do care about income inequality (McCall, 2013), hold general beliefs regarding income inequality and, when requested, provide estimates of the level of income concentration in the TOP. These pre-existing perceptions of inequality (of variable accuracy) can be expected to influence redistribution preferences through social comparisons. A long literature shows that perceptions of social reality and cross-group comparisons – what Bourdieu (1991) call ‘spontaneous sociology’ – influence individual attitudes and behaviors.
Recent work on social psychology documents that people determine their satisfaction with their income not by its direct purchasing power, but mainly through informal social comparisons to other groups (Willis et al., 2022). Higher-income groups are critical in this regard, as they set the ideal living standards and consumption patterns for the rest of the population. Hence through comparisons to higher-income groups, individuals determine their ‘subjective income’ (Goya-Tocchetto and Payne, 2021: 153) – that is, their perception of whether their current income is sufficient or not. People who perceive their income as being far from those top earners are more likely to be frustrated about falling behind in living standards, inducing their support for pro-redistribution attitudes. Indeed, independently of their income, people who feel poorer or have lower socioeconomic status (SES) are more supportive of redistribution (Jackson and Payne, 2021) and less supportive of income inequality (García-Sánchez et al., 2019). This logic should apply to perceptions of the income of top earners. Individuals who think that the top income group accrue a particularly large proportion of resources should feel comparatively poorer and particularly behind in their living standards, and thus be more supportive of redistribution. Along these lines, recent research shows that perceptions of the level and changes in income inequality are positively related to redistribution attitudes (Gimpelson and Treisman, 2018; Kuhn, 2019; McCall, 2013; Willis et al., 2022). According to these principles, we expect prior perceptions of income concentration in the TOP to affect support for redistribution. Individuals who – accurately or not – consider that income is highly concentrated among the super-rich should be more supportive of redistribution. This is depicted by the function ‘untreated individuals’ in Figure 2.
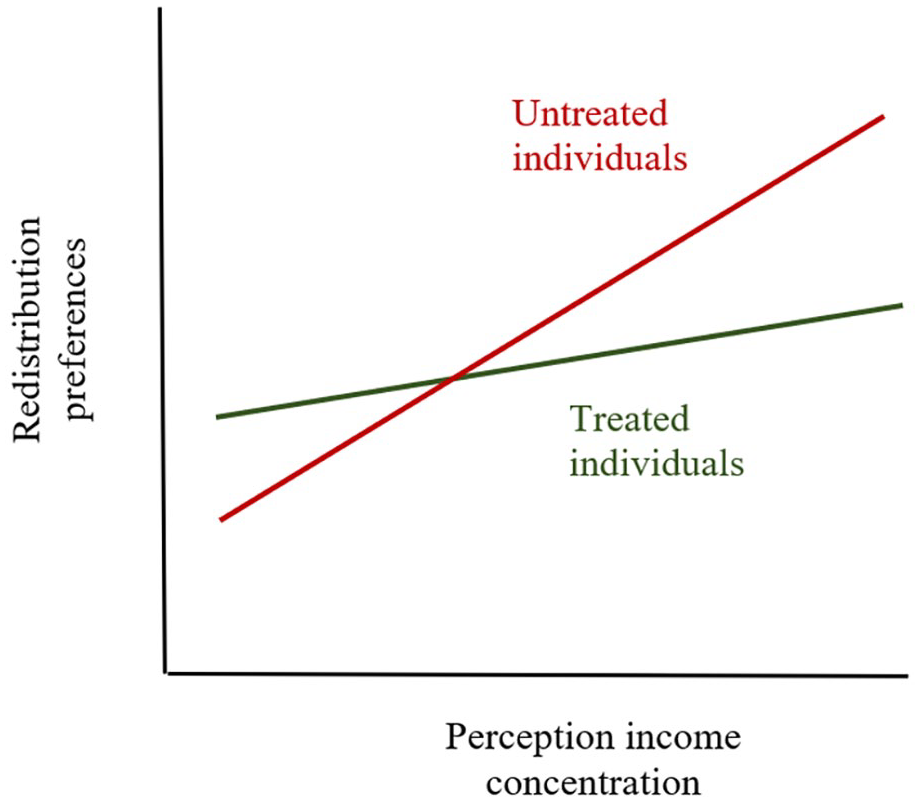
Theoretical prediction of the relationship between perceived inequality and redistribution preferences.
H2: Individuals who provide a higher guesstimate of income concentration are more supportive of redistribution.
Moreover, we expect the association between prior guesstimates and redistribution preferences to be conditional on the experimental treatment used in this study. To formulate this argument, we draw on the elaboration likelihood model (ELM), a well-established dual process theory of persuasion (Albarracin and Shavitt, 2018; El Hedhli and Zourrig, 2023; Petty and Briñol, 2020). ELM states that when people are unmotivated and engage in low cognitive elaboration, attitude change is driven by cues (e.g. speaker characteristics). But when people are motivated about an issue and have the ability to process the information, they engage in high cognitive elaboration and attitude change is driven by an assessment of the merits of the new information. If this latter ‘central route’ to persuasion is activated, people exposed to new information retrieve the most directly linked considerations in working memory – that is, prior descriptive and prescriptive beliefs on that matter – compare those beliefs to the new information and, if there is a mismatch, revise their prescriptive perceptions to avoid cognitive dissonance (Gerber and Green, 1999; Petty and Briñol, 2020). 4 Given that the information included in the treatment of income concentration discussed below is important, we argue that it activates this latter central route of cognitive processing.
However, does the provision of reliable information accentuate or attenuate the positive impact of perceptions on redistribution attitudes? To formulate a prediction in this regard, we integrate the principles of the political economy of redistribution and cognitive psychology. Growing literature in political economy highlights the centrality of other-regardingness concerns in the formation of policy preferences. The widely recognized ‘social welfare’ (Dimick et al., 2018) and ‘inequity aversion’ (Fehr and Schmidt, 2006) models, in particular, concur that when forming redistribution preferences, individuals balance their self-interests and their concern for overall societal welfare. These two models are based upon the assumption of a diminishing marginal utility of money, which implies that individuals are willing to sacrifice their own personal monetary wealth in order to ameliorate the welfare of the worst-off. Particularly in contexts of very low inequality, a unitary transfer of money produces meager improvements in overall societal welfare. However, in contexts of extreme inequality, a unitary transfer of money substantially improves the welfare of low-income groups and, consequently, overall societal welfare. Hence, under the additional assumption that citizens are fully informed, these two models predict a positive relationship between the level of inequality and average support for redistribution.
We draw on this principle while relaxing the full-information assumption of these political economy models. We expect the information on effective income concentration to revise prior perceptions of this concentration and for respondents to interpret this evidence as hard evidence of the level of inequality. Based on this lighter version of the other-regardingness models, upward revision of the prior – that is, the realization that income concentration has actually been underestimated–increases support for redistribution (Hvidberg et al., 2021). By contrast, a downward revision of the prior – that is, the realization that income concentration has actually been overestimated – reduces support for redistribution. Through these conjoint effects, we expect non-partisan information on the effective concentration of income in the TOP to moderate the positive association between (prior) perceptions of income concentration and redistribution preferences. This is depicted by the function ‘treated individuals’ in Figure 2.
H3: The positive association between overestimating income concentration and preferences for redistribution is weaker for individuals who received the factual information treatment.
Moreover, we expect this moderating effect to be particularly intense among participants who pay high attention to the information treatment. The notion that about 19% of all income earned by Americans in 2021 was amassed by the TOP is undeniably abstract, scientifically oriented, and not easy to grasp, which complicates the meaning-making process and the extraction of implications from this information (Phillips et al., 2020). However, comprehension of this information and its relationship with redistribution attitudes may be improved if individuals expend more intense processing effort. By intensity of cognitive effort we mean ‘how much an individual is disposed to exert themselves, moment-to-moment, in the engagement of their executive function’ (Foley and Radl, 2024: 4; also Bijleveld, 2018). For the abovementioned ELM, activation of the central route of cognitive processing is more likely under certain conditions. One is ‘the amount of thinking about a communication’ or a situation of high cognitive effort (Petty and Briñol, 2010: 225). Hard thinking facilitates the connection between new considerations and the past attitudes of the person, enabling their revision and making them more readily accessible when the person has to voice an opinion (Petty and Briñol, 2020). ELM suggests that careful thinking about non-partisan, statistical information increases the chances of an assessment of its social and political implications, which precondition an information effect.
One proxy for intensity of cognitive effort the time spent reading the new information. Along these lines, Gouveia (2017) shows that the effect of information on the financial sustainability of the pension program on support for pension reform is larger for respondents who spend more time reading the treatment. Based on this reasoning, we therefore expect the effect of the treatment on redistribution preferences to be strongest among treated participants who analyzed the information for a longer period of time. Together with H3, we propose the following hypothesis:
H4: The positive association between overestimating income concentration and preferences for redistribution is weaker for individuals who received the factual information treatment and particularly among those who spent more time processing the information.
Data and methods
To test our hypotheses, we conducted an online, split ballot survey experiment in the United States in November–December 2021. The survey was administered by YouGov. The design of the sample used quotas for age, gender, education, and region, plus the interlock between gender and age, so that the resulting sample has a demographic composition reflecting the US population in 2021. According to a recent evaluation, relational inferences from matched opt-in samples such as the YouGov sample we collected are more likely to be generalizable than those from unmatched samples (Graham et al., 2021). Our final sample includes 4,114 individuals, and sample weights were used to correct for small deviations from the theoretical sample.
In the experiment, respondents were randomly assigned to a control group and a treatment group of equivalent size. Given that prior work has reported only small information effects on attitudes (Ciani et al., 2021), in order to maximize the statistical power of all tests the experiment only considers one piece of information: income concentration in the TOP. The randomization conducted during the experiment was successful, as respondents assigned to control and treatment groups do not differ significantly in their socio-economic characteristics (as is reported in Table 1). To ensure that both the control and the treatment groups had activated their network of considerations regarding inequality (preventing an asymmetric framing effect), they were shown the following text: Economic inequality is currently under debate in the U.S.–specifically the income of the top 1% of the population. The 2020 US Census lists the total US adult population at 258 million people, meaning that 2.58 million adult Americans are the 1% with the highest annual pre-tax income.
Mean differences in control variables between control and treated groups.
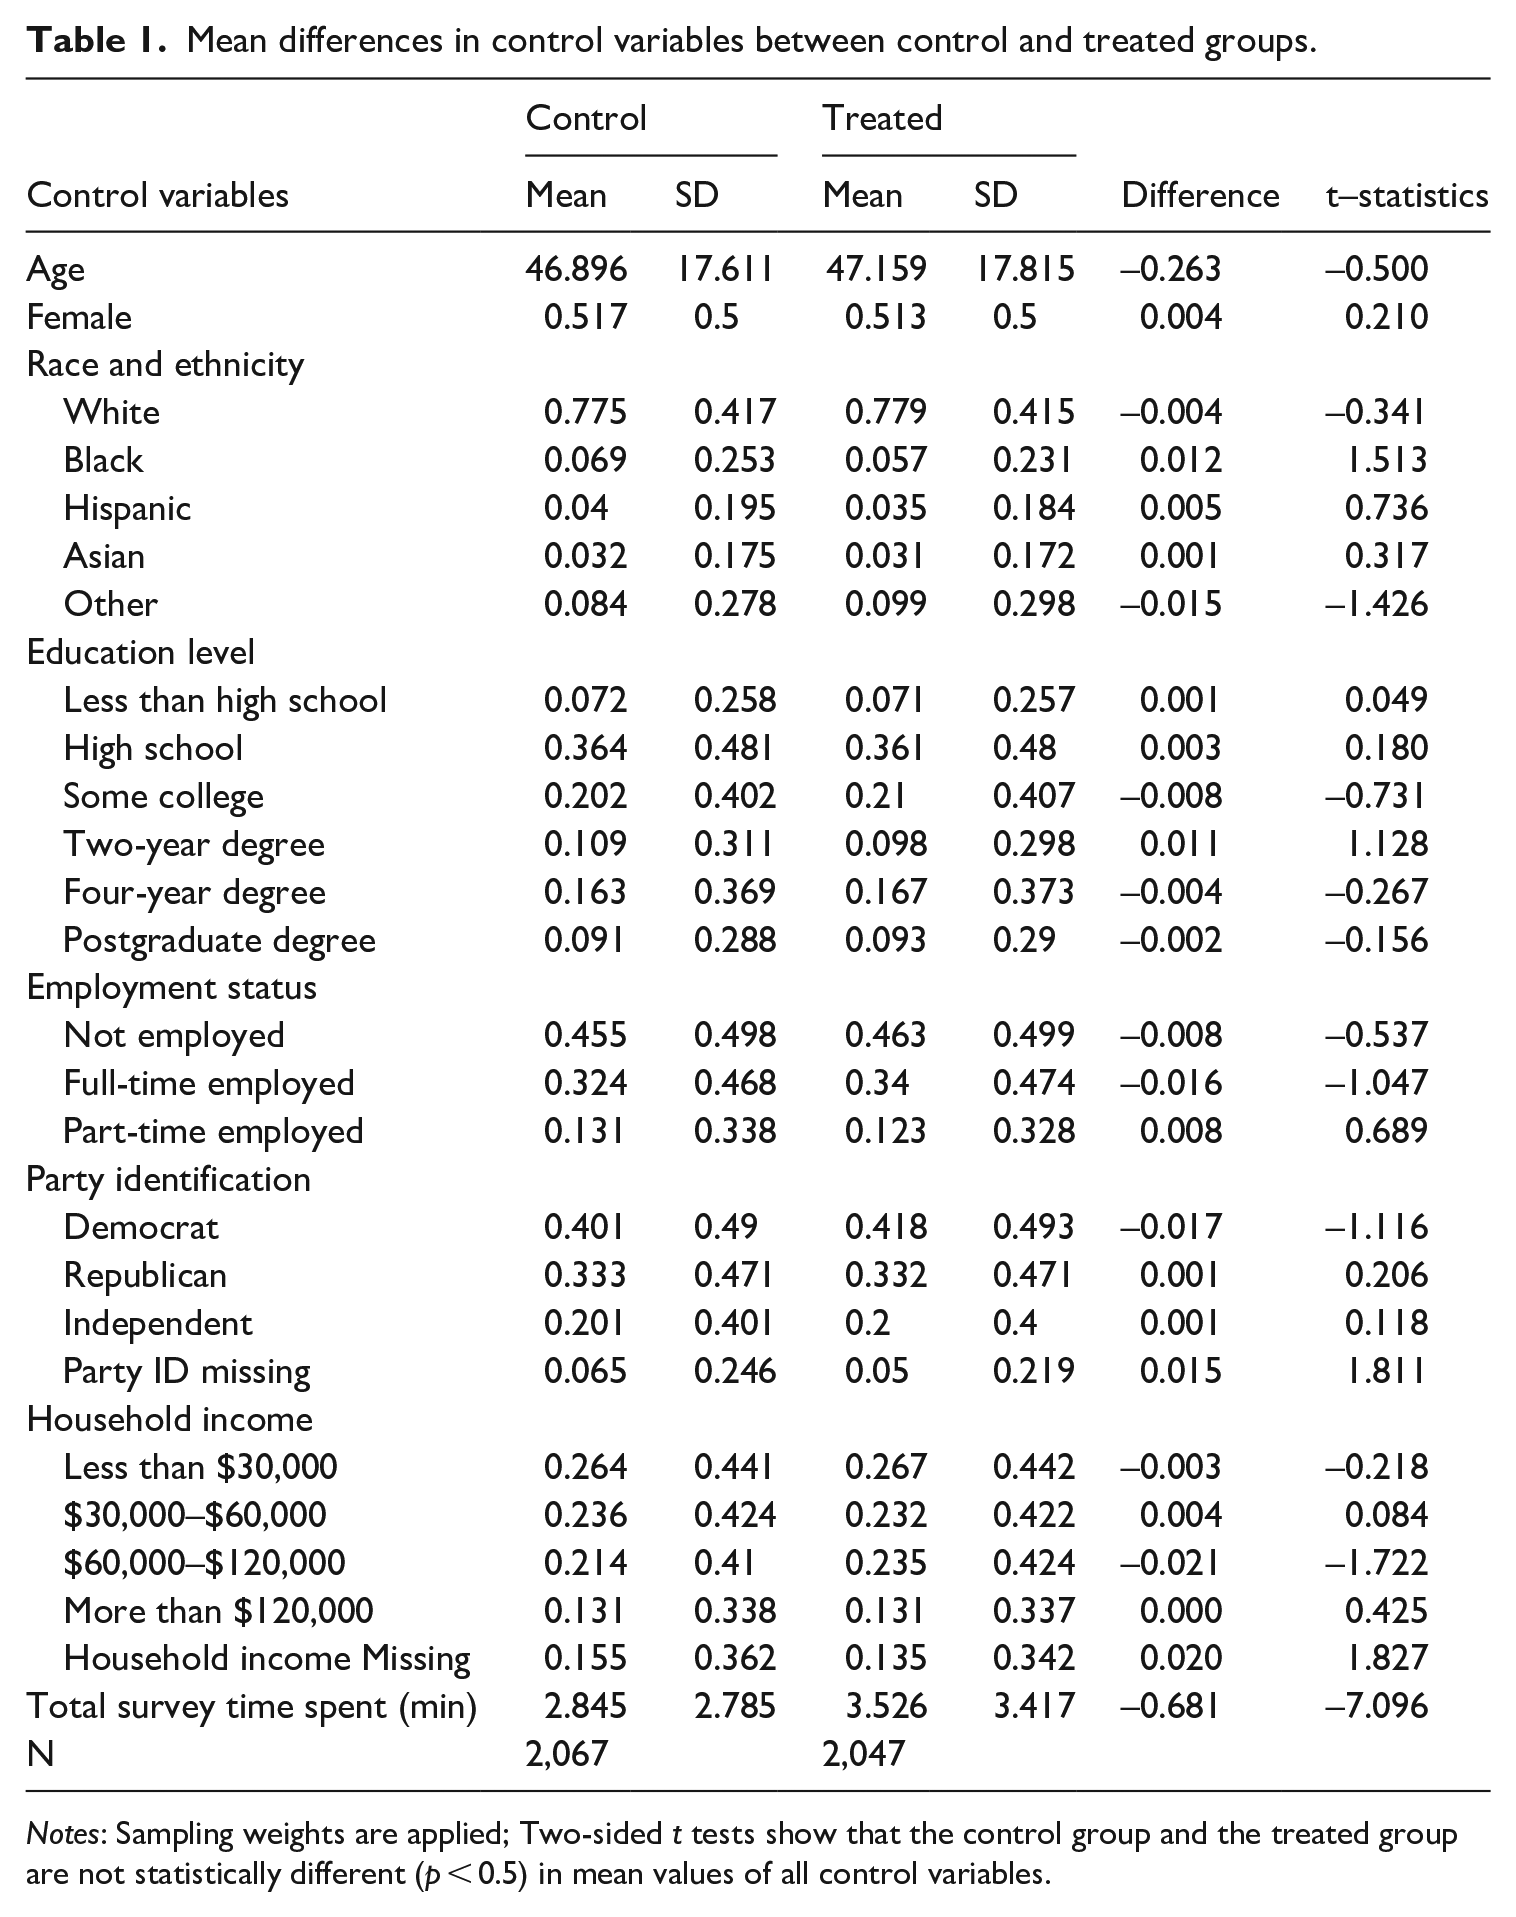
Notes: Sampling weights are applied; Two-sided t tests show that the control group and the treated group are not statistically different (p < 0.5) in mean values of all control variables.
They were immediately afterwards asked: ‘In your best estimation, what was the proportion of total income in the US earned by people included in the top 1% group in 2020? By income, we refer to individual, annual pre-tax income’. Respondents had a blank box with a % sign to provide their guesstimate. Supplemental Figure A1 includes a caption of the text observed by the respondents.
As a manipulation check, all respondents were then asked to state how confident they were about the accuracy of their estimate. Respondents in the treatment group were immediately afterwards shown the treatment which reads: The proportion of total individual, annual pretax income earned by US individuals included in the top 1% group is 18.76%. That means that the 2.58 million Americans with the highest income earn 18.76% of the total yearly income of the US adult population.
To ensure that respondents realize the gap between their guesstimates and the real value, we then provided them with a tailored sentence with that gap which subtracts their guesstimate from the real value: ‘Given your answer, your estimate was [X] percentage points higher than the real value’. Furthermore, to ensure respondents read the treatment closely, we include a manipulation check asking: ‘To what extent are you surprised by this information?’ Supplemental Figure A2 includes a caption of the treatment. The estimates of income concentration were obtained from World Inequalities Dataset (2023). By contrast, the control group did not receive any information on the actual figure. The variable treatment distinguishes participants in the treatment (1) and control groups (0).
After the experiment took place, both groups were asked questions about their redistributive preferences. To measure preferences for redistribution, we rely on an attitudinal multi-item index, which taps into two main dimensions usually analyzed in the literature (Cavaillé, 2023): (1) attitudes toward inequality reduction by state intervention via different policy instruments; and (2) attitudes toward inequality itself. More specifically, we construct an attitudinal index based on six questions tapping into different dimensions of redistribution beliefs (governmental action, affect, taxation, basic income, merit, and income caps). By relying on a multidimensional index of redistribution preferences, we increase the content validity of the multivariate tests below (DeVellis and Thorpe, 2021). The six questions read: (1) ‘It is the responsibility of the government to reduce the differences in income between people with high incomes and those with low incomes’; (2) ‘How do you feel when you think about differences in income between the rich and the poor in the U.S.?’; (3) ‘How would you describe current taxes in the U.S. today for people with high income?’; (4) ‘Would you favor or oppose the federal government providing a guaranteed income?’; (5) ‘The very rich should keep their money, even if that means increasing inequality’; and (6) ‘In general, do you agree there is a maximum amount that a CEO should be paid relative to the average worker, no matter the company and its performance?’. Possible answers for all these questions were ranked from 1 to 5. All six variables were scaled so that a higher value indicates stronger support for redistribution.
Since we have different measures of preferences for social policies, we conduct a Principal Components Analysis (PCA) to extract one component that represents the common variance of preferences and neutralizes measurement error. We keep the first component, the eigenvalue of which is 3.7, and it accounts for 61.71% of the common variation, although we replicate the entire analysis for all six dependent variables (see Models 2–7, Table 3). Concerning the analytical strategy, we use ordinary least squares (OLS) to regress PCA scores against a set of explanatory variables. 5 Our key independent variables in the analysis involve (1) the perception of the percentage of income accumulated by the TOP and (2) indicators of having participated in the treatment group. Although the control and treatment groups are balanced, in the main models, we also include controls for socio-demographic characteristics that have been proven to be related to redistribution attitudes by previous research: age, gender, race, and ethnicity (white, black, Hispanic, Asian, and other), education level (less than high school, high school, some college, 2-year degree, 4-year degree), employment status (not employed, full-time employed, part-time employed), party identification (Democrat, Republican, independent), and yearly household income (less than $30,000, $30,000–$60,000, $60,000–$120,000, more than $120,000) (McCall and Percheski, 2009). An additional control variable captures the total time taken to complete the survey. The Supplemental Appendix provides formal definitions and the operationalization of all independent variables. Table 2 provides descriptive statistics of all variables.
Descriptive statistics.
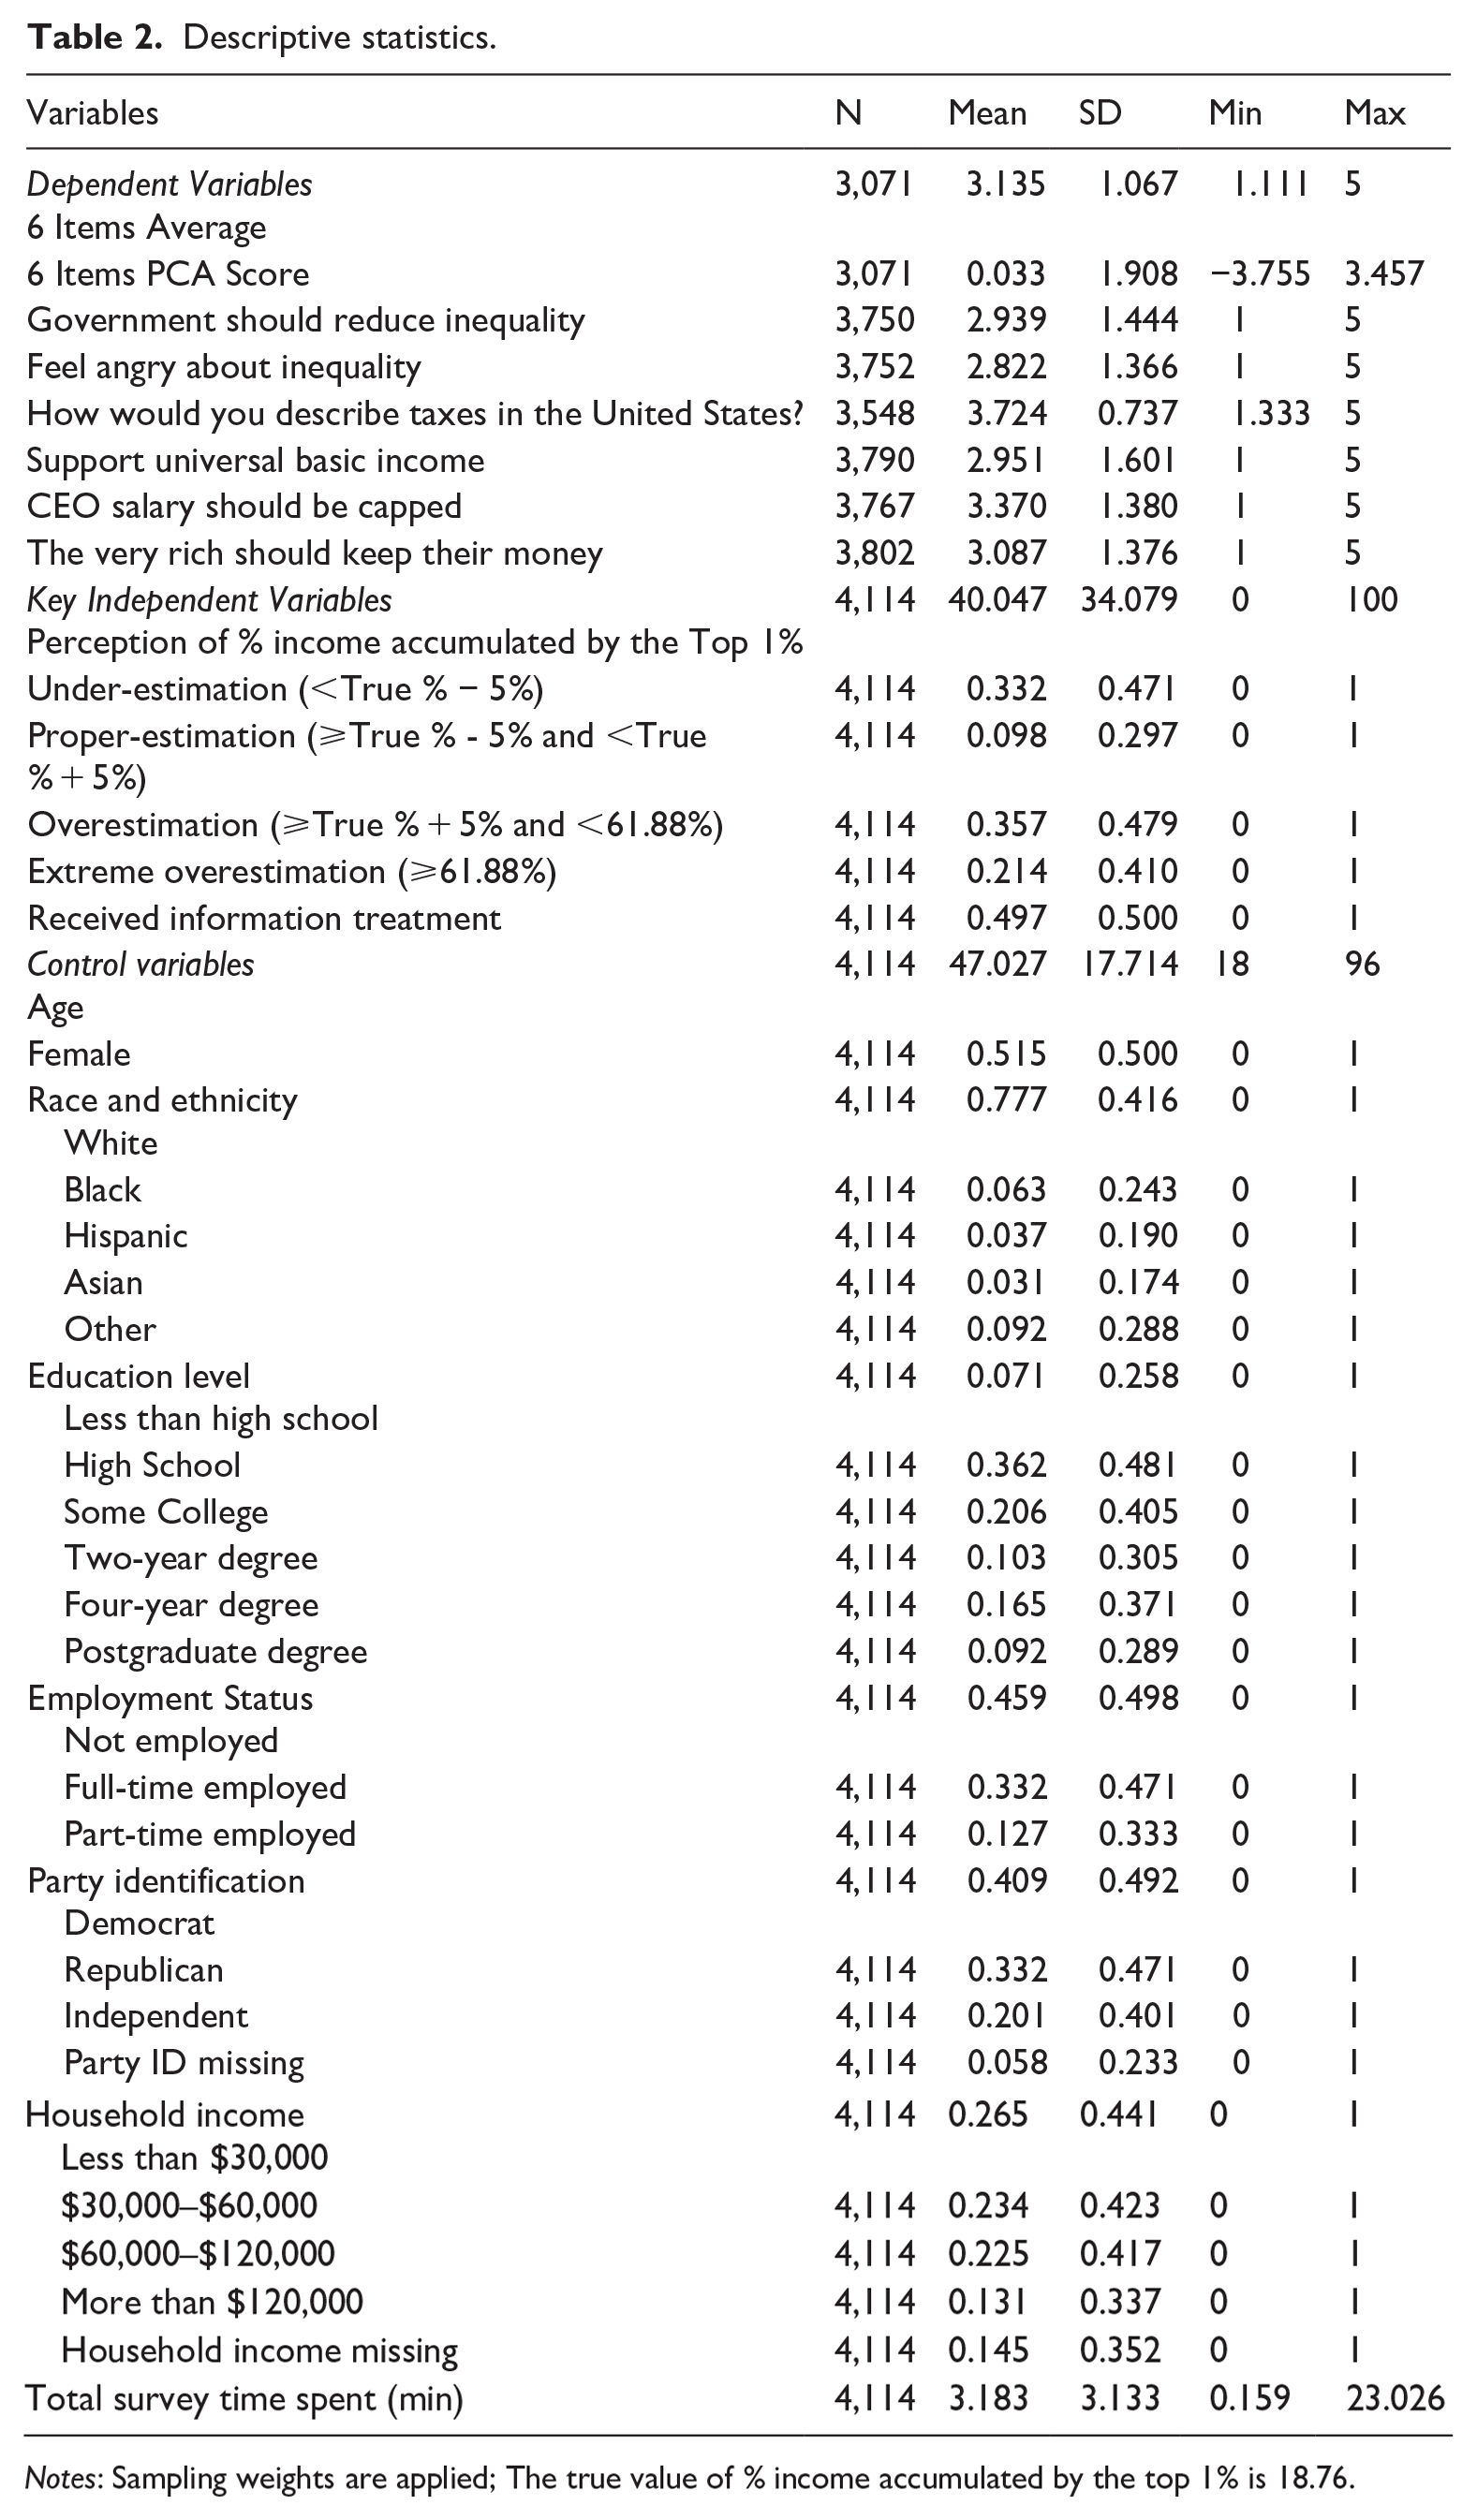
Notes: Sampling weights are applied; The true value of % income accumulated by the top 1% is 18.76.
Associations between perceived top 1% income share and support for redistribution.
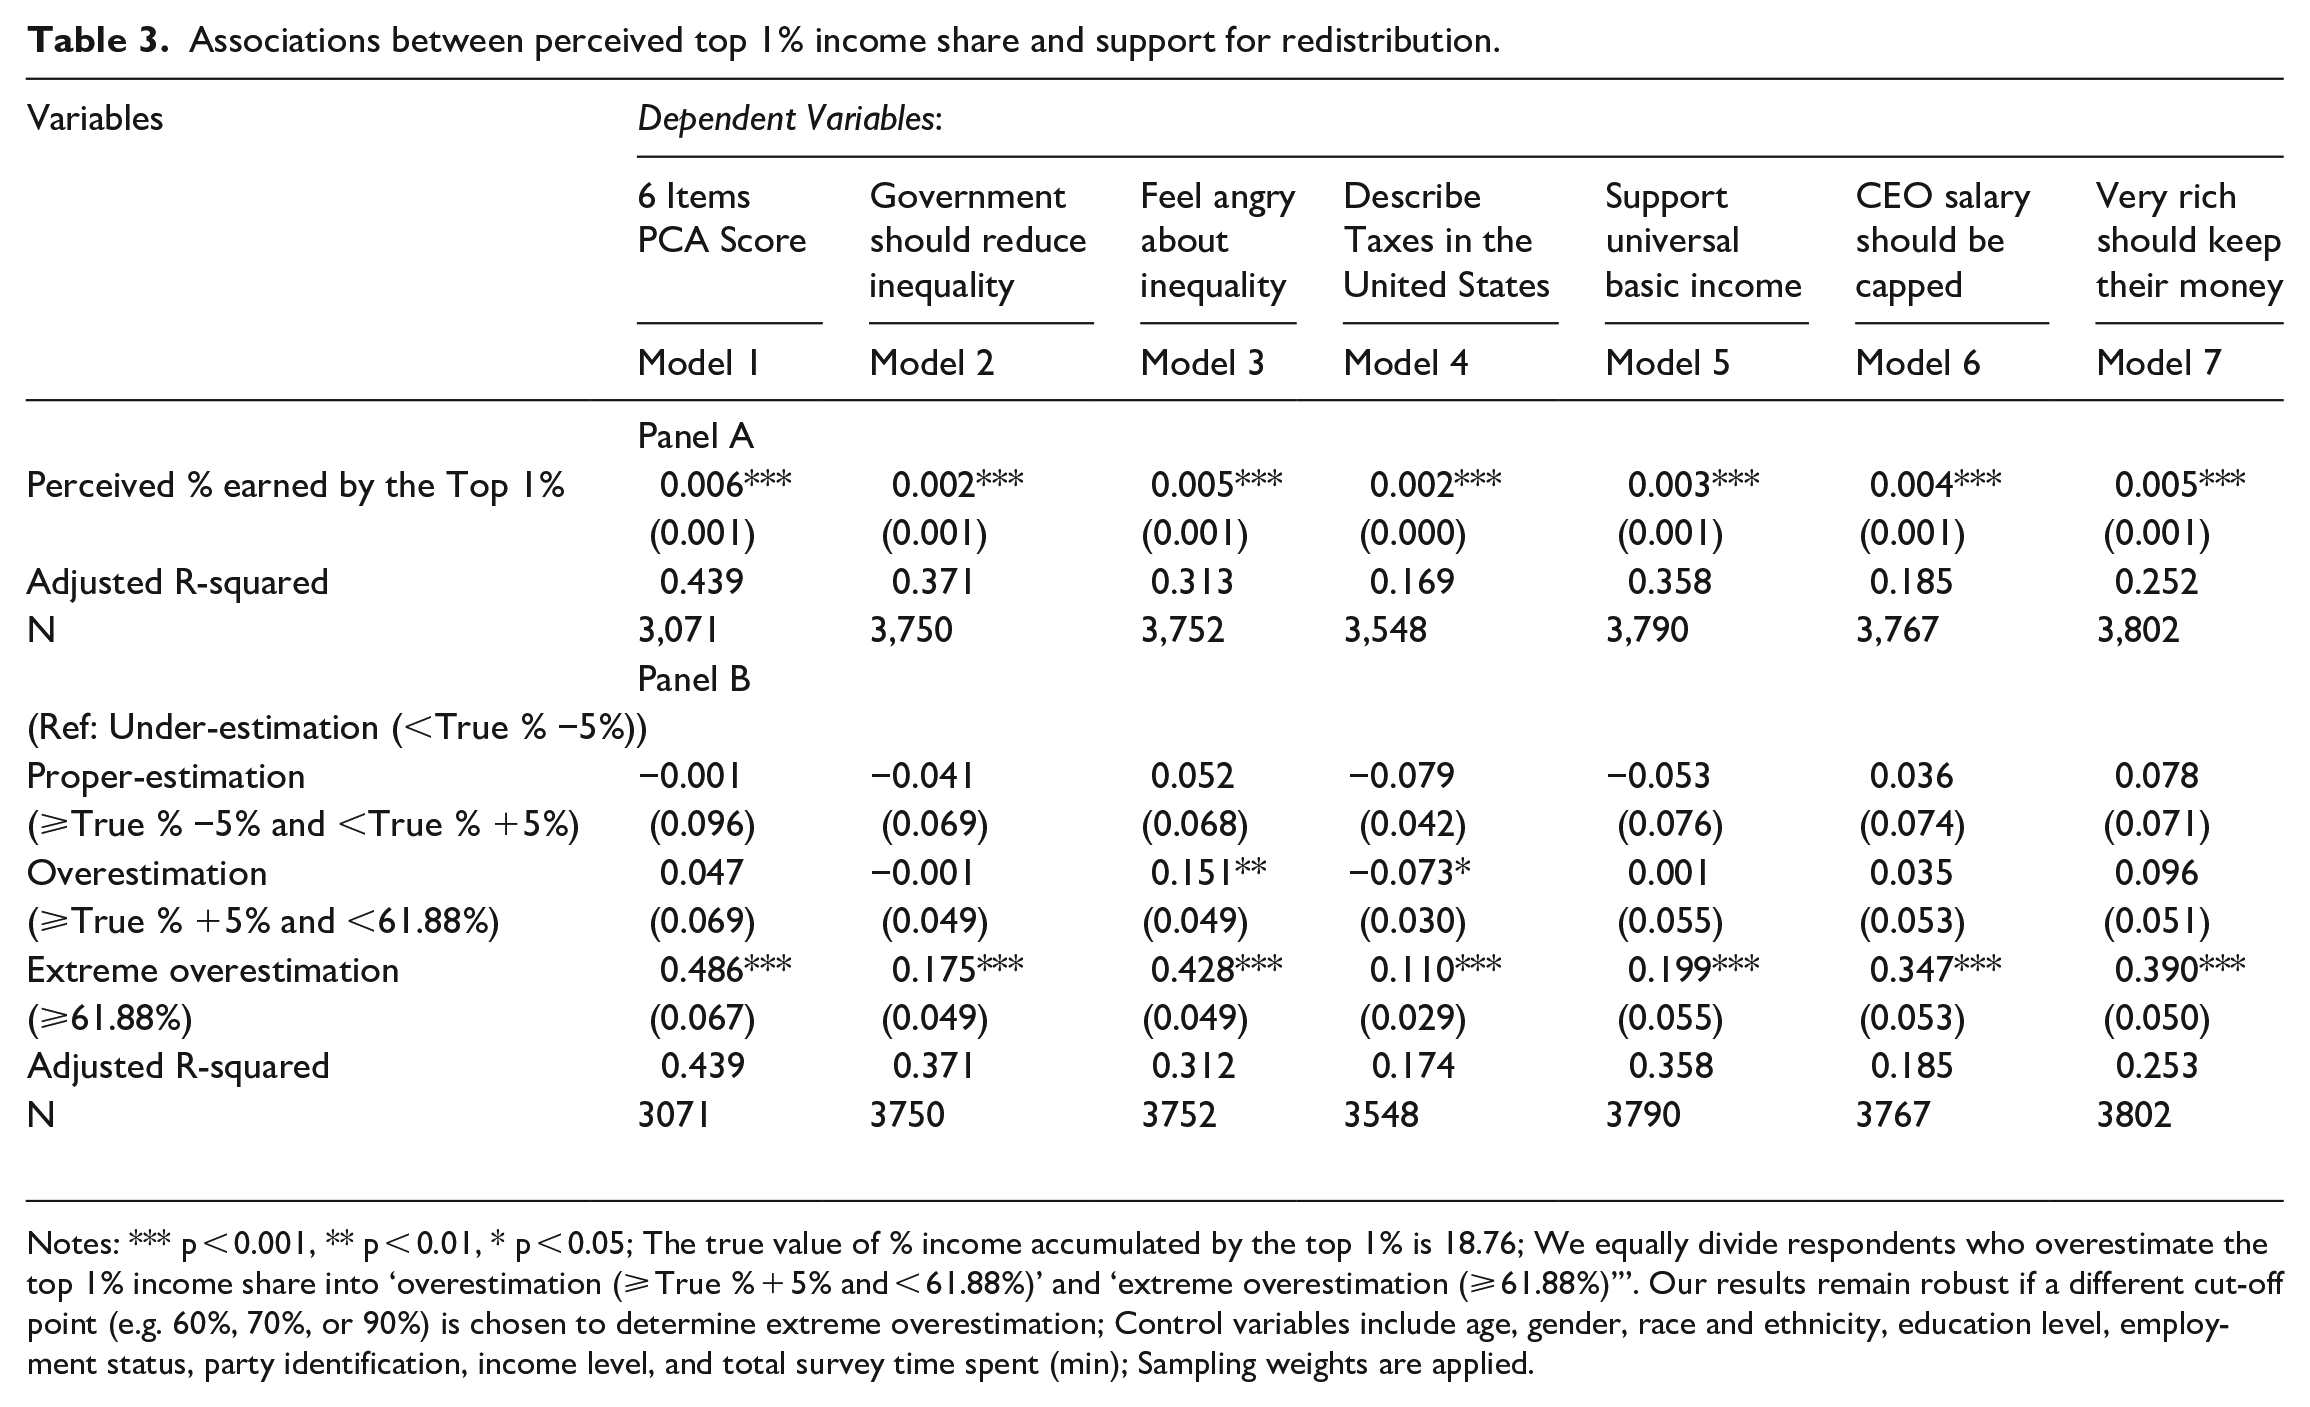
Notes: *** p < 0.001, ** p < 0.01, * p < 0.05; The true value of % income accumulated by the top 1% is 18.76; We equally divide respondents who overestimate the top 1% income share into ‘overestimation (⩾ True % + 5% and < 61.88%)’ and ‘extreme overestimation (⩾ 61.88%)’”. Our results remain robust if a different cut-off point (e.g. 60%, 70%, or 90%) is chosen to determine extreme overestimation; Control variables include age, gender, race and ethnicity, education level, employment status, party identification, income level, and total survey time spent (min); Sampling weights are applied.
In the following analyses, we assess the influence of prior perceptions of inequality on support for redistribution through a four-level, ordinal variable that contrasts the respondent’s guesstimate with the effective value. Proper estimation is defined as having provided a guesstimate with a value less than five absolute points above or below the real value (18.76%). Under-estimation is defined as having provided a guesstimate with a value lower than 13.76% – that is, five absolute points below the real value. Given the proportion of respondents who overestimated the value and the fact that the overestimation covers most of the full range (0–100), we distinguish between two forms of overestimation by separating the range of overestimation at its midpoint. Overestimation is defined as having provided a guesstimate between 23.76% and 61.87%. Extreme overestimation is defined as providing a guesstimate equal to or higher than 61.88%. This value is the midpoint between the upper bound we use for proper estimation and the maximum value of 100%.
Furthermore, we assess the treatment effect in two ways. First, a dichotomous treatment variable indicates whether the respondent was part of the treatment group. This variable allows us to test H3 indicating that the treatment moderates the effect of prior perceptions on redistribution preferences. Second, in subsequent analyses, we test the treatment effect through an ordinal variable (with three levels) reflecting the time each individual in the treatment group spent on the screen providing factual information about the income share accumulated by the TOP. This latter ordinal variable provides a proxy for the time spent reading the factual information and, therefore, the cognitive effort involved in processing this information and revising prior beliefs. Those in the first tertile of the time distribution are considered to have put in a low processing effort; those in the second tertile of the time distribution are considered to have put in an intermediate processing effort; and those in third tertile are considered to have put in a high processing effort. This latter variable allows us to test H4 indicating that the treatment effect is larger for respondents who maximize the processing effort. We have registered this study in the Open Science Framework.
Results
We begin the discussion of empirical results with a descriptive analysis of key variables. We specifically assess (1) the accuracy in respondents’ guesstimates of the income share of the TOP and (2) the distribution of the outcome. Concerning (1) Americans are clearly misinformed about income concentration in the TOP. Figure 3 depicts the smoothed distribution of respondents’ estimates of income concentration in the TOP in 2020. It indicates that, although the modal value (1%) is clearly below the real value (18.8%), a large proportion of respondents provide estimates well above the actual value.
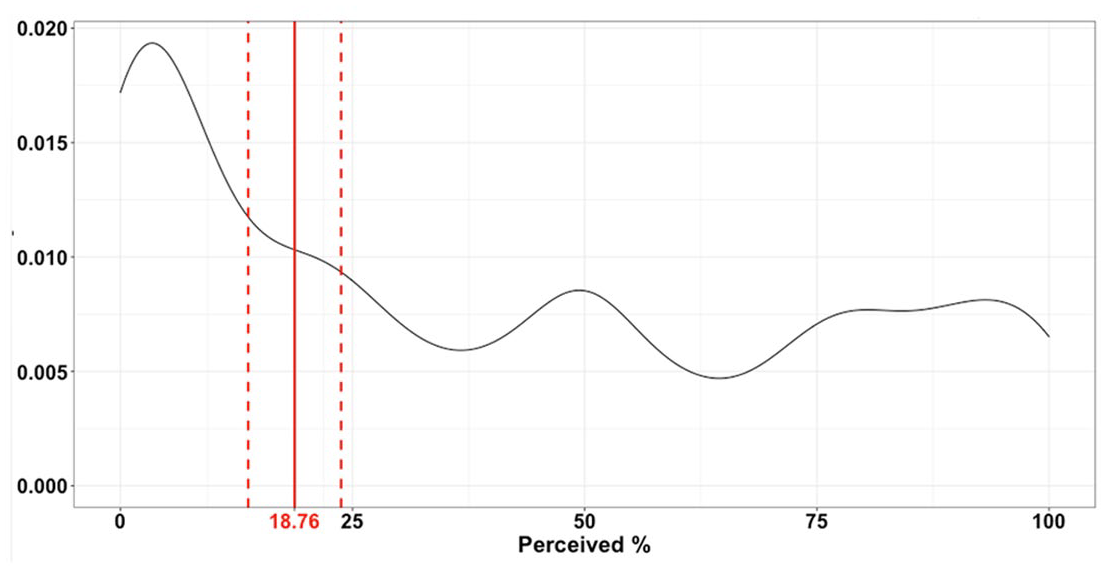
The distribution of perceived top 1% income share.
To determine how pervasive this misestimation is, we classify respondents according to the accuracy of their estimates based on the operationalization discussed above. Figure 4 depicts the distribution of respondents. In line with the patterns in Figure 3, almost 6 out of 10 Americans (57.1%) overestimate the income share of the TOP. This finding is consistent with H1. It is also consistent with the scholarship, which shows a general limited knowledge of the extent of inequality (Bartels, 2008; Hauser and Norton, 2017; McCall and Kenworthy, 2009) and overestimation of wealth concentration by the richest groups of the U.S. population (Eriksson and Simpson, 2012; Gimpelson and Treisman, 2018). As regards their redistribution attitudes, the overall pattern of attitudes is that between 4 and 6 out of every 10 Americans hold attitudes consistent with support for the reduction of inequalities.
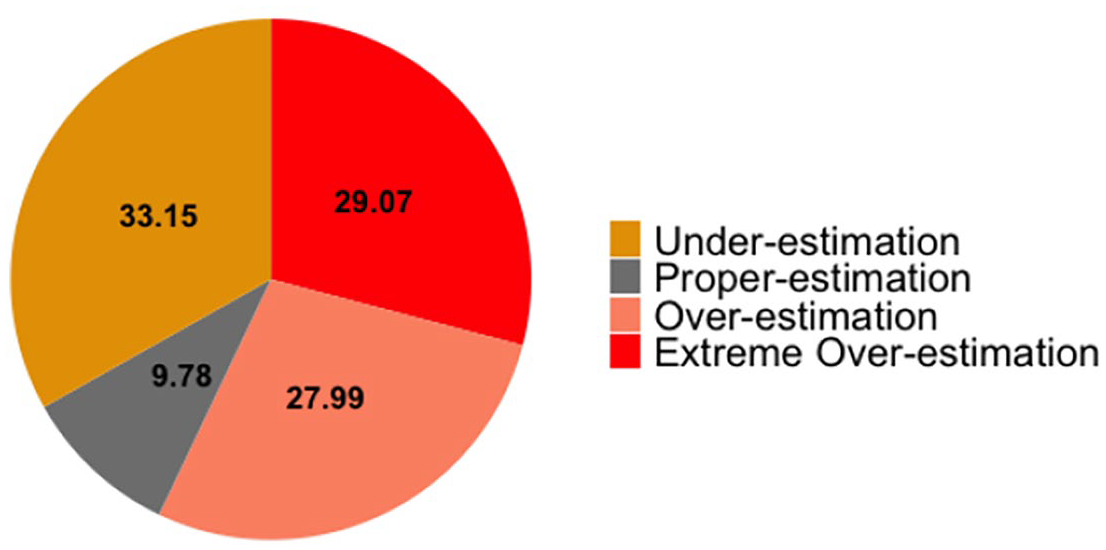
The proportion of respondents who over/proper/underestimate income share accumulated by the top 1%.
Americans therefore overestimate income concentration by the TOP and hold generally positive attitudes toward the reduction of inequality. However, what is the relationship between descriptive and evaluative perceptions of inequality? In other words, are considerations of the inequality level related to preferences for social policies? To answer, Table 3 includes OLS models that assess the perceptions-preferences link, with both the PCA score of the 6 redistribution preference items and each of the 6 specific item measures as the dependent variable. Models 1–7 in Panel A, Table 3 consistently indicate that – including and excluding control variables – perceptions of income concentration in the TOP are positively and significantly related to attitudes toward inequality. Since the effect of the guesstimate may not be linear, we furthermore estimate additional models in Panel B, Table 3 to distinguish participants by their level of under/overestimation. The evidence signals the non-linearity of the association. Controlling for multiple socio-economic factors, the proper estimators and mild overestimators overall do not differ significantly in their preferences from the underestimators (the reference category). However, extreme overestimators are significantly more likely to favor redistribution than underestimators. This evidence is thus consistent with H2.
Does providing the real value of income concentration alter redistribution preferences? A key objective of this study is to determine whether providing information on the actual income share accumulated by the TOP affects preferences for redistribution. To answer, we first replicate model 1 in Panel B of Table 3 but include an additional dichotomous variable called treatment. The evidence is included in model 5 (Table 4). The coefficient of treatment is very small and non-significant. Providing non-partisan, reliable information on income concentration in the TOP does not, on average, significantly lead to preferences toward inequality reduction. This suggests that the average respondent does not give a lot of weight to this piece of information.
Information treatment effects on support for redistribution, by treatment processing effort.
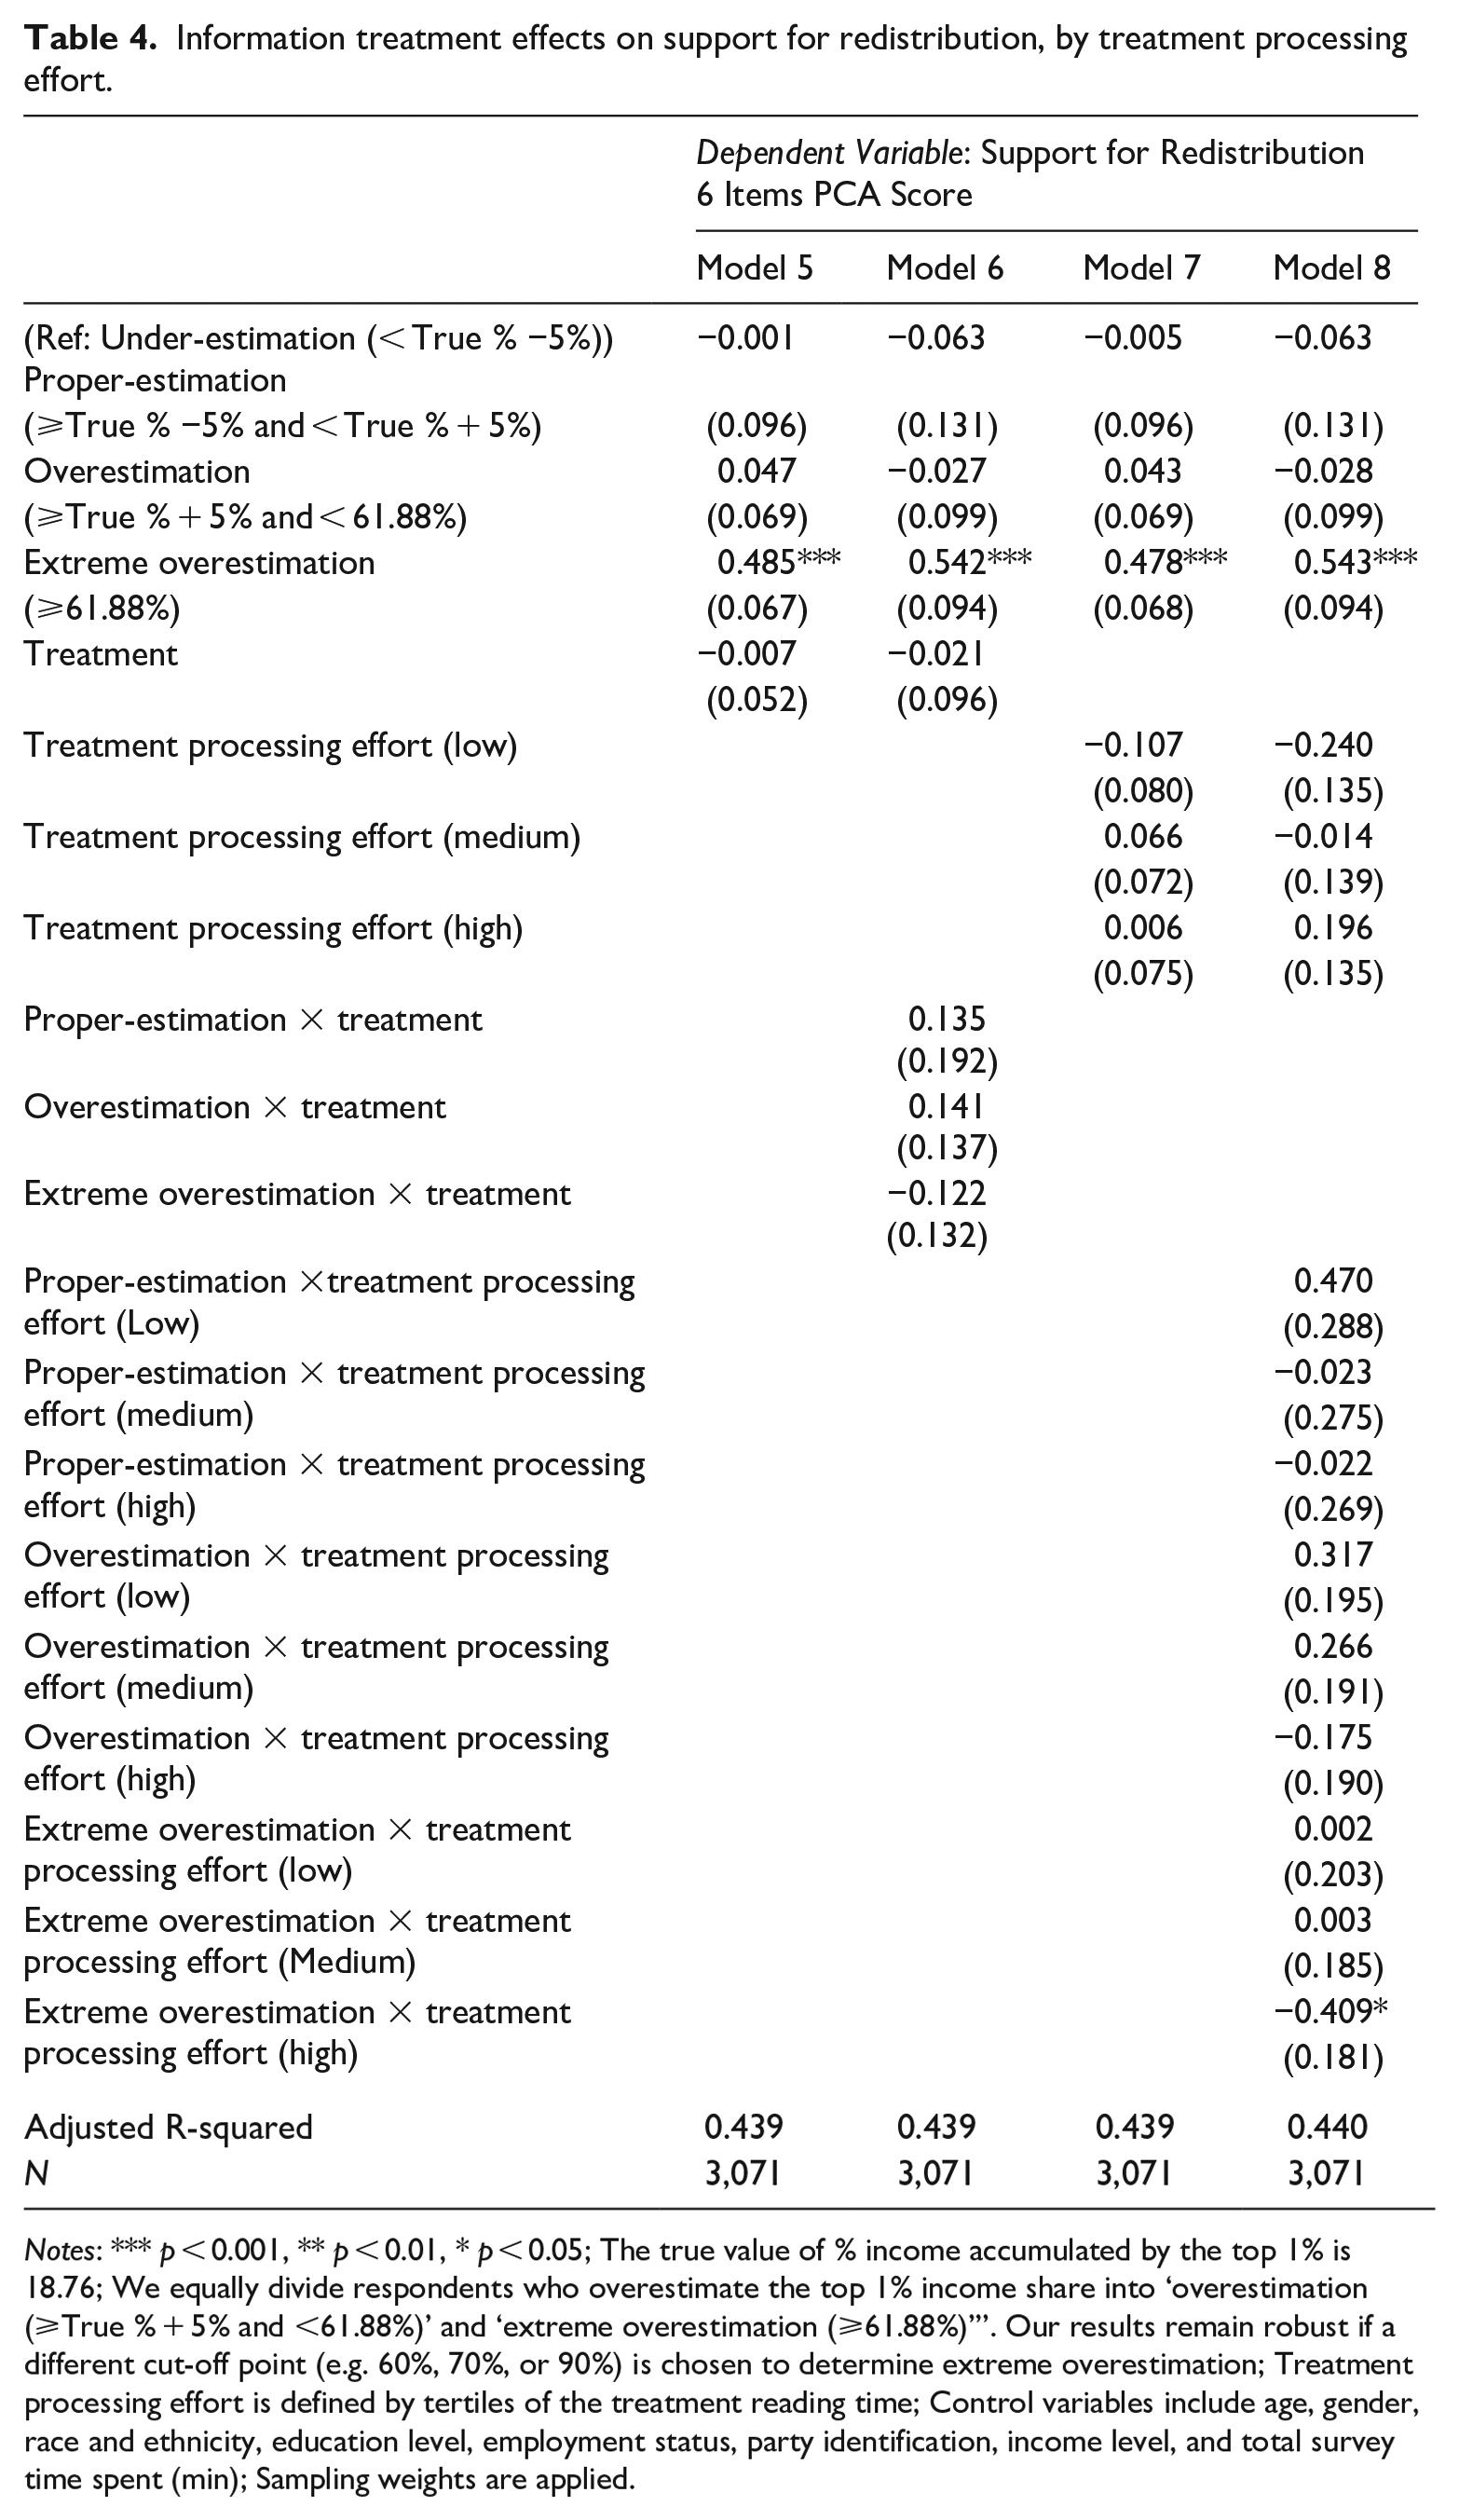
Notes: *** p < 0.001, ** p < 0.01, * p < 0.05; The true value of % income accumulated by the top 1% is 18.76; We equally divide respondents who overestimate the top 1% income share into ‘overestimation (⩾True % + 5% and <61.88%)’ and ‘extreme overestimation (⩾61.88%)’”. Our results remain robust if a different cut-off point (e.g. 60%, 70%, or 90%) is chosen to determine extreme overestimation; Treatment processing effort is defined by tertiles of the treatment reading time; Control variables include age, gender, race and ethnicity, education level, employment status, party identification, income level, and total survey time spent (min); Sampling weights are applied.
Despite the lack of a direct, main relationship between the treatment and the outcome, the treatment may still shape the effect of inequality perceptions on the outcome. As noted in the Hypotheses section, learning the effective level of income concentration at the top of the distribution may attenuate the association between perceptions of the level of inequality and preferences toward inequality reduction. To test this expectation, model 6 in Table 4 replicates model 5 including interaction terms between, on one hand, the dichotomous variable treatment and, on the other hand, three categories in the ordinal variable with the level of under/overestimation. In this model, none of the interaction terms are statistically significant. This additional evidence therefore indicates that the relationship between being a proper estimator, overestimator, and extreme overestimator and the demand for redistribution is not significantly different between control and treated participants, which is inconsistent with H3. On average, the treatment does not attenuate (or enhance) the higher support for redistribution of moderate or extreme overestimators.
The evidence stemming from multivariate models so far yields null associations between the information and the outcome. Is this because respondents disregarded the information and did not learn from it? To clarify this important aspect, we utilize the last item included in the questionnaire, which captures whether they acknowledge that they underestimated, proper estimated or overestimated the real value. Among all the objective overestimators, 81.0% of them acknowledge that they overestimated the real value. Among all the objective underestimators, 67.5% of them acknowledge that they underestimated the real value. Most respondents with inaccurate priors integrated the new evidence into their short-term memory and revised their prior, accepting the real value as a descriptive representation of reality.
Most respondents with biased priors therefore indicate that they learned the real value of income concentration in the TOP in contemporary America. However, the survey provides evidence that many respondents did not process the treatment information carefully. Indeed, on average, respondents only spent 19.3 seconds on the screen with the treatment (Figure 5). For many respondents who are not usually exposed to macro-economic information on inequality, this time span is probably too short to (1) link the new descriptive consideration to her or his normative beliefs on inequality and (2) draw implications for the latter. Given this possibility, in the Hypotheses section, we argued that the role of the treatment may be larger among participants who put in more of a processing effort than those who did not. To test this expectation, in the following analysis, we distinguish treated participants in three equal-size groups depending on their processing effort: low, intermediate, and high.
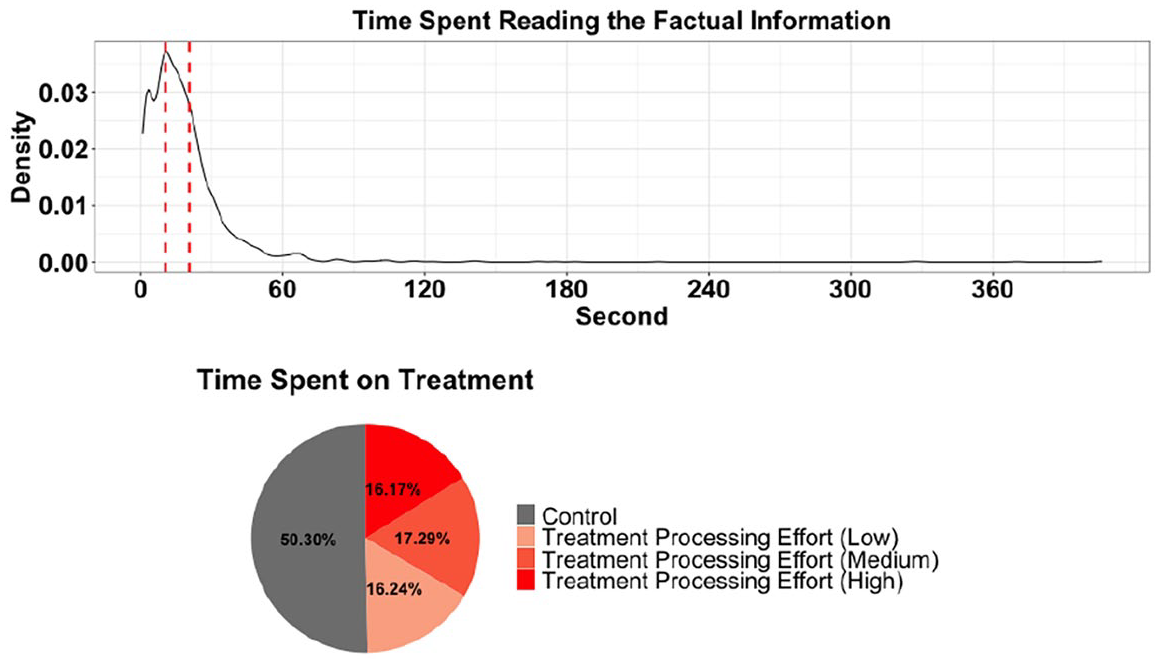
Time spent reading the factual information and treatment processing effort.
Models 7 and 8 (in Table 4) therefore substitute the dichotomous treatment variable with the dummies low processing effort, medium processing effort, and high processing effort. In model 7, the main effects of low processing effort, intermediate processing effort, and high processing effort are not statistically significant. The level of processing effort does not shape redistribution attitudes. However, the level of cognitive processing could shape the perceptions-preferences link. To test this possibility, model 8 includes interaction terms between the ordinal variable for the level of under/overestimation and the ordinal variable for cognitive processing. The evidence indicates that treated proper estimators, overestimators, and extreme overestimators who engaged in a low or medium effort do not differ significantly in their redistribution preferences from proper estimators, overestimators, and extreme overestimators in the control group. However, for extreme overestimators, having engaged in a high processing effort significantly reduces support for redistribution. In other words, in the case of extreme overestimators, having learned the real value of income concentration in the TOP and having paid close attention to that information is negatively related to support for redistribution. The effect is statistically significant and the effect size is substantial. For this group, a high processing effort is associated with a 21.44% of a standard deviation in support for redistribution. Since the influence of a high processing effort is restricted to extreme overestimators, the evidence is only partially consistent with H4. It is noteworthy that the group of overestimators who also engaged in a high processing effort is relatively small - 10.85% of all treated participants. For the remaining 89.15%, we cannot document a significant role of the information in redistribution attitudes.
The very restrictive significant information associations with the outcome may be due to the countervailing trends among certain social groups. Two potentially relevant dimensions in this regard are partisan identification and income level. We thus replicated model 8 but included three-way interactions between the guesstimate, level of cognitive engagement and partisanship (model A) and the guesstimate, level of cognitive engagement and income level (model B). The evidence indicates that the information preferences link is not significantly different in any particular partisan or income group, except among some Democrats who overestimate income concentration (See Supplemental Appendix Table A1).
Discussion
In light of the soaring income inequality in America, several recent studies assess whether the provision of information on objective inequality can alter attitudes toward redistribution. However, not all studies test net learning effects and none of them focus their attention on the influence of information on a central group in the mounting concentration of economic resources: the TOP. In this article, we fill an important void in this literature with the first analysis of the effects of information on this extremely privileged and politically meaningful group. We do so with an analytical strategy that prevents possible priming influences concerning this group. The analysis yields four main findings.
First, most Americans are poorly informed about the level of income concentration in the TOP. Indeed, 6 in 10 respondents substantially overestimate income concentration and 1 in 3 respondents underestimate it. While this finding is in line with previous work on general popular knowledge of inequality (Hauser and Norton, 2017) and the wealth concentration of top income groups (Eriksson and Simpson, 2012) in particular, to our knowledge it is the first to document the fact that Americans have a highly distorted view of income concentration at the very top of the income distribution. Future research could explore whether this extensive overestimation is simply the result of cognitive anchoring or inferences from normative discourses.
Second, these prior beliefs also prove to be an important determinant of redistribution attitudes. Extant research restricting the analysis to linear effects shows that indexes of perceptions of income inequality are positively related to redistribution attitudes (Gimpelson and Treisman, 2018; Kuhn, 2019). Our study instead indicates that this relationship is non-linear and concentrated on the effect of the most extreme (and in this case inaccurate) perceptions. Perceived concentration is positively related to the demand for redistribution mostly because extreme overestimators (providing a guesstimate ⩾ 62%) stand out in the preferences and display substantially higher support for inequality reduction than proper estimators.
Third, providing non-partisan, reliable information on income concentration does not have an average effect on redistribution attitudes and only has very limited local impacts. In our experiment, participants in both the control and treatment groups were asked to make a guesstimate and only treated participants were provided with the real value of income concentration. The evidence indicates that the treatment is ultimately unrelated to average attitudes. In other words, treated respondents do not display a significantly higher (or lower) average demand for redistribution than respondents who were not provided with the real value of income concentration. Moreover, contrary to our initial expectation based on other-regardingness models in political economy, being provided with the real value does not on average shape the impact of prior descriptive beliefs on the outcome. Specifically, for extreme overestimators – the group driving the association between prior perceptions and attitudes – being provided with the real value is not related to their average redistribution preferences.
How can we account for the lack of an average information-attitudes link? ‘The degree of attitude change generally observed in published research tends to be modest’ (Albarracin and Shavitt, 2018: 320) and prior work suggests many potential reasons for the lack of information effects (Ciani et al., 2021). People may fail to connect descriptive beliefs on inequality with their own political interests and policy action (Bartels, 2005). They may lack the motivation to process the new information (Petty and Briñol, 2020) or an emotional connection with potential beneficiaries of redistributive policies (Sands, 2017). They may not trust the government or consider that is capable of reducing inequality (Kuziemko et al., 2015). Or they may consent to inequality levels to avoid the distress caused by dissatisfaction with the status quo (Trump, 2018).
Contextual conditions may also help explain this lack of information effects. The United States is undergoing a particular increase in affective polarization and the presence of strong and antagonistic political identities may be especially conducive to partisan-motivated reasoning (Bolsen et al., 2014; Garzia et al., 2023). Moreover, in part due to the Occupy Wall Street movement, public discussion of income concentration in the TOP has been particularly intense in the United States (Keister, 2014), making descriptive information on this group more widely available. The combination of these two factors complicates the cognitive impact caused by the treatment. In countries with low affective polarization that have not experienced movements against top income groups, the treatment may have a stronger influence on attitudes.
Fourth, to advance the literature, in our analysis, we explored an additional potential factor that has been under-analyzed in the literature: the possibility that people do not engage in sufficient cognitive effort to link descriptive and prescriptive beliefs on inequality. The evidence partially supports this mechanism. Among extreme overestimators, those who engaged in a low and medium treatment processing effort do not differ in their attitudes from overestimators in the control groups. However, extreme overestimators in the treatment group who engaged in an intense processing effort of the treatment display significantly lower demand for redistribution than extreme overestimators in the control group. The group of extreme overestimators may be made up of individuals who lack knowledge of the income distribution but also of individuals who are extremely concerned about inequality. Consistent with their previous concerns, the latter group spends more time processing the information and adjusts their preferences accordingly.
These findings have two relevant implications. First, they raise concerns over previous US-based research arguing or documenting information effects. Using split-sample experimental designs, Kuziemko et al. (2015) and McCall et al. (2017) point out that information on the income inequality level is related to Americans’ attitudes toward redistribution. However, these two key studies do not make control group participants aware that their study concerns economic inequality, meaning that differences in attitudes between the control and treatment groups may be caused by the latter group learning new information and/or being primed with information they already knew. By collecting guesstimates of income concentration from participants in both the control and treatment groups, our study instead neutralizes the influence of priming on the average information effect. It also allows us to assess the information-attitudes link restricted to overestimators and underestimators. The evidence of our study is clearly inconsistent with learning-based attitude revision among either of these two groups, as providing information does not significantly shape the effect of prior descriptive beliefs on preferences.
Second, even if this study reports average null findings, it suggests one factor that may facilitate information-based attitude formation. Engaging in intense cognitive effort in the treatment is associated with the attitudes of the group with the most inaccurate and extreme priors of the level of income concentration. Future work could thus continue exploring ways to stimulate high cognitive elaboration as a way of encouraging the revision of prescriptive beliefs based on updated descriptive information.
Our study is not devoid of limitations. To maximize the statistical power of the statistical test and prevent conflation of the role of different pieces of information, we restricted data collection to only one treatment and one piece of information on income concentration. However, other pieces of information may prove more salient for the public (e.g. trends in income concentration in the TOP or the average income of the TOP). Moreover, our study did not collect the qualitative reactions to the treatment, which could have suggested how easily and rapidly individuals link information on the level of inequality to their prescriptive beliefs about redistribution and inequality. Until research addressing those aspects is conducted, this article advances the literature by showing that providing reliable information on income concentration is only significantly associated with the redistribution preferences of citizens who perceive extreme income concentration and process new information very carefully.
Supplemental Material
sj-docx-1-iss-10.1177_02685809241262715 – Supplemental material for Information on income concentration and redistribution preferences: The case of the top 1% in the United States
Supplemental material, sj-docx-1-iss-10.1177_02685809241262715 for Information on income concentration and redistribution preferences: The case of the top 1% in the United States by Juan J Fernández, Antonio M Jaime-Castillo and Fangqi Wen in International Sociology
Footnotes
Declaration of conflicting interests
The authors declared no potential conflicts of interest with respect to the research, authorship, and/or publication of this article.
Funding
The author(s) disclosed receipt of the following financial support for the research, authorship, and/or publication of this article: This project has been funded by the Spanish Ministry of Science, Innovation and Universities (RTI2018-098781-B-I00).
Supplemental material
Supplemental material for this article is available online.
Notes
Author biographies
References
Supplementary Material
Please find the following supplemental material available below.
For Open Access articles published under a Creative Commons License, all supplemental material carries the same license as the article it is associated with.
For non-Open Access articles published, all supplemental material carries a non-exclusive license, and permission requests for re-use of supplemental material or any part of supplemental material shall be sent directly to the copyright owner as specified in the copyright notice associated with the article.