
Abstract
Indices of multiple deprivation have become increasingly sophisticated and high profile as a means of identifying and targeting deprived areas and populations. However, these have been challenged on a number of grounds, both conceptual and practical, with particular concerns about their applicability to rural areas. At the same time, there is little research on how such measures are used in practice or how they influence policies or the allocation of resources. This paper seeks to quantify the effectiveness of this type of measure in terms of inclusion or exclusion of deprived populations implied by targeting areas based on the results of the Scottish Index of Multiple Deprivation. The results show that the proportion of deprived individuals within these apparently most deprived areas varies widely across different regions. However, this was not strongly related to rurality, suggesting that claims of an inherent bias against rural regions resulting from the use of these measures should be treated with caution. Nevertheless, this analysis demonstrates potential drawbacks to the uncritical reliance on indices of multiple deprivation as a basis for policy and highlights the need for the aims and rationales of such approaches to be more clearly articulated.
Introduction
Issues of poverty, deprivation and inequality have received renewed attention in recent years, in the light of depressed wage growth (Cribb et al., 2017), growing precarity in the labour market (Bramley and Bailey, 2017) and the impacts of policies driven by the pursuit of austerity (Hood and Waters, 2017). In the context of increasing demand for ‘evidence-based’ policy (Nutley and Webb, 2000), attempts to address or mitigate the effects of disadvantage have been informed by increasingly complex and comprehensive indices of multiple deprivation (IMDs) that combine indicators on a range of dimensions of deprivation to classify neighbourhoods or localities. On this basis, particular areas (or the people who live in them) can be identified and interventions or additional resources targeted. Such targeting can, however, be considered problematic on a number of grounds, with particular concerns that the construction of such indices, and indeed the application of any area-based measure, may under-represent the experience of rural deprivation.
This article aims to quantify the limitations of area-based measures as a tool for informing policies seeking to target deprivation, with a particular focus on the extent to which interventions made on this basis will include or exclude deprived individuals or households. This is derived from a secondary data analysis of the 2016 Scottish Index of Multiple Deprivation (SIMD) across Scotland’s 32 local authority areas, and in particular builds on previous work undertaken on the measurement of deprivation in Dumfries and Galloway, in south west Scotland (Hill and Clelland, 2015). The Scottish context provides a useful setting for research in this area given the range of spatially targeted interventions across different levels of government, its high profile and well-developed IMD and the diversity of urban and rural areas across which deprivation is distributed.
The paper proceeds as follows. Firstly, the background and principles behind the area-based IMD approach are briefly set out, illustrated by the example of its Scottish variant, and some of the relevant debates around potential limitations and shortcomings of this type of deprivation measure are summarised, with a particular focus on the perceived suitability of this approach to rural areas. The results of the data analysis are then presented, with the introduction of an approach to quantifying the problem of ‘inclusion’ or ‘exclusion’ of deprived individuals associated with area-based measures, and an exploration of the variations in this between urban and rural areas. These findings are then discussed in the context of different approaches taken to the targeting of deprivation interventions in Scotland and to the use of the SIMD as evidence to support these. The concluding section moves to consider the implications of the results and contribute to debates around the measurement of deprivation in rural areas and its policy implications. Specifically, this aims to provide a corrective to, on the one hand, the uncritical adoption of area-based deprivation indices as an appropriate tool for targeting or measurement, and on the other, a perception that these are inherently ‘biased’ against or less suitable for rural areas.
Area-based measures of deprivation – Principles and limitations
Although there is a longer history of indirect indicators of deprivation based on Census data (e.g. Carstairs and Morris, 1989), current measures have their roots in the IMD initially developed for England in the 1990s (Noble et al., 2000). Informed by Townsend’s (1979) concept of multiple deprivation, these involve the calculation of a composite indicator based on a number of ‘domains’ representing the different types of deprivation experienced by individuals. Each of these broad dimensions is then ‘measured independently with the best indicators available’ (Noble et al., 2006: 173), with the resulting domain scores then combined (often via weightings) into a single overall measure. This represents an area-based, rather than individual-based, measure, in that index scores are calculated for small areas. This approach has been adopted across a range of territories, including Wales (Welsh Government, 2015), Northern Ireland (Northern Ireland Statistics and Research Agency, 2010), New Zealand (Salmond and Crampton, 2012) and South Africa (Noble et al., 2010). These indices have become progressively more complex, drawing on a greater range of component indicators for smaller geographical units of measurement as new data sources have become available.
In Scotland, the SIMD is the ‘official tool for identifying those places in Scotland suffering from deprivation’ (Scottish Government, 2012: 2). Since its initial development (Social Disadvantage Research Centre, 2003), heavily influenced by the early English IMDs that emerged in the 1990s, several iterations have been produced, growing in sophistication as new data sources become available. The current SIMD, released in 2016, is based on seven ‘domains’, with a score calculated for each from a variety of indicators, with the overall SIMD score a weighted sum of these domains (Figure 1). Scores are calculated for datazones, the basic unit of statistical geographies in Scotland, and roughly equivalent to Lower Super Output Areas in England and Wales. These are intended to be of similar population size, each containing between 500 and 1000 households (Scottish Executive, 2005), but range from small neighbourhoods in urban settings to large areas where population density is low.
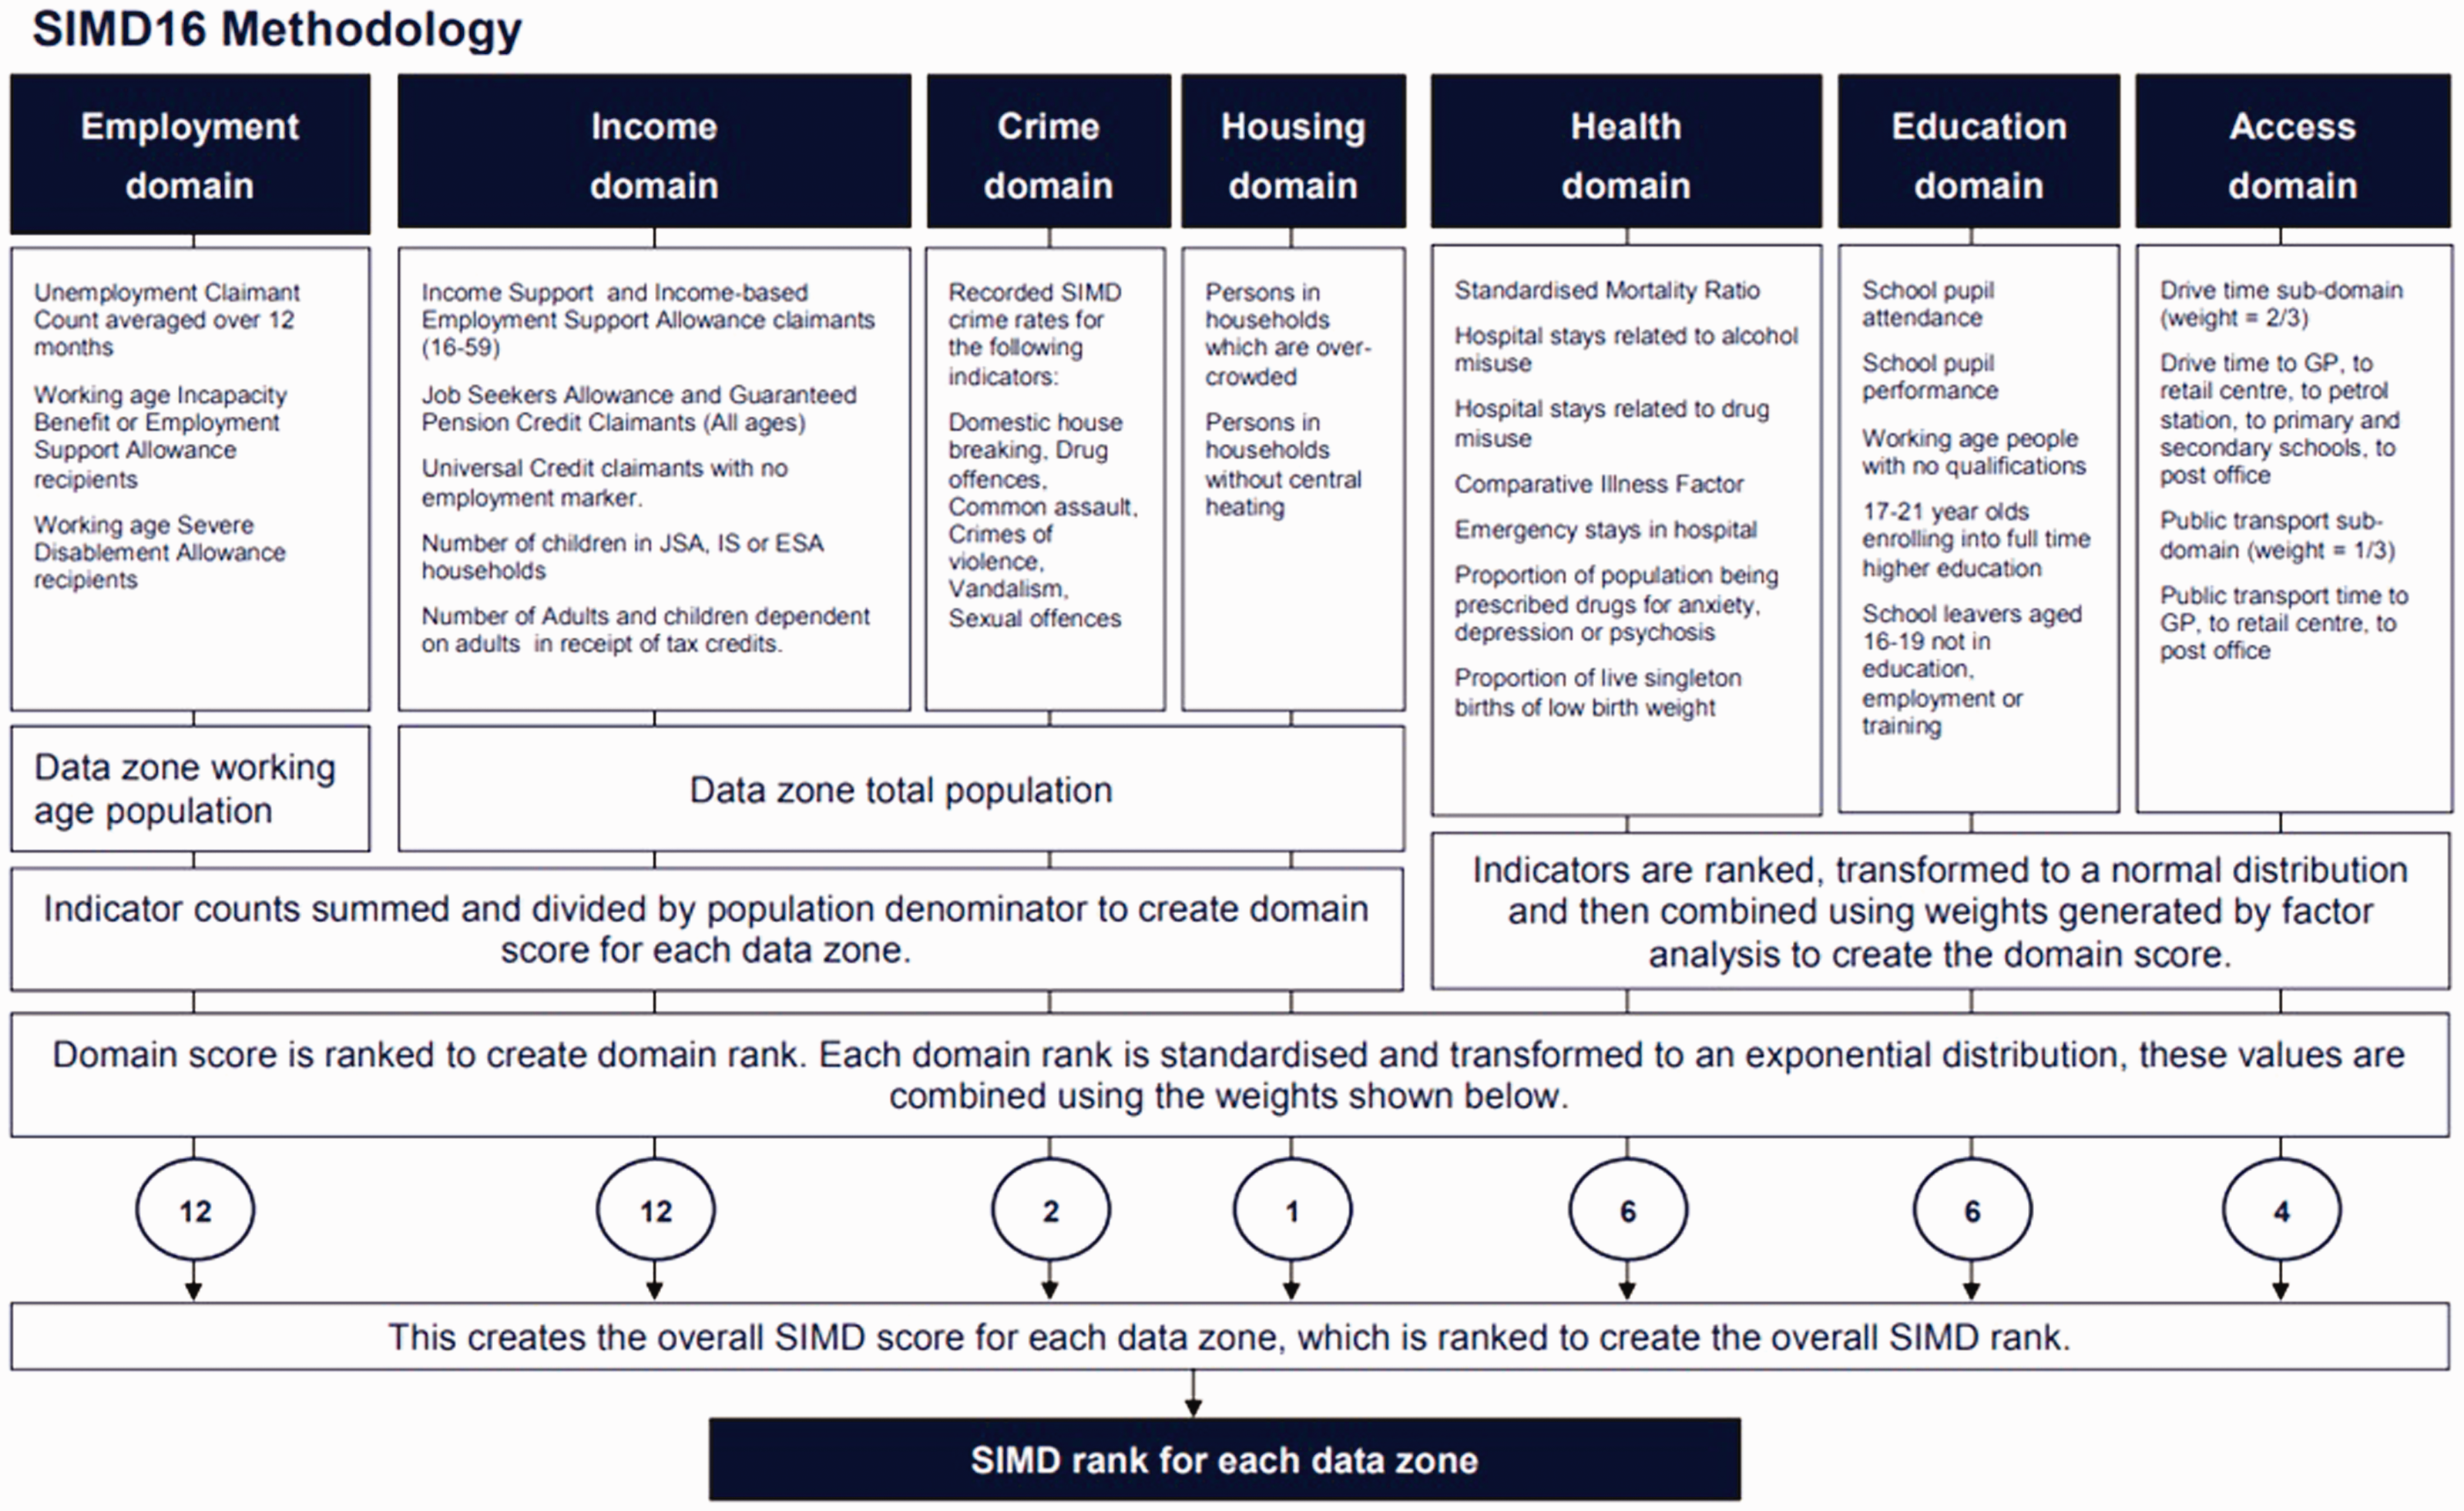
The Scottish Index of Multiple Deprivation.
From the point of view of public agencies, a benefit of this approach is that as it produces a single deprivation score for each area. As these can be ranked nationally, this provides a basis for the identification of the apparently ‘most deprived’ areas at national and local levels, and as such has proved appealing to governments as a tool to inform the targeting of expenditure (Greig et al., 2010). This can be seen in the context of a more general trend towards ‘evidence-based policy making’ (Sanderson, 2011) in which the use of indicators plays a prominent role. The measurement of ‘multiple’ deprivation can also be seen as an advantage over simpler indicators of low income, given the evidence that different aspects of deprivation are inter-related (Mair et al., 2011). The growing popularity of IMDs has, however, stimulated a variety of critiques. While by no means an exhaustive discussion of this work, the main criticisms and limitations of IMDs can be categorised under three broad headings.
Firstly, notwithstanding the claims of Noble et al. (2006: 172) of a ‘clear theoretical framework’ for their model, the construction of any index will require a series of decisions to be made about what indicators should be included. Pacione (2004: 380) notes the ‘absence of any general theory to support such a process’. As a result, while grounded in the broad concept of multiple deprivation, the choice of indicators can be seen as chiefly pragmatic (Gordon, 2003), subject to value judgements and the existence of reliable data sources at the desired geographical level. Similarly, the weighting of individual indicators and domains in the calculation of overall index scores has been criticised as essentially arbitrary (Chalmers, 2000), representing ‘a somewhat crude facet of an otherwise commendably sophisticated and elaborate attempt to quantify levels of deprivation’ (Deas et al., 2003: 890). The subjectivity and therefore contestability of the choice and weighting of index components can leave the chosen methodology, and therefore the validity of results and appropriateness of policy decisions open to challenge.
In the Scottish context, a persistent criticism of the SIMD (Skerrat and Woolvin, 2014) has been that the ‘access’ domain receives insufficient weighting – representing as it does, according to McKendrick et al. (2011: 9) ‘the underpinning issue in rural areas’ (original italics) – and fails to capture factors such as the frequency and cost of public transport. Conversely, it has been argued that merely by including indicators of access, more relevant to rural areas (Robson et al., 2001), and by failing to include indicators related to poor physical environment, such as derelict land and air quality (Deas et al., 2003), current approaches risk underestimating the extent of inner city deprivation. This points to the fundamental question of whether a single index of deprivation can legitimately be applied to both rural and urban areas (Bertin et al., 2014); if the qualitative experiences of deprivation in each are significantly different, coming to a judgement about the domains and indicators equally applicable to both becomes difficult.
Secondly, a more general limitation of area-based measures is that such an approach risks missing out a significant number of people who experience deprivation but do not live in ‘deprived’ areas (Holterman, 1975; Tunstall and Lupton, 2003). This is particularly seen as an issue for rural areas, because of the more widely dispersed nature of deprivation in comparison with urban areas (McKendrick et al., 2011) and because the IMD approach ‘fails to highlight or give much weight to deprivation which is not geographically concentrated’ (Bramley, 2005). Therefore, it is argued, rural areas are inherently less likely to feature amongst those ranked as most deprived. Furthermore, the geographies used in the construction of the index may exacerbate this issue; Bramley (2005) notes in relation to the Scottish context a tendency for ‘urban datazones to be more homogeneous, and hence more polarised in the socio-economic characteristics, than rural zones’. On this basis, any focus on the ‘most deprived’ areas might be less effective in capturing deprivation in rural areas. This echoes a range of research that identifies ‘hidden’ poverty and exclusion in apparently relatively affluent rural places (Shucksmith, 2003).
Thirdly, there are a number of potential problems that can arise from the way in which results are interpreted or used. In particular, there is a risk of ‘reification’ (Carr-Hill and Chalmers-Dixon, 2005; Salmond and Crampton, 2012) where IMD scores or ranks are treated by users as synonymous with deprivation, whereas in reality they are only proxy or partial measures. There is also a danger that the boundaries of small areas, often highlighted to identify those that are ‘most deprived’, can ‘suggest rigid dividing lines that will be fuzzy in reality’ (Salmond and Crampton, 2012: 510), and that an over-reliance on a single index score can conceal complexities, particularly in how areas change over time (Hincks, 2015). This links to longstanding concerns (e.g. Smith, 1995) of the potential unintended consequences of too much emphasis being placed on particular indicators.
The construction of these indices – while clearly influencing the results – is largely a matter of value judgements (on the relative importance of different types of deprivation) and data availability. The remainder of this paper therefore focuses on the second and third of these issues, themselves closely linked. The following section seeks to quantify the implied inclusion and exclusion of deprived individuals that would follow from area-based policy or resource targeting, through an analysis of datazone-level SIMD results. An attempt is made to trace the likely implications of this, with reference to some examples of how the SIMD is used in practice to inform policy.
Data analysis – Area and individual deprivation in Scotland
As already described, the SIMD provides the basis for ranking each of Scotland’s 6976 datazones and further classifying them into quintiles, with the 20% nationally highest ranked datazones commonly used as a shorthand for the ‘most deprived’ areas. These are distributed highly unevenly across local authorities, with nearly half of all datazones in Glasgow, but none in the three island regions, falling in this category (Figure 2). In contrast, regional variation in the proportion of individuals experiencing income deprivation is much lower. This measure forms the basis of the ‘income’ domain that constitutes a significant proportion of the overall SIMD score (Figure 1). As this is derived from administrative data on numbers of adults and their dependants in receipt of certain key benefits, there has been some suggestion (e.g. Shucksmith et al., 1996) that a lower rate of benefit uptake in rural areas might result in this method underestimating levels of rural low income, although Bailey et al. (2016) find no evidence for this.
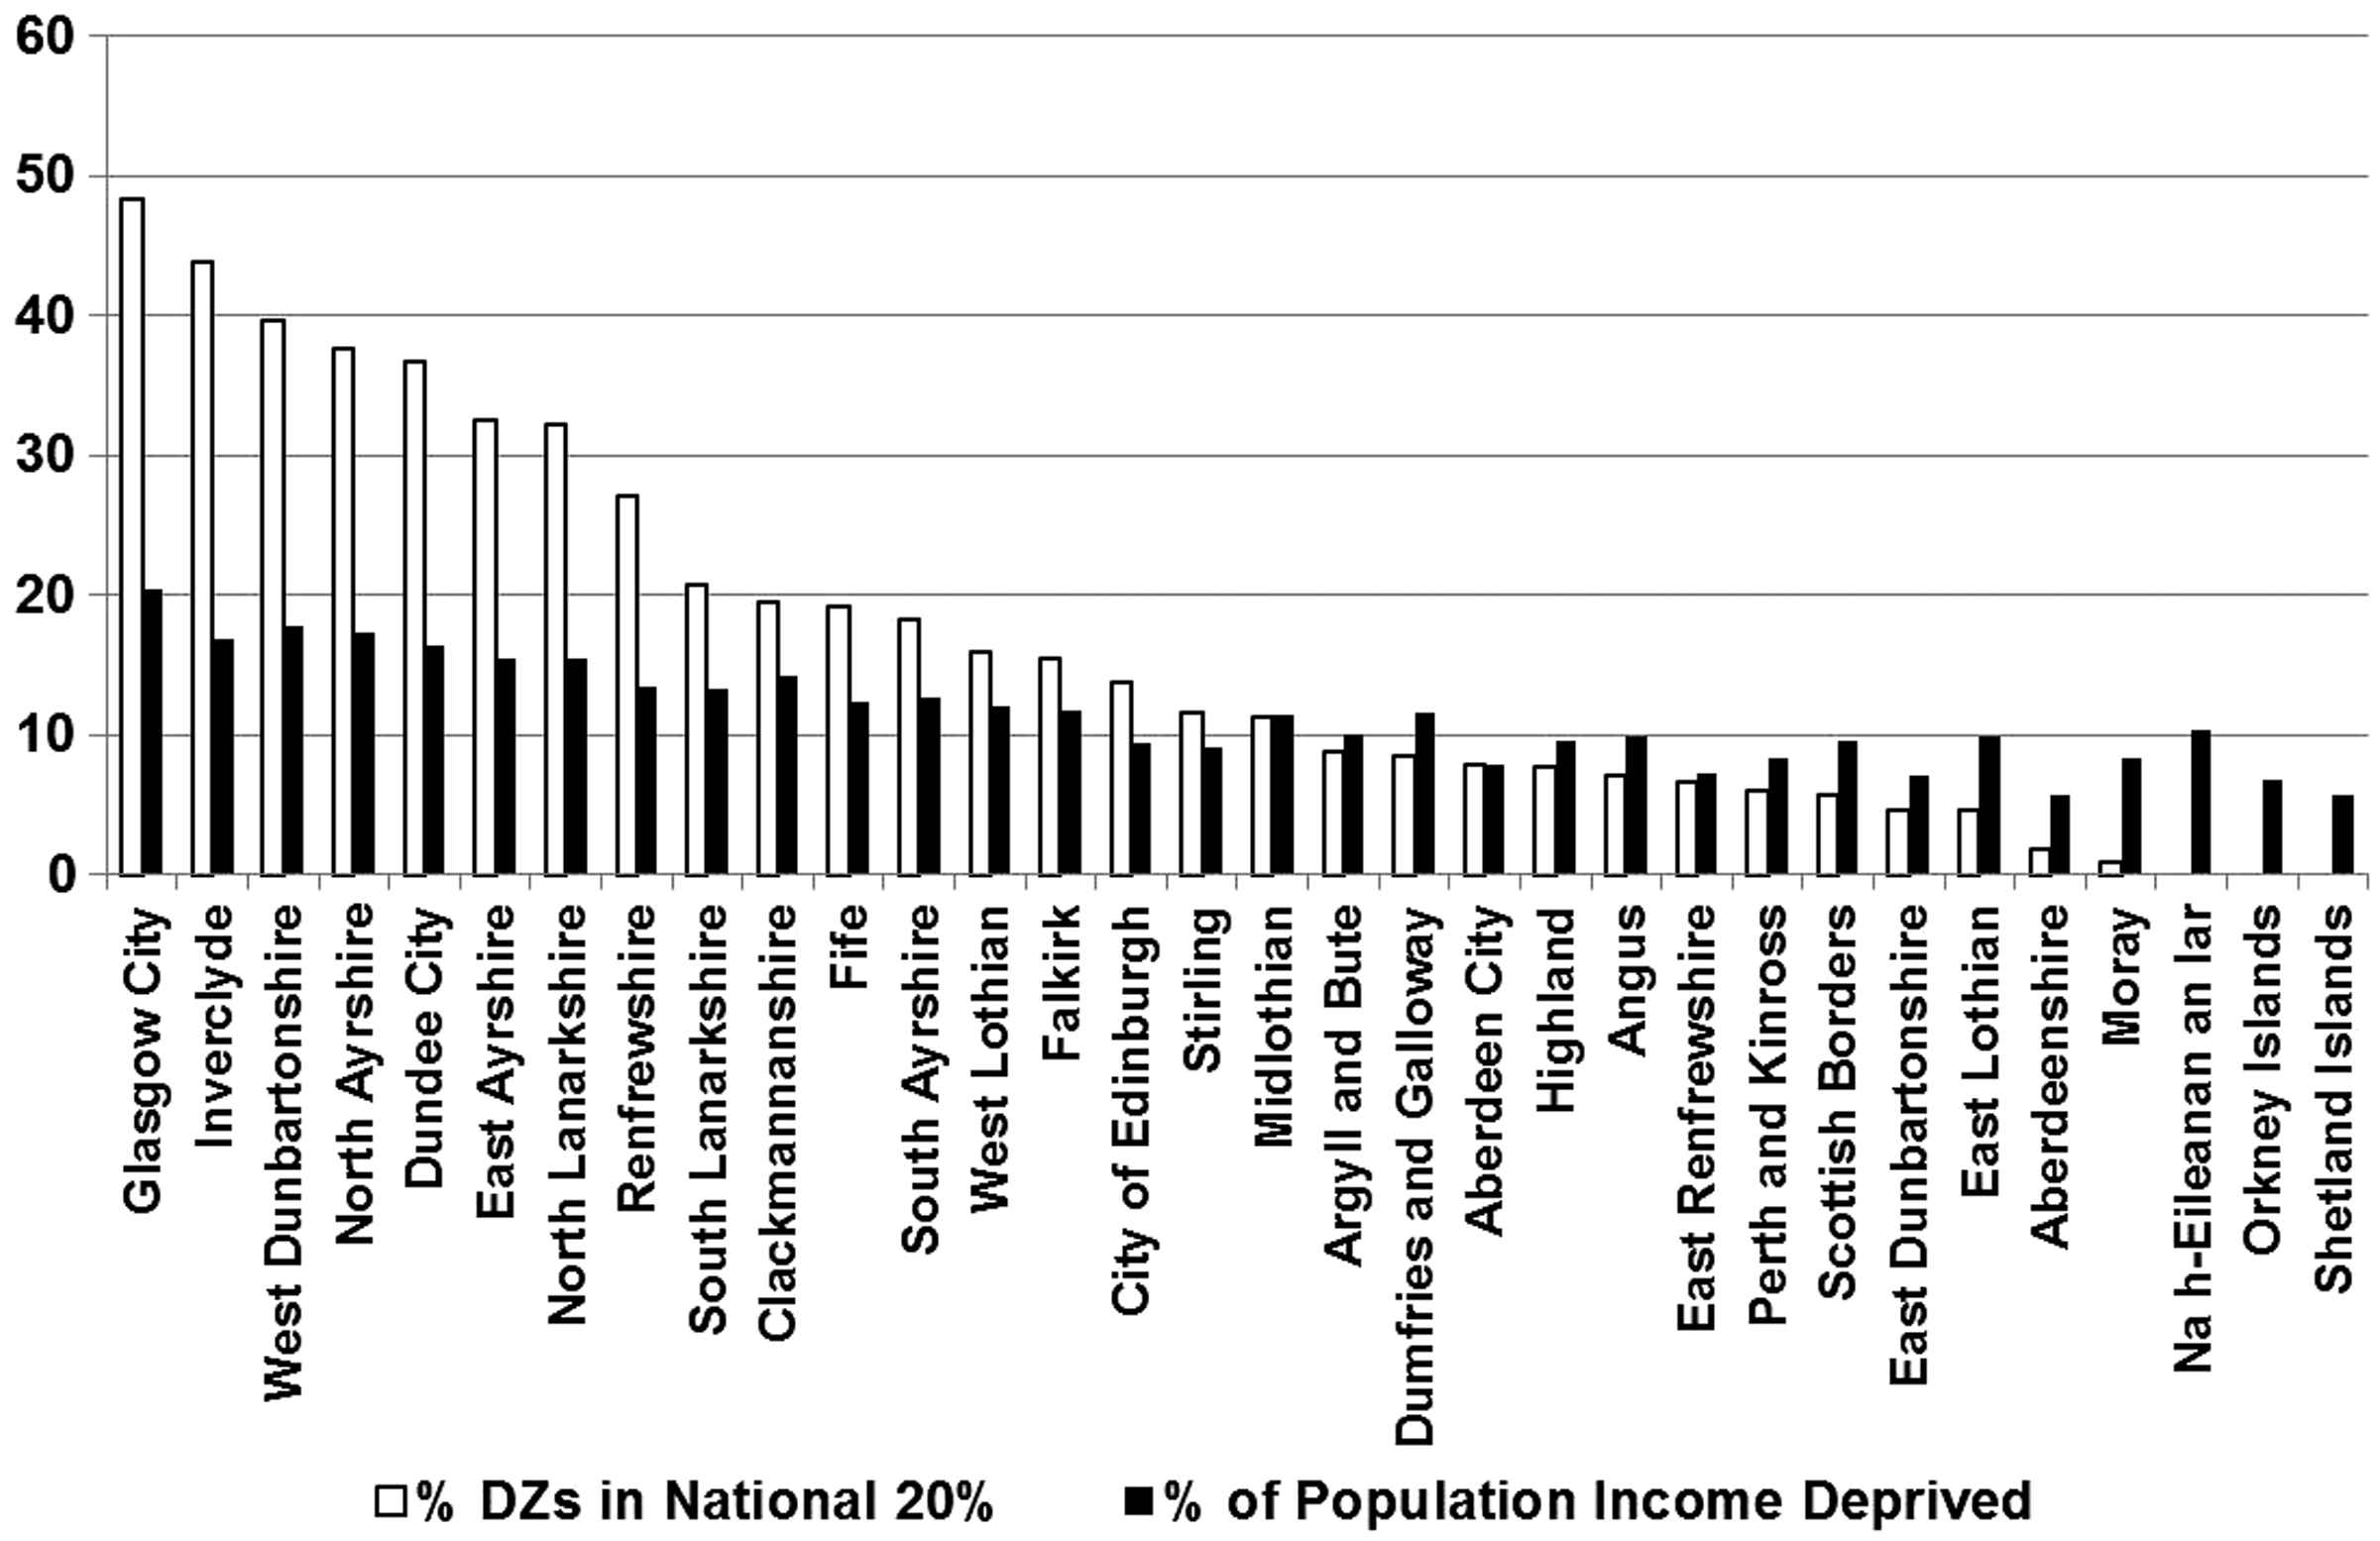
Percent of datazones in national quintile, % of individuals in income deprivation.
This illustrates the potential problem noted in the preceding section and recognised in the official guidance to users of the SIMD – that ‘not everyone living in a deprived area is deprived, and not all deprived people live in deprived areas’ (Scottish Government, 2016a). Any national distribution of resources based on the concentration of the nationally most deprived areas would therefore favour those local authorities to the left of the chart in Figure 2. Notably, the majority of these – particularly Glasgow and Dundee – are largely urban regions. In contrast, those at the far right – e.g. Moray, Aberdeenshire and the islands – are more rural and have no or very few areas considered deprived in national terms, but nevertheless do have significant (if lower than average) proportions of the population in income deprivation.
Dumfries and Galloway presents a useful context to examine these issues at a more detailed level, having a relatively low average population density and nearly half of its population of just over 150,000 in areas identified as ‘accessible’ or ‘remote’ rural areas, based on the Scottish Government’s (2014) Urban/Rural Classification. Dumfries is the region’s largest town and administrative centre (population 32,914) with the only other area classified as ‘urban’ being Stranraer (population 10,593) in the far west of the area. Of the 201 datazones in Dumfries and Galloway, only 17 (8%) are in the national ‘most deprived’ quintile based on the results of the 2016 SIMD (Figure 3), concentrated in the two largest towns, but also the small town of Kirkconnel in the north, a former mining area, and Annan in the south-east. Extending this to the ‘local’ quintile (i.e. the 20% highest ranked datazones in Dumfries and Galloway) leads to the inclusion of more areas in and around these towns and further parts of rural Galloway in the west. Any spatial targeting of local authority policies or resources on this basis would therefore be largely confined to a few parts of the region, mostly in and around the largest settlements.
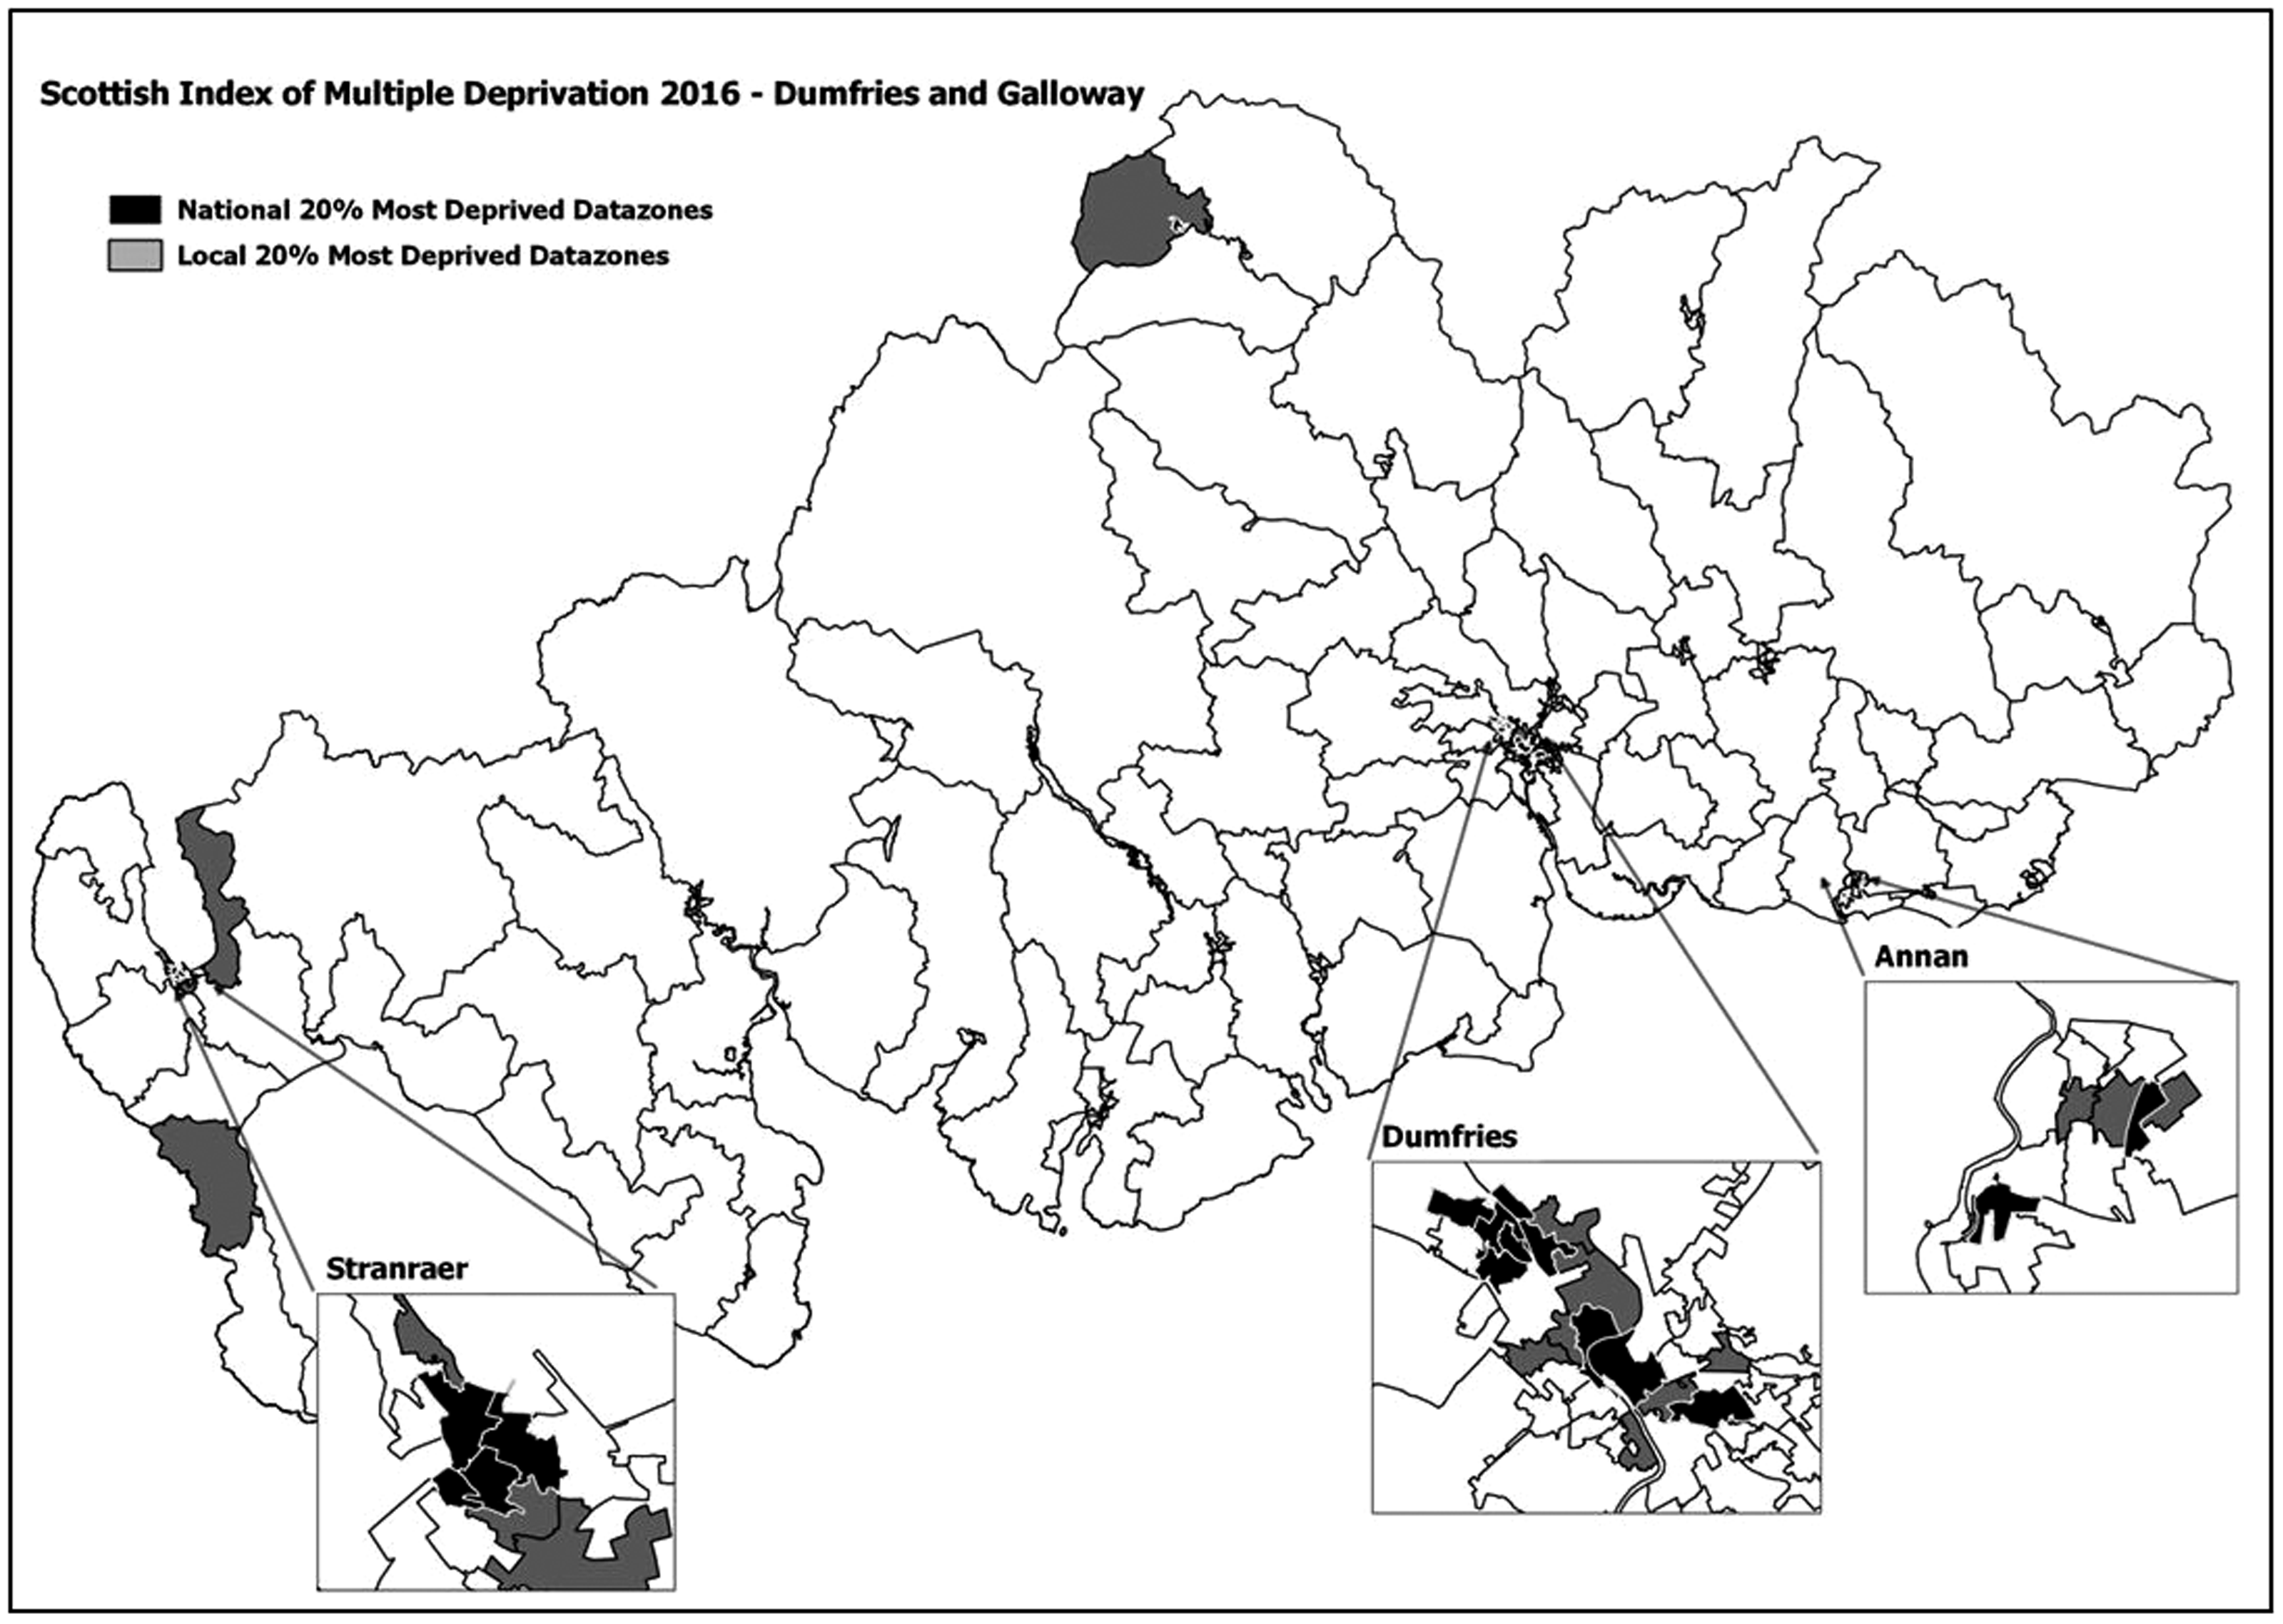
Most deprived datazones in Dumfries and Galloway, SIMD (2016).
One factor that is likely to be of interest to policymakers is the effectiveness of such a spatially targeted approach in capturing the region’s deprived population. Given that all areas will contain both deprived and non-deprived residents – with pockets of sometimes severe deprivation in even the most apparently affluent places (Milbourne, 2004) – this will only ever be partial. This can be quantified by measuring the proportion of individuals that can be considered as ‘deprived’ (based on the income deprivation measure as above) living in the areas that are identified as the most deprived (following Tunstall and Lupton, 2003). On the basis of figures used to calculate the 2016 SIMD, there are 17,365 income deprived individuals in Dumfries and Galloway, only 6600 of whom live in the region’s 20% most deprived datazones (those highlighted in Figure 3). These datazones therefore capture only 38% of the region’s income deprived people. This points to a relatively low level of spatial concentration, and any intervention that targets these areas will therefore exclude many more of this group than it will include.
Applying this analysis to each of Scotland’s 32 local authority areas (Figure 4), the proportion of all income deprived residents living in each local authority’s most deprived quintile of datazones ranges from 26% in Moray to over 50% in East Dunbartonshire, East Renfrewshire and Edinburgh. This implies a relatively even distribution of income deprived people across Moray, and on this basis the spatial targeting of deprivation-related interventions could not be justified as a means of effectively reaching this group. In the latter regions, income deprived people are more concentrated.
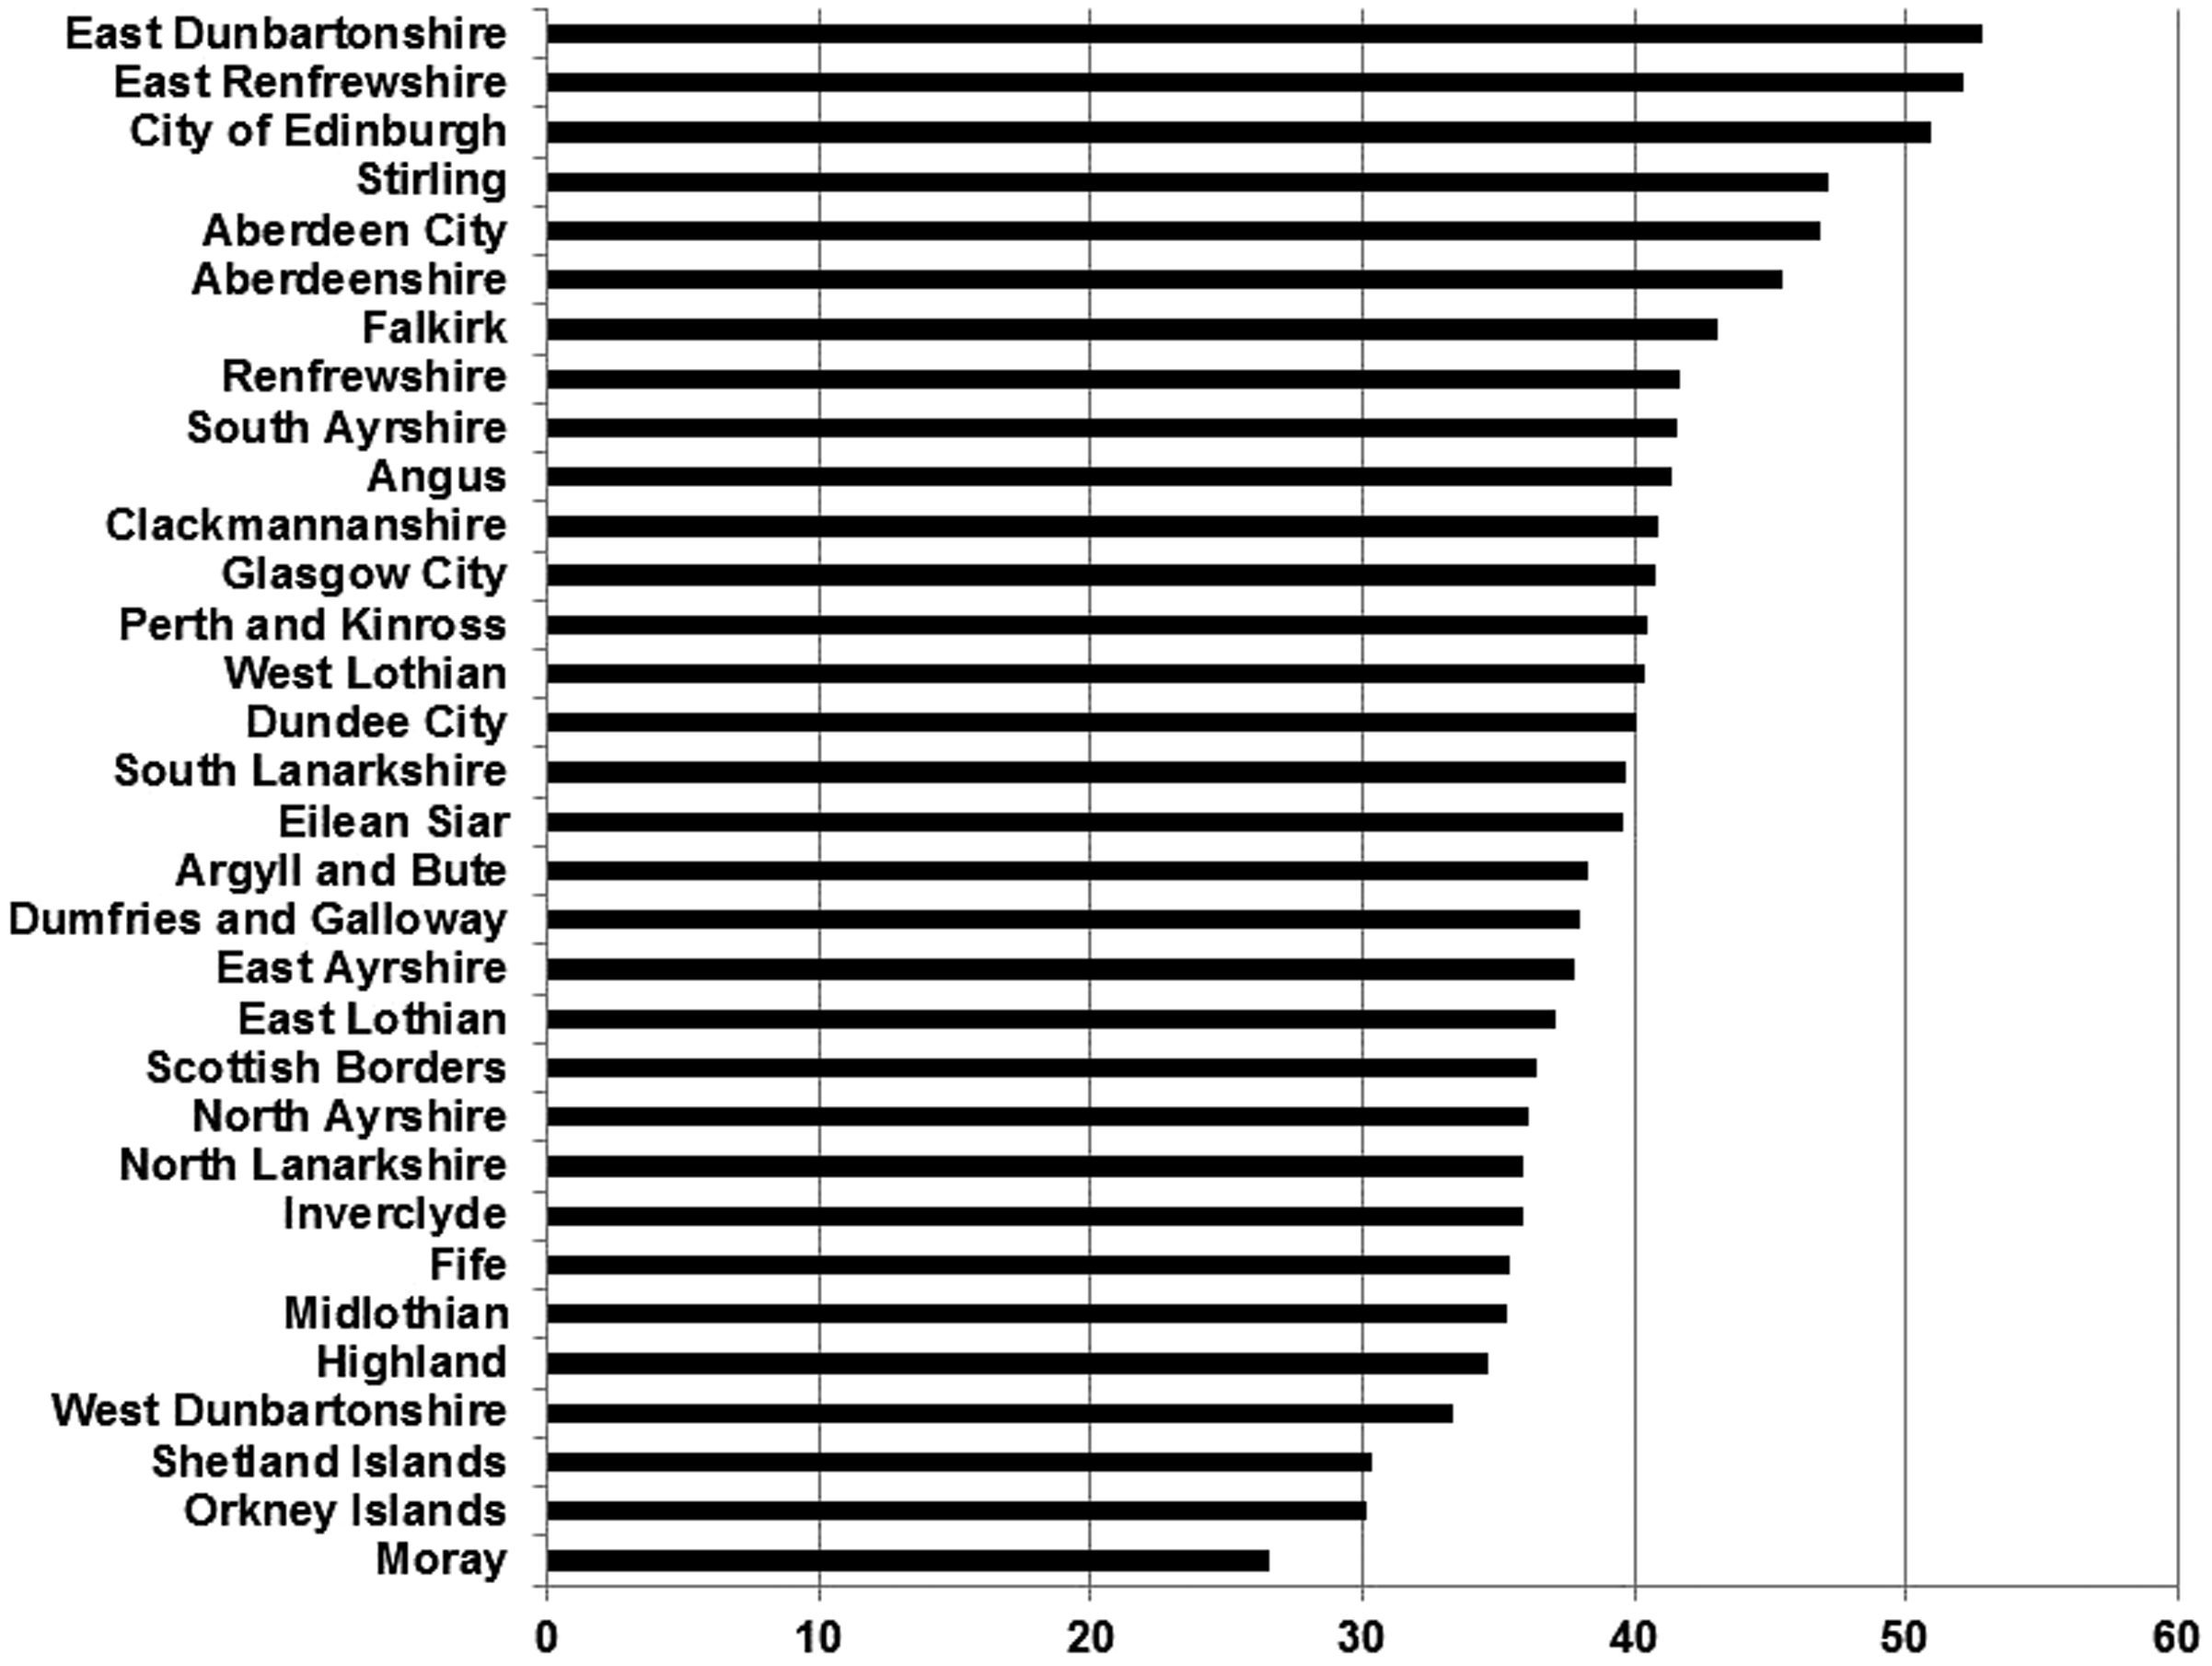
Percent of all income deprived people resident in most deprived datazones (local quintile), Scottish local authority areas.
One of the most common perceived weaknesses of the SIMD is that it is unsuited to representing rural deprivation because of the more dispersed nature of people and communities (Bramley, 2005; McKendrick et al., 2011; Skerrat and Woolvin, 2014). Conversely, given the evidence that poverty tends to be more spatially concentrated in urban areas (Bailey et al., 2016), it could be expected that targeting on a ‘most deprived area’ basis will be more effective in these terms in cities and less effective where more people live in rural areas. This can be explored through the relationship between the proportion of deprived people living in the most deprived areas (from Figure 4) and the rurality of each region, as measured by the proportion of the population living in rural datazones based on the Scottish Government’s Urban–Rural Classification.
While this demonstrates (Figure 5) that those regions with the highest concentrations of deprived people in their most deprived areas are strongly urban in character, in general this comparison does not reveal any strong relationship between this proportion and degree of rurality. Amongst the most urban regions (those with fewer than 5% of residents in rural datazones), the proportion of all income deprived people living in the local most deprived quintile area ranges from 33% to 52%; amongst the predominantly rural regions, this ranges from 26% to 45%.
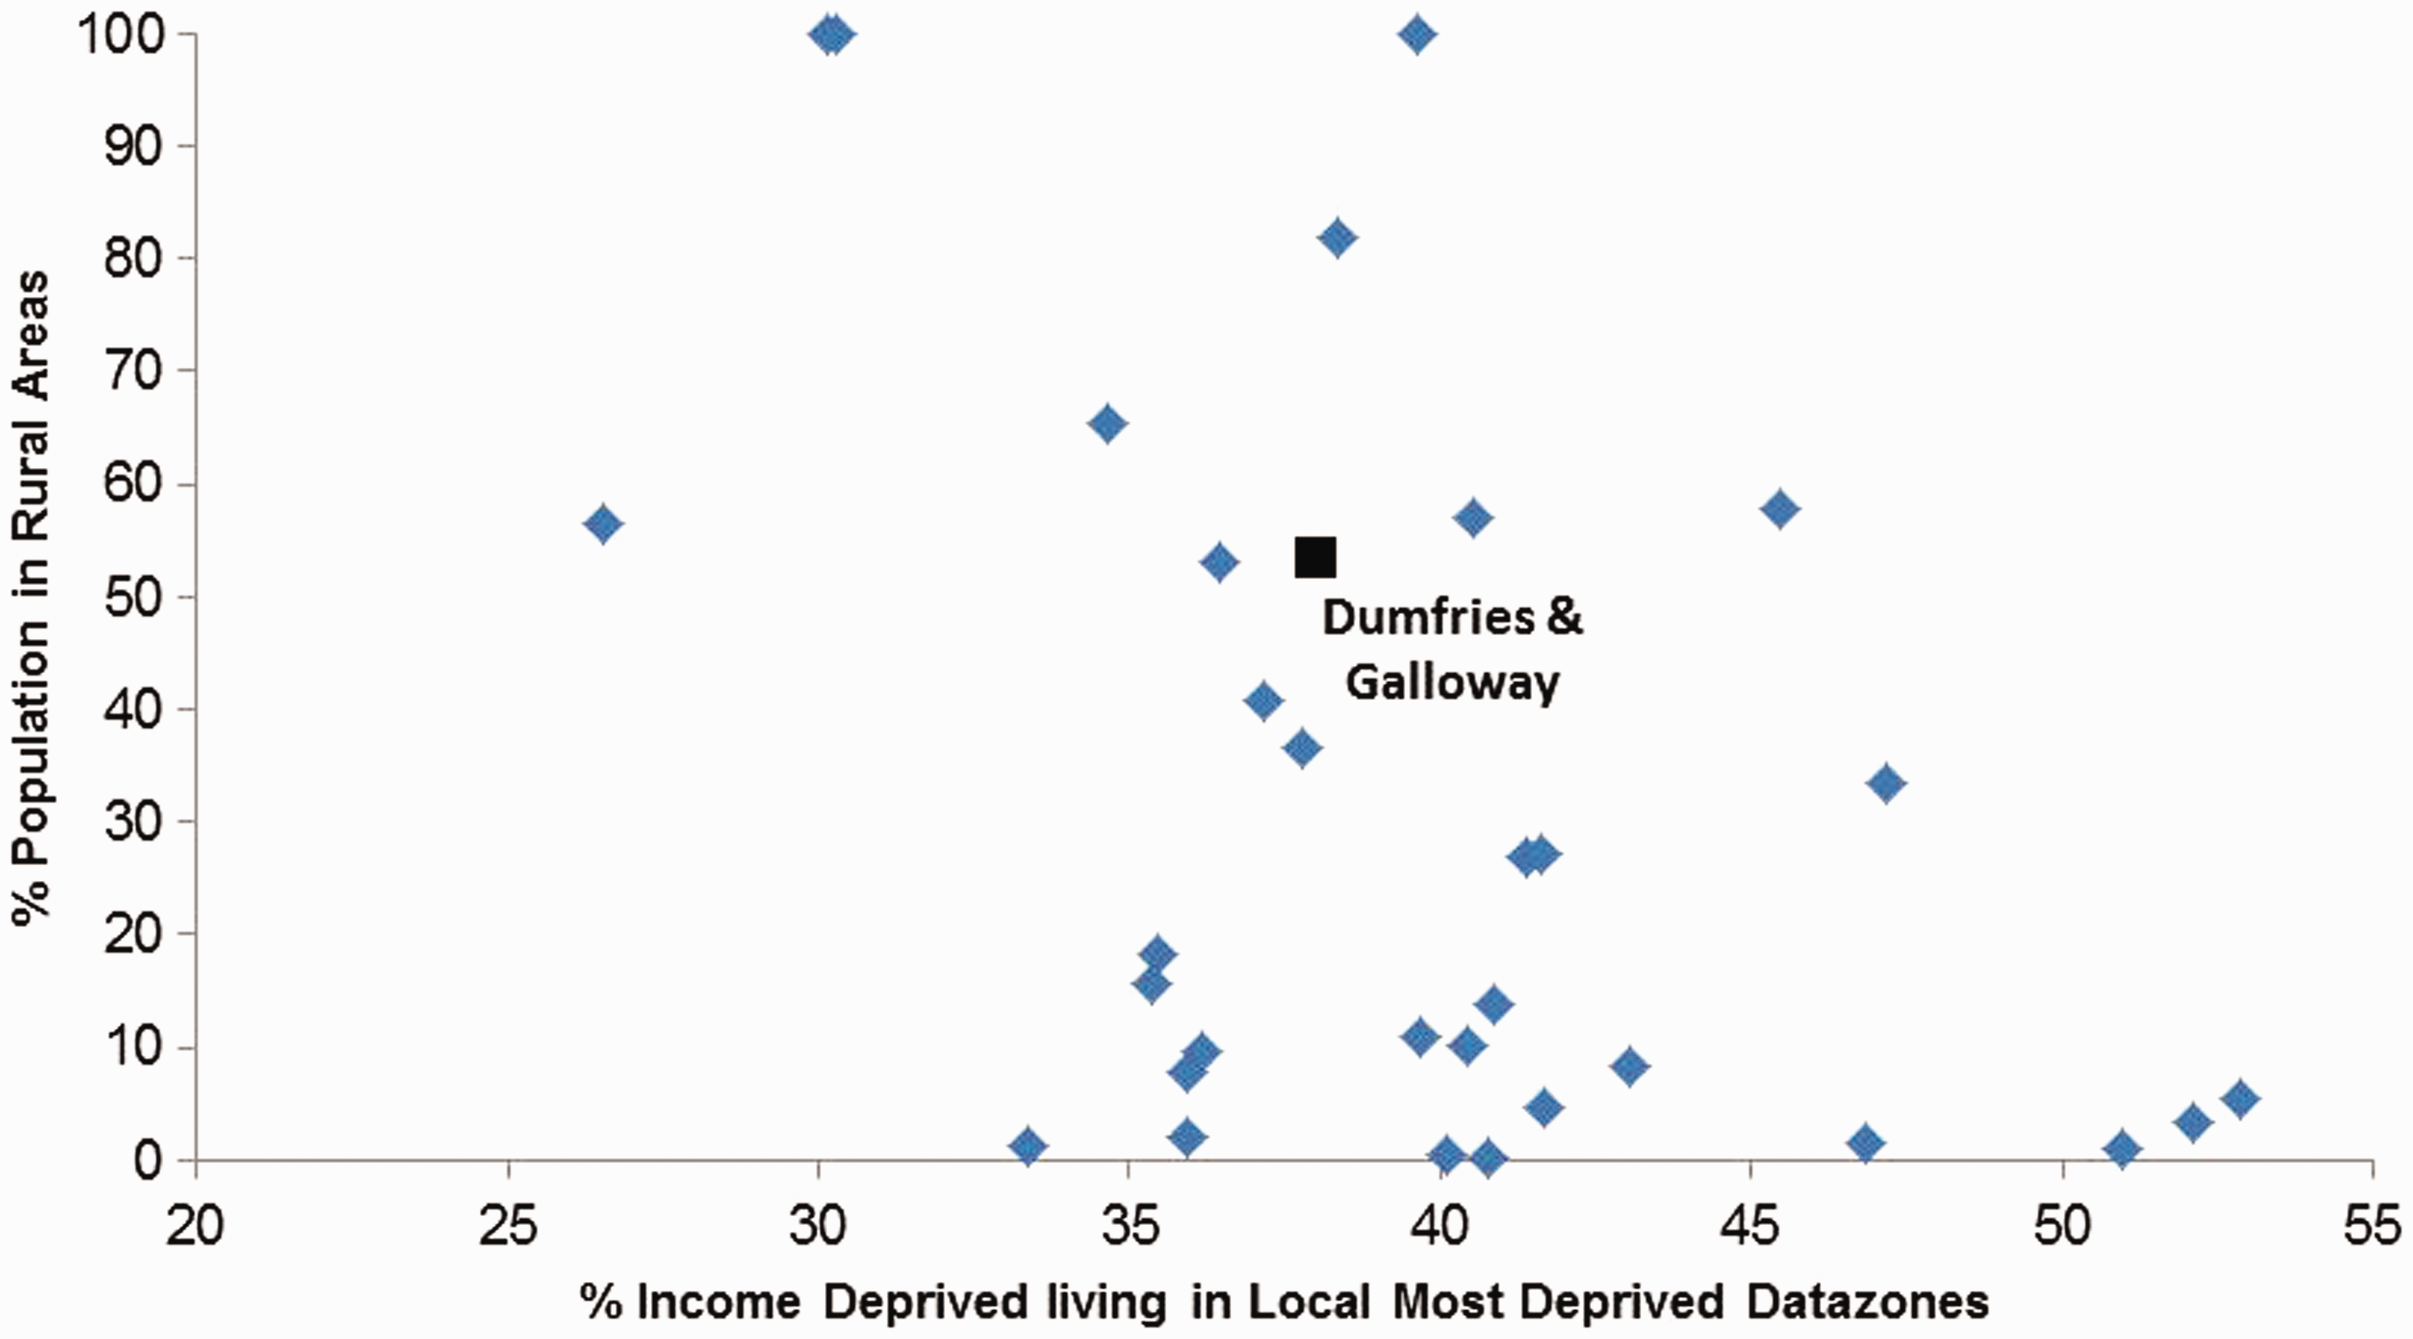
Percent of all Income Deprived people resident in Most Deprived Datazones (local quintile) by degree of rurality, Scottish Local Authority areas.
The lack of any clear relationship at this scale suggests a more complex and variable pattern of concentrated deprivation in urban and rural areas, requiring analysis below the level of local authorities. This is presented for Dumfries and Galloway (Figure 6), which sits at around the median for Scottish local authorities in terms of the proportion of income deprived people captured by the local most deprived datazones and has just over half of its population living in rural areas. Three points of interest can be noted from this analysis.
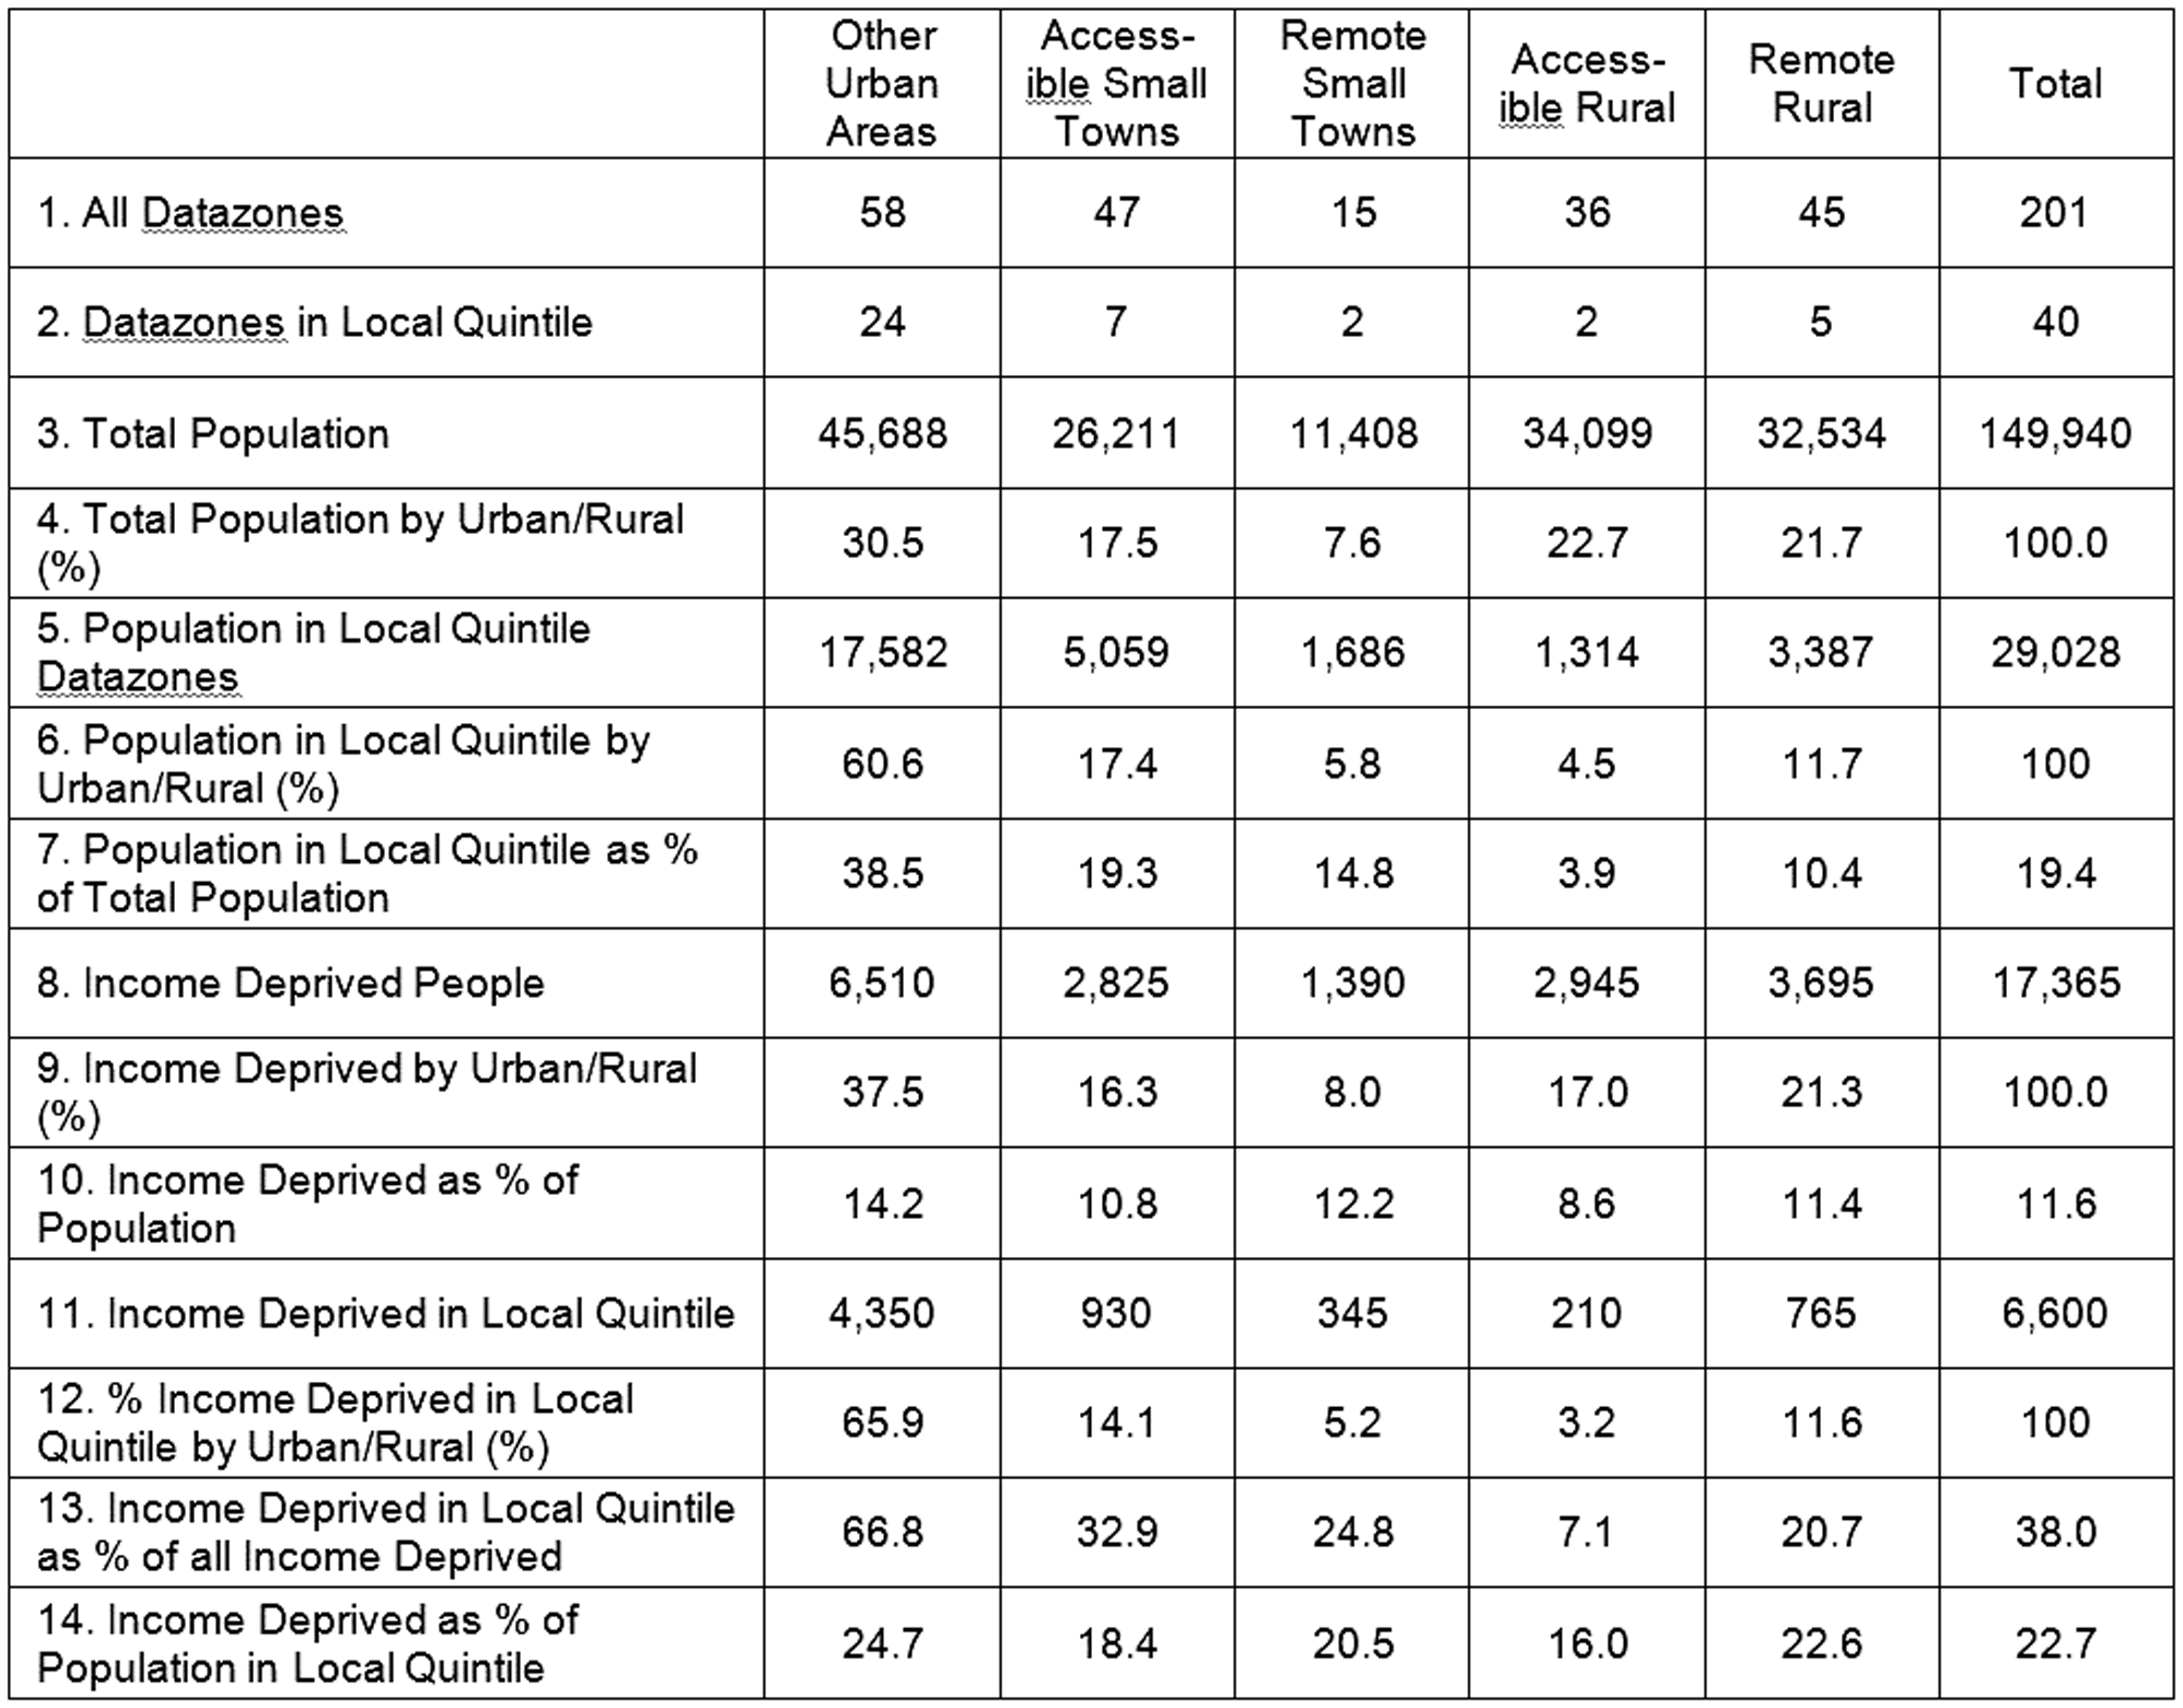
Population and income deprivation in Dumfries and Galloway, by datazones in most deprived local quintile and urban/rural classification.
Firstly, as indicated by Figure 3, the most deprived datazones in the region are mostly in urban areas and accessible small towns based on the Scottish Urban–Rural Classification. Urban areas (i.e. the two largest towns of Dumfries and Stranraer) account for 30.5% of the region’s population and 37.5% of all income deprived people. There are 58 datazones in the region classified as urban, of which 24, accounting for 38.5% of the total urban population, fall in the local most deprived quintile.
Secondly, this has the implication that targeting on the basis of the most deprived local quintile would be reasonably effective in capturing income deprived people in the region’s urban areas because 66.8% of the region’s income deprived population live in these areas (Figure 6, Row 13). However, this comes as a result of disproportionately excluding deprived people elsewhere – only 7.1% of income deprived people in accessible rural areas fall in the two datazones (out of 36) identified as the most deprived. This would tend to support the suggestion (McKendrick et al., 2011) that a focus on the SIMD will tend to privilege urban concentrations of deprivation to the detriment of deprived people in more rural areas.
Thirdly, the level of income deprivation (as a proportion of the total population) in local quintile datazones (Figure 6, Row 14) is on average double that in all datazones (Figure 6, Row 11). However, there is some variation within this by degree of rurality. This proportion is highest (24.7%) in the most deprived datazones in urban areas, but is only slightly lower (22.6%) in those in remote rural areas. This adds further weight to the need for a more nuanced view of deprivation patterns beyond the assumption that rural deprivation is necessarily more widely dispersed.
The SIMD in national and local policy
Public policy in Scotland has, in a variety of ways, increasingly sought to address issues of poverty, deprivation and inequality in recent years, with tackling the ‘significant inequalities in Scottish society’ identified as one of the National Outcomes in the Scottish Government’s (2016c) National Performance Framework, and a specific focus on child poverty (Scottish Government, 2018). Some of the national policies pursued in support of these goals – for example, the increased provision of free school meals (Morrelli and Seaman, 2012), or the allocation of funding to mitigate the ‘bedroom tax’ (Gibb, 2015) – have been universal or ‘place-blind’. In other policy areas, however, there have been attempts to target resources or interventions specifically at those perceived as most deprived. While there is currently little systematic research on how deprivation indices or other indicators are translated into spatially targeted policies and resource allocations, some recent examples from the Scottish context suggest two general ways in which they tend to be used.
Firstly, the SIMD is used at a national level as a proxy indicator for individual deprivation, where residence in a datazone with a high SIMD ranking is assumed to be synonymous with an experience of deprivation. Two examples illustrate this. Firstly, the Scottish Government’s Scottish Attainment Challenge Fund allocated additional education funding to the seven (later expanded to nine) local authorities with the highest proportion of primary school pupils living in the national 20% most deprived areas (Scottish Government, 2016d). This was a response to growing political concern with the ‘attainment gap’ affecting pupils from disadvantaged backgrounds, as part of a broader prioritisation of improving outcomes for the most disadvantaged (McCluskey, 2017). This resulted in £42.5 million of additional funding being shared between these areas over the first two years of the fund (APS Group Scotland, 2018). An allocation of funding between local authorities on this basis, where there are large variations, as opposed to levels of income deprivation that are more consistent across areas (Figure 2), clearly represents an implicit decision to focus resources on places with significant and largely urban concentrations of deprived populations.
Similar issues are evident in higher education, where the proportion of students from areas in the first and second quintiles is used to measure participation of those from disadvantaged backgrounds (Scottish Funding Council, 2016). The use of residence in SIMD quintiles as the primary means of defining social background in this way is clearly problematic (Hunter Blackburn et al., 2016; Weedon, 2014) and represents an obvious example of an ‘ecological fallacy’ – the assumption that the characteristics or circumstances of individuals can be inferred from information about areas (Commins, 2004). This neglects participation amongst those who might reasonably be considered deprived on the basis of income or other grounds but do not live in neighbourhoods that are recognised as such.
Secondly, SIMD results are also used as a basis for spatially targeted interventions and funding at a local authority level. For example, a survey of local authorities’ place-based interventions (Baczyk et al., 2016) shows the majority using the SIMD for at least partial, and sometimes sole, justification of identifying specific areas. These can be seen as part of a broader re-emergence of place-based approaches (Matthews, 2012) following a period during which traditional ‘regeneration’ approaches that target particular areas fell out of favour (Robertson, 2014). In Dumfries and Galloway, the local authority has (through the European Social and Investment Fund) supported a strategic intervention aimed at identifying workless, lone parent and low-income households and supporting them to progress through the labour market – this support is specifically and exclusively targeted at those living in the most deprived areas, initially in North West Dumfries, where there is a cluster of datazones in the national most deprived quintile (Dumfries and Galloway Council, 2017). This type of targeting of particular places or ‘communities’ is likely to become more common, with the Community Empowerment (Scotland) Act 2015 introducing a requirement for Community Planning Partnerships (CPPs) to ‘act with a view to reducing inequalities of outcome which result from socio-economic disadvantage’ and in particular to produce Locality Plans targeted at particular geographic or interest communities that experience disadvantage (Scottish Government, 2015). While in many regions these plans are still being developed, the approaches being taken by local authorities and CPPs to meet these requirements appear to vary widely. Dumfries and Galloway appears to be unique in adopting a region-wide thematic Locality Plan based on food sharing, (Dumfries and Galloway CPP, 2017). Other CPPs (e.g. Aberdeenshire CPP, 2017; East Renfrewshire CPP, 2017) seem to be following a more conventional approach focused on those specific areas that are seen as experiencing particular disadvantage – for which the SIMD is used as a prominent source of evidence.
These examples are by no means exhaustive and there are other policy areas – particularly in regard to health inequalities – where area-based measures may be used differently. However, in light of the analysis presented in the previous section, questions emerge regarding the role of IMDs in policy. In practical terms, there is a distinction to be drawn between their use at a national level to allocate funding between areas, as in the local authority-level Scottish Attainment Challenge Fund allocations, and at a local level to target specific datazones. Given the aim of the SIMD to highlight (mainly urban) areas of concentrated deprivation, the former will tend to direct national funding in a way that is more uneven than would be justified by the distribution of income deprived people, to the detriment of rural regions. The latter will be of varying effectiveness in capturing a proportion of income deprived people, although in contrast with the analysis here, in practice local authorities tend to use datazones in the national, rather than local quintile, as a basis for targeting, which will further tend to exclude rural areas.
Discussion
On a conceptual level, any measure will necessarily be based on a particular understanding of what constitutes deprivation, and the data sources that can be used as proxies for this. IMDs, which treat deprivation as a multidimensional phenomenon, are nevertheless constructed according to a set of judgements on which indicators to include and how each should be weighted; these decisions inevitably involve some degree of subjectivity. There are however further problems inherent in any area-based measure. In the case of IMDs, one such problem arises from the implicit assumption that multiple deprivation functions the neighbourhood or locality scale. Since these indices cannot identify whether particular individuals or households are experiencing a combination of different types of deprivation – income, employment, health, etc. – the coincidence of these in an area’s population is taken as an indicator of multiple deprivation on the part of its residents, although many individuals may experience only some or none of these. This is further complicated where, as in the case of the SIMD, these indices combine data on the characteristics of the population (such as the proportion of residents in receipt of particular benefits) with the characteristics of the geographies themselves (for example, the SIMD access domain, based on average travel time to services, see Figure 1). It should be noted, however, that the publication of scores and rankings for individual domains does allow for more tailored approaches beyond a reliance on headline scores, where, for example, interventions to promote labour market participation could be targeted at those with the highest levels of employment deprivation.
There is also an intersection here with debates on the existence of the so-called ‘area effects’ that may arise in neighbourhoods with high concentrations of deprivation, where residents may face additional disadvantages over and above those that can be attributed to ‘non-spatial’ variables (such as class or gender), or to individual circumstances (such as unemployment or ill health) (Atkinson and Kintrea, 2001), and where ‘concentrated poverty may have cumulative and qualitatively different effects on individuals, organisations and infrastructure than less concentrated poverty’ (Tunstall and Lupton, 2003: 4). These additional disadvantages are seen as arising from the characteristics of both places (such as physical environment, infrastructure, availability of services and employment opportunities) and their populations (levels of social capital, job finding networks and social norms) (Crisp et al., 2014; Milbourne, 2014; Sampson et al., 2002; Syrett and North, 2008). While results of empirical work in this area are mixed and sometimes contradictory, there does appear to be some evidence for the existence of such area effects (Atkinson and Kintrea, 2001; Sampson et al., 2002; van Ham et al., 2013), although the actual impacts on individual outcomes, and the mechanisms that generate these, are likely to vary between different places and groups (Weck and Ramos Lobato, 2015). The adoption of an area-based indicator of deprivation could be seen as the implicit acceptance of a significant disadvantage to individuals from living in areas with high concentrations of deprivation.
While the analysis here has concentrated on the relationship between area-based measures and the extent to which they include or exclude deprived individuals, it is not intended to suggest that this should be the only criterion by which the value of these measures is judged. There are circumstances where the identification of concentrations of deprivation is likely to be useful and appropriate evidence to inform policy decisions – for example, in the deployment of targeted place-based approaches, although there are of course extensive debates about the effectiveness of these (see Crisp et al., 2014). The existence of something like the SIMD is therefore clearly beneficial, and its limitations and appropriate uses are clearly flagged in official guidance. However, some of the ways in which the SIMD is used in Scotland suggest that in at least some circumstances residence in a ‘deprived’ area tends to be seen as synonymous with an experience of deprivation. Such an example of an ecological fallacy has clear implications where resources are targeted on a geographical basis, as this necessarily involves the inclusion of some populations and the exclusion of others, and is particularly problematic where the ‘most deprived’ places account for a low proportion of individuals experiencing deprivation, however defined.
Fundamentally, there appears to be some ambiguity in the grounds upon which IMDs are used as a tool for targeting – put simply, are these policies really interested in targeting people because they live in deprived areas or is this just being used as a proxy for likelihood of individual deprivation? The case of measuring access to higher education based on SIMD quintiles appears to suggest the latter, although in other contexts this is less clear. Related to this is the question of whether policies are genuinely seeking to address or mitigate multiple deprivation – in which case evidence on low income alone might be considered inadequate – or is there a reliance on IMDs as the default measurement on the basis of their high profile and official status and apparently simple headline results? These questions suggest both a need for greater research on the use of evidence in spatial targeting and for such policies to be justified more explicitly with regard to their aims and rationales.
The growing prominence of IMDs and other indicators is at least in part associated with the discourse of evidence-based policy making. As noted in the variety of critiques from the policy studies literature, however (e.g. Cairney, 2016; Parkhurst, 2017; Sanderson, 2011), public policy emerges from a range of competing values and priorities, including the construction of what is considered as ‘evidence’. This analysis highlights the need for both national and local policymakers to articulate a clearer rationale for interventions that attempt to target disadvantaged groups on a geographical basis, and specifically to make a clear distinction between interventions that seek to specifically address disadvantage associated with living in deprived areas, and those that are concerned with improving outcomes for individuals experiencing deprivation, however defined. In the case of the former, IMDs are likely to be a useful tool, although analysis of other indicators appropriate to the specific policy aims should also be employed. In the case of the latter, targeting interventions on the basis of residence in apparently deprived areas is likely to exclude the majority of those on low incomes. Making policy goals explicit in this way (Parkhurst, 2017) will have implications for the most appropriate sources of evidence as a basis upon which policies can be targeted and evaluated. Given the ongoing impacts of austerity in the UK – revenue funding from the Scottish Government to local authorities has fallen by 7.6% in real terms since 2010 (Accounts Commission, 2017), with greater per capita reductions in some rural authorities (Hastings et al., 2015) – there is, however, a risk that local capacity to develop a the most appropriate evidence relevant to particular circumstances may be limited in some areas.
Conclusions
This paper has sought to highlight the limitations of a reliance on ‘headline’ area deprivation scores alone as evidence to inform policies or resource allocations that attempt to target deprived groups. This is illustrated through an analysis of the proportion of income deprived people living within the most deprived areas at a local authority level. On this basis, to take the region of Dumfries and Galloway as an example, a spatial focus on the highest ranked quintile of areas would be of limited effectiveness in targeting individuals on low incomes. Extending this analysis to local authority areas across Scotland, two broad conclusions can be drawn.
Firstly, given that patterns of concentration or dispersal of income deprivation vary across space, this inclusion/exclusion problem can be observed to different degrees in different places. In Scotland, therefore, the degree of coverage of deprived individuals provided by the ‘most deprived’ datazones varies widely between different regions. Those areas identified on the basis of the overall SIMD can only act as an at best partial, and for some areas poor, guide to where deprived individuals actually live, even based solely on the income deprivation measure. In practical terms, this has significant implications for the use of this type of measure as evidence to support the design and targeting of interventions. To take Dumfries and Galloway as an example, any intervention that focused on the set of areas identified through overall SIMD rankings would impact on far fewer than half of those people in the region that could reasonably be thought of as income deprived. The effectiveness in these terms of such targeting would vary widely in other regions.
Secondly, on this analysis there is no clear link between the degree of coverage provided by the SIMD and the degree of rurality at local authority area. This contrasts with one of the common assumptions behind critical responses to the SIMD – namely that it is an inherently less suitable tool for rural areas because of more dispersed spatial patterns of deprivation. While the varying effectiveness of the SIMD quintile in capturing each region’s deprived individuals does point towards the desirability of appropriate local methods of understanding and targeting spatial patterns of deprivation, this also suggests a more complex scenario than the simple assumption that current approaches work well for cities but poorly for urban areas. This points towards the need for a more nuanced understanding of the limitations involved in measuring rural deprivation in this way, possibly using alternative approaches to measuring rurality (for example, Allen, 2008; Benyon et al., 2016), and for richer analysis of variations in the spatial distribution of deprivation.
While it is argued by their proponents that ‘the presentation of data at different geographical levels should not be taken to imply assumptions about the fundamental causes of deprivation, nor … about the appropriate solutions’ (Noble et al., 2006: 170), the ubiquity of IMD approaches, and their status as the pre-eminent and ‘official’ measures, risks placing an emphasis on area-based aspects of deprivation that may not be justified across the wide range of local circumstances and policy areas in which they are employed. This may lead to an allocation of resources or targeting of interventions that is inappropriate, or indeed to the framing of policy aims in a way that implicitly privileges a particular understanding of deprivation as a concentrated and predominantly urban phenomenon. In the Scottish context, the high profile of the SIMD, and its use as an evidence base for attempts to address a variety of social issues linked to poverty or deprivation, suggests that there is a tendency for its reification, and of the apparent simplicity of the measure obscuring from policymakers some of the richer detail that might aid more effective decision making. While it is readily acknowledged that, as Deas et al. (2003: 884) put it, ‘there is no perfect or incontestable means of defining or measuring deprivation’, and that the SIMD represents a valuable tool on its own terms, these results demonstrate the potential risks of an over-reliance on any area-based measure of deprivation as a single indicator across different policy and geographical contexts. They also emphasise the need for greater attention to be paid to the processes by which the results of this type of indicator are interpreted and translated into policy decisions by different actors. Given the increasing prominence of these measures as policy tools across a number of countries, this is of pressing importance.
Footnotes
Declaration of Conflicting Interests
The author(s) declared no potential conflicts of interest with respect to the research, authorship, and/or publication of this article.
Funding
The author(s) received no financial support for the research, authorship, and/or publication of this article.