
Abstract
Cities in the United States have become increasingly less dense either from sprawl from rapid development or vacancy due to decline. The benefits and costs of urban density have been a topic of research since the mid-20th century. The effect of urban density on incomes is one of these areas of research. Based on concepts rooted in urbanization economies and social output, it is assumed in this paper that an increase in urban density increases incomes. Urban density is defined as population and housing density. It was found using a cross-sectional lagged mediated multiple regression that population and housing density have statistically significant indirect effects on income in a sample of more than 300 metropolitan areas in the United States. The significant effects of these variables on employment and the effect of employment on income mediated these effects.
Introduction
Urban density is relatively low in the United States. In urban areas, it ranges from 3500 people per square mile to 20,000 people per square mile (Whittemore and BenDor, 2019). Since the 1940s density has decreased with no regional differences or differences between new and old cities (Bryan et al., 2007). Despite these trends, the suburbs have been decreasing in popularity with many returning to the city center (Bogin et al., 2019). This indicates that urban density could be increasing in the future.
One of the appeals of urban life is the possibility to earn more money than in the rural areas. This association has led to rapid urbanization not only in the United States but around the world. Transportation costs have declined and the economy has shifted to a more service orientation. These dynamics have led to a more dispersed pattern of development, i.e. sprawl in which urban areas have expanded at twice the rate of population growth (Alberti, 2005; Clifton et al., 2008; Kim, 1999; MacDonald, 2000).
In response to urbanization trends, most countries pursue policies of compact development despite a decreasing urban concentration across both developing and developed countries (Frick and Rodríguez-Pose, 2018). For example, these have included urban growth boundaries, land preservation, and smart growth. Urban growth boundaries were the first attempt to regulate growth (Anthony, 2008). This constriction was seen as a method of reducing sprawl while increasing the diversity and affordability of housing (Cheshire et al., 2019). Similarly, smart growth “promotes compact, dynamic development intended to improve urban neighborhoods by creating jobs, attracting residents and increasing local tax revenues” (Leigh and Hoelzel, 2012: 88). In general, it focuses on land preservation and inner-city management through compact development (Ali, 2014). Anthony (2008) added that the most common smart growth tools are impact fees and public facilities ordinances.
The compact city design is not without its critics. Michael Neuman wrote an article titled “The Compact City Fallacy” in which he noted that compact cities are not necessarily sustainable in which it places more rigid constraints on form and neglects process. He added that sprawl has been found to have both positive and negative effects on sustainability, and sustainability is seen as a good thing from multiple perspectives including economic sustainability (Neuman, 2005).
There have been various levels of support for these policies. Brody et al. (2006) found that high-income communities in Florida support growth management. In contrast, O’Connell (2009) found a negative correlation between income and preservation policies. The resistance to smart growth is usually about service burdens such as for schools and water resources as well as an increase in traffic (Whittemore and BenDor, 2019).
The benefits and costs of urban density have attracted research on different topics. Some of this research has focused on environmental degradation (Alberti, 2005), land and home prices (Gordon and Richardson, 1997), crime (Fonseca and Wong, 2000), public service costs (Ladd, 1992), and mobility (Levine et al., 2012). Some of this research has considered the income effects. The New Economic Geography literature stresses the economic benefits from concentrated urban structures. The assumption is that with the colocation of people and firms there is knowledge spillover with the sharing and matching of inputs, human capital, and innovations (Fujita and Thisse, 2003). The spillover is predicated on social interaction.
The location of economic activity in close proximity is based on the need for face-to-face contact that is still relevant despite technological changes (Charlot and Duranton, 2004). Arentze et al. (2012) observed that face-to-face contact is the most important form of social interaction. Storper and Venables (2004) found that social contact is important for innovation and creativity. Hilber (2010) noted that homeowners invest more in human capital through social interaction. The importance of social interaction is featured in this research in which ideas, skills, and opportunities are exchanged between firms and people. This exchange is assumed to increase incomes in this environment.
Van den Berg et al. (2014) assumed that social interaction was dependent on urban density. They found that density increases this social interaction, but not for everyone. They found that men and full-time workers were more likely to record no social interactions. Similarly, Hawley (2012) found an increase in urban density increased the amount of social interaction. This interaction primarily occurred between friends and not between neighbors or outside groups.
Despite the limiting factors on social interaction, the literature supports the notion that urban density increases social interaction. It is assumed that through this interaction there are knowledge spillovers which increase the exchange of skills and opportunities. This increases the potential to earn more and thereby have higher incomes. It is assumed in this study that an increase in urban density increases incomes.
The next section considers the underlying theory to these associations. The concepts of urbanization economies and knowledge exchange are explored as they relate to employment and income. The study design section that follows this clarifies the research question along with the hypothesis. This research question is on whether there is a link between urban density and incomes in a metropolitan area. The variables and their measurement are detailed along with an explanation of the applied statistical methodology. A subsequent results section presents the findings of the models which is followed by a discussion section which explores these findings as they relate to the theory established in the literature. The paper ends with a conclusion section that summarizes the intention and limits of the study as well as some takeaways.
Literature review
Jane Jacobs in her book The Death and Life of Great American Cities for the first time broke with planning orthodoxy at the time and advocated for denser cities. As explained by Roskamm (2014), in Jacob’s opinion, high population and building densities are requirements for a vibrant city, and she demands them to be adopted as an urban planning tool. This was a completely new position since no one before her had proclaimed higher density an urban planning goal. (p. 88)
Jacobs differentiated density from overcrowding or congestion and recognized the idea of an optimal density without providing much detail on how to achieve it (Jacobs, 1961).
For Jacobs, urban life was an accumulation of bottom-up processes. Interactions on the street led to the co-creation of an urban identity (Ikeda, 2004). This is also the source of the concept of urbanization economies i.e. economies that develop around urbanized communities. Urban density accelerated this process; however, Jacobs was suspicious of a centralized planning approach used to achieve it. As explained by Perrone (2019), in brief, Jacobs attributes the real potential of urbanity to the street and denounces the risk of impoverishment of the city, if the streets were to change nature and all become major arteries of communication if the fronts of buildings were to be homogenized, and if the uses were separated, as threatened by major planning interventions. (p. 11)
This explains Jacobs resistance to urban redevelopment as a top-down process that at that time was emphasizing planning for car traffic and Euclidean zoning, i.e. the creation of a rigid separation of zoned uses. At that time this created a greater incentive for urban sprawl and hence the resistance of Jacobs.
Although Jacobs resisted centralized planning which Kirby (2019) explained undermined the planning profession with sources in libertarianism and NIMBYism (not in my back yard), a new urban movement sprung from her thought. Known as New Urbanism, this movement advocated for dense, mixed use development (Farber and Li, 2013). Mixed use was directly against Euclidean zoning and the sprawl it created with an emphasis on increasing urban density through the colocation of homes and workplaces (Moos et al., 2018). Naturally, zoning diversity was encouraged along with social mix, i.e. the mixing of people with different socio-economic backgrounds. An important component of this was the linkage of urban design with social outcomes including environmental, public health, and economic benefits. Urban design could then be assessed for performance on achieving these benefits.
The assessment of performance from urban density continues to be of interest across disciplines. For example, Frank et al. (2005) and Frumkin (2002) found that an increase in urban density increases walkability and thereby healthier living environments. The assumption is that an increase in urban density increases its pedestrian-friendly attributes which incentives more walking which increases health.
Another area of assessment is on housing affordability. Aurand (2010) argued that an increase in urban density increases housing affordability. Moos et al. (2018) found the opposite with ownership and rental housing less affordable in areas zoned for mixed-use in Toronto. They added that housing affordability depended on the profession of people with those in management, business, technical, and health occupations being more able to afford housing. These are better paying positions alluding to mixed use leading to more economically homogenous neighborhoods.
This is one of the complaints about New Urbanism as it pertains to gentrification which displaces lower income groups (Cheshire et al., 2019). Bogin et al. (2019) found that the average U.S. city is experiencing a steepening housing price gradient with demand increasing with proximity to the central business district which increases with urban density. Similar to the example provided by Moos et al. (2018), young and highly skilled people are returning to the central cities raising rents and housing prices. This is not creating the social mix imagined by proponents of New Urbanism.
Another area of assessment has been on the relationship between urban density and productivity. The assumptions that underlie this relationship can be referred to as the density–productivity nexus which was the term used by Wheeler (2004). One aspect of this ‘nexus’ is the relationship between urban population and housing density with incomes. The existence of the productivity–pay gap indicates that income is a unique aspect of productivity with implications at the individual and household levels. As explained by Mishel et al. (2009), productivity growth has not translated into the growth in labor earnings in the United States.
Traditionally, the relationship of density with productivity has been based on the concentration of educated people in a space. This concept was first articulated in a paper by Robert Lucas Jr (1988). A study by Abel et al. (2011) considered this same relationship with productivity and human capital and found that concentrated human capital has a notable impact on productivity. In contrast, metropolitan areas with a concentration of those with less education and skills experienced negative effects on productivity which the authors attribute to the negative effects of congestion overcoming the positive effects from human co-location.
In both of these papers, income was not considered as an outcome from increased urban density. In other research such as Glaeser (1999) there is an argument that density has an influence on wages. Ahlfeldt and Pietrostefani (2019) calculated the density elasticities from 180 studies with 347 estimates. They found that a log-point increase in density leads to a .04 log-point increase in wages. Further, Christiaensen et al. (2013) found that poverty reduction is associated with population concentration.
One important assumption in this relationship is the exchange of knowledge which is the same assumption in Lucas Jr (1988) and Abel et al. (2011) with productivity. Some have asserted that lower densities limit knowledge exchange (Fallah et al., 2011). The importance of density in facilitating knowledge exchange is assumed to occur through social interaction.
Bettencourt (2013) developed a social output equation based on these social interactions in which the key variables are population, land area, interaction strength, and the typical length traveled by people in an area. Social output means those things produced by society such as wealth and knowledge. Ortman et al. (2014) also focused on social interactions in their model considering the urban environment in Pre-Hispanic Mexico at archeological digs of these ancient cities. The authors also included movement and area in their model of these social interactions and concluded that social interactions are proportional to population density. An increase in density leads to an increase in social interactions which leads to an increase in social outputs as proposed by Bettencourt (2013).
One of the first attempts to empirically verify this connection is a study by Schlapfer et al. (2014) in which the authors looked at the relationship between city size and the structure of human interaction networks. They used phone records in Portugal and the United Kingdom. The authors found that with the doubling of city population size on average about 12% more contacts are made via phone in which the phone contacts are assumed to be a proxy for face-to-face interactions. They also found that outside network contacts (contacting someone new) actually grows faster with city size than inside network contacts which exemplifies the connectivity aspect of urban density. This is counter to the findings of Hawley (2012).
In this research, urban density is assumed to increase social interactions and thereby increase knowledge exchange. This knowledge exchange is assumed to increase productivity. This connection was articulated by Wheeler (2004) in which he wrote, suppose that individuals are able to augment their human capital and, thus, wage earnings by observing, or in some way, interacting with agents who possess greater skill. Suppose further that urban density increases the rate at which these productive interactions take place on average. (p. 422)
There is also a counter-thesis that urban productivity is negatively affected by urban density. Some studies on urbanization economies and the effects on economic productivity discuss this potential. The literature explores congestion from different perspectives including traffic and human capital development. For example, Bettencourt (2013) recognized the potential problems with urban density by advocating for a combination of greater mobility with greater density. Higher levels of congestion limit the amount of area covered by an individual and erode social interactions. This is typically associated with time-travel budgets in which there is some evidence that the average daily travel tends to be constant in which people are only willing to travel for so long (Mokhtarian and Chen, 2004). As congestion levels increase, the time needed to traverse the same distance increases limiting those interactions which are critical to urban productivity.
Most of the literature indicates that in the early stages of economic development urban concentration is considered a good thing for all of the previously discussed reasons. At some point, urban concentration has been found to lead to negative economic productivity without the necessary urban investments. Even with these investments some scholars have argued that there is an optimal city size where the marginal social benefit outweighs or matches the marginal social cost from urbanization (Getz, 1979; Henderson, 1975, 2000, 2003). This was what Jane Jacobs explored while she promoted a denser city. Despite this recognition in the literature, the optimal city size remains an elusive concept. For example, Black and Henderson (1999) found that the distribution of metropolitan areas has remained stable indicating that there has not been a convergence around an optimal city size. In addition, they explained that productivity patterns vary across city types with different types leading to different outcomes. In this they argued that productivity is not dependent on urban density or size alone.
Despite the debates on urban density, some planning approaches have emphasized urban density. Smart growth, which has been a popular planning paradigm, advocates for increasing residential density and transit use in growing cities. These are the two areas of concern in optimizing urban productivity (density and mobility) although smart growth recommended density and transit use over concerns related to environmental degradation caused by urban sprawl. Any benefit related to economic development was always considered a secondary concern (Filion and McSpurren, 2007).
A key aspect of smart growth is the compact city concept (compact development) where compaction reduces transportation times while having positive economic and social effects such as increasing social connectivity. This emphasizes redeveloping previously developed spaces and conserving and increasing green space while increasing public transit. Due to its emphasis on green space, smart growth has roots in the garden city concept developed in the 19th century. This emphasizes concentrations of neighborhoods separated by green areas (Baum-Snow, 2013; Echenique et al., 2012; Kelly, 2004; Lewis and Baldassare, 2010).
Smart growth also has a new companion labeled smart decline which is also called “right-sizing”. There are many cities in the United States that have been losing population for some time. These cities have a similar problem to growing cities however in the opposite direction. As the population declines, previously dense neighborhoods begin to become sparsely populated leaving the city with excess infrastructure and lower levels of social interactivity. Fee and Hartley (2011) found after looking at four decades of growing and shrinking Metropolitan Statistical Area (MSAs) that growing cities have dense urban centers while shrinking cities have less dense urban centers.
The uniqueness of these cities is evident in their under-performance related to scale as cited by Bettencourt et al. (2010). The authors calculated scale-adjusted indicators for metropolitan areas in the United States and found shrinking cities to have the lowest levels on these indicators. These indicators were based on scale relevant factors related to jobs, housing, infrastructure, wealth, and innovation. For cities of their size they were not producing expected levels of urban goods.
Some shrinking cities began to seriously address abandoned properties while others sought to attract creative people (the creative class) by integrating economic development, cultural development, and urban design (Florida, 2005; Mallach, 2017). An aspect of attracting the creative class meant increasing innovation through knowledge networks to capitalize on the knowledge-based economy. Some cities attempted to increase community involvement and encourage home ownership so residents would take responsibility for their communities (Sousa and Pinho, 2015). Other cities created different agreements to incorporate social justice in redevelopment such as through community benefits agreements (Patterson et al., 2017). Some cities sought to “right-size” their cities which is a restructuring of the city to match its current administrative capacity and boundaries with the actual size of the city (Hummel, 2015).
“Right-sizing” has many aspects, but the basic premise is to restructure the city physically and administratively to account for a declining population. It is another approach to create a compact city. Physical “right-sizing” would be consolidating populations, deannexing parts of the city, cutting services to less populated parts of the city, and returning to nature former city neighborhoods (increasing green space). The ultimate objective would be to increase urban density to reduce service costs and maximize urban productivity (social interactions/social outputs) (Abel et al., 2011; Anderson, 2012; Hummel, 2015; Rybezynski and Linneman, 1999).
These efforts to maximize urban density and thereby increase social interaction and its concomitant benefits have many aims which include the building of the local economy. Communities are interested in attracting the “right businesses” which in the present economy are focused on innovation and knowledge-based businesses. These businesses produce high amounts of wealth and bring with them long-term high-paying jobs. These economies rely on a combination of innovation, entrepreneurship, and production (Feldman et al., 2016). These factors rely on a mix of people with different skills collaborating which can be maximized through urban density. Feldman et al. (2016) also noted the importance of chance encounters in this process. As explained previously, urban density can naturally maximize these face-to-face encounters through the co-location of people and the places in which they congregate, i.e. their homes.
Economic development is also more than jobs as it is intended to create prosperity such as increasing incomes and increase the quality of life (Feldman et al., 2016). If employment expands while incomes remain stagnant then this is questionable economic development. The improvement in the quality of life also emphasizes the non-pecuniary aspects of well-being which can be improved through economic development.
Economic development has also become increasingly local which means local efforts have more impact than macro-level approaches. Cowen (2011) referred to the last several decades in the United States as the “Great Stagnation”. In this period, macro-level economic development policies have failed which has increased the need for more micro-level economic development policies. The conditions that expand the capacities and capabilities of economic actors have become the central discussion on this topic (Rodríguez-Pose and Storper, 2009). One of these conditions is the urban design that maximizes social interaction.
Despite the varied aspects of economic development, the emphasis in this study is on employment and how this is related to urban density and ultimately to incomes. This stresses the importance of jobs, but also general prosperity. The importance of employment for city administrations is evident in the “state of the city” addresses given every year in cities across the United States. Creating jobs is the most cited goal for these cities (Yadavalli et al., 2018). Gebremariam et al. (2010) noted a connection between job growth and income growth. This was further explored by Jin and Rafferty (2017) in their study of the effects of density on income and employment growth. The authors found that population and employment densities were positively associated with income growth particularly in the 2000s. Further, they observed that income growth did not lead to employment growth in this decade indicating a unidirectional effect. Their study included 86 metropolitan areas.
Based on this research it is assumed in this paper that urban density has a positive effect on incomes. The research question is on what effects, if any, urban density has on incomes in metropolitan areas across the United States. Further, this relationship is assumed to be dependent on employment growth. These assumptions are rooted in the concepts developed in the literature under the umbrella of the density–productivity nexus and articulated by the urbanization economies literature that argue that the co-location of people increases the likelihood for knowledge exchange through social interaction.
In one way this empirical analysis is a test of the assumptions underlying the emphasis on urban density and its effects on employment. At the core of these assumptions are theoretical and empirically tested concepts that emphasize the importance of social interaction for knowledge exchange, i.e. networking. Although technology is recognized as a major factor in mitigating the need for physical co-location, the literature has still found physical proximity to be an important factor.
In addition, although there is literature that recognizes the negative effects from urban density, Tonkiss (2014) added that most of the literature seems to indicate that benefits from urban density outweigh the costs. However, Tonkiss (2014) recognized that there is good density and bad density in which the context is critical for these benefits. According to Tonkiss (2014) and in the literature explored previously, the critical factor is social interaction which can be facilitated through spatial organization and the patterns of behavior in that city. The spatial organization of the city can be manipulated by local policy makers. The levels of interaction and attitudes to others is an important part of this consideration and more difficult to control.
Despite these contextual factors which are difficult to control for in an empirical analysis, there are a number of confounding explanatory factors for changes in incomes which need to be accounted for in any assessment of the effects of urban density. The factors included in this study are commonly included in studies on the earnings function found in labor economics. In particular, the works of Mincer (1974) and Card (1999) are frequently cited in studies on the factors that impact incomes.
Age, education, race, and gender are typically controlled for in these studies. Age is assumed to have diminishing returns after a certain point (inverted U), so its quadratic form is used to accurately represent the effects of age on income. Education has been a major focus of this literature with Mincer’s human capital earning function serving as foundational research in this area. It is assumed that an increase in education increases earnings potential. Race has also been an important factor in determining income outcomes. Whites and Asians tend to earn more than African Americans and other minority populations. Gender also features prominently in this literature in which men, historically, have earned more than women. Most of this research has focused on age, education, race, or gender (Card, 1999; Doyle and Skinner, 2016; Heckman et al., 2003; Mincer, 1974; Oreopoulos and Petronijevic, 2013; Price and Mills, 1985).
In addition, some of this research has also considered the importance of region, marital status, work effort, and industry composition. Census regions are usually used, and those Census regions that represent the West and East do comparatively better with incomes than those in the center of the country. Marital status is also considered in this research in which those that are married tend to earn more than other statuses. The amount of work effort as well as industry composition is also an important factor for income determination in the literature. Intuitively, those that work more earn more and different industries have higher income outcomes. In particular, manufacturing and FIRE (finance, insurance and real estate) jobs tend to have higher incomes than other industries (Jin and Rafferty, 2017; Mincy et al., 2009).
Study design
The research question of interest in this paper is, what is the relationship, if any, between housing and population density with incomes in metropolitan areas across the United States? Based on the literature outlined in the literature review section, it is assumed in this paper that an increase in population and/or housing density increases incomes and that this relationship is mediated by the effects of density on employment. The growth of this employment is assumed to increase incomes. Further, it is assumed that these relationships are statistically significant while controlling for factors related to income.
The dependent variable is income. Incomes are measured in multiple ways, and three common measures are adopted in this study. Income per capita, median household income, and mean household income are considered in separate analyses. Income per capita is a good measure for comparison between units of analysis. Median household income captures the true middle value for household incomes. Mean household income is the hypothetical middle value for household incomes. In addition, due to these variables having non-normal distributions as well as having substantially higher values than other variables in the analysis, the natural logarithm of these variables is used in this study. The source for these variables is the U.S. Census. The values for 2010 as well as 2011 are used to consider contemporaneous as well as lagged effects. The lagged effects also help to control for endogeneity. Lagged effects mean the delay in the effects of the predictor variables on the outcome variable. Endogeneity is the problem with interpreting the direction of the effects between the predictor and outcome variables.
The predictor variables of interest in this paper are population and housing density. These are different measures of density with one measuring the presence of people and the other the built residential environment which can be found in the U.S. Census. As defined by the Census, a housing unit can be a house, an apartment, or any living arrangement occupied or vacant. These are measured per square mile in each census-tract in each county of each MSA. These densities are then weighted by the proportion of the population/housing in the census-tract for each county and averaged across each MSA to produce a weighted average census-tract density variable for population and housing at the MSA level in 2010. These variables more accurately represent the densities in each MSA in that year.
The mediator in this study between density and income is measured as the percentage employed among working age adults as reported in the U.S. Census. These mediated effects are analyzed utilizing the PROCESS function in SPSS with the parallel mediator model. The probability value of .05 was established to determine statistical significance within the model as well as the confidence intervals which were bias-corrected. In addition, the sample was bootstrapped with 5000 samples, and heteroscedasticity-consistent standard errors were calculated to limit bias in the sample and reported statistics.
A number of control variables are used in this study to account for extraneous effects based on the literature. A quadratic measure of median age, the percentage African American, the percentage Latinx, the males to 100 females ratio, the mean hours worked, the percentage married, a regional categorical variable, the percentage employed in manufacturing, the percentage employed in FIRE careers, and the percentage with a Bachelor’s degree or higher are controlled for in this study. All of these variables are measured in the year 2010 at the metropolitan area level. The percentage White was also considered as a control, but after checking for multicollinearity based on the variance inflation factor and the tolerance values, this variable was highly and negatively correlated with the percentage African American. Multicollinearity occurs when variables are highly correlated with each other biasing the effects. The remaining variables in the model do not violate the assumptions regarding collinearity.
In addition to these controls lagged values of the income variables are included in the models to account for reverse causality. The lagged values of income are from the year 2005. Another method to account for reverse causality is to test the same model with the mediator and predictor changing places. Both approaches are used in this study. The minimum/maximum values, mean, and standard deviation of these variables are given in Table 1.
Descriptive statistics.
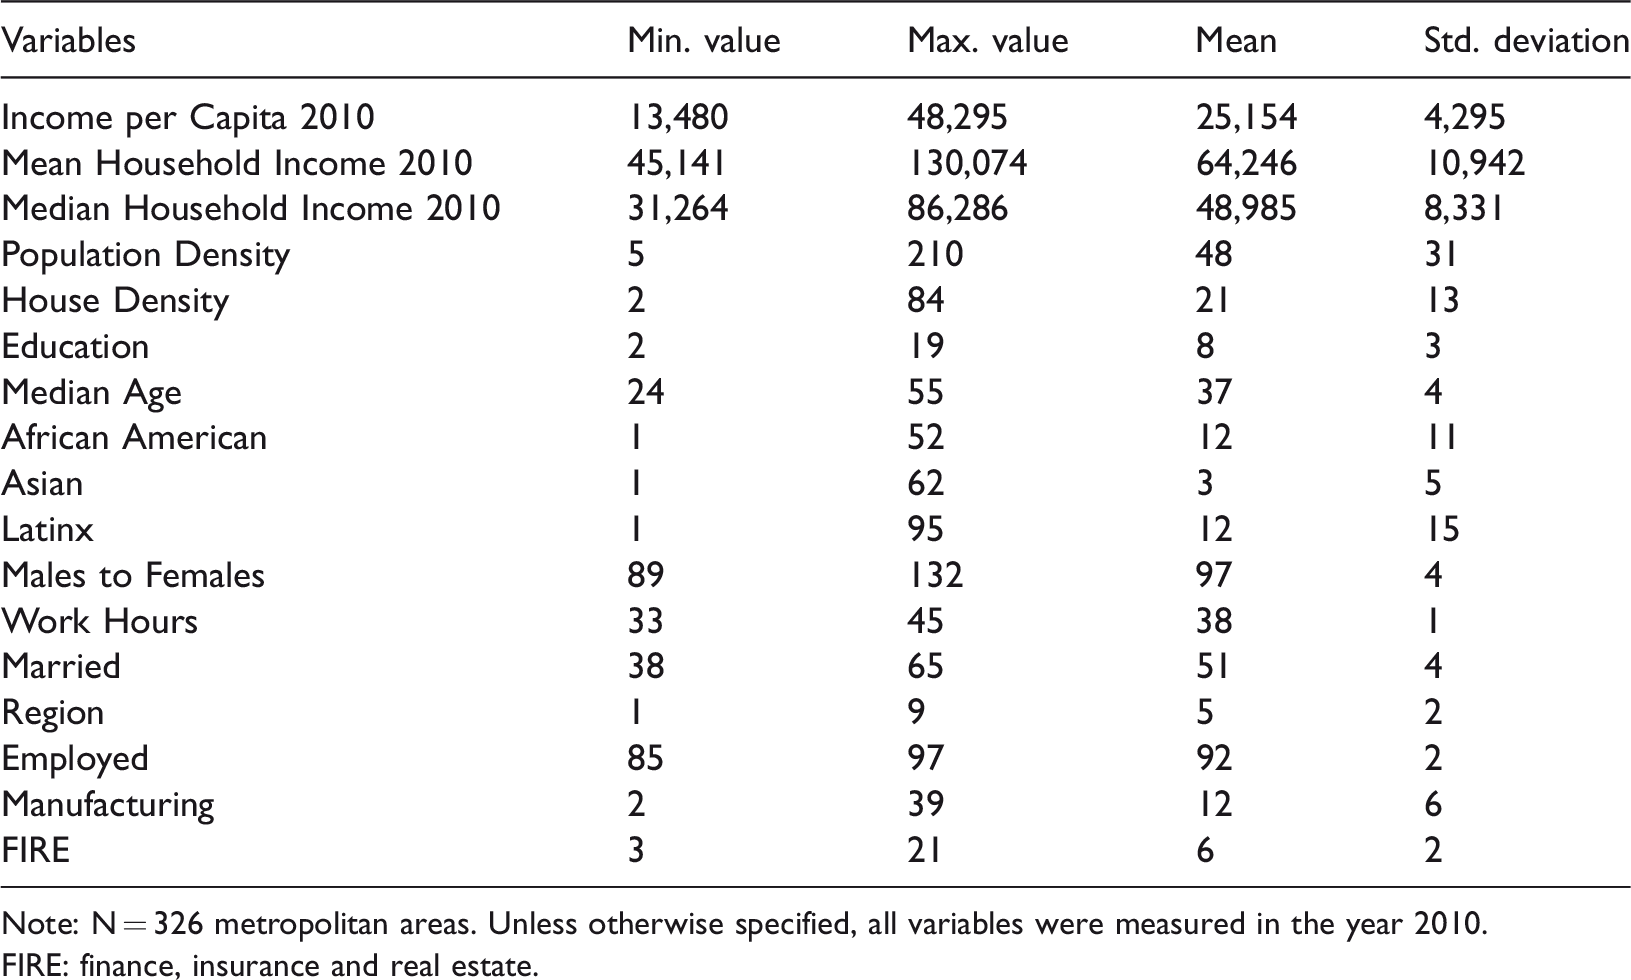
Note: N = 326 metropolitan areas. Unless otherwise specified, all variables were measured in the year 2010.
FIRE: finance, insurance and real estate.
The statistical approach in this paper is a cross-sectional lagged multiple mediated regression. It is cross-sectional because it applies across metropolitan areas. It is lagged because the dependent variable is measured in a later year than the predictor variables. It is mediated because the effect is considered directly and indirectly on the dependent variable. The regression is contemporaneous and lagged to account for same year and lagged effects. The unit of analysis is the MSA, and all MSAs in 2010 are included in this study with the exception of those that do not have all data available. 1 There are 326 MSAs in this study. This regression is repeated several times to account for the different measures of incomes and densities. The different measures of density cannot be entered into the model simultaneously due to issues of multicollinearity. In total, a series of 12 regressions are reported in this paper representing 3 different dependent variables across two years with two measures of urban density. Only select results are shown in tables and figures due to space constraints.
Results
The hypothesized relationship between population and housing density with income was confirmed in this analysis. This relationship is mediated by the effects of density on employment. An increase in population or housing density increases employment which increases incomes based on this analysis for the specified years and metropolitan areas. The figure and tables in this section explore these results in more detail.
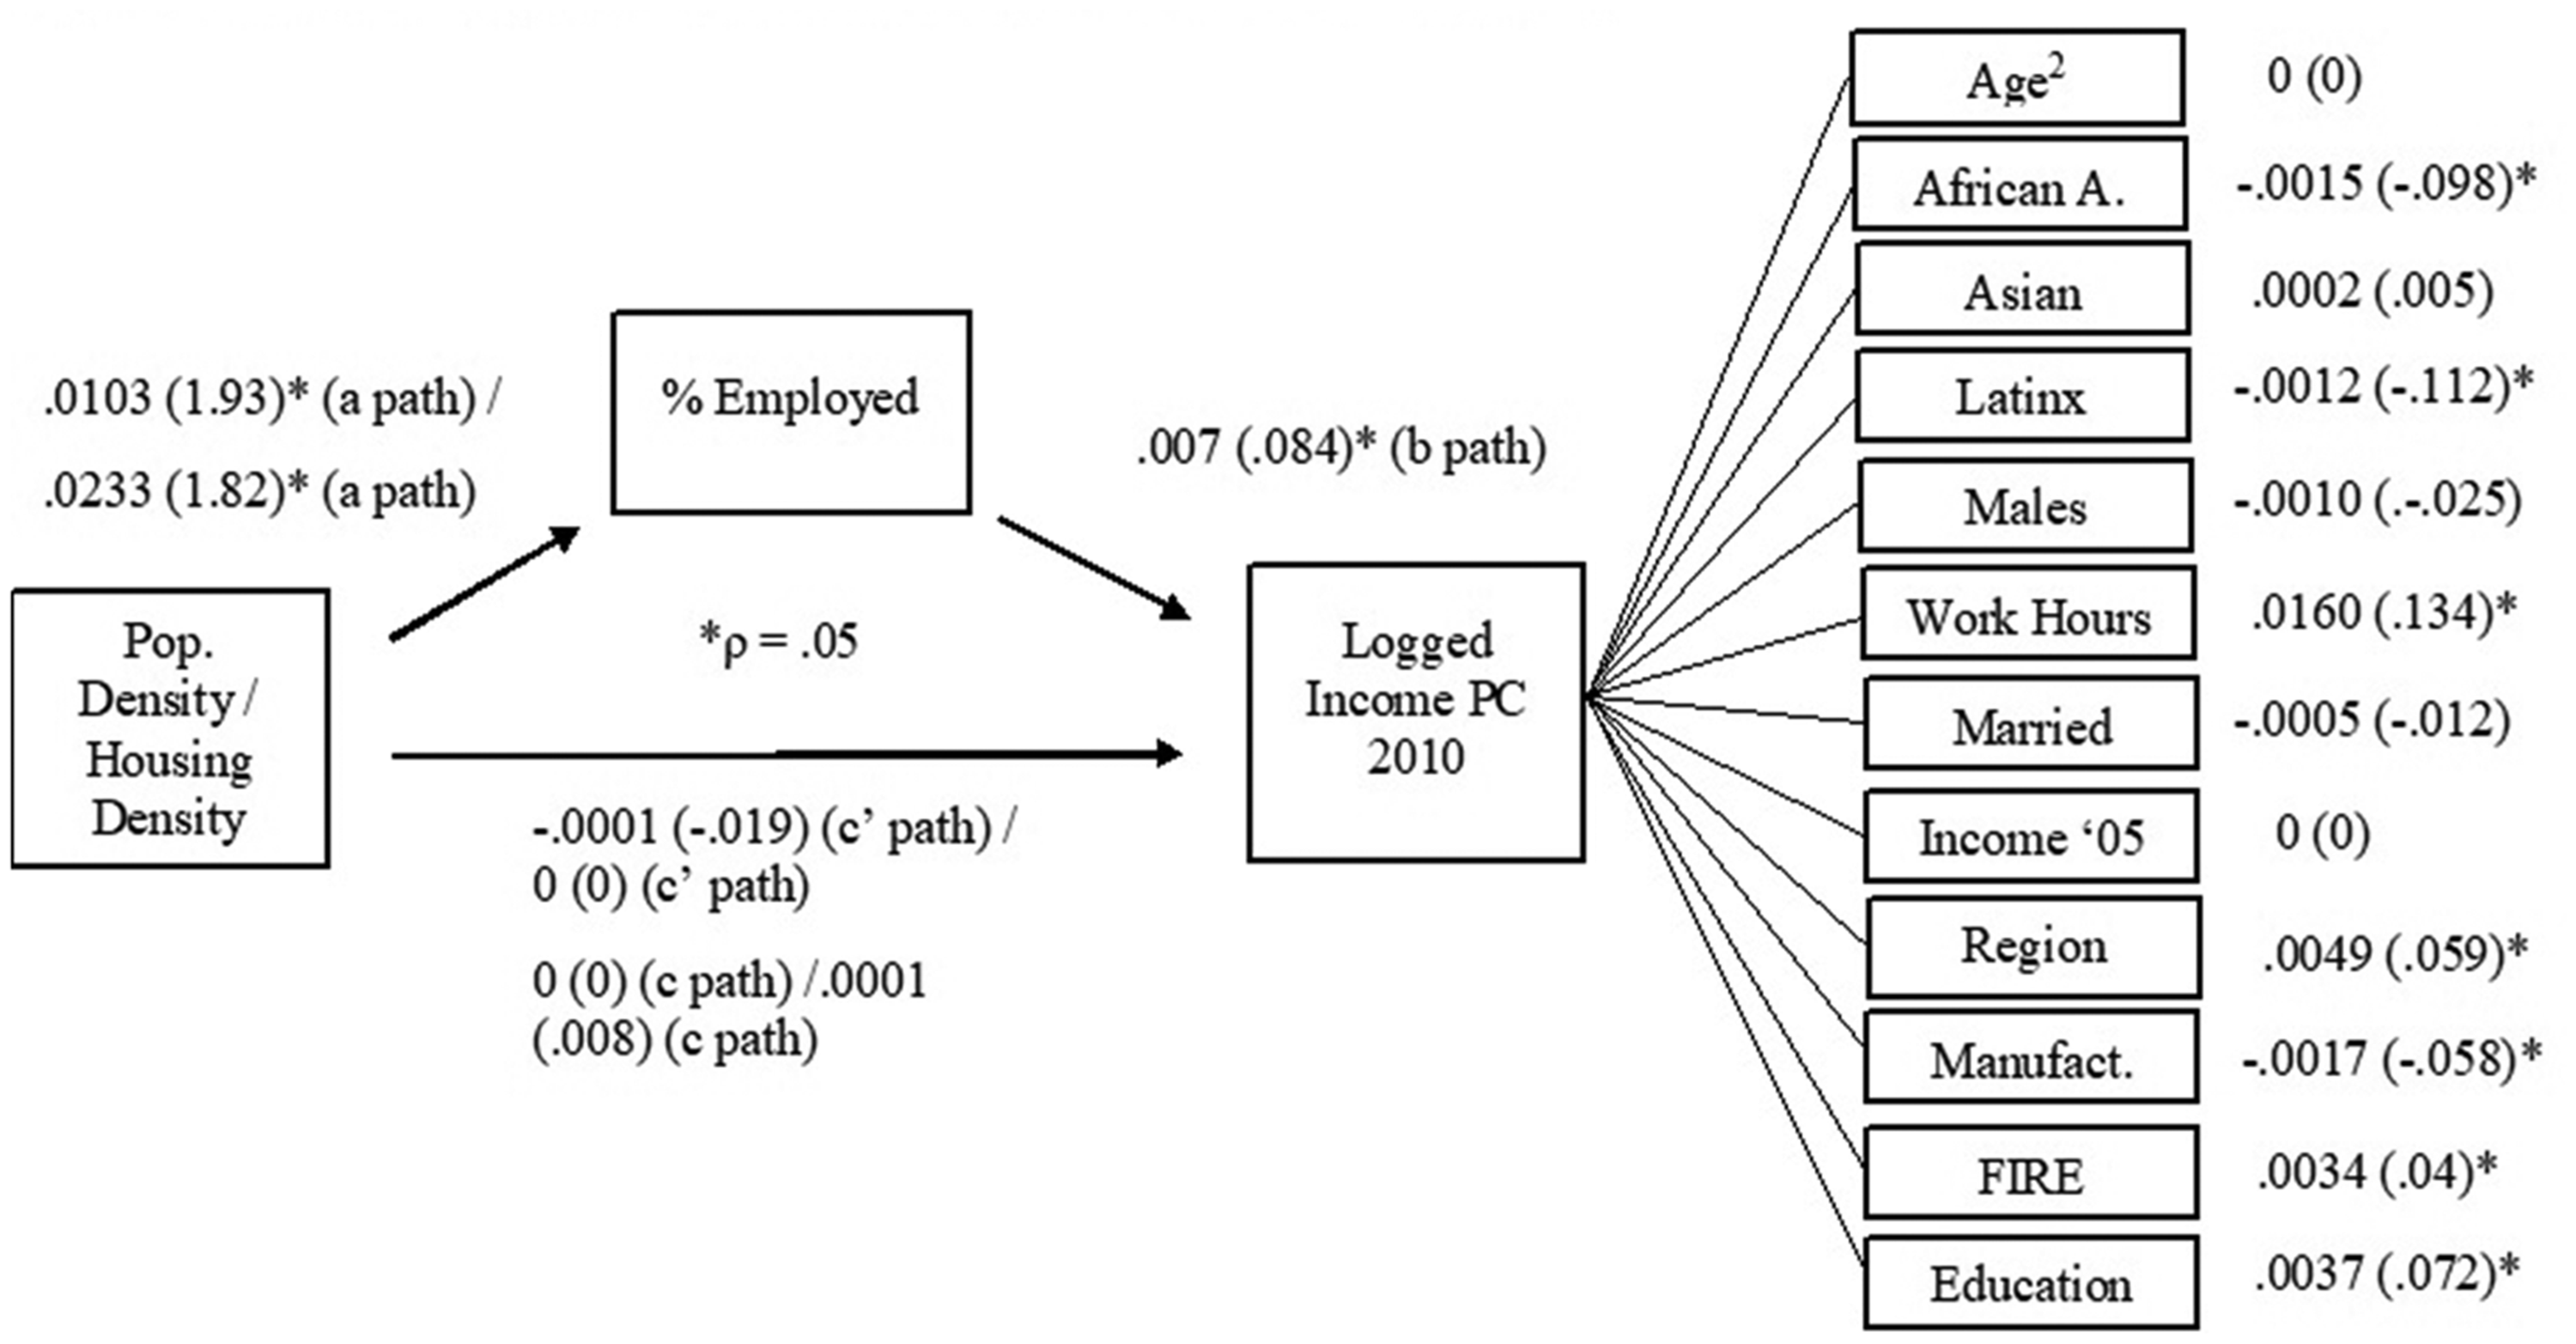
In Figure 1, a mediation diagram displays the regression coefficients and significance indicators for both population and housing densities with income per capita (2010) as the dependent variable. The relationship shown here is representative of the relationship for the other income variables and years. In Figure 1, “a path” (the relationship between the predictor and the mediator) is shown for both population and housing density in that order. Both predictors have a statistically significant relationship with the percentage employed variable. This relationship is positive as well.
Mediated regression results with population and housing density.
Based on the unstandardized beta, an increase of one more person per square mile (weighted) on average across the census tracts in a metropolitan area leads to a little more than a 1% increase in employment. An increase of one more house leads to a little more than a 2% increase in employment. The standardized beta is in parentheses. The standardized beta for population density is slightly larger than for housing density which is because the standard deviation for population density is higher.
The “b path” (the relationship between the mediator and the dependent variable) in Figure 1 also reveals a statistically significant relationship between employment and the natural logarithm of income per capita in 2010. The size of the effect is smaller than the effects of density on employment. A 1% increase in the percentage of those employed increases income per capita by .7%.
The direct and total effect (c′ path and c path, respectively) in Figure 1 is not significant for either population or housing density. The direct effect is the effect of the predictor (population or housing density) on the dependent variable while controlling for the mediator. The total effect is an estimate of the effect of the predictor on the dependent variable without the mediator. The insignificance of these effects means the relationship between population and housing density with income is mediated by employment.
A little more than half of the control variables are significantly related to income per capita. Unsurprisingly, the number of hours worked on average had the largest positive standardized effect on income. The size of the Latinx population had the largest negative standardized effect. Besides these control variables, the size of the African American population and the percentage of manufacturing employment had negative effects on income. An increase in education and the percentage in FIRE careers increased incomes. In addition, those states located in the West have significantly higher incomes than those in the East.
The mediation results including confidence intervals in parentheses and standard errors are shown in Table 2. In this table, the significance values are broken into different levels ranging from .05 to .0001. These are the same results reported in Figure 1, but with more details. Both population and housing density are equally significant predictors of the percentage employed (a path). Employment has a much higher significance with income per capita (b path).
Mediation regression results of main variables.
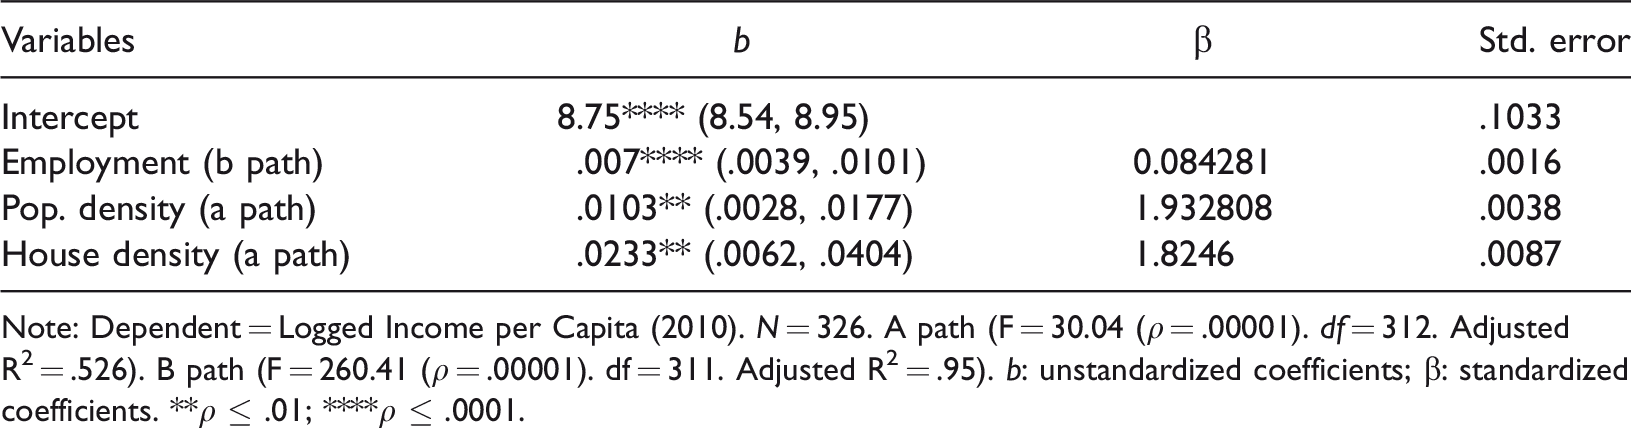
Note: Dependent = Logged Income per Capita (2010). N = 326. A path (F = 30.04 (ρ = .00001). df = 312. Adjusted R2 = .526). B path (F = 260.41 (ρ = .00001). df = 311. Adjusted R2 = .95). b: unstandardized coefficients; β: standardized coefficients. **ρ ≤ .01; ****ρ ≤ .0001.
The results with the control variables are shown in Tables 3 and 4. These are the same results reported in Figure 1, but with more details. Table 3 shows only the significant control variables. The most significant variables are the percentage African American and Latinx. The mean hours worked is also a very significant predictor of income. Table 4 shows the results for the insignificant control variables.
Mediation regression results of significant control variables.
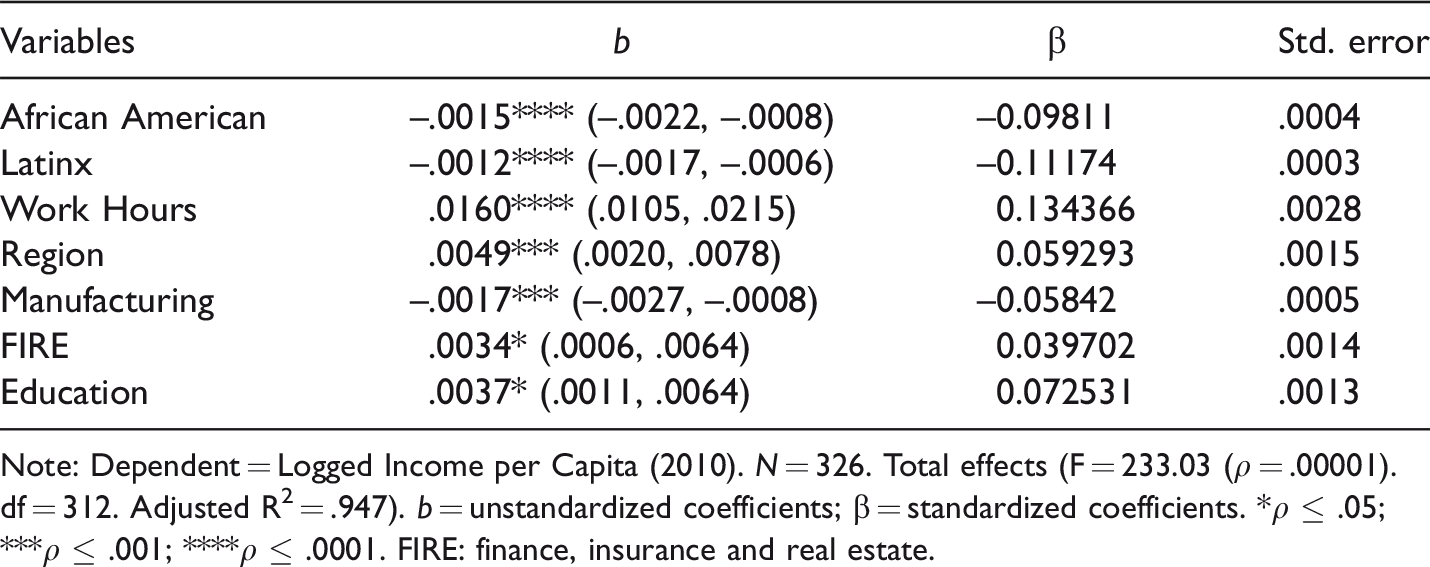
Note: Dependent = Logged Income per Capita (2010). N = 326. Total effects (F = 233.03 (ρ = .00001). df = 312. Adjusted R2 = .947). b = unstandardized coefficients; β = standardized coefficients. *ρ ≤ .05; ***ρ ≤ .001; ****ρ ≤ .0001. FIRE: finance, insurance and real estate.
Mediation regression results of insignificant control variables.
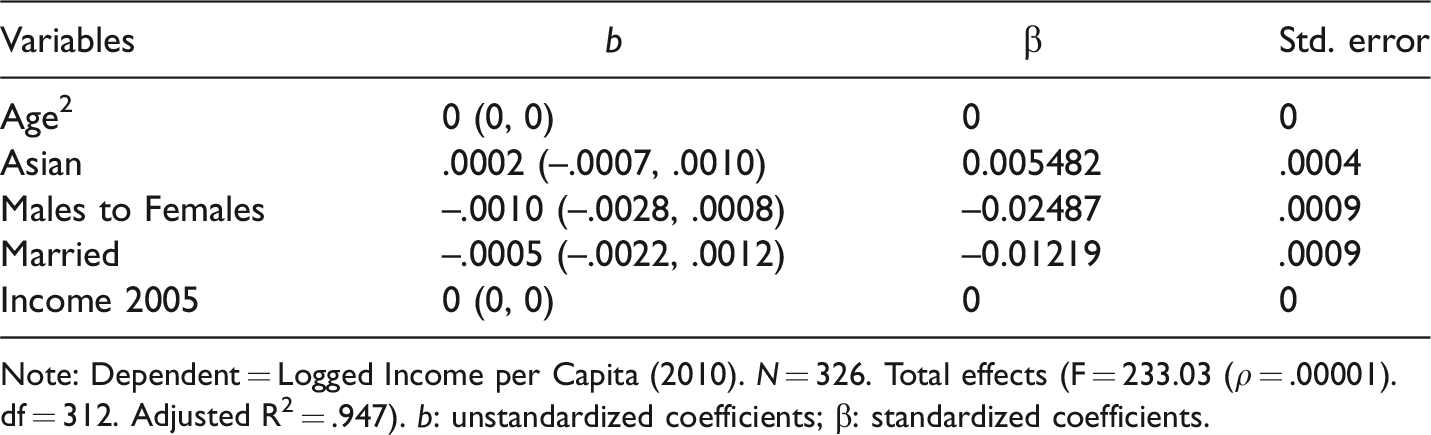
Note: Dependent = Logged Income per Capita (2010). N = 326. Total effects (F = 233.03 (ρ = .00001). df = 312. Adjusted R2 = .947). b: unstandardized coefficients; β: standardized coefficients.
The indirect effects for all income variables for population and housing density are shown in Tables 5 and 6. These tables show the size and significance based on the 95% confidence interval of the indirect effects of the predictor (density) on the outcome variable (income). In Table 5, the lagged values of income have higher coefficient values possibly indicating greater indirect effects of density over time. It can also be seen that the differences in the effects are not substantial between the different measures of income. These effects are all statistically significant at the .05 probability level. Based on the results for income per capita (2010), an increase of one person (weighted) per square mile on average across census tracts in a metropolitan area significantly increases income per capita indirectly by .03%.
Standardized indirect effects of population density.
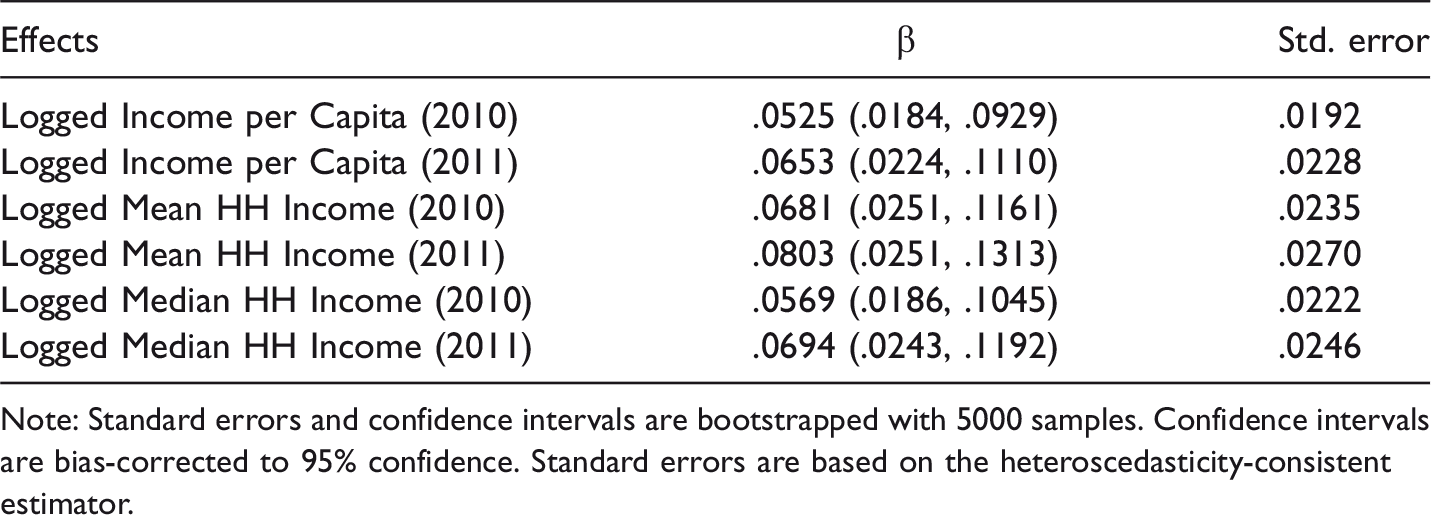
Note: Standard errors and confidence intervals are bootstrapped with 5000 samples. Confidence intervals are bias-corrected to 95% confidence. Standard errors are based on the heteroscedasticity-consistent estimator.
Standardized indirect effects of housing density.
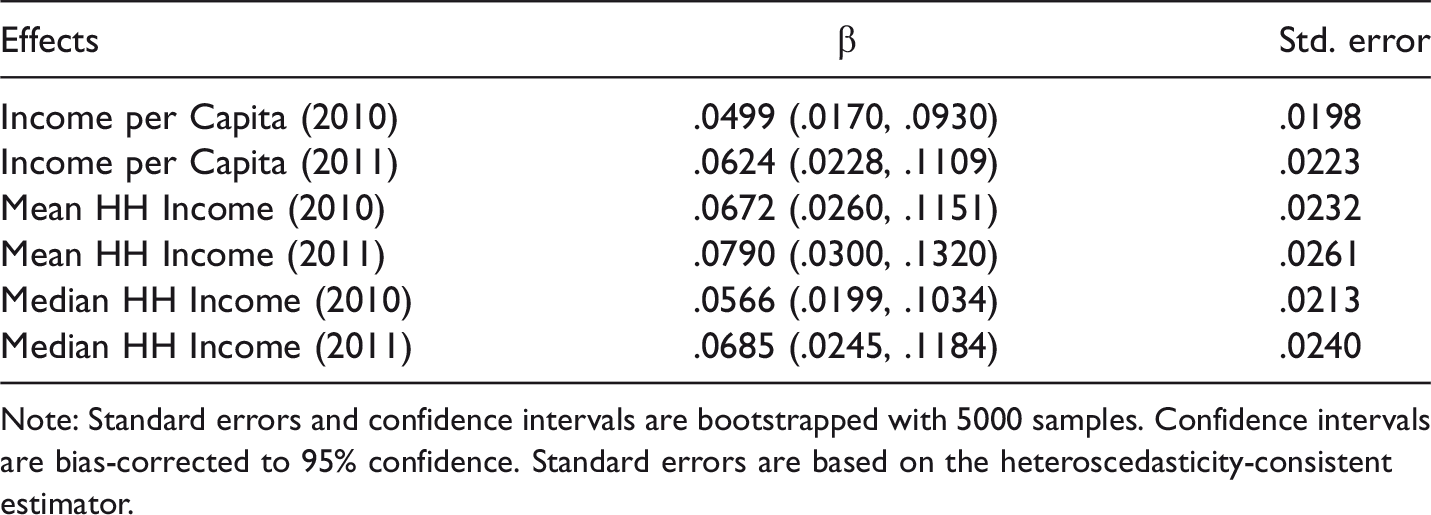
Note: Standard errors and confidence intervals are bootstrapped with 5000 samples. Confidence intervals are bias-corrected to 95% confidence. Standard errors are based on the heteroscedasticity-consistent estimator.
Table 6 shows that an increase of one house (weighted) per square mile on average across census tracts in a metropolitan area significantly increases income per capita indirectly by .06%. This is double the percentage impact of the population density variable albeit the standardized beta coefficient is still smaller for housing density. Similar to Table 5, the lagged effects are larger possibly indicating greater effects over time.
A quick summary of these results would be that there is a statistically significant indirect effect of population and housing density on income. These effects are significant while holding constant factors commonly associated with income. The impact of housing density is larger regarding the percentage changes in income; however, the standardized coefficient for population density is larger. These results are consistent across different measures of income and increase in size when lagged by one year. These results are analyzed in more detail in the following section.
Discussion
Returning to the research question, the results of this study support the notion that population and housing density are connected to incomes in metropolitan areas in the United States. This connection is indirect as the direct connections are not statistically significant with the size of the effects at or close to 0. The indirect connection is mediated through the significant effects of density on employment. This relationship survived controlling for commonly associated factors on income and testing the relationship through a lagged version of the dependent variable and a control for income in a previous year. The mediated relationship also does not exist in the opposite order with employment significantly predicting population or housing density.
The relationship between density and employment is positive indicating that an increase in population or housing density increases employment in a metropolitan area. The indirect relationship between density and income is also statistically significant and positive with a smaller impact. These relationships are constant across different measures of income and increase in effect when lagged by one year.
Housing density also appears to have a larger impact on employment and thereby incomes. These effects are reported as a change in one unit of density on percentage changes in income. Population density would be a change in one more weighted person on average per square mile in a census tract in a metropolitan area. Housing density would be a change in one more weighted house. The density of housing can be seen as a multiplier effect on the outcome of population density since an increase in housing in an area indicates an increase in the number of people multiplied by the average number of people per household. This is likely the reason that housing density doubles the indirect effect on incomes from population density. This is also why housing density is highly correlated with population density. A comparison of standardized betas between these two variables shows that population density has a larger impact on incomes than housing density when there is an increase in one standard deviation of these variables. The presence of houses does not matter as much as the presence of people for income changes.
These findings connect with the discussions in the literature. The assumptions of the connections between population density, knowledge exchange, capital formation, employment, and incomes have been explored in the literature. Concepts such as agglomeration and scaling rely on these assumptions for the analyses on these effects. This study also relies on these assumptions in exploring the possible links between population and housing density with incomes.
When comparing these effects with the significant control variables using logged income per capita (2010), the indirect effect of population density on incomes is not as large as the average hours worked, the types of industries, the region, educational background, or the racial factors. These factors have been frequently cited in the literature as the major influences on income outcomes so this result is not surprising. Despite controlling for these factors, population and housing density are still a significant factor in predicting incomes.
Although it is unlikely any planner will solely rely on a developing consensus that density matters for improving incomes to argue for increasing urban density through zoning residential areas, it could be one of the factors in a portfolio of reasons. As explored in the literature, there are cultural changes that are placing more emphasis on denser living particularly among the millennial population. This alone would be creating demand for designing denser neighborhoods. This also coincides with planning movements such as smart growth and smart decline which both emphasize denser development or restructuring.
This study contributes to an ongoing debate over urban density started by Jane Jacobs and continues to this day. It was recognized in Jacobs time as it is today that there are many benefits to urban density and there are many costs too. The relationship between urban density and income could have a quadratic relationship (inverted U) in which congestion eventually crowds out the benefits. Given the declining density gradients in the United States, it is unlikely this is a problem which is the reason this relationship is explored through a linear method in this study. If density is to increase in the future, it would merit regular study to define an optimal density level as Jacobs identified as existent, but unknown at that time. It is also possible that this optimal density is not definable and varies on a case by case basis.
These questions are not explored in this paper in which the effort here is to empirically explore assertions regarding the effects of population and housing density on incomes. It was found that these effects are indirect through the effects of urban density on employment. Further research is needed on this pertinent area including the expansion of the number of years of study which will be facilitated by the census in 2020.
Conclusion
This study is focused on the potential relationship between urban density and incomes in the United States. This association is based on studies in urbanization economies and the density–productivity nexus which argue that an increase in density increases social output such as wealth and income. In summary, it is assumed that there are returns to size and density. Proximity is important as ideas, skills, and opportunities are exchanged fueling city vitality.
This paper filled some gaps in this research by including nearly all the metropolitan areas in the United States with weighted and averaged population and housing density variables and including controls based on the literature in labor economics. In addition, a mediation approach was adopted to analyze these associations, which has not been used in previous studies on the topic.
The findings in this study support the growing consensus in the literature that urban density is important for income growth. This relationship is indirect through its significant effects on employment and the effect of employment on income. The causal direction is from urban density to employment to incomes. The effects are all significant and positive.
Although this study was comprehensive in its approach, there is always the risk of omitted variable bias. There are many causal factors for income growth besides the most important factors that were included as control variables here. The number of these control variables was limited in this study to avoid over-fitting the model which is another risk toward biasing the results. The use of principal components is one method to overcome this, but it obscures the individual effects of variables.
There is also contention over methods of measurement particularly for measuring urban density. The approach employed in this study relies on land area in square miles and the number of people and houses within it. There are other approaches to measuring density that may yield different results. The method used in this study is simple and easy to understand. It is also built around the data that are collected by the Census.
One might also disagree with the unit of analysis, i.e. metropolitan statistical areas. Urban areas can be defined by their legal boundaries, the urbanized area or the Census-defined metropolitan statistical areas. Methods that employ time-series data avoid metropolitan statistical areas and legal boundaries because they change over time. This study is cross-sectional so these changes are not prevalent. There is also some that argue that defining the unit of analysis differently does not lead to different levels of density (Bryan et al., 2007).
The time period could also be a point of critique. A cross-sectional analysis even with a large sample is still not as comprehensive as a time-series analysis. In this case, this study provides a snapshot in time which may not capture the effects over longer time periods. A more comprehensive follow-up study over multiple time periods would provide a clearer picture of these relationships.
It should also be stressed along with these findings that urban density does not mean over-crowding which can negatively affect city services and opportunities. The elusive concept of optimal density will rely on performance assessment to determine the point at which social benefits equal social costs. Specifically, for income growth, density will likely be optimized via a concentration of educated residents as this will affect employment opportunities in well-paying fields. This has several implications for local economic development and its propensity for social change.
Density is only one part of the local economic development puzzle. As revealed in this analysis, there are other factors that are more important for determining returns in income. The determining racial factors mean that institutional and historical limitations on some racial groups, particularly people of color, stunt the growth in income that may occur from the co-location of people and homes. The segregation of people is a part of this, which complicates the social output equation.
There are several implications from this analysis. The first implication is the need for urban density to be as inclusive as possible so that benefits accrue across economic classes. The need for concentrations of educated residents does not mean that gentrification is the answer. The city, state and federal governments can and should invest in education in these places. This is the argument of Berube and Murray (2018) who observed that proximity to markets and the clustering of jobs are important for increasing prosperity. According to the authors, prosperity reflects the degree to which economic opportunity is accruing to the average worker and household in a local area. In this sense, it measures “quality” of growth. An economy can expand by adding inputs (e.g. population and workers), but see its prosperity decline if that growth doesn’t result in higher-value, higher-paying jobs and increased income for its residents. (Berube and Murray, 2018: 28)
The second implication is that urban density must not prohibitively drive up housing costs or drive down the quality of life. Cities must ensure adequate levels of affordable housing while increasing mobility and other urban investments. This is a balancing act since urban investments rely on local taxation which is mostly based on property taxes. This again incentivizes exclusionary economic development planning to raise property values.
The third implication is understanding the local context. Although this study is a large-N aggregate study of metropolitan areas in the United States at a specific time, productivity and thereby incomes vary by city depending on very localized factors. A solid foundation may exist through optimal levels of urban density that may be true across any jurisdiction, but there are many important questions that local economic development planners should consider when trying to maximize their efforts to improve the local economy and social welfare. Besides having a healthy understanding of what cannot be controlled, these planners should also consider the elements of the social output equation. There should be thought on how many people should occupy a space, how much of that space should be available, how much interaction can be facilitated within that space, and how is mobility encouraging or discouraging that interaction. There may be varied answers to these questions with different outcomes often dependent on local context.
Contextual factors aside, there is a core recognition that the built environment matters for local prosperity. The improvement of incomes is one performance assessment of this environment. This study found a relationship between urban density and income mediated by improved employment. If the co-location of people and residences impact employment in a city then these cities should be planning for greater density.
Footnotes
Declaration of Conflicting Interests
The author(s) declared no potential conflicts of interest with respect to the research, authorship, and/or publication of this article.
Funding
The author(s) received no financial support for the research, authorship, and/or publication of this article.