
Abstract
Purpose: This paper aims to analyze how sustainability is measured and verified in local territorial projects funded by European, national, and regional resources. Although the supranational and national levels promote the integration of sustainability principles, their actual verifiability at the local level often relies on indicators that are poorly structured or entirely absent. Methodology: The study adopts a qualitative approach based on a multiple case study design, conducted exclusively through desk analysis of the 2021,2027 European programming period. The Amministrazione Trasparente section or OpenBilanci are both sources of data, as well as project-level data extracted from OpenCoesione and strategic planning documents released by individual municipalities. Three municipalities from the Lazio Region (C1, C2, and C3) are included in the sample, which is categorized by demographic size according to ISTAT data and picked based on transparency, data availability, and project traceability. The analysis develops in three stages: classification of projects according to the three dimensions of sustainability; mapping and evaluation of performance indicators (KPIs) reported in public documentation; and identification of potential greenwashing risks through the linkage between identified KPIs (or their absence) and funded projects.
Keywords
Key contributions of the paper
The paper shifts attention from sustainability rhetoric to the actual capacity of municipalities to demonstrate sustainability through measurable indicators in EU-, national-, and regionally funded projects.
Contrary to the dominant literature, the study examines municipalities of different sizes, revealing structural weaknesses in sustainability measurement not only in large cities but also in ordinary local administrations.
The paper’s theoretical originality lies in treating the lack of quantitative KPIs not as a methodological limitation but as an empirical outcome that signals weak accountability and potential greenwashing.
The study introduces an approach that links sustainability indicators, individual funded projects (CUP), and planning and reporting documents, highlighting fragmentation between expenditure, objectives, and results.
Greenwashing is conceptualized as the gap between institutional sustainability claims and verifiable outcomes, showing how it can arise even in formally transparent local governance systems.
The paper proposes a comparative framework that allows researchers and practitioners to assess KPI quality, link results to individual projects, and estimate greenwashing risk, with potential applicability across national and European contexts.
Introduction
The concept of sustainable development originated in 1987 with the well-known Brundtland Report (Our Common Future), which defined it as “development that meets the needs of the present without compromising the ability of future generations to meet their own needs” (World Commission on Environment and Development, 1987). The European Union launched its first sustainability policies in 1987 through the Single European Act, making a formal commitment to protecting the environment, human health, and natural resources (European Communities, 1987). This approach established the regulatory and political framework for sustainability practices at both national and local levels. The governance of states, regions, and municipalities is influenced by decisions taken at the supranational level, and it is the responsibility of local authorities to translate strategies into concrete actions (Eurostat, 2017). Hooghe and Marks (2001) highlighted this as a paradigmatic example of multilevel governance.
European Union environmental policy is based on four core principles: (i) the precautionary principle, which calls for early intervention to prevent irreversible environmental damage; (ii) preventive action, aimed at reducing risks and anticipating potential harm; (iii) the correction of pollution at source, requiring direct action on its primary causes; and (iv) the “polluter pays” principle, which assigns environmental costs to those responsible for pollution, discouraging harmful behavior by firms and private actors (European Commission, 2019). The need for reporting and verification tools throughout the entire institutional chain is highlighted by these principles.
The 2030 Agenda for Sustainable Development, which was adopted by 193 United Nations Member States in 2015, embodies this framework in its entirety, containing 17 Sustainable Development Goals (SDGs) and 169 specific targets. While the Agenda establishes common objectives at the international level (Membrillo-Hernández et al., 2021), it requires adaptation to territorial contexts—the so-called “localization of the SDGs,” which today represents one of the most significant challenges for municipalities (Sachs et al., 2019; Global Taskforce of Local and Regional Governments).
Within the European Union, the 2030 Agenda is implemented through political and financial instruments, including the Structural Funds and the European Green Deal, introduced in 2019. The Green Deal’s goal is to achieve climate neutrality by 2050 by incorporating environmental sustainability in sectors including industry, tourism, construction, finance, and social inclusion (European Parliament, 2024).
At the national level, the National Strategy for Sustainable Development (SNSvS) identifies five priority macro-areas, related but not identical to the SDGs, commonly referred to as the “5Ps”: Peace, Prosperity, People, Planet, and Partnership (Ministry of Environment and Energy Security, MASE). Within this framework, the National Recovery and Resilience Plan (NRRP/PNRR) represents the primary instrument for supporting the ecological and digital transition in the post-pandemic period, with over €194 billion in allocated resources (Department for Cohesion Policies and for the South, Presidency of the Council of Ministers).
Despite a well-structured political and strategic framework at international, European, and national levels, significant challenges remain regarding the verifiability and measurability of sustainability claims made by local authorities, with a consequent increase in the risk of greenwashing, as noted by Nemes et al. (2022) and De Freitas Netto et al. (2020). This risk is particularly pronounced at the local level, where sustainability measurement and verification are often fragmented, making it difficult to distinguish genuine commitment from purely environmental rhetoric (Tang et al., 2020).
Existing academic research has largely focused on greenwashing risks in large cities and large-scale projects, neglecting medium- and small-sized municipalities. In Italy, however, these municipalities account for approximately 70% of the institutional landscape and play a crucial role in achieving the Sustainable Development Goals (Bulkeley and Betsill, 2005).
Against this backdrop, the present study examines the extent to which sustainability claims in publicly funded projects are effectively measured and verified through the identification of KPIs in documents published in the Amministrazione Trasparente section and in financial data available from OpenBilanci and BDAP. The study treats the presence or absence of KPIs as an outcome in itself, capable of revealing the risk of greenwashing. The analysis focuses on three municipalities in the Lazio Region, grouped by demographic size based on ISTAT data: large (C1), medium (C2), and small (C3).
The research adopts a multiple case study design (Yin, 2018), allowing comparison across different contexts while maintaining methodological rigor. The analysis is based exclusively on desk research (Bowen, 2009) of publicly available documents produced by the municipalities and refers to the most recent European programming period (2021, 2027). The study addresses the following research questions. RQ1: To what extent are sustainability claims in local public projects supported by clear, measurable, and comparable indicators? RQ2: What audit practices and control mechanisms do municipalities adopt to ensure transparency and accountability in sustainability claims? RQ3: How can greenwashing risks be identified in institutional communication on sustainability at the municipal level?
The study has several limitations. It relies solely on desk analysis and therefore does not include interviews or direct observation, and the sample is limited to three cases located in the Lazio Region. Nevertheless, the chosen approach makes it possible to link the absence of KPIs to greenwashing risk through an evaluation scale developed on the basis of the ordinal scale proposed by Yin (2018) and the metrics adopted by Vicente et al. (2013), which can also be applied in other contexts.
In conclusion, the analysis contributes to the literature by incorporating medium- and small-sized municipalities, in contrast to existing studies that usually concentrate on large urban centers. The paper’s structure includes four main sections: a literature review, methodology, analysis of results, and discussion and conclusions.
Literature review
In the 1970s, the concept of sustainability was introduced by the Club of Rome’s The Limits to Growth (Meadows et al., 1972), which first highlighted the ecological limitations of economic growth. The most widely cited definition, however, remains that provided by the United Nations’ Brundtland Report (1987), which defines sustainability as the ability to meet the needs of the present generation without compromising the ability of future generations to meet their own needs (World Commission on Environment and Development, 1987). Sustainability has been closely tied to the need for monitoring and evaluation tools, which today are a crucial element in assessing its verifiability in municipal projects. The literature continues to debate the relationship between concept and measurement.
In 1992, the Rio de Janeiro Earth Summit introduced Agenda 21, the first global action plan to address environmental issues through international cooperation (United Nations, 1992). In 2002, the Johannesburg Summit expanded the definition of sustainability to include social and economic dimensions (United Nations). Adopted in 2015, the 2030 Agenda for Sustainable Development is the most comprehensive framework for sustainable development ever (United Nations, 1992). Public administrations must adapt the Agenda to local contexts, even though it establishes common objectives at the international level (Membrillo-Hernández et al., 2021). This process—known as the “localization of the SDGs” (Sachs et al., 2019; Global Taskforce of Local and Regional Governments)—is central to sustainability verifiability, as it determines the ability of local authorities to translate theoretical goals into concrete actions (Nemes et al., 2022; OECD, 2008).
The literature identifies three main challenges related to the localization of the SDGs: (i) the conceptual ambiguity of the goals, which allows for divergent interpretations (Ulmer et al., 2023); (ii) operational difficulties, whereby governments tend to reframe existing programs under the sustainability label while avoiding genuinely transformative projects (Annan-Aggrey and Arku, 2023); and (iii) institutional uncertainty in coordinating national and European plans (Krantz and Gustafsson, 2021).
Publicly funded projects pose challenges for municipalities in translating general objectives into concrete and measurable KPIs, which are crucial for evaluating actual outcomes. These limitations highlight that sustainability cannot remain a purely declarative principle at the local level, but requires measurement tools, particularly in funded projects where measurability is a fundamental condition for ensuring accountability.
At the European level, the path towards sustainability was further strengthened by the adoption of the European Green Deal in 2019, which aims to achieve climate neutrality by 2050 (European Commission, 2019). This strategy utilizes a multilevel governance approach, in which national and local governments translate and implement European policies. EU funds given to local authorities can act as a testing ground to ensure that sustainability principles are translated into concrete and measurable results through reporting (Hooghe and Marks, 2001).
Sustainability reporting in public and private organizations is currently under the guidance of several international standards. Among the most relevant are the Global Reporting Initiative (GRI), ISO 14001, the Eco-Management and Audit Scheme (EMAS), the European Sustainability Reporting Standards (ESRS), and the EU Corporate Sustainability Reporting Directive (CSRD). GRI is the most widely adopted framework among public organizations, as it provides a system of performance indicators capable of reflecting the impacts of environmental policies and enhancing transparency (Anh, 2023; Ramos et al., 2021).
Similarly, ISO 14001 offers a reference framework for environmental management systems, enabling public administrations to strengthen their practices and ensure regulatory compliance (Appannan et al., 2022). At the European level, the CSRD and ESRS impose stringent reporting obligations, requiring public and private entities to disclose comprehensive and relevant information on their environmental and social performance (Bryan, 2021). Finally, Environmental Management Accounting (EMA) promotes greater environmental awareness within public organizations by allowing more accurate monitoring of sustainability-related costs and resources (Javed et al., 2022).
Although these international standards could serve as valuable methodological references for ensuring transparency and verifiability in funded projects, in Italian municipalities they rarely translate into concrete and measurable indicators (Hooghe and Marks, 2001), making the evaluation of sustainability particularly challenging.
The limited applicability of these standards results in the absence of operational KPIs within funded projects, leading to two main consequences: resource dispersion and the production of reporting documents with a merely formal character.
At the national level, sustainability measurement becomes a central issue with the National Recovery and Resilience Plan (NRRP/PNRR). The PNRR represents the primary instrument for supporting the ecological and digital transition in the post-pandemic period, with over €194 billion allocated within a very short timeframe (Department for Cohesion Policies and for the South, Presidency of the Council of Ministers). The rapid disbursement of financial resources, if not accompanied by adequate audit and monitoring practices, risks generating institutional greenwashing—territorial actions that appear “green” but lack empirical evidence (De Freitas Netto et al., 2020; Liu, 2025; Nemes et al., 2022).
Several studies have begun to examine the phenomenon of institutional greenwashing. Tang et al. (2020) documented cases in which local governments in China disseminated misleading information. Liu (2025) highlighted how such practices were facilitated by limited citizen participation, while Kolcava (2023) emphasized that the rise in greenwashing practices has increased demand for stricter regulation.
These findings indicate that greenwashing risks represent an increasingly significant challenge for local administrations managing publicly funded projects—a challenge also evident in the Italian context, which is characterized by similar issues (Argentiero et al., 2020). This difficulty is closely linked to structural limitations in public-sector auditing, which the literature distinguishes from corporate auditing on three main grounds: auditor independence, conflicts of interest, and the role of oversight authorities.
First, auditor independence in the public sector may be compromised by political and relational pressures, thereby reducing audit effectiveness (Kaur and Lodhia, 2019). Second, conflicts of interest arise from auditors’ need to maintain favorable relationships with government officials or other influential actors, undermining the credibility of the entire audit process—an issue of particular concern when public resources are involved (Dzomira, 2020). Finally, oversight activities are often constrained by limited resources and the broad scope of responsibilities assigned to supervisory bodies, resulting in gaps in monitoring mechanisms (Bradley et al., 2022).
In summary, the literature has clarified the importance of sustainability measurement, highlighted the limited application of international standards at the municipal level, and documented the risks of institutional greenwashing. However, a systematic analysis of the presence and quality of KPIs in municipal documents related to funded projects—and their relationship with audit practices and symbolic reporting risks—remains largely absent.
Methodology
The study utilizes a qualitative approach that utilizes multiple case studies (Yin, 2018) and exclusively conducts desk analysis regarding the 2021,2027 European programming period (Bowen, 2009). The sources analyzed include budgetary documents available on OpenBilanci (https://openbilanci.it), project-level data from OpenCoesione (https://opencoesione.gov.it/it/dati), and official documentation was published in the Amministrazione Trasparente section of institutional websites. These documents include the Documento Unico di Programmazione (DUP), the Piano Esecutivo di Gestione (PEG), the Piano Operativo di Gestione (POG), the Sustainability Action Plan, and the Objectives Plan.
The analysis covers the entire 2021–2027 European programming period and includes all officially published and publicly available documents from the aforementioned sources, without applying exclusion criteria. Data are treated as multi-year aggregates and are not disaggregated on an annual basis.
The methodological approach aims to assess the extent to which the absence of quantitative KPIs hinders the measurement of sustainability outcomes in funded projects and how this gap may be linked to greenwashing risks. In particular, the analysis considers three categories of expected KPIs: environmental (e.g., CO2 reduction, increases in separate waste collection, and expansion of green areas), social (e.g., number of beneficiaries reached, creation of community services, and reduction of inequalities), and economic-financial (e.g., allocated resources, actual expenditure, and consistency between funds received and declared results) (Akomea-Frimpong et al., 2024).
The presence or absence of KPIs is examined in relation to institutional documents. Comparing stated objectives with available data enables the identification of potential signals of greenwashing.
The sample consists of three municipalities in the Lazio Region (C1, C2, and C3), classified by demographic size based on ISTAT data and selected for transparency, data availability, and project traceability. The choice to analyze three municipalities reflects the need to capture differences in administrative capacity and audit mechanisms related to institutional size.
The study develops in three phases. In the first phase, funded projects identified in OpenCoesione were classified according to the three dimensions of sustainability (environmental, social, and economic-financial), in line with the “triple bottom-up” model (Correia, 2019).
The second phase involved mapping and evaluating sustainability indicators that were reported in municipal documents. The assessment of indicators is guided by the principles of clarity (the ability to formulate clear objectives) and measurability (the use of quantitative elements, like targets and numerical values), according to OECD guidelines (OECD, 2008). In order to make interpretation easier, a visual dot-scale was adopted, based on the framework proposed by Bell and Morse (2008), which allows for different levels of indicator robustness to be assigned.
In the third and final phase, the identified KPIs (or their absence) were linked to funded projects in order to verify whether declared sustainability outcomes were actually achieved and to identify potential greenwashing risks (De Freitas Netto et al., 2020; Ríos et al., 2024).
The comparative model linking funded projects to the presence or absence of KPIs in public documentation builds on key contributions in the sustainability and greenwashing literature (De Freitas Netto et al., 2020; Nemes et al., 2022; Tang et al., 2020). The methodological pathway is further clarified by the conceptual summary diagram presented in Figure 1. Conceptual framework linking KPIs, funded projects, and greenwashing risk. Source: Author’s elaboration.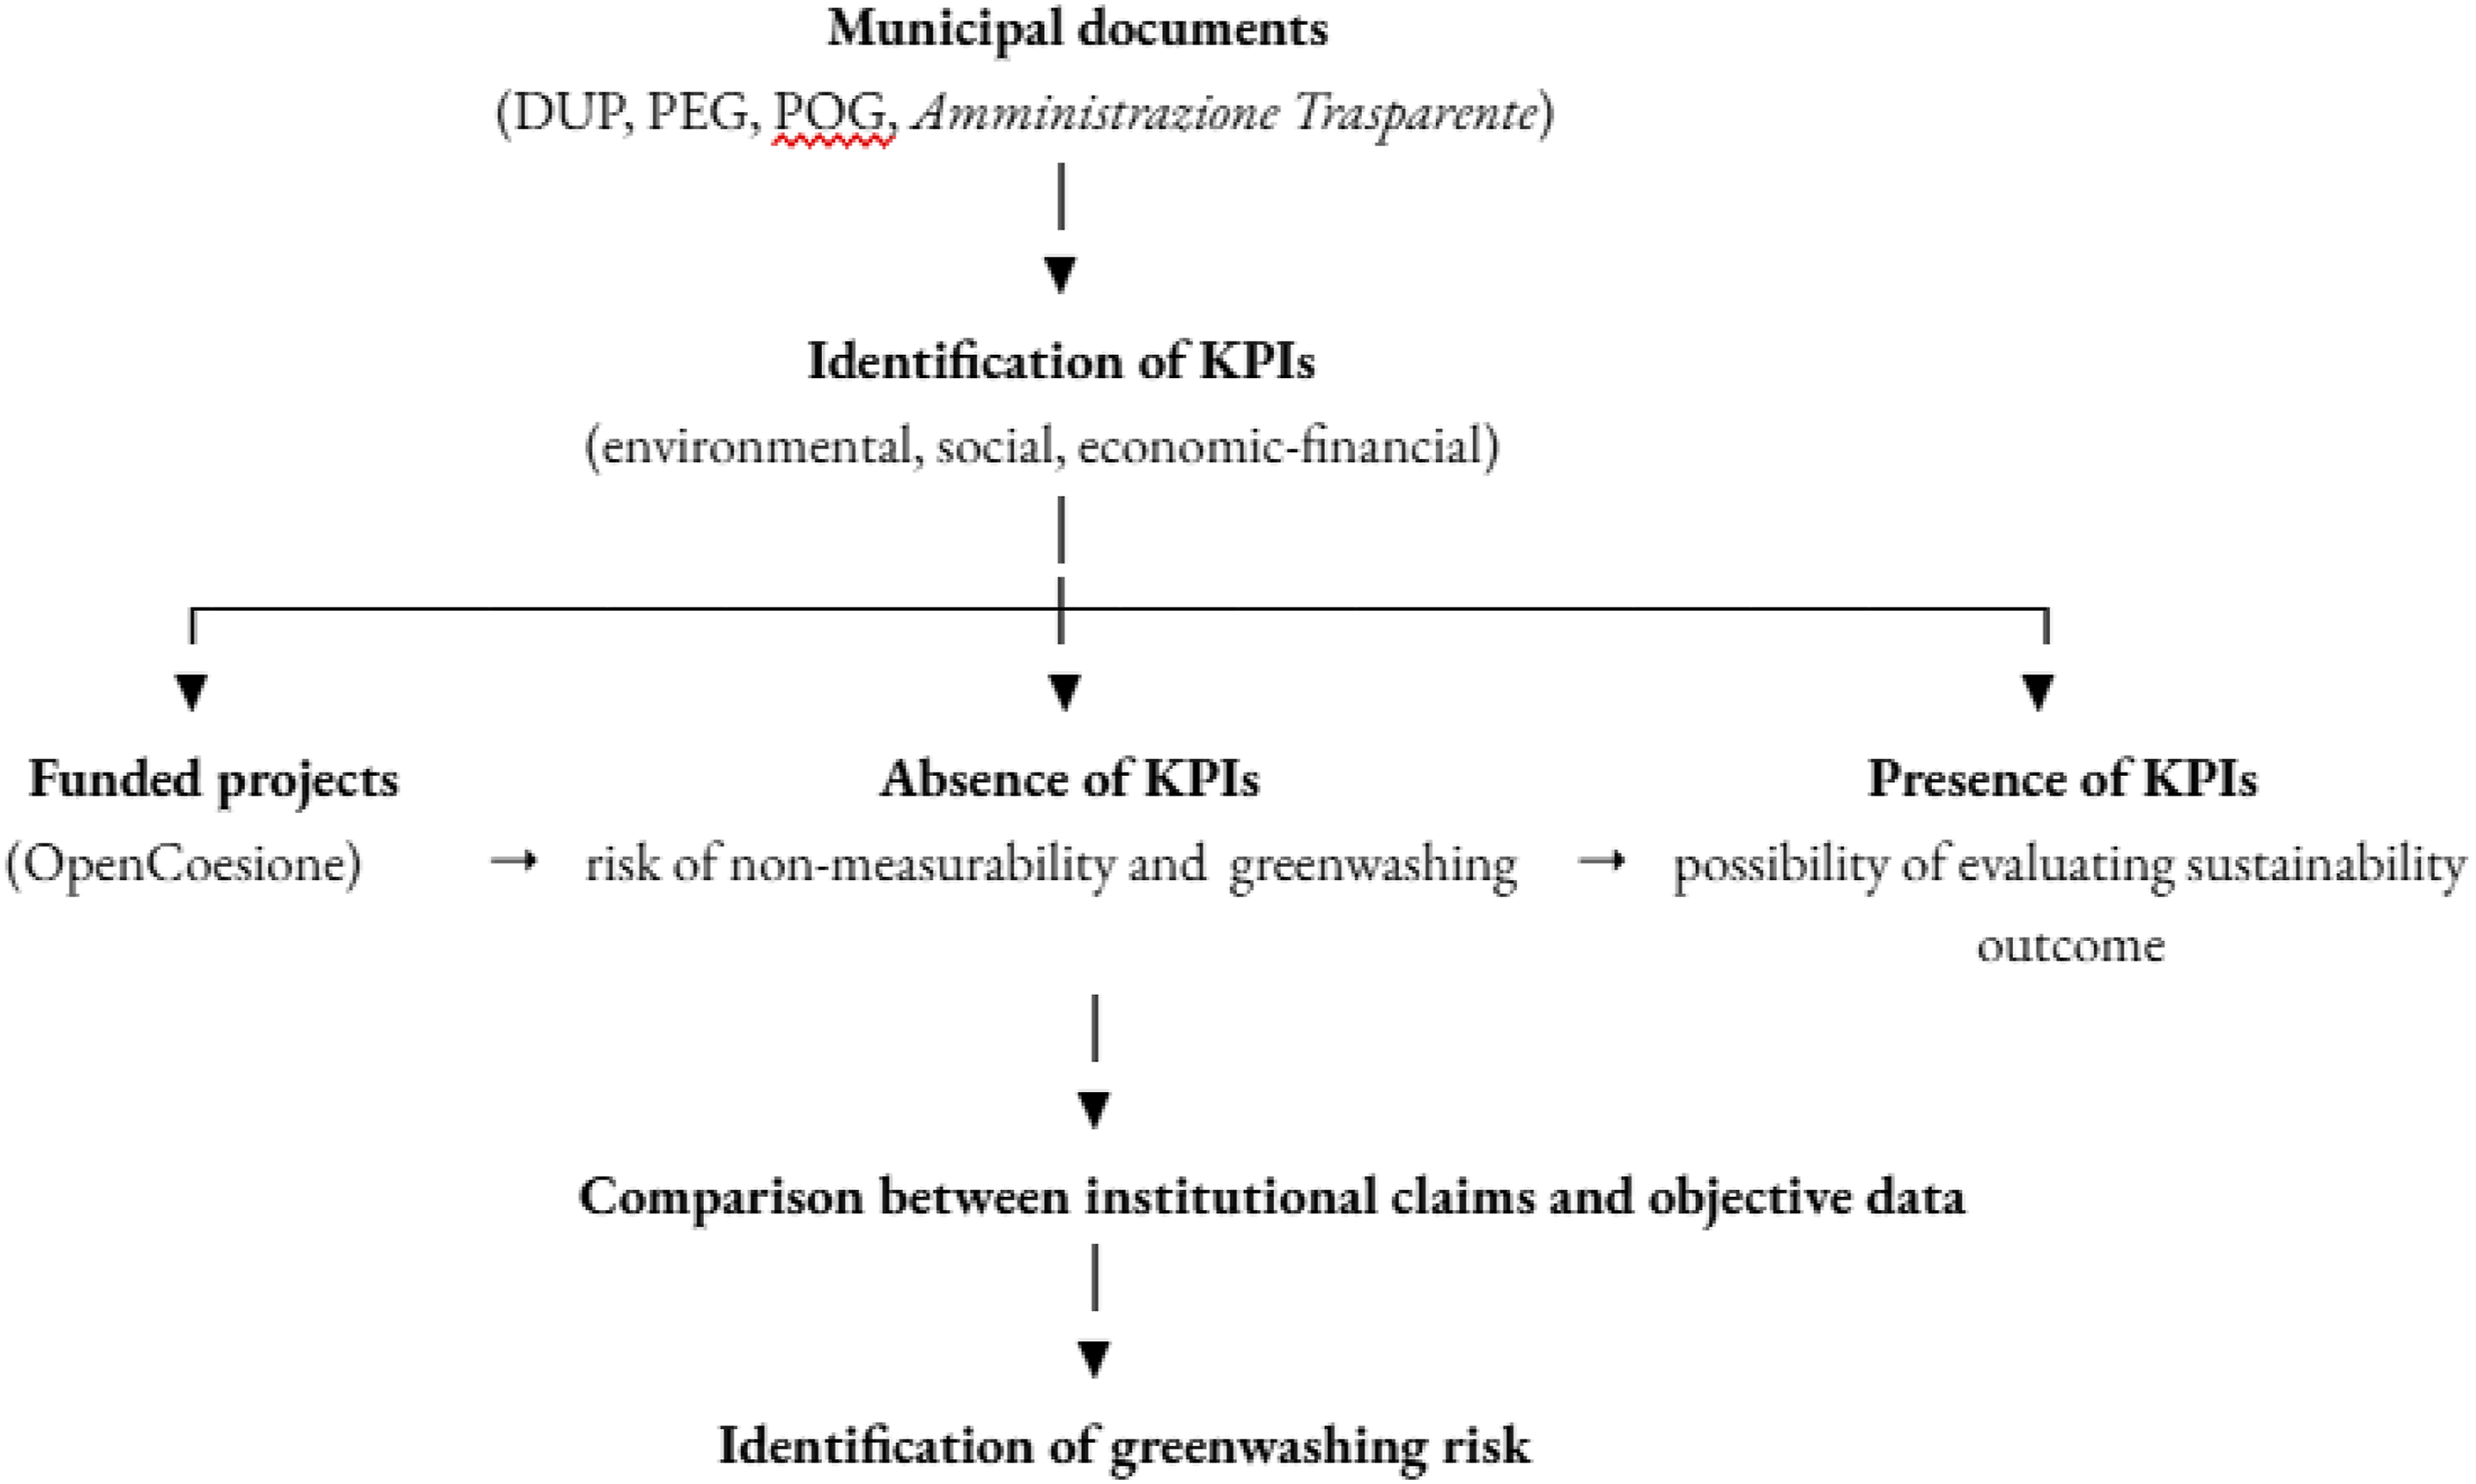
Results
Identification and classification of funded projects on OpenCoesione
Distribution of funded projects by sustainability dimension in the Municipalities of C1, C2, and C3.
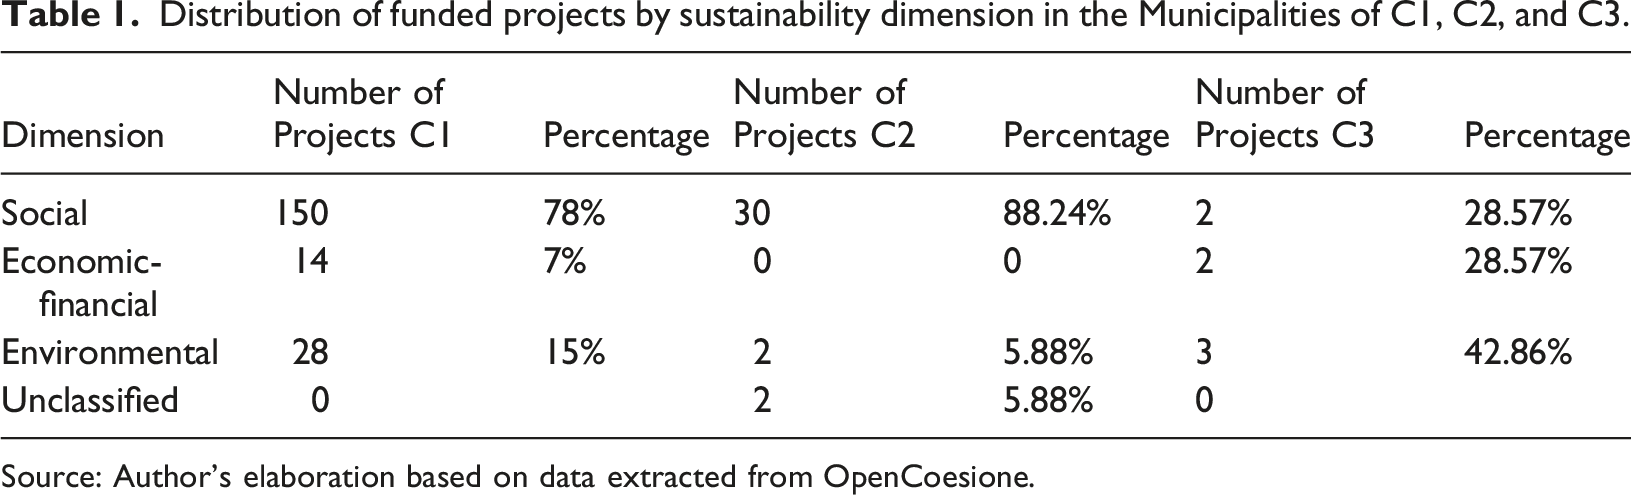
Source: Author’s elaboration based on data extracted from OpenCoesione.
Sustainability indicators of the Municipality of C1: clarity and measurability (2021,2027).
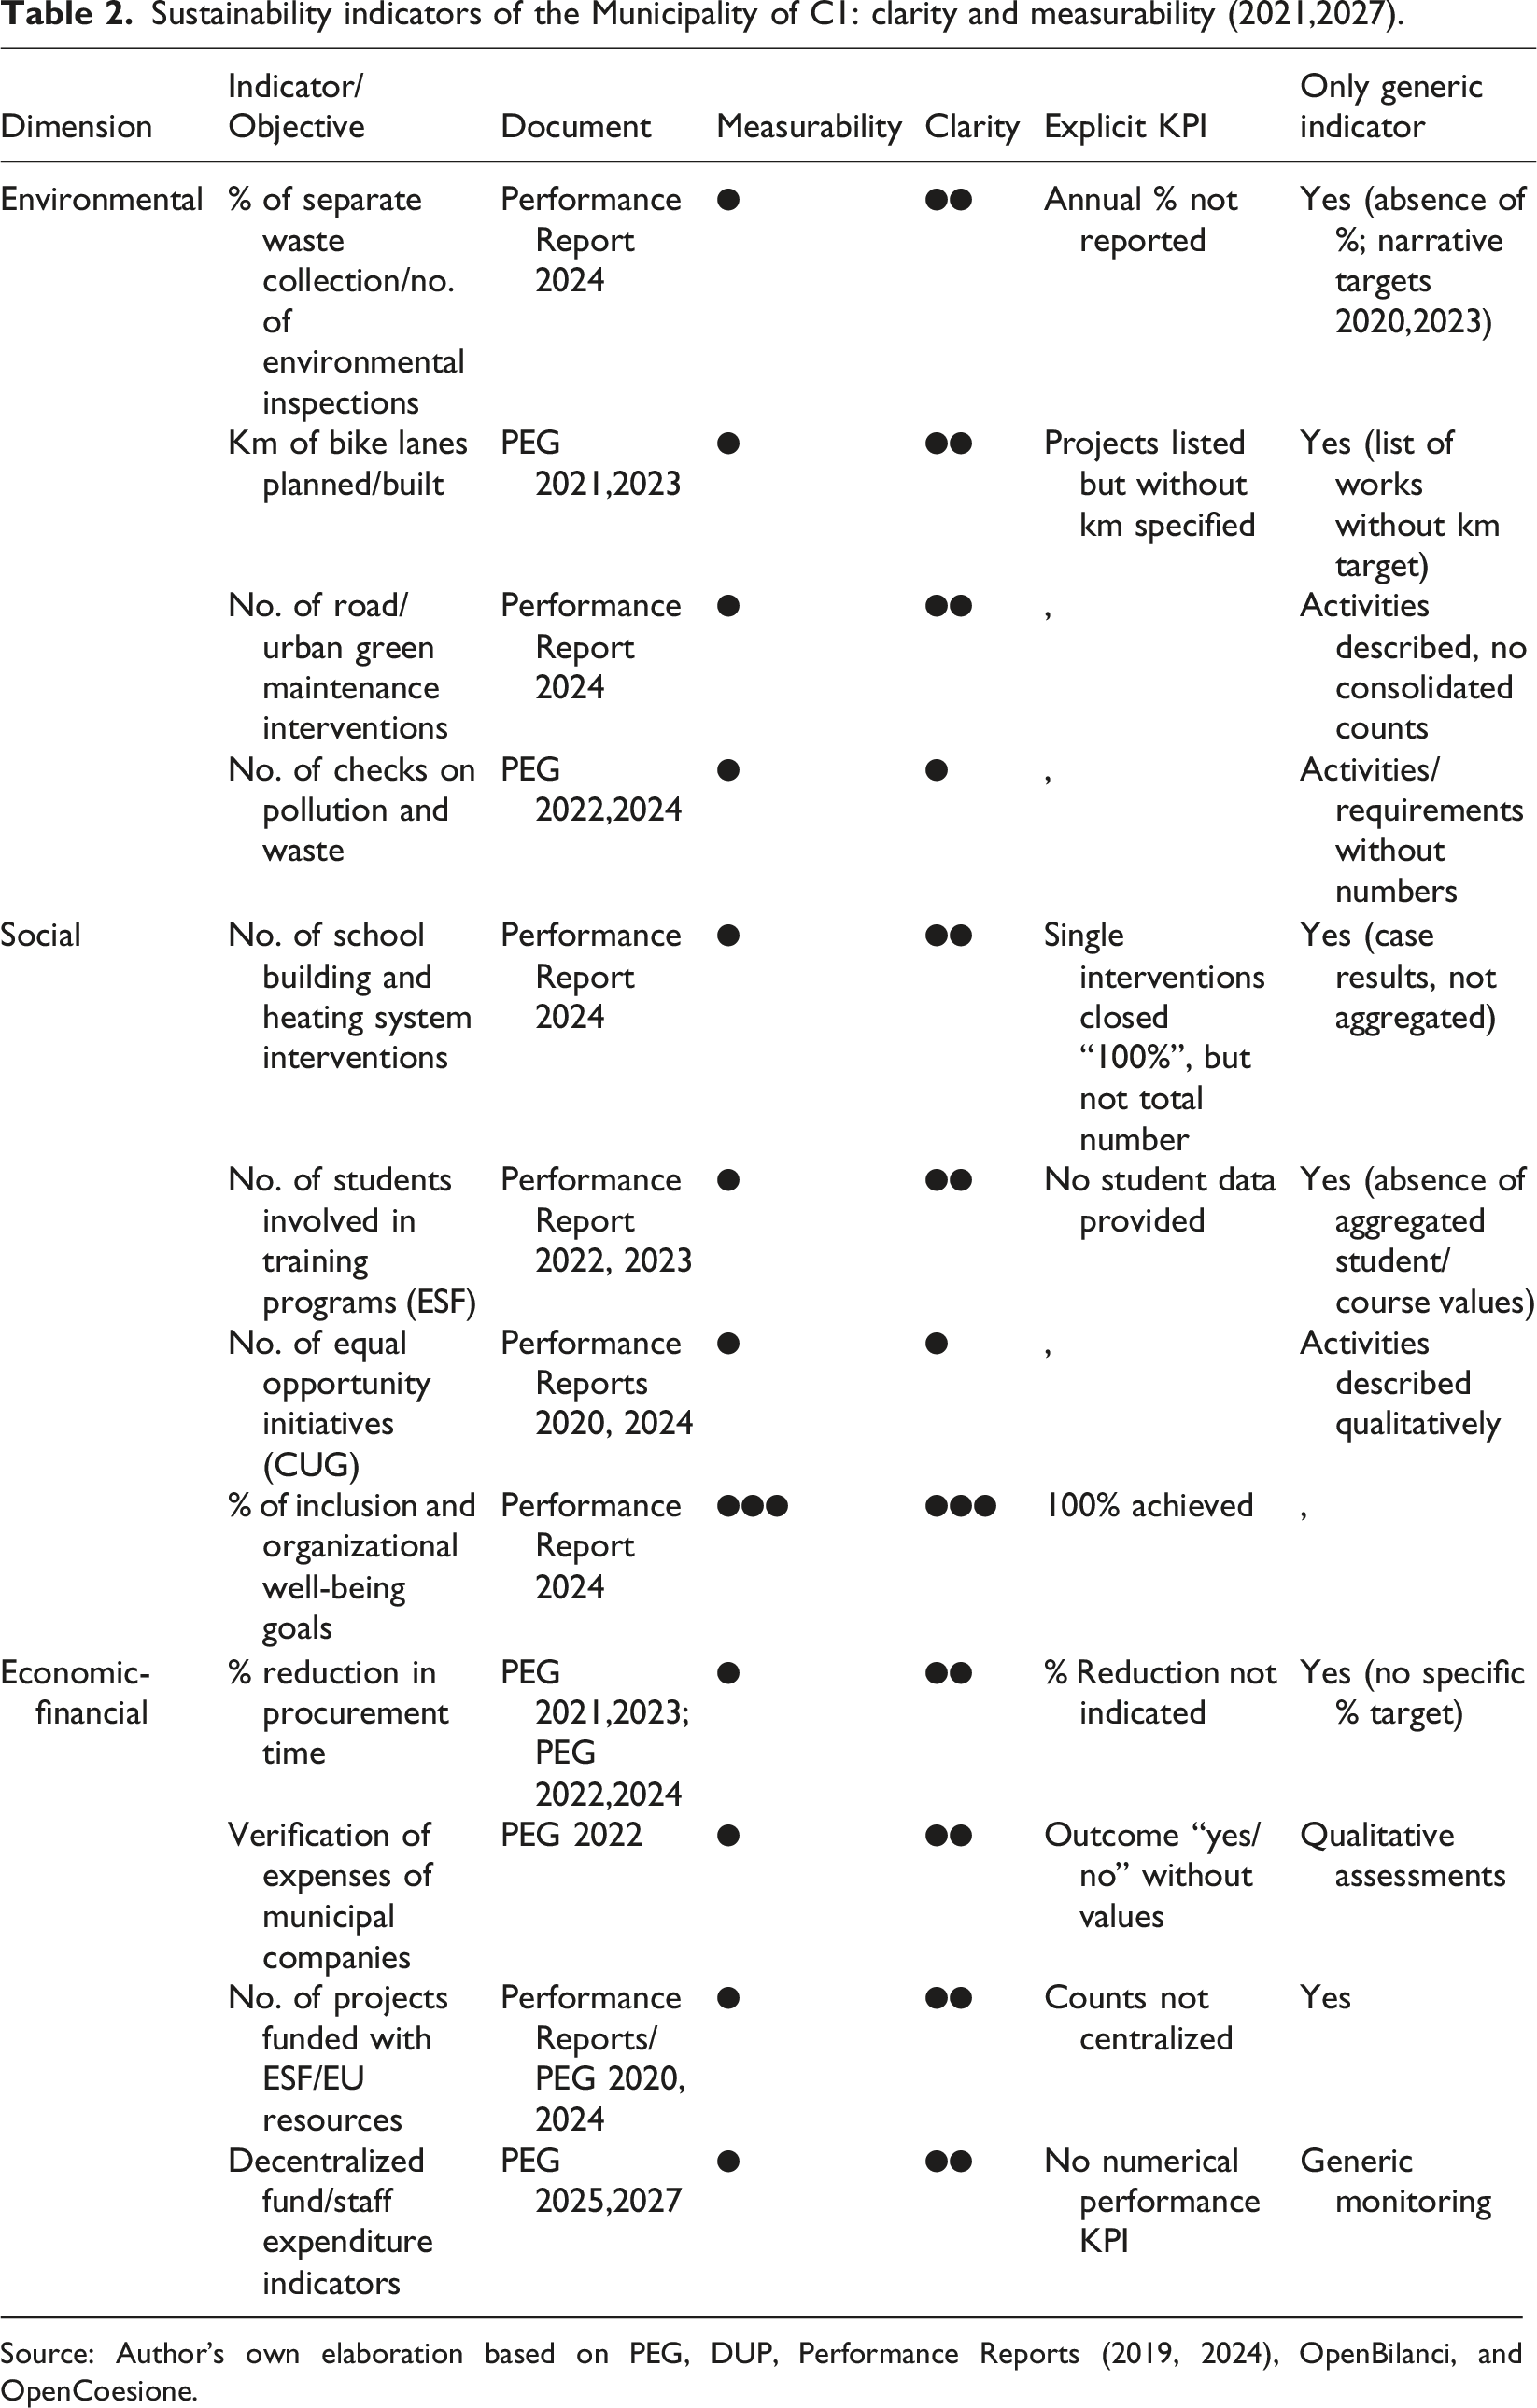
Source: Author’s own elaboration based on PEG, DUP, Performance Reports (2019, 2024), OpenBilanci, and OpenCoesione.
Sustainability indicators of the Municipality of C2: clarity and measurability (2021,2027).
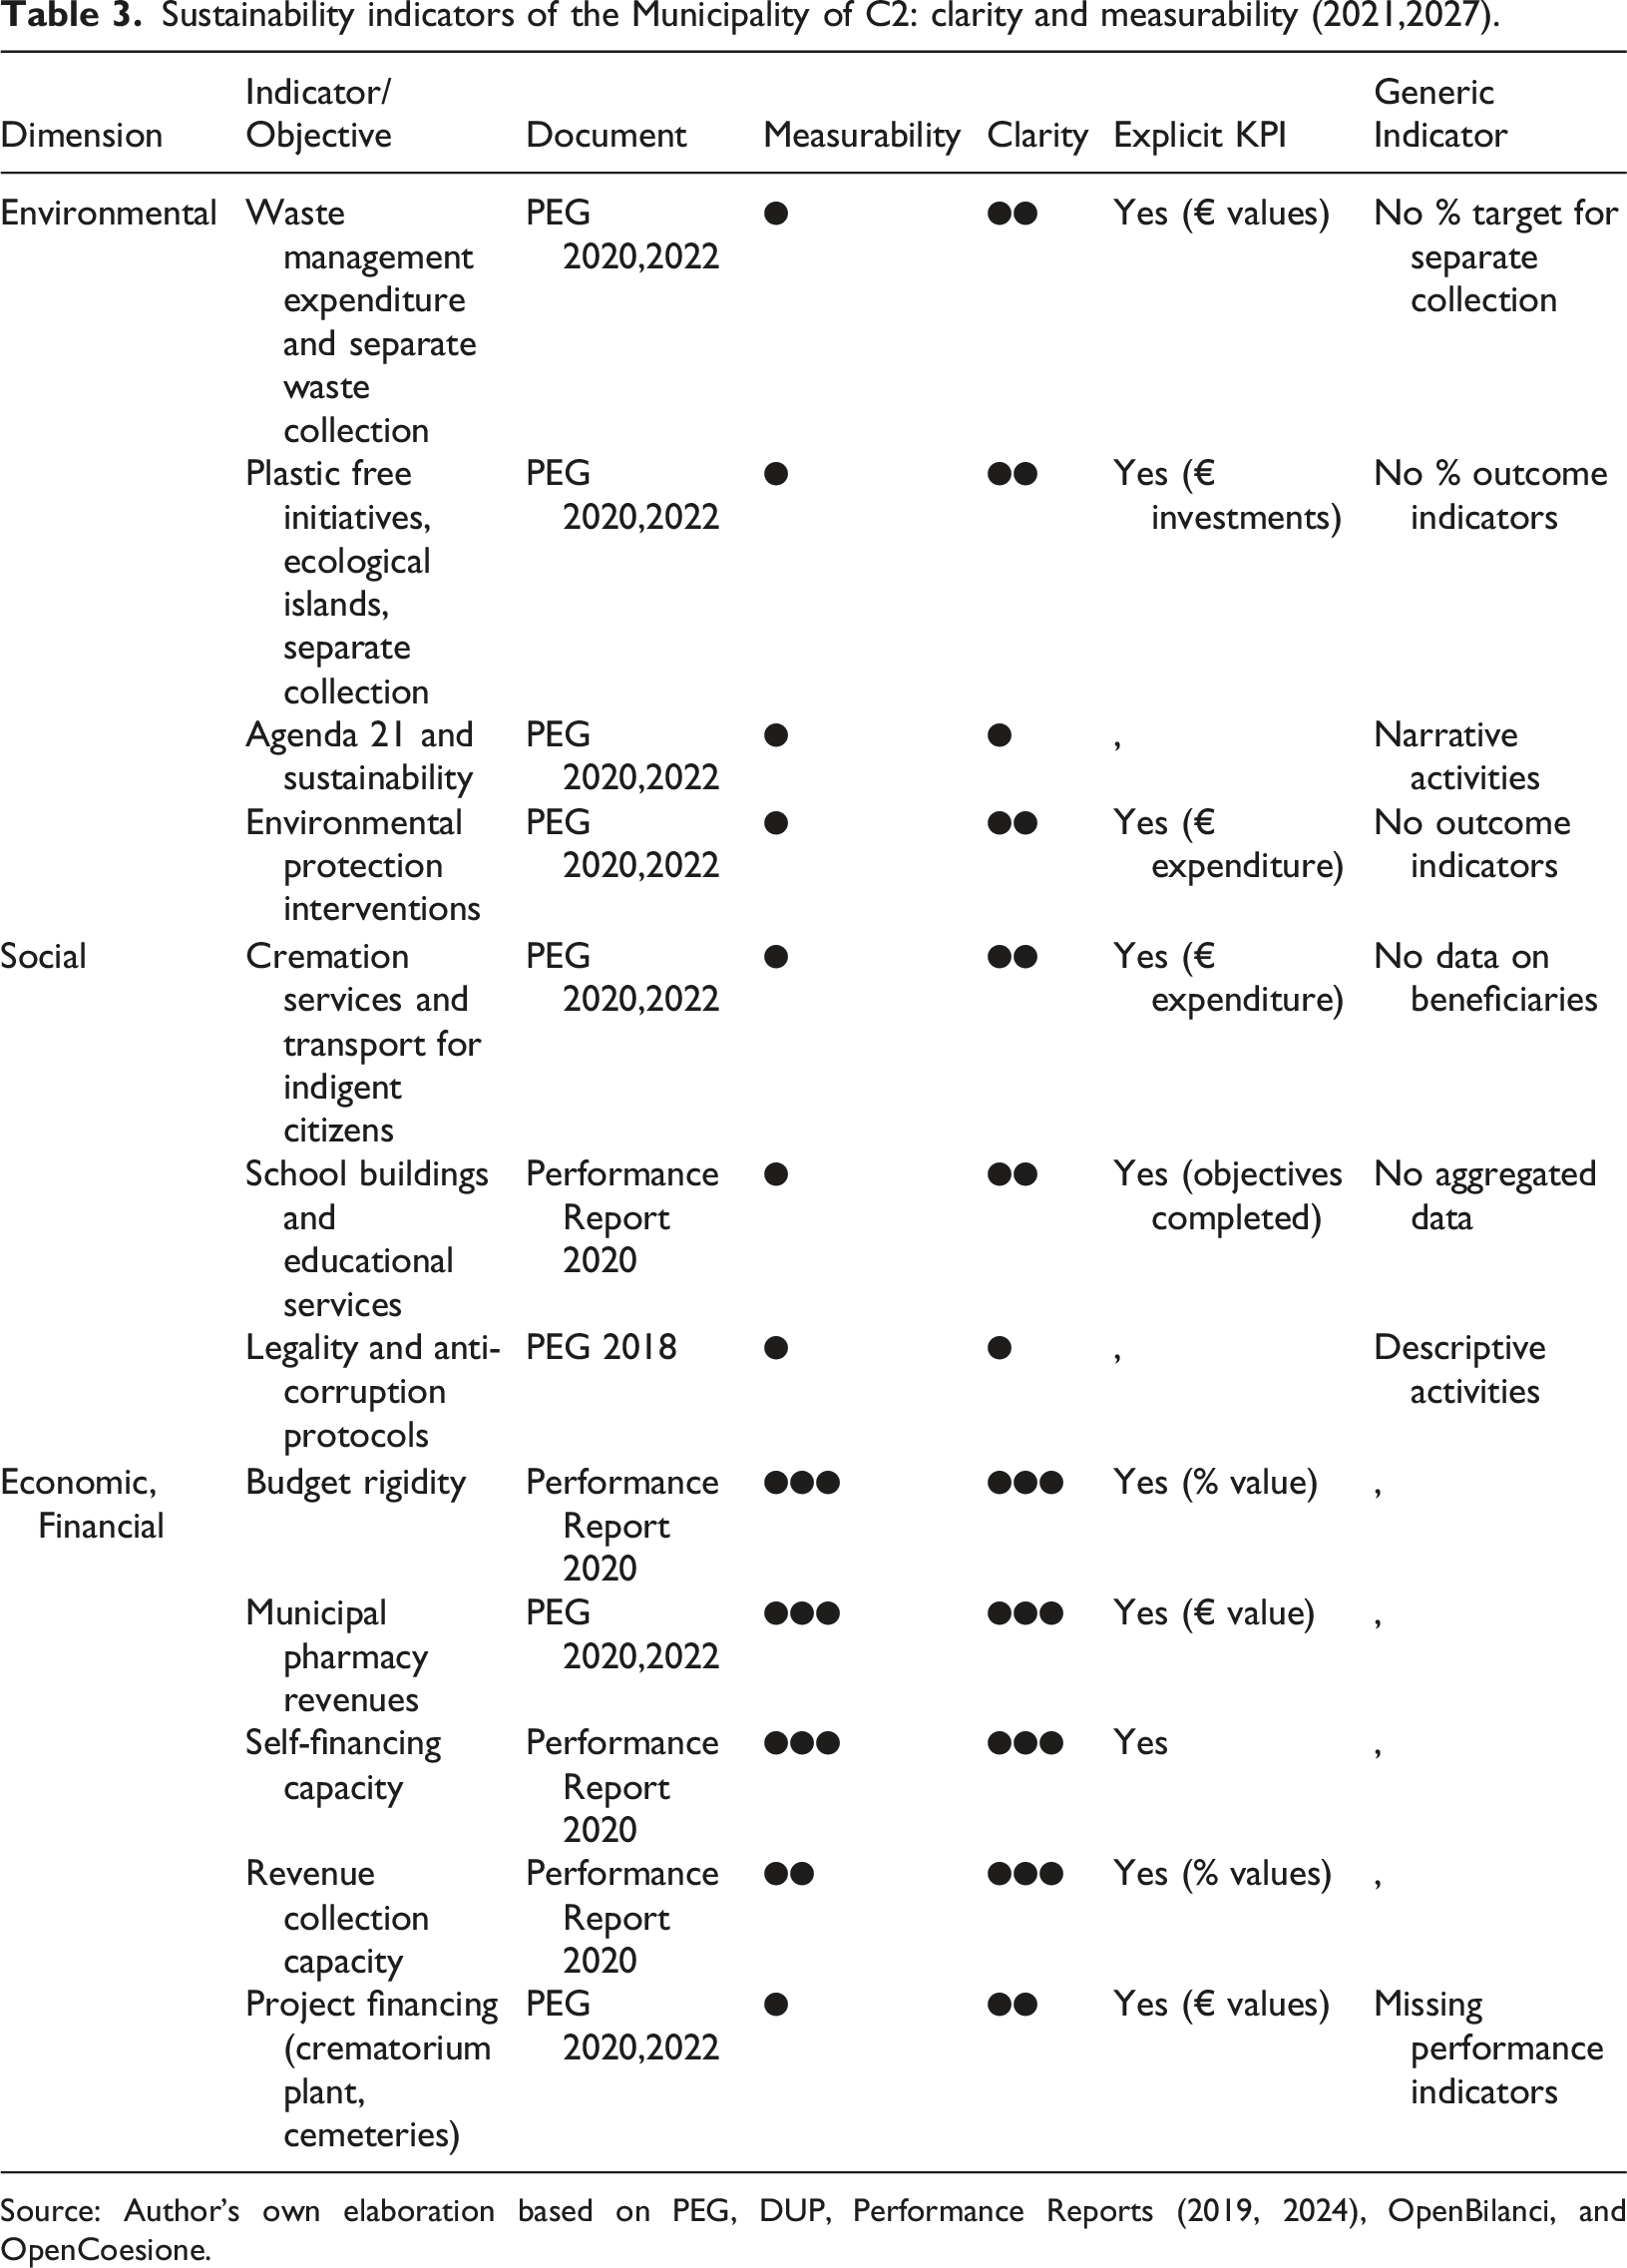
Source: Author’s own elaboration based on PEG, DUP, Performance Reports (2019, 2024), OpenBilanci, and OpenCoesione.
Sustainability indicators of the Municipality of C3: clarity and measurability (2021, 2027).
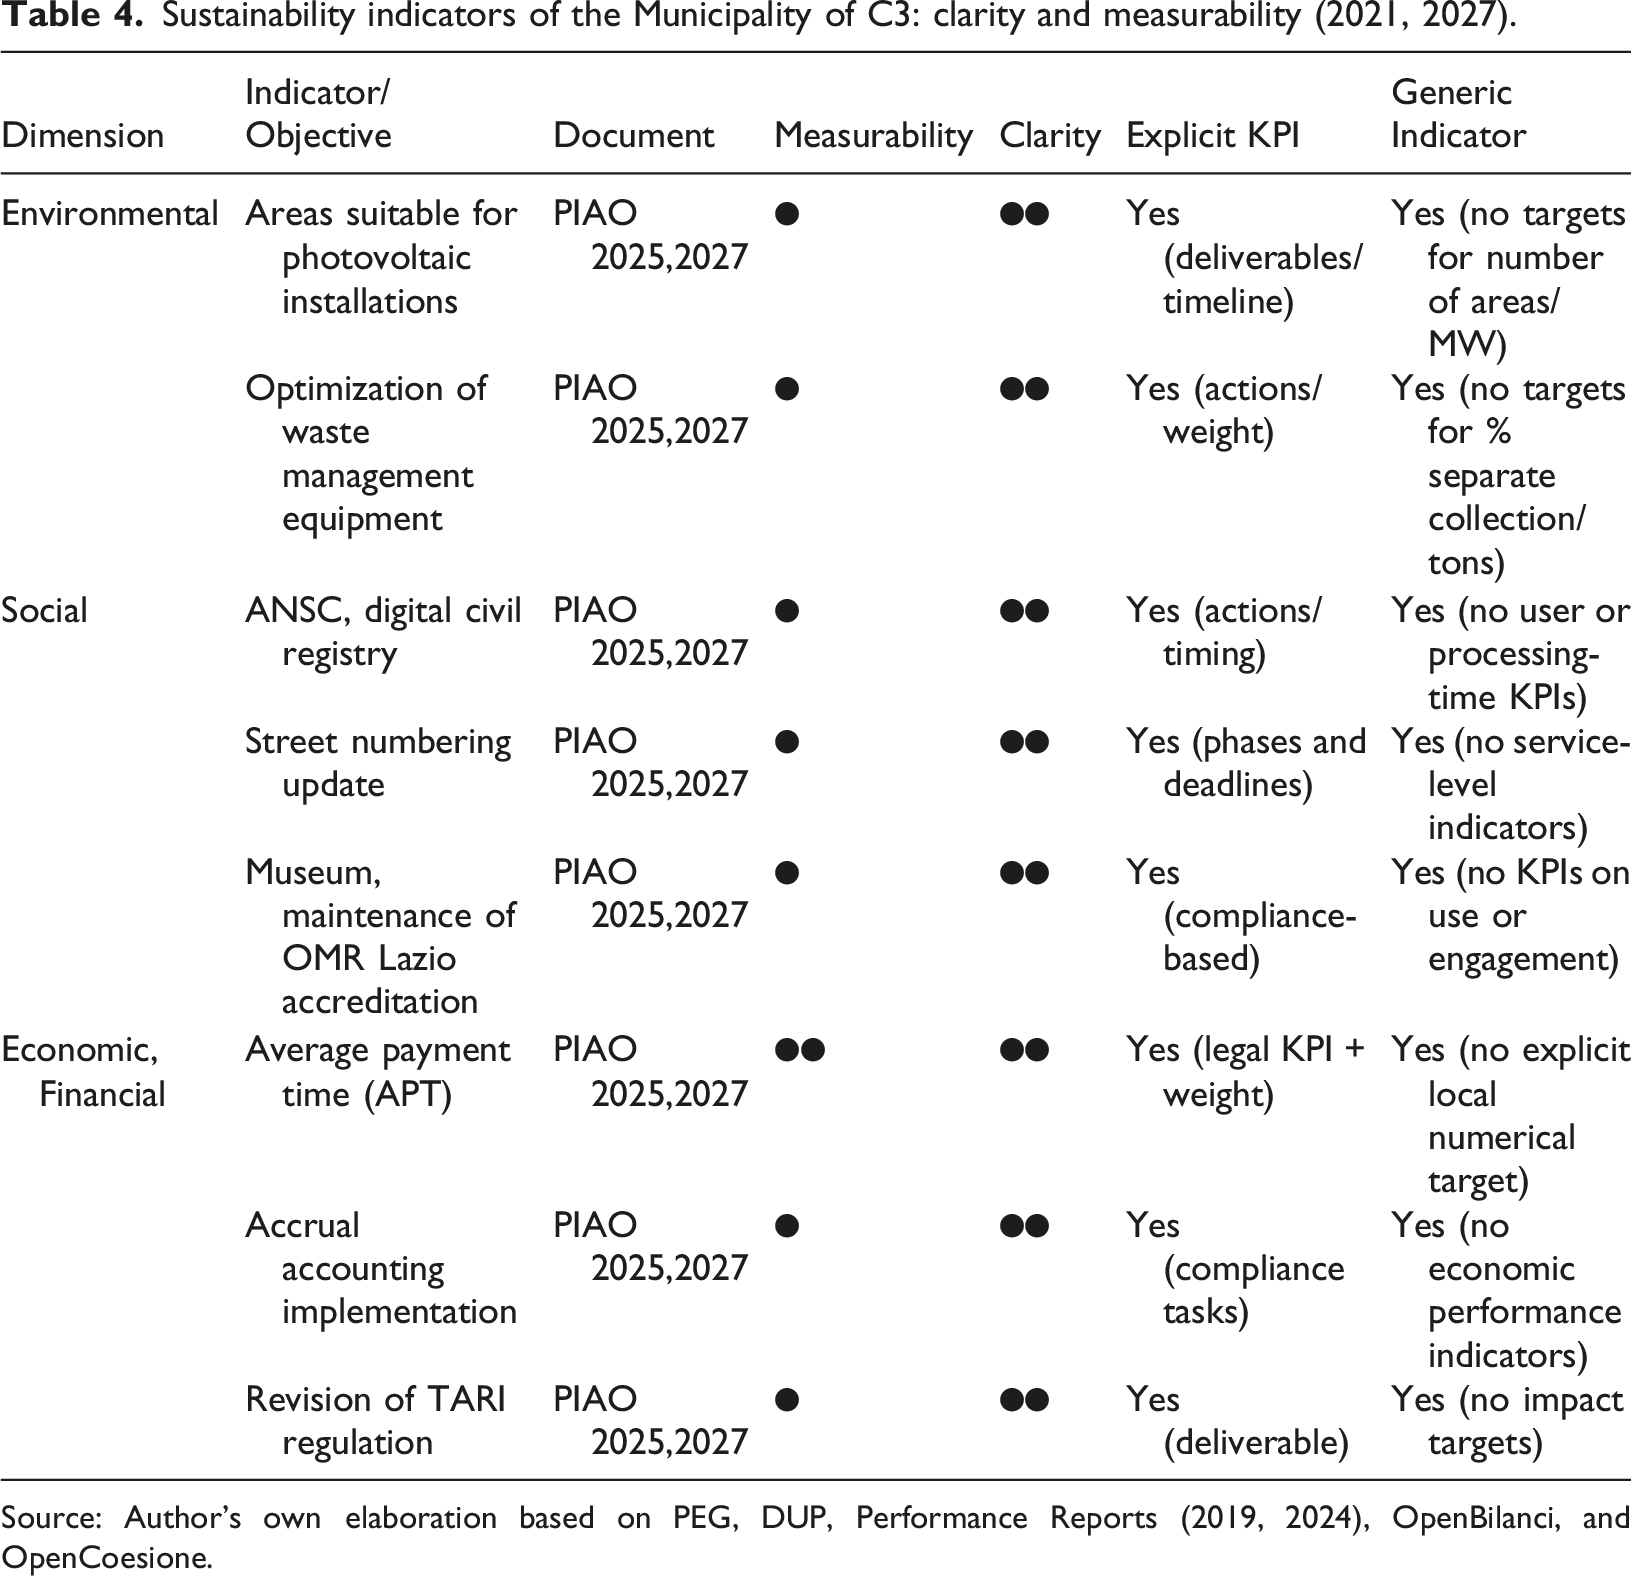
Source: Author’s own elaboration based on PEG, DUP, Performance Reports (2019, 2024), OpenBilanci, and OpenCoesione.
The study indicates that social projects hold sway in the Municipality of C1, with approximately 150 interventions (78%), most of which are associated with education and training. In C2, there is a similar trend, with social projects amounting to 30 (88.24% of the total). Environmental projects emerge as a secondary category, with 28 projects in C1 (15%), mainly focused on sustainable mobility, urban green space regeneration, and waste management and composting, and 2 projects in C2 (5.88%) and 3 in C3 (42.86%). The economic-financial dimension is significantly more limited, with 14 projects in C1 (7%), primarily linked to employment and business support. C3 recorded 2 projects (28.57%) in this category, while C2 reported no projects in this category.
Mapping and evaluation of sustainability indicators in municipal documents
The second phase of the analysis is designed to identify sustainability indicators that are reported in municipal documents related to funded projects and is evaluated against two main criteria: clarity and measurability (OpenCoesione, 2021) Clarity is defined as how clear and understandable objectives are, while measurability is defined as the presence of quantitative elements such as numerical values, targets, and baselines (OECD, 2008).
To facilitate the interpretation of results, a visual dot-scale (●●●) was adopted, based on the framework proposed by Bell and Morse (2008), who recommend innovative visual methods for presenting information in the context of sustainability and performance measurement. In this study, ●●● indicates a high level, where objectives and indicators are clearly defined and supported by quantitative data; ●● represents a medium level, with objectives that are defined but generic in nature; ● indicates a low level, where objectives are vague or lack measurable references (Bell and Morse, 2008). If indicators are not easily measured, there is a higher chance of greenwashing because sustainability objectives could be mostly symbolic. The analysis examined the main municipal planning documents, including PEG, DUP, Performance Reports, and the Sustainability Action Plan, and incorporated them with budgetary information obtained from OpenBilanci.
C1
The analysis of the Executive Management Plans (PEG 2021–2021, 2022–2024, 2025–2027) and the Performance Reports (2021–2025) of Municipality C1 provides a detailed overview of objectives related to the three dimensions of sustainability. The document analysis differentiated numerical KPIs from narrative or process-based KPIs, which merely validate activities performed without quantifying outcomes (Bell and Morse, 2008).
The environmental dimension’s key KPI is the use of funds for waste collection. The 2024 Performance Report certifies 100% utilization of available resources, which is not an indicator that measures actual environmental performance. While clarity is relatively high, as the objective aligns with EU Directive 2018/851 (55% separate waste collection by 2025), measurability is partial, since the actual waste collection rate is monitored externally by the Provincial Waste Observatory and ARPA Lazio and is not integrated into the municipal performance cycle.
Still within the environmental dimension, the PEGs for 2021,2023 and 2022,2024 include the objective of “kilometers of planned and completed cycling paths,” listing interventions related to sustainable mobility without translating the objective into quantitative targets or completed kilometers. The PEG 2022, 2024 introduces an indicator related to “controls on pollution and waste,” which remains framed as an organizational commitment without quantitative targets (e.g., number of inspections, sanctions, or site visits). Finally, the 2024 Performance Report refers to the number of road and urban green space maintenance interventions, declaring 100% completion but not reporting the total number of interventions or data on the affected areas.
In the social dimension, the 2024 Performance Report reports the KPIs “number of school building and heating system interventions” and “percentage of inclusion and organizational well-being objectives achieved,” both of which are 100%. These indicators, although formally numerical, lack explicit data (such as the number of employees involved or school interventions carried out), leading to clear but only partially transparent KPIs. Another relevant KPI concerns the number of students involved in training programs (ESF), which is reported as 100% completed in the 2022, 2023 Performance Reports. This indicator is based on processes and certifies administrative completion without specifying the actual number of beneficiaries. Similarly, the KPI “Interviews and Equal Opportunity Initiatives (CUG)” monitored in the 2020–2024 Reports is recorded only in descriptive form.
Regarding the economic-financial dimension, the PEGs for 2021,2023 and 2022,2024 identify as a KPI the “percentage reduction in procurement award times,” reporting only the average processing time (less than 5 days) and the percentage of examined cases (100%), resulting in partially measurable indicators. The 2022 PEG introduces control mechanisms for municipally owned companies, with outcomes limited to binary “yes/no” statements regarding activities performed, without quantifying expenditure levels. In the PEGs for 2020,2024, a further indicator concerns the “number of ESF/EU-funded training projects,” for which completed application forms and administrative acts are reported (often at 100%), but without centralized counts of projects actually approved and completed, rendering the KPI clear but not fully measurable. Finally, the KPI “Decentralized Resources Fund/Personal Expense Indicators,” included in the PEGs for 2025–2027, functions merely as an accounting monitoring item, reporting allocations and financial variations without genuine performance indicators.
OpenBilanci’s budgetary data indicates a significant allocation of resources to environmental protection and mobility. Mission 9—Environment will have €58.85 million in 2021 and €51.20 million in 2022, and Mission 10—Transport and Mobility will have €39.54 million in 2021 and €51.14 million in 2022.
The table summarizes the primary indicators identified in Municipality C1’s planning and reporting documents, organized by the three sustainability dimensions. For each KPI, the level of clarity and measurability was assessed, distinguishing between indicators that are explicitly expressed in numerical terms and those that are generic or narrative.
The analysis of the reported indicators shows that the clarity in the formulation of objectives is generally medium to high. Many interventions are described in a comprehensible manner and can be clearly linked to specific areas of action (e.g., school infrastructure, sustainable mobility, and waste management). However, clarity is often limited by the use of generic wording or by the lack of data aggregation, which prevents a comprehensive overview of the results achieved. In terms of measurability, the limitations are even more pronounced. Most objectives are not supported by numerical values, annual targets, or reference baselines. Indicators are frequently expressed in narrative or qualitative terms (e.g., “100% of activities completed” and “yes/no outcome”), without providing quantitative elements that would allow for an objective assessment of progress. This confirms the difficulty municipalities face in translating sustainability commitments into concrete and verifiable KPIs, thereby increasing the risk of symbolic or merely formal reporting.
C2
The analysis of the PEGs for the periods 2018–2022 and 2020–2022, the 2019 Performance Plan, and the 2024 Performance Report of Municipality C2 allowed for the identification of objectives, indicators, and allocated resources.
From an environmental perspective, the 2018 PEG highlights an objective related to public works, expressed as the percentage of procedures activated under the 2018,2020 Three-Year Public Works Plan, with a target of 90%. Although this indicator is clear and measurable, it does not provide information on the actual completion of work. Also noteworthy is the “water crisis” section, which reports 100 interventions, 50 communications, and 10 meetings. However, these are process-based KPIs. While clear, they are only partially measurable in terms of environmental outcomes. In the same year, the analogue control of the municipal company “C2 Rifiuti Zero” was formalized, reporting six meetings and 20 inspections. Despite being numerical, these indicators are process-oriented and have good clarity and partial measurability.
The 2019 Performance Plan confirms the priority area of “Sustainable development and environmental protection” (Mission 9), with planned resources for the 2019,2021 period amounting to €10.30 million. Despite their usefulness in assessing coherence between planning and resource allocation, these figures are not directly linked to measuring environmental performance.
The PEG for 2020–2022 has established the KPI of “Construction of Ecological Islands and Completion of the Transfer Center” and allocated €800,000. This is a clear investment indicator but it does not translate into measurable territorial outcomes, such as reducing unsorted waste. The reporting of expenditures for territorial maintenance does not include any measurable environmental results.
In the social domain, the 2018 PEGs articulate policy implementation through the Piano di Zona, with two explicit KPIs: the percentage of interventions implemented over those planned (90%) and the percentage of demand coverage (70%). These indicators are clear and measurable, but lack multi-year series and information on beneficiaries. The 2020 Performance Reports include numerous objectives reported as 100% completed (e.g., service innovation and the participatory portal “URBANA_MENTE”), which remain process-based (activations, launches, implementations) and are not linked to social outcomes such as user satisfaction or waiting-time reductions.
The economic-financial dimension is characterized by indicators that are more robust and measurable. In the 2020 Performance Report, the table titled “administrative health status” reports: structural rigidity at 26.06% (target <50%, achieved); Self-financing at 100%; structural deficit compliance with 9 out of 10 ministerial parameters; payment speed at 64.57% (aligned with the target); per capita capital expenditure of €33.28 (not achieved compared to a target above €800, indicating low investment intensity); and current revenue collection capacity at 67.17%. The performance management cycle is fully integrated with these explicit and fully integrated KPIs.
Overall, the environmental and social dimensions show good clarity in terms of commitments (objectives, projects, activities) but limited measurability of results, which tends to increase the risk of “process compliance” rather than effective environmental and social performance (De Freitas Netto et al., 2020). The economic-financial dimension is distinguished by indicators that are mature and coherent and have verifiable targets.
The summary table classifies the main KPIs identified in the planning and reporting documents of Municipality C2 across the three dimensions of sustainability, assigning each a judgment of clarity and measurability, and distinguishing between numerically explicit indicators and generic or narrative indicators.
C3
Municipality C3’s documentation analysis reveals a framework that is largely focused on process-based KPIs. From an environmental perspective, the objective of identifying areas suitable for photovoltaic installations is clearly defined in terms of timelines and deliverables, but it lacks quantitative targets (e.g., number of areas and potential MW) and impact indicators (e.g., tons of CO2 avoided). The aim of optimizing waste management equipment is operationally defined, but it is not connected to measurable outcomes like increases in separate waste collection rates or reductions in residual waste per capita.
From a social perspective, integration with the National Digital Archive of Civil Status Registers (ANSC) represents a clear objective but remains a process KPI, as it lacks user-oriented data such as the percentage of certificates issued online or average processing times. Likewise, the updating of street numbering shows strong planning and clear milestones, but it does not translate into service indicators (e.g., percentage of aligned databases or reduction in delivery errors). In the cultural domain, maintaining the museum’s registration in the OMR Lazio registry is a clearly stated objective, yet it is not supported by numerical KPIs related to visitors, educational activities, or user engagement.
Regarding the economic-financial dimension, compliance with average payment times is appropriately framed, but no explicit local targets are defined (e.g., average payment time ≤30 days). The TARI regulation has a similar problem: despite the clear deliverable, numerical KPIs like service cost coverage rates or impacts on vulnerable users are not included. The summary table categorizes the primary KPIs found in all three sustainability dimensions, assigning an assessment of clarity and measurability to each, and distinguishing between numerical indicators and generic or narrative indicators.
Linking KPIs, projects, and greenwashing risks
The comparison between the KPIs reported in programming and reporting documents and the funded projects (identified through the Unique Project Code - CUP) reveals different dynamics across the three municipalities. The goal is to see if sustainability claims are supported by measurable outcomes at the project level or if there are signs of greenwashing (De Freitas Netto et al., 2020; Rios et al., 2024). The analysis utilizes the individual project (CUP) as the reference point, confirming the presence of project-specific indicators in institutional documents. In line with De Freitas Netto et al. (2020), greenwashing is defined as the gap between declared commitments and verifiable results. Accordingly, the risk increases as declared objectives lack quantitative indicators or measurable evidence.
In Municipality C1, the comparison between control mechanisms and funded projects identified by CUP highlights two main limitations: (i) limited measurability, as expenditure reporting is conducted at the macro-area level (e.g., Environment) without any direct linkage to projects financed with public funds; and (ii) incomplete clarity, since institutional documents do not explicitly link individual project CUPs to targets and achieved results. Furthermore, there is no comparison made between the payments made and the commitments undertaken for each project. In C1, many projects are described and monitored at a procedural level (e.g., “100% achieved” or “yes/no outcomes”) without specifying quantitative targets at the project level.
Illustrative examples include the cycling infrastructure projects L4 Autolinee, Viale Le Corbusier, Nuova C1 (CUP B21B2300069XXX), and L3 Nuova C1,Nascosa/Via del Lido (CUP B21B2300068XXX). The PEG 2021–2023 refers to “kilometers planned/realized” but does not set any kilometer targets or report completed kilometers. A similar approach is evident in waste management: the indicator “use of separate waste collection funds: 100%” certifies expenditure rather than environmental performance (e.g., % of separate collection or kg per capita of unsorted waste) and is not linked to specific projects such as provincial waste collection centers (CUP B85I1800059XXX) or multi-municipality composting plants (CUP B85I180006XXXX). Likewise, urban regeneration and green space projects—Piazzale dei Mercanti (CUP B21G240000XXXX), Central Urban Green Areas (CUP B24J2400095XXX), Santa Rita Park (CUP B29F2400666XXX)—as well as mobility governance initiatives (Mobility Management Office, CUP B29J2300508XXXX) are well described in terms of activities and expenditures but lack outcome indicators (e.g., square meters redeveloped, public transport/cycling usage, and CO2 avoided) and project-level CUP tracking.
By contrast, the economic-financial dimension appears more structured: the Performance Reports and Indicator Plans include time-series data on budget rigidity, personnel expenditure incidence, interest expenses, average payment times, and similar indicators, which are measurable and verifiable over time, although not directly linked to individual CUPs. Overall, Municipality C1 has a medium level of greenwashing risk: many declarations are procedurally accurate (e.g., 100% of activities/resources used) but are not supported by quantitative outcome evidence at the project level. In the economic-financial area, the risk is minimized by the use of numerical and multi-year indicators.
Municipality C2 provides a comprehensive documentation, but the control mechanisms are not well-structured, and there is no explicit linkage to project CUPs. On the environmental side, the PEG 2018 reports process-oriented KPIs (e.g., “percentage of activation of procedures under the 2018 Public Works Plan” at 90%; the “water crisis” block with counts of interventions, meetings, and communications), as well as analogous control over the municipal waste company (number of meetings and inspections). The PEG 2020, 2022 introduces the KPI “construction of ecological islands and completion of the transfer center,” with €800,000 in expenditure: a clear investment indicator, but one not translated into territorial outcomes (e.g., % of separate waste collection, kg per capita of unsorted waste). In the economic-financial area, reporting and planning documents include the “administrative health” framework with clear targets (budget rigidity <50%, self-financing, deficit parameters, payment speed, revenue collection, per capita capital expenditure), where metrics appear more mature and verifiable.
Municipality C2 lacks an annual control plan that is comparable to that of C1, and does not include project CUPs in monitoring documents. As a result, Municipality C2 shows a medium, high greenwashing risk—high in the environmental and social dimensions due to the prevalence of process-based KPIs, and more limited in the economic-financial dimension thanks to the numerical nature of indicators.
For Municipality C3 (PIAO 2025,2027 and validations by the Independent Evaluation/Oversight Bodies), the control system is organizationally robust; however, KPIs remain predominantly process-oriented. In the environmental area, the objective of mapping areas suitable for photovoltaic installations is clearly defined in terms of deliverables and timelines but lacks quantitative targets (number of areas, potential MW) and impact indicators (e.g., CO2 avoided). Similarly, the “optimization of waste management equipment” (community composters, compactors, pay-as-you-throw systems) is operationally explicit but not linked to measurable outcomes (increase in separate collection rates, reduction in kg per capita of unsorted waste). In the social dimension, integration with the National Digital Civil Registry (ANSC) is a clear and verifiable compliance objective, but user-side KPIs are missing (e.g., percentage of certificates issued online and average processing times). Address updates are well planned but not translated into service indicators (database alignment, reduction in delivery errors). In the cultural area, museum OMR Lazio accreditation focuses on compliance rather than usage KPIs (visitors, educational activities).
In the economic-financial dimension, average payment times are correctly stated, but no explicit local targets are defined (e.g., TMP ≤30 days). Accrual accounting is treated as a methodological adjustment rather than a performance tool (e.g., budget rigidity, revenue collection, and investment levels), and the revision of the TARI regulation identifies deliverables but not impacts (e.g., percentage of cost coverage). Overall, Municipality C3 displays a medium, high greenwashing risk: objectives are well articulated and timelines are clear, but outcome-oriented indicators are scarce and links to independent data sources remain weak.
Discussion
The analysis of the three municipalities allows for meaningful reflections on the ability of local administrations to translate sustainability statements into verifiable actions, on the quality of the control tools adopted, and on their exposure to greenwashing risk. The outcomes are weak in environmental and social domains, even though monitoring and reporting systems are formally in place and ensure procedural transparency.
Regarding the first research question (RQ1), the findings show that the clarity with which objectives are formulated is generally medium to high. The environment, social policy, and the economy are well-defined areas of public intervention where local authorities can describe policy priorities in a comprehensible manner. However, measurability remains limited. The KPIs that are identified are often narrative or process-oriented, aimed at proving that an activity or resource was utilized, without specifying the outcomes achieved. Indicators such as “100% of activities completed” or “full use of available funds” communicate formal compliance but do not allow an assessment of the impact of the actions undertaken. The absence of numerical values, baselines, and explicit targets in the environmental and social fields makes this limitation particularly apparent. As a result, it is difficult to determine how many kilometers of cycling infrastructure have actually been built and made accessible, the current rate of separate waste collection, the square meters of green areas that have been redeveloped and maintained, or the number of beneficiaries of educational and social services. Data comparability across municipalities and over time is limited, which is why. The economic-financial dimension exhibits a higher level of maturity, with indicators like budget rigidity, average payment times, collection capacity, and staff expenditure ratios being numerical, periodically updated, and often supplemented by national benchmarks. This suggests that where consolidated routines and national regulatory references exist, measurability and comparability are achievable, whereas in other areas qualitative declarations tend to prevail and risk remaining symbolic.
Turning to the second research question (RQ2), audit and control mechanisms appear to be well-structured at the procedural level and compliant with regulatory requirements. Municipalities rely on established instruments such as the PEG, DUP, Performance Reports, and in some cases the PIAO, and validations by independent evaluation bodies. These documents ensure transparency with respect to inputs and resource management, providing an orderly overview of activities undertaken. However, the effectiveness of controls often stops at the procedural level: the link between activities and outcomes remains weak and is not supported by systematic reporting of results. The lack of integration with independent external sources, such as environmental observatories, sectoral databases, school registers, or social information systems, limits the possibility of objectively validating declared performance. Consequently, control systems tend to prioritize regulatory compliance and formal obligations rather than the actual measurement of outcomes. The resulting accountability is therefore partial: transparency is ensured in procedural and accounting terms, but it does not allow a full evaluation of public policy effectiveness.
This framework also provides insights into the third research question (RQ3) concerning greenwashing risk. Such risk emerges precisely from the gap between declarations and verifiable results. When objectives are communicated in generic terms and without measurable data, institutional narratives risk becoming symbolic, aimed more at conveying a positive image than at documenting concrete impacts. In the environmental and social areas, where process indicators prevail, the risk appears medium to high, as communication emphasizes procedures and compliance without translating them into measurable outcomes. Conversely, in the economic-financial dimension, the risk is lower due to the presence of numerical series and verifiable parameters. This results in a two-speed reporting system: more robust where indicators are numerical and regulated, and more fragile and vulnerable where measurement remains qualitative.
The comparison among the three municipalities shows that, despite some differences in detail, the critical issues are largely shared. None of the cases has succeeded in establishing a systematic link between declared objectives and actual results, nor in ensuring stable integration with independent external data sources. This lack of methodological consolidation makes it difficult to assess policy effectiveness and increases the risk that sustainability is communicated more as a statement of intent than as a concrete outcome.
Overall, the three cases indicate that municipalities have developed significant capacities in terms of procedural and accounting transparency, but still need to make a qualitative leap to strengthen outcome measurement and reduce greenwashing risk. This requires the introduction of linkage matrices connecting objectives, resources, and results; the definition of minimum sets of standardized indicators for key policy areas; the systematic adoption of baselines and annual targets; and the integration of independent data sources into the monitoring cycle. Only through such steps can institutional declarations be credibly aligned with the actual impacts of local policies, consolidating a governance model oriented not only toward procedural compliance but also toward the effective evaluation of pursued sustainability outcomes.
Conclusions
This study reconstructed the portfolio of funded projects in the municipalities of C1, C2, and C3, mapped sustainability indicators in planning and reporting documents, and assessed the potential risk of greenwashing. The emerging picture is consistent across the three cases: safeguards related to legality and procedural correctness are present and functional, while outcome measurement remains fragmented, often limited to process indicators and rarely linked to individual projects identified by the Unique Project Code (CUP). It is precisely within this gap between “activities performed” and “demonstrated results” that the risk of greenwashing arises, increasing when institutional communication focuses on compliance and expenditure without parallel quantitative evidence of outcomes.
The implications are clear. Without outcome indicators directly linked to projects and without financial traceability at the CUP level, institutional transparency weakens, resource reallocation risks failing to reward effective actions, and stakeholder trust relies more on narrative than on evidence. Conversely, shifting the focus from compliance to results is achievable through concrete measures already compatible with the current planning cycle. These include: placing the CUP at the core of PEG documents and monitoring systems; adopting standard indicators with baseline–target–result structures; and systematically linking progress reports, completion certificates, and payments to individual projects. These are “low-risk” actions that can strengthen completeness and transparency, thereby demonstrably reducing greenwashing risk.
The research deliberately relies exclusively on officially published documents. Where specific data were absent, this absence was treated as evidence and factored into the assessment of greenwashing risk. While this approach supports the robustness of the conclusions, it also highlights an area for improvement. The three municipalities already possess a solid control framework; however, to make sustainability truly credible, a shift is needed from “process compliance” to “demonstrated performance.” This entails placing the CUP at the center, measuring impacts, reconciling financial data, and publishing verifiable information. Only through such a transition can sustainability move beyond being a label and become a tangible outcome.
The study has several limitations: (i) the absence of interviews and direct observations, which limits interpretative depth; and (ii) the sample, which is restricted to municipalities in the Lazio Region, thereby constraining the generalizability of the findings. Despite these limitations, the research aims to identify recurring patterns and systematic differences in municipal sustainability practices.
Supplemental material
Supplemental material - Evaluating sustainability in local public projects: Performance indicators, transparency, and the risk of greenwashing
Supplemental material for Evaluating sustainability in local public projects: Performance indicators, transparency, and the risk of greenwashing by Serena De Rosa in Local Economy.
Footnotes
Funding
The author disclosed receipt of the following financial support for the research, authorship, and/or publication of this article: This work was financed by the European Union–Next Generation EU, Mission 4, Component 1, CUP B83C22003060006.
Declaration of conflicting interests
The author declared no potential conflicts of interest with respect to the research, authorship, and/or publication of this article.
Supplemental material
Supplemental material for this article is available online.
References
Supplementary Material
Please find the following supplemental material available below.
For Open Access articles published under a Creative Commons License, all supplemental material carries the same license as the article it is associated with.
For non-Open Access articles published, all supplemental material carries a non-exclusive license, and permission requests for re-use of supplemental material or any part of supplemental material shall be sent directly to the copyright owner as specified in the copyright notice associated with the article.