
Abstract
Objective:
To describe the development and psychometric evaluation of a new patient-reported measure that assesses a person’s social network in the first six months post stroke. Although it is known that the social networks of those with stroke and aphasia are vulnerable to change, there is currently no social network scale that has been validated for this population.
Design and setting:
Repeated measures psychometric study, evaluating internal consistency, construct validity, and responsiveness to change of the Stroke Social Network Scale. Participants were interviewed two weeks, three months and six months following a first stroke.
Measures:
Stroke Social Network Scale; Medical Outcomes Studies (MOS) Social Support Survey; National Institute of Health Stroke Scale; Stroke and Aphasia Quality of Life Scale-39g; Frenchay Aphasia Screening Test.
Results:
87 participants were recruited, of whom 71 were followed up at six months. Factor analysis was used with the Stroke Social Network Scale to derive five subdomains: satisfaction; children; relatives; friends; and groups, which explained 63% of variance. There was good evidence for the scale’s internal consistency (α = 0.85); acceptability; and convergent (r = 0.34; r = 0.53) and discriminant validity (r = −0.10; r = −0.19). It differentiated between those with high versus low perceived social support (p = 0.01). Moderate changes from two weeks to six months supported responsiveness (d = 0.32; standardised response mean (SRM) = 0.46), with the friends factor, as expected, showing more change than the children’s factor (friends factor: d = 0.46; SRM = 0.50; children’s factor: d = 0.06; SRM = 0.19).
Conclusions:
The Stroke Social Network Scale is a new measure that demonstrates good internal consistency, validity and responsiveness to change.
Introduction
Social networks post stroke appear to be vulnerable: studies have found that people lose contact with friends,1,2 are less likely to attend groups, and they take part in fewer social activities. 3 This reduction in the wider social network is in turn associated with worse psychological outcomes. Social isolation 4 and having few contacts outside the immediate family 5 were both significant predictors of depression from 12 months on. Social isolation has also been associated with worse physical outcomes post stroke. 6 Those with aphasia (language difficulties) following their stroke appear to be particularly at risk of adverse social outcomes. Friendships have been found to be especially vulnerable. In a study of people with chronic aphasia, 64% reported they saw their friends less than before the stroke, and 30% reported having no close friends at all. 7 Compared with healthy controls, those with aphasia have fewer friends 8 and engage in fewer leisure activities. 9 In a recent systematic review of factors in health-related quality of life for people with aphasia, three out of four quantitative studies and three out of three qualitative studies reported that social factors contributed to more severely affected health-related quality of life. 10
To date there is no social network measure that has been validated for those with stroke and aphasia. Current social network measures are linguistically complex and have not been adapted to be acceptable to those with language difficulties.11–13 Indeed, it is of concern that many stroke studies examining psychosocial factors post stroke exclude people with aphasia, even though some 30% of people will have aphasia following a stroke, 14 with around 15% experiencing long-term language difficulties. 15 Given the reported difficulties people with aphasia face following a stroke, excluding them could lead to positively biased results. Furthermore, without a scale that is valid for both those with and without aphasia, it is not possible to compare their potentially different experiences.
A key aim of rehabilitation post stroke is to achieve a good quality of life, including addressing social and psychological sequelae. 16 Having a tool to investigate in detail how social networks change post stroke may therefore be useful to both clinicians and researchers. The aim of this study was to develop a new patient-reported measure of social network functioning that is specific to the stroke population, and is valid and acceptable for both those with and without aphasia.
Methods
The development of the Stroke Social Network Scale (SSNS) will be described first. Three sources of information were used to develop the content: (1) a set of questions forming a preliminary version of this questionnaire, used in previous research with a comparable population: those with chronic aphasia following a stroke;7,17 (2) a review of the literature; (3) a review of existing instruments. A conceptual model was developed that had five core subdomains.
Size of network. Network size in the general population is associated with mortality 18 and morale. 19
Composition of network. Elements of the social network known to be meaningful to the stroke population were chosen.20,21 These were: spouse/partner, children, close friends, close relatives, and wider network including work, neighbours, and groups. Participants were asked about close friends and relatives (‘people you feel at ease with and/or can talk to about what is on your mind’) because this ‘inner circle’ provides the most meaningful interaction post stroke. 1
Frequency of contact. Face-to-face contact is the most obvious route to receive social support (e.g. emotional, tangible), and as such is an important aspect of social network functioning.22,23 Items on telephone, letter, and email contact were also included. Reduced telephone contact predicted loneliness in elderly individuals in the United States. 24 Moreover, stroke may lead to mobility problems and remote contact may be an important route to maintaining relationships.
Proximity. Locally based social networks have different properties to more distal networks, and potentially respond differently when a person becomes ill.1,13
Satisfaction with network. People vary widely in what they look for in their social network. Thus, it is important to consider the individual’s ‘view’ of their social network, and assess the extent to which the network fulfils their needs. 23 We therefore included a subjective measurement, satisfaction, in addition to analysing structural patterns. A single item on loneliness (the subjective state of feeling alone or apart from others 25 ) was also included to give further insight into how the individual perceived their social network.
Twenty-two potential items were then adapted by expert clinicians to become more accessible to those with aphasia, using a variety of methods. 26 Participants both heard and saw all the questions. The written version was designed to be easily comprehended (use of white space, suitable font size, keywords emboldened, reduced linguistic complexity, pre-prepared pictures to support comprehension of key concepts). Possible answers were displayed so that participants could point to a response. Appendix 1 (available online) is an abbreviated version of the SSNS.
Design and participants
This research was part of a larger study assessing the psychometric properties of the Stroke and Aphasia Quality of Life Scale-39 in a generic stroke population (SAQOL-39g). 27 Participants were recruited from two teaching hospitals’ acute stroke units. Eligibility criteria comprised: admitted to hospital with a first ever stroke; stay in hospital for at least three days; > 18 years old. People were excluded if they: did not live at home prior to the stroke; had a known history of mental health problems or cognitive decline prior to the stroke; had other severe or potentially terminal comorbidity; were unable to give informed consent; did not speak English premorbidly (self and/or family report). Participants were interviewed at two weeks, three months and six months post stroke (SD one week).
Procedures and measures
The study was approved by the relevant National Health Service (NHS) Local Research Ethics Committees. All interviews were carried out by aphasia-specialist speech and language therapists. When necessary, for example if a participant became tired, the interview was completed over more than one session.
Participants completed the following measures in the same order, in interview format.
The Frenchay Aphasia Screening Test (FAST): 28 to identify those with aphasia and to determine whether participants would be able to self-report on the questionnaires used (score range 0–30, with higher scores indicating better language skills. For those scoring < 7/15 on the receptive domains (severe receptive aphasia),26,29 proxy respondents were used: their results are not reported here.
The National Institute for Health (NIH) Stroke Scale: 30 to assess stroke severity (score range 0–31, with high scores indicating more severe strokes).
The SAQOL-39: 29 to assess health-related quality of life (HRQL) (score range 1–5, with 5 indicating better HRQL).
The Medical Outcomes Studies (MOS) Social Support Survey: 31 to assess perceived social support (score range 1–5, with 5 indicating better support). Participants were also asked about how many comorbidities they had.
When completing the SSNS, participants were asked to consider their social network in the month before their stroke (two-week interview) or in the past month (three- and six-month interviews). In terms of scoring the measure, some items were not applicable: for example, for people who had no children, items relating to contact with children were not applicable (C2, C3). In these situations the imputed score given was 0 (‘not at all’). Equally, participants were not asked to rate their satisfaction with an element of their social network that was absent. In this situation, the overall satisfaction score was imputed. Finally, in order to reduce the effect of outliers, a decision was taken to cap the number of friends, relatives and groups (see Appendix 1). The rationale for where to place the cap was that aggregate endorsement frequencies should be >10%. 32 This means that adjacent response options for an item (e.g. ‘2 friends’ is an adjacent possible response to ‘3 friends’) should together account for at least 10% of total answers for that item. Raw scores were converted to have a range of 0–100. The overall score is the mean score of all items. Lower scores are indicative of a participant having fewer social ties.
Data analysis
Standard psychometric methods 33 were used to evaluate the SSNS, using parts of a framework developed by Lamping and colleagues. 34 The following criteria were used.
Acceptability
Missing data for each item should be <10%; floor/ceiling effects should be <80%; maximum endorsement frequencies (frequency of respondents endorsing any one response option) should be <80%; skewness values should range between 1 and −1 for 75% of the items (some skewness is expected for social factors post stroke).
Internal consistency
The extent to which the items in the scale measure the same construct was assessed by Cronbach’s alpha, and item total correlations. Criteria: Cronbach’s α > 0.70; item total correlations ≥0.20.
Construct validity – internal
Within-scale analyses provide evidence that a single construct is being measured, and that the items can combine to form a scale. There should be moderate correlations between subdomains and the overall score. Correlations between subdomains are dependent on the final factor structure: kin and non-kin factors would not be expected to correlate as there is evidence that some people with strong family ties (those in family-based social networks) can have fewer friendship ties. 19 Factor analysis should provide further evidence that a single construct is being measured. Specific criteria were: in unrotated principal component analysis (PCA) items should load >0.20 on the first component; in rotated principle axis factoring (PAF) items should load ≥0.40 and not cross load (i.e. load on two or more factors with values ≥0.40 and have a difference between them <0.20). There should be three or more items per factor. Two items could form a factor only if those items were highly correlated with one another, and relatively uncorrelated with other items. 35 Finally, the factor model should be conceptually clear.
Construct validity – external
Known group differences were evaluated by testing the following hypothesis: SSNS scores will be higher for those people with higher levels of perceived social support, i.e. those scoring ≥4 on the MOS Social Support Survey, indicating they felt support was available to them most or all of the time. Comparisons with external measures were used to evaluate convergent and discriminant validity. Hypotheses were: SSNS scores will correlate more highly with health-related quality of life (Stroke and Aphasia Quality of Life Scale-39g) and severity of aphasia (Frenchay Aphasia Screening Test) than with stroke severity (NIH Stroke Scale) or number of comorbidities.
Responsiveness to change
Responsiveness to change was assessed with effect sizes (two week mean – six month mean/SD of two week mean) and standardised response means (SRMs) (two week mean – six month mean/SD of change score). The size of a person’s network typically reduces post stroke, and it is the non-kin elements of the network that are most vulnerable. 36 It was hypothesised that there would be moderate effect size and SRM from two weeks to six months for the overall scale. In terms of subscales, one would not anticipate significant change in any ‘family’ factor, as this component of the network is relatively stable. 36 However, non-kin factors should demonstrate change between two weeks and six months. Thus, larger effect sizes and SRMs were anticipated for non-kin than for kin factors.
All psychometric analyses were carried out on the data collected three months after stroke, with the exception of responsiveness to change: meaningful change is more likely to occur over six months, hence the decision to use the two week to six month rather than three month data set for this analysis. Analysis was performed using IBM SPSS Version 19.
Results
Of 126 eligible people, 96 (76%) agreed to take part. Nine participants had such severe receptive aphasia that proxy respondents were used and their results are not reported here. Table 1 presents the characteristics of the remaining 87 (69%). Of those, 76 (87%) were followed-up at three months, and 71 (82%) at six months. Participant characteristics at three and six months were similar to the overall sample.
Participant characteristics.
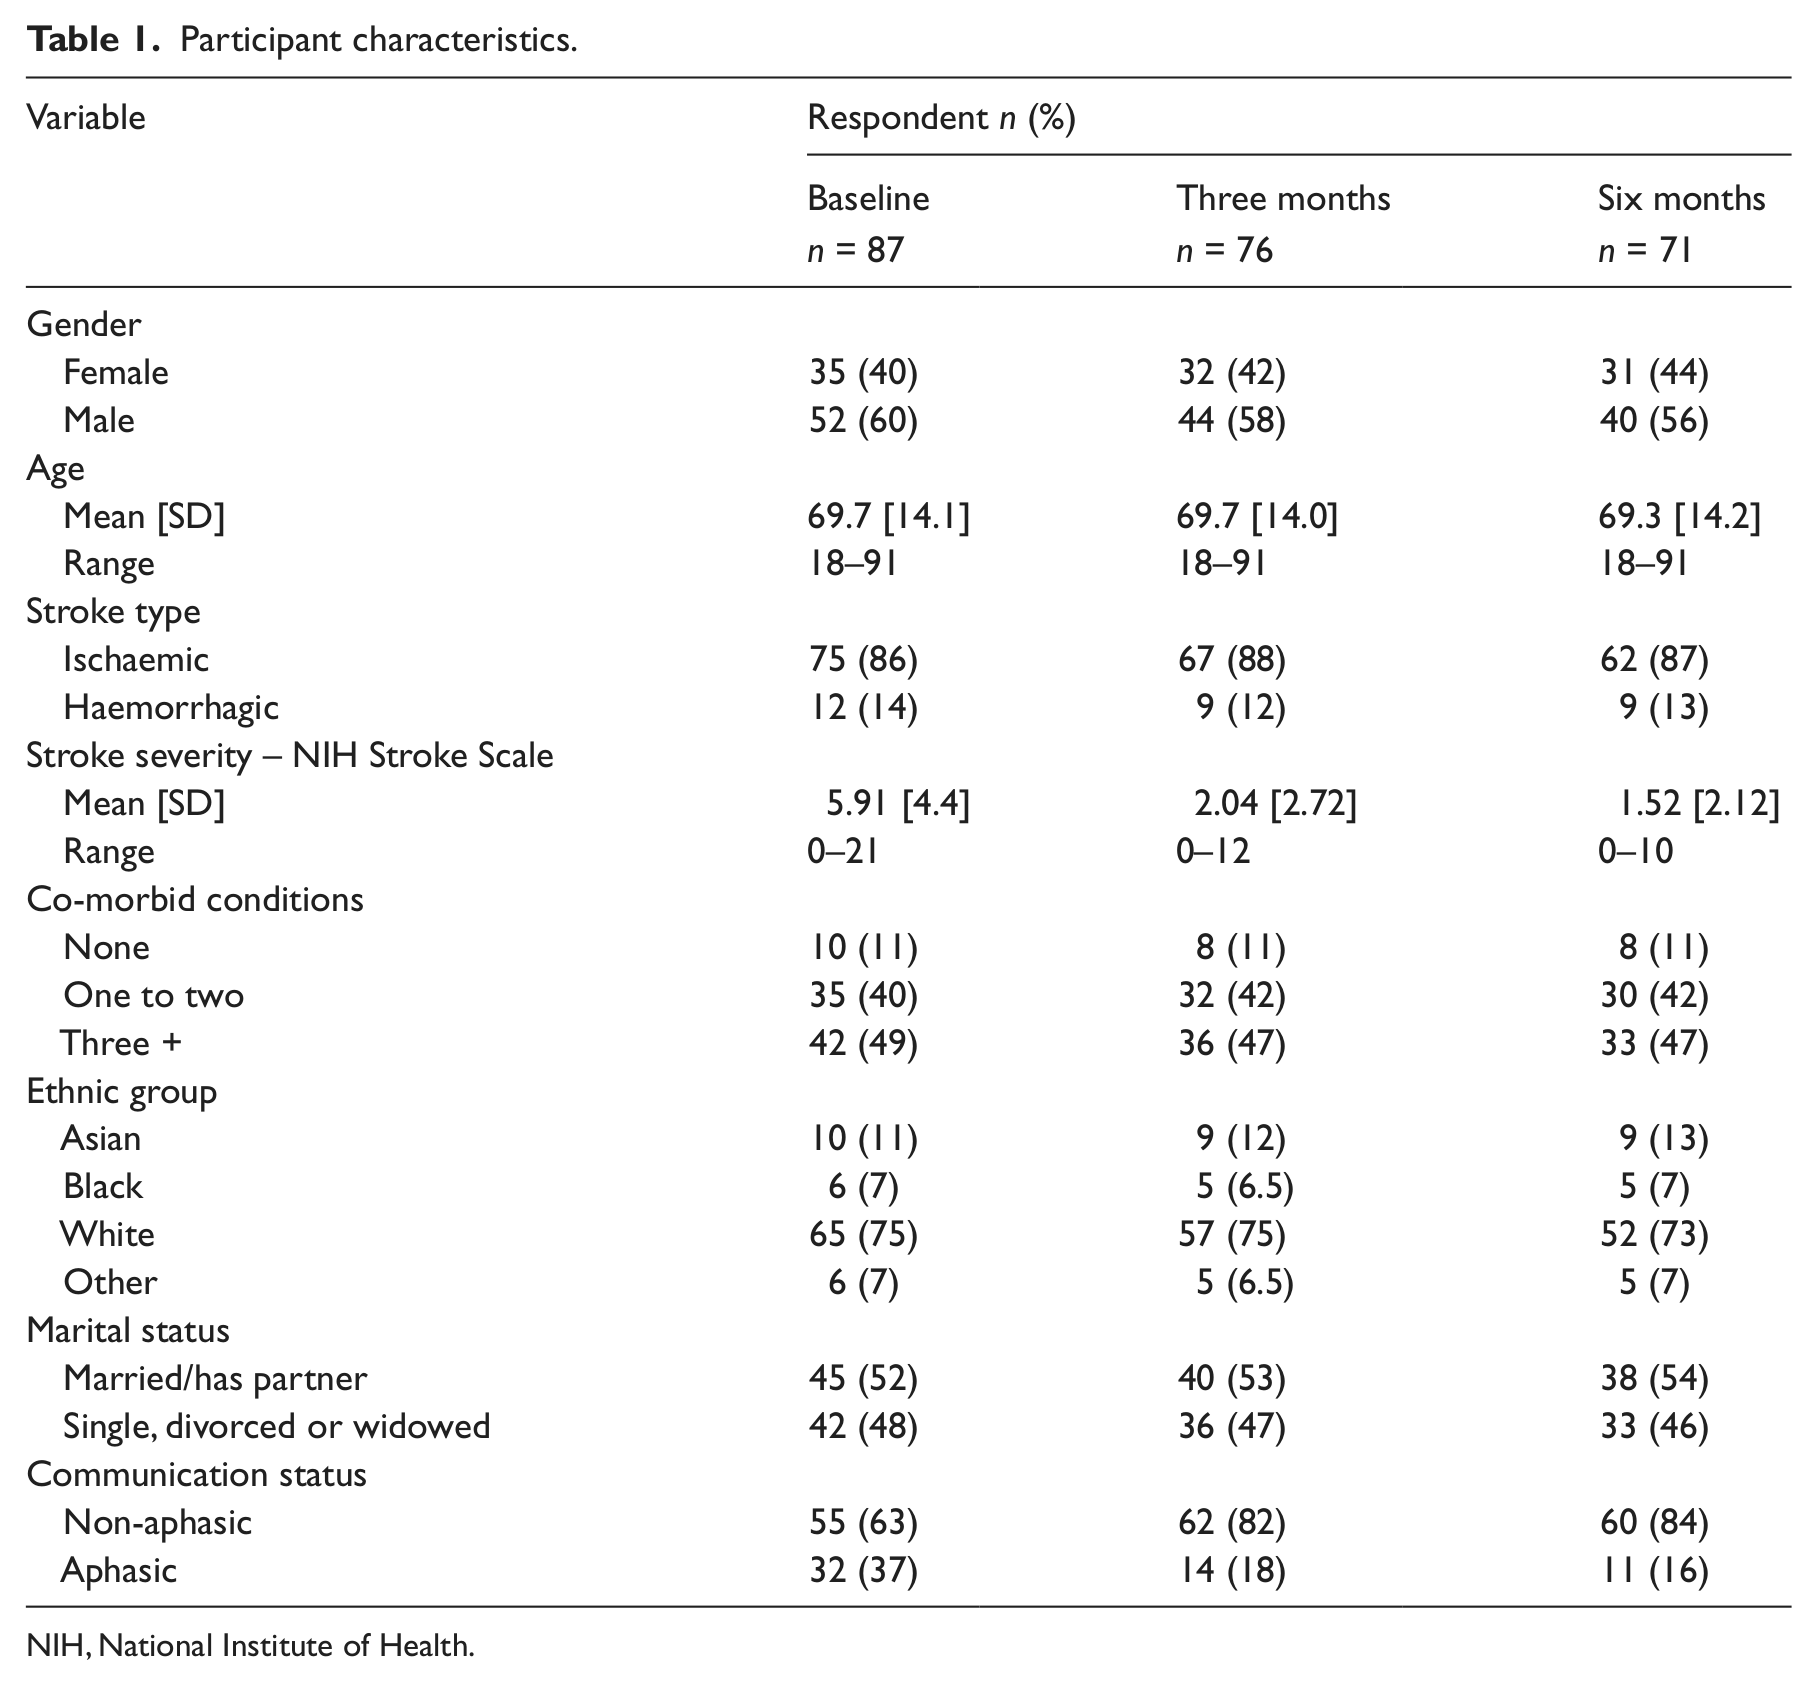
NIH, National Institute of Health.
In terms of questionnaire development, of the initial 22 items, three were deleted: WN1 (contact with neighbours), WN4 (work) and MS1 (marital status). These items did not fit well with the underlying construct being measured (item total correlations <0.20; loaded on to the first component of the unrotated PCA <0.20). Further, few people in the study were in work, thus WN4 showed floor effects (>80% selected the ‘not in paid or voluntary work’ option). Additionally, there were concerns about the dichotomous nature of MS1. 33 Finally, when principle axis factor analysis was carried out, none of these items loaded on to any factor >0.40. All analyses of psychometric properties below relate to the final 19-item version of the scale (see Appendix 1, available online).
Table 2 summarises the psychometric properties of the 19-item SSNS.
Psychometric properties of the 19-item SSNS.
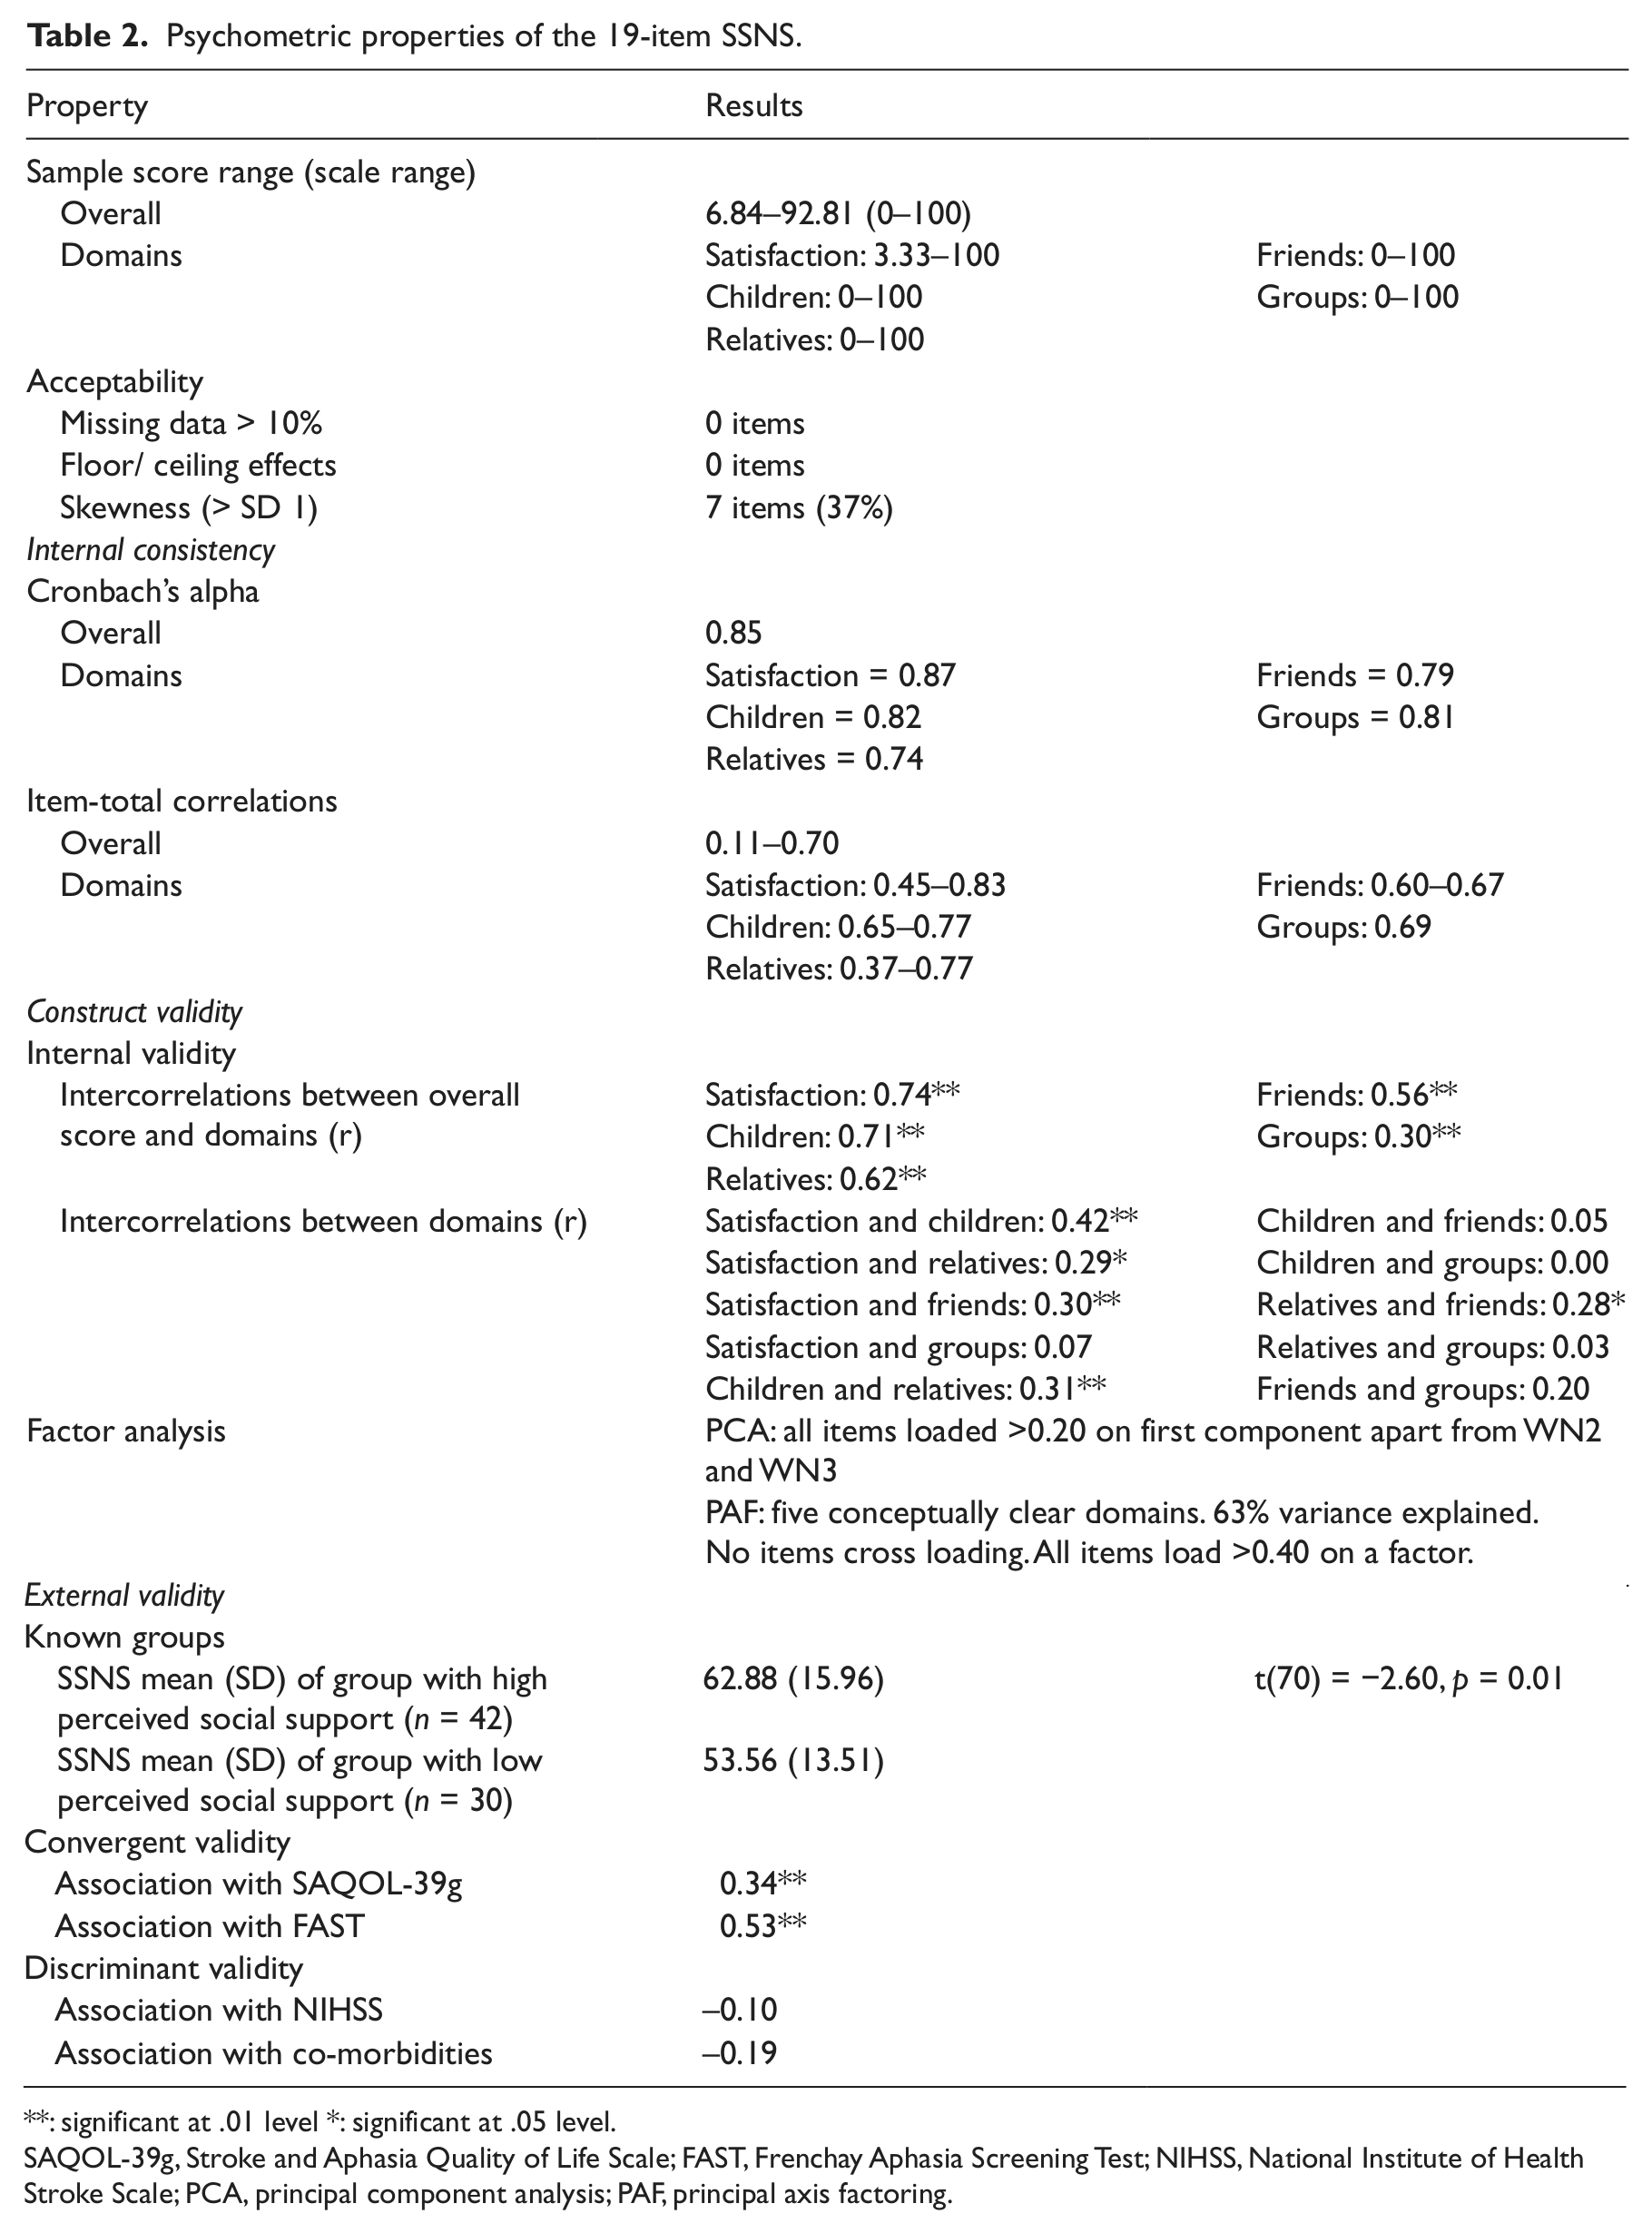
: significant at .01 level *: significant at .05 level.
SAQOL-39g, Stroke and Aphasia Quality of Life Scale; FAST, Frenchay Aphasia Screening Test; NIHSS, National Institute of Health Stroke Scale; PCA, principal component analysis; PAF, principal axis factoring.
Acceptability
The proportion of missing data was low (0–5.3%) and no items showed floor or ceiling effects. Seven items had skewed distributions: all the satisfaction items (S1, S2, S3, S4, L1) that were negatively skewed (participants reporting they were satisfied/ not lonely) and the group items (WN2, WN3) that were positively skewed (skewed towards few groups).
Internal consistency
For the overall scale, Cronbach’s α = 0.85. Item-total correlations ranged from 0.11 to 0.70, with only two items <0.20 (WN2 and WN3).
Construct validity – internal
All five subdomains correlated moderately with the total mean. Related subdomains correlated with one another (e.g. relatives with children, r = 0.31, p < 0.01), whereas non-kin subdomains did not correlate with kin subdomains (e.g. children with friends, r = 0.05, ns). In unrotated PCA, all items loaded on to the first component >0.20, other than WN2 and WN3. Principle axis factor analysis with varimax rotation was then used to identify a subdomain structure. The Kaiser–Meyer–Olkin measure of sampling adequacy was acceptable (0.73), and Bartlett’s test of sphericity was significant (p < 0.001). The final model (Table 3) for the 19-item SSNS met the set criteria, explained 63% of the variance, and included five factors: satisfaction, children, relatives, friends, groups. WN2 and WN3 formed a two-variable factor. This was acceptable as they correlated highly with one another (r = 0.69) but not with other variables. Other factors contained between three and six items.
Factor structure of the 19-item SSNS.
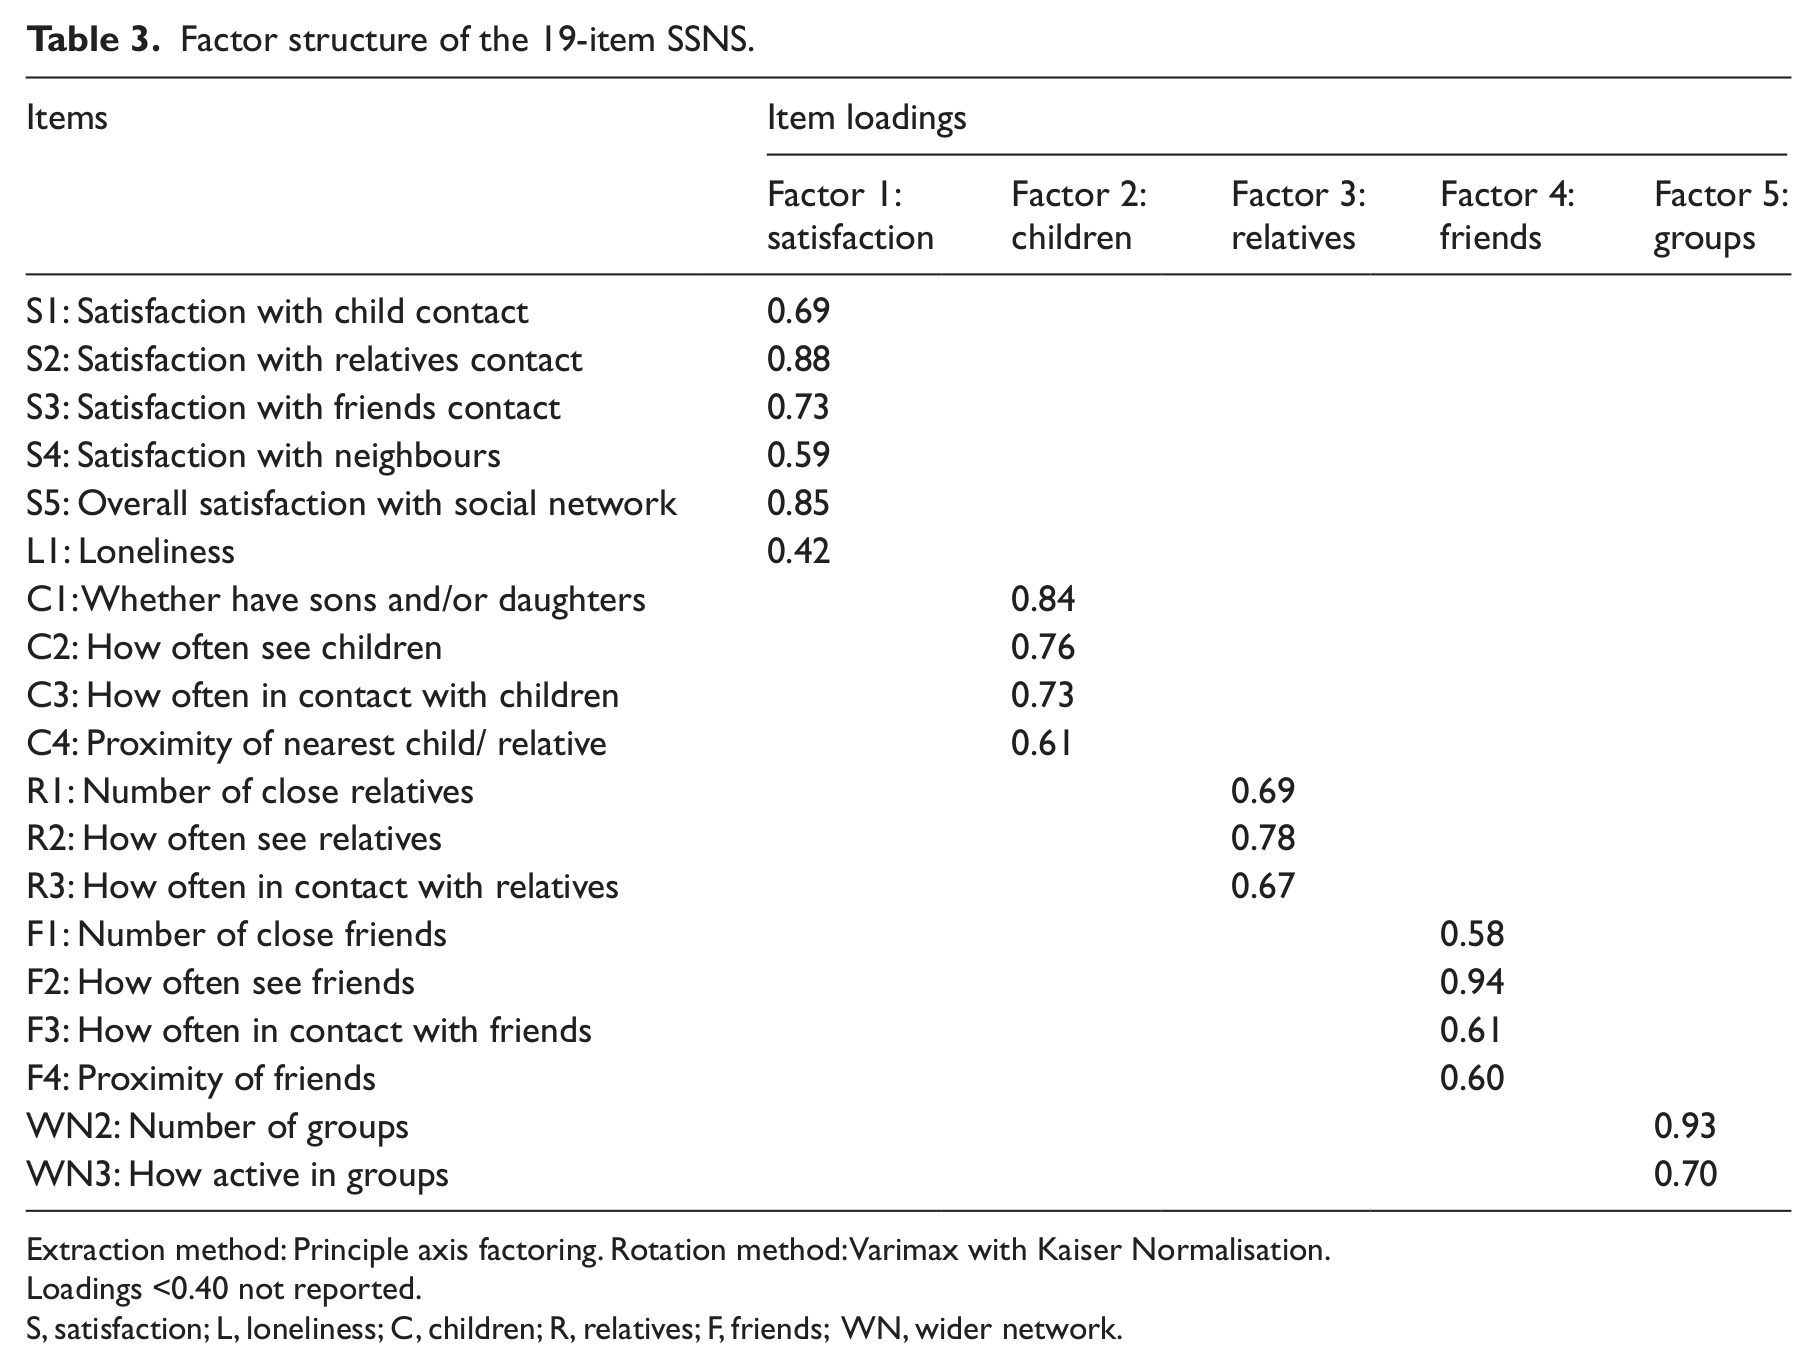
Extraction method: Principle axis factoring. Rotation method: Varimax with Kaiser Normalisation.
Loadings <0.40 not reported.
S, satisfaction; L, loneliness; C, children; R, relatives; F, friends; WN, wider network.
Construct validity – external
There was good evidence of convergent (r = 0.34; r = 0.53) and discriminant (r = −0.10; r = −0.19) validity. The SSNS was also able to differentiate between known groups: those who felt better supported (scored ≥4 on the MOS Social Support Survey) had higher SSNS scores, mean (SD) = 62.88 (15.96), than those who felt less supported, mean (SD) = 53.56 (13.51); t (70) = −2.60, p = 0.01.
Responsiveness to change
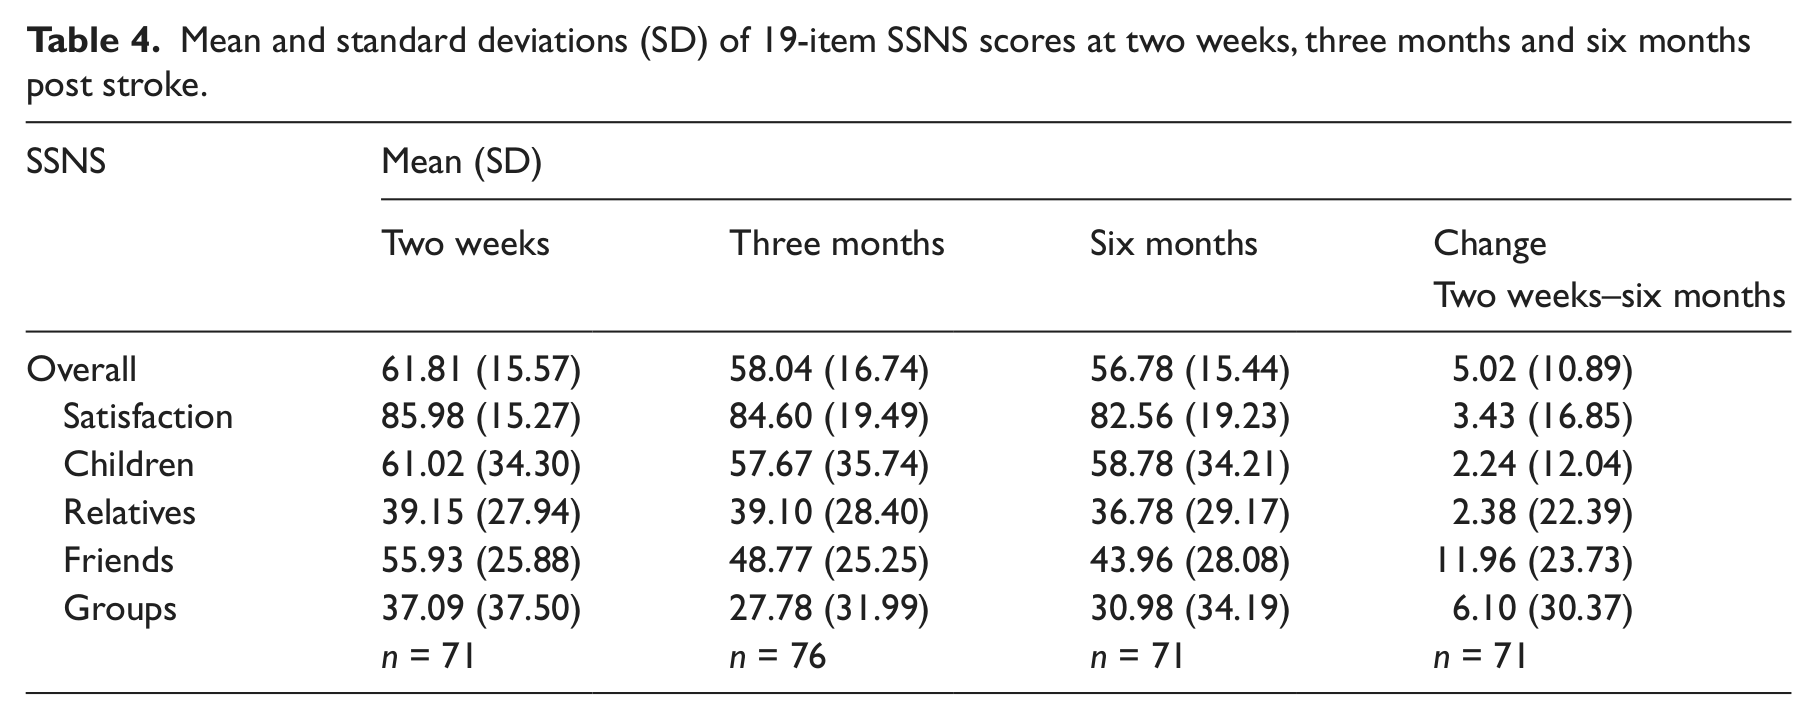
Table 4 shows SSNS overall and subdomain scores at two weeks, three months and six months. Effect sizes and SRMs are shown in Table 5, and support the responsiveness to change of the scale. As anticipated, there were moderate changes between two weeks and six months. The friends subdomain demonstrated more change (d = 0.48; SRM = 0.50) than the family subdomains (d = 0.06–0.08; SRM = 0.11–0.19).
Mean and standard deviations (SD) of 19-item SSNS scores at two weeks, three months and six months post stroke.
Responsiveness to change of the 19-item SSNS.
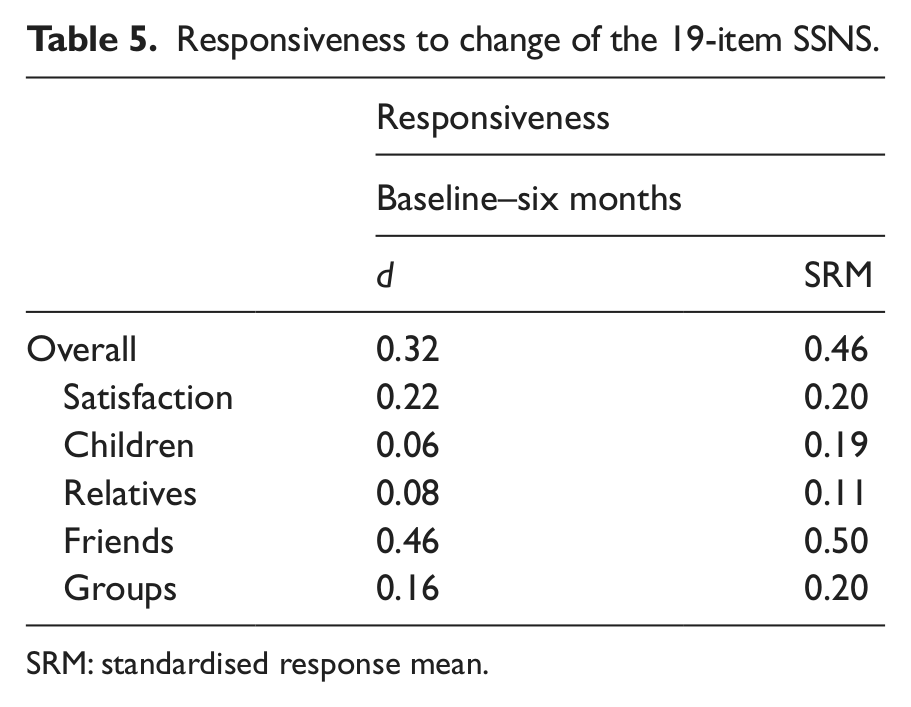
SRM: standardised response mean.
Discussion
The SSNS is a new patient-reported measure of a person’s social network following a stroke, which has been evaluated with a stroke population comprising both those with and without aphasia. It measures five subdomains: satisfaction with social network; children; relatives; friends; and groups. The 19-item SSNS demonstrated good acceptability, internal consistency, validity and responsiveness to change.
Five of the original 22 items had item-total correlations <0.20: WN1, WN2, WN3, WN4 and MS1 (items relating to the wider network, as well as marital status). In the final 19-item scale, three of these items were deleted, as they failed in a range of psychometric criteria tested, including a good fit with the model derived from factor analysis. WN2 and WN3 were retained, however. These two items relate to group membership. A decision was made to keep them within the scale for two reasons: first, group membership is potentially something that clinicians can directly influence, thus understanding this element of the social network may be of particular clinical interest. Second, they were the only element of the wider social network still remaining in the scale, and it might be anticipated that this more peripheral element of the network would be more affected by having a stroke. 3 In fact, in this sample, there was no significant change from two weeks to six months post stroke for the group factor: this may reflect that even prior to the stroke, group membership was low, with mean number of groups (SD) = 0.88 (1.03), and roughly 50% of participants not belonging to any groups. Six months post stroke, the mean number (SD) of groups had reduced only slightly to 0.79 (1.0), with 48% still belonging to at least one group.
A strength of the study was that most people with aphasia were able to take part in the project: only those with severe receptive aphasia were unable to complete the questionnaires used. The questionnaires were administered in interview format, by speech and language therapists skilled in facilitating the responses of those with aphasia. Further, the questionnaires were modified to make them accessible to people with language difficulties (for example, reduced linguistic complexity, use of white space, keywords emboldened 37 ). Another strength of the study is that the participants’ characteristics were similar to the stroke population of the United Kingdom: the majority were male (60%), and over 65 years old (76%).
The 19-item SSNS showed good internal consistency (Cronbach’s α = 0.85) and a conceptually clear subdomain structure. It correlated with other measures as expected (convergent and discriminant validity) and differentiated between those who felt well supported, and those who felt less well supported. Responsiveness to change was in line with expectations: social networks typically reduce after a stroke, with the family elements remaining more stable than the friends’ elements. A strength of the scale is the emphasis on satisfaction with social network: how satisfied a person feels has been found to be more predictive of future psychological distress than size of network following a stroke. 38 Unlike other social network measures,9,11–13, it has been validated on both those with and without aphasia following a stroke. It is also relatively brief to administer, compared with, for example, the Social Support Inventory for Stroke Survivors (SSISS), which consists of 75 questions, 12 while having comparable psychometric properties (Cronbach’s alpha: SSISS = 0.84; SSNS = 0.85).
One limitation of the study was that of the 87 people that were recruited, 71 completed the study at six months post stroke. Nonetheless, this still represents a follow-up rate of 82% of our sample, which is comparable with other stroke studies. Another issue is that test–retest reliability has not yet been tested. In future research, as is common with new measures, the SSNS should be re-evaluated in independent samples to test its test–retest reliability and confirm its psychometric properties, including in the longer term post stroke.
For researchers, the SSNS may enable more detailed understanding of what happens to social network functioning after a stroke, including which subdomains are particularly vulnerable to change (friendships) and which are more robust (children). The scale could also be used to analyse the associations between social network functioning and other variables, such as psychological distress. Comparisons could be made between the social networks of those with and without aphasia. Clinicians may find the SSNS helpful in order to work out the social network profile of any individual client (for example, whether their social network is family or friends based), which may enable them to better support the individual. 13 Further, it could be of clinical use in highlighting those people who are dissatisfied with their social network, or who have small networks and may be vulnerable to becoming isolated.
In summary, the SSNS shows good internal consistency, validity and responsiveness to change. It can be used to measure the social networks of both those with and without aphasia following a stroke: those with mild–moderate receptive aphasia and even severe expressive aphasia are all able to complete the questionnaire when it is delivered in interview format. Use of the measure in clinical practice could help clinicians to monitor stroke survivors’ social networks, and enable researchers to develop a clearer understanding of how social networks change following a stroke.
Clinical messages
The Stroke Social Network Scale shows good internal consistency, validity and responsiveness to change.
The scale may help clinicians identify those dissatisfied with their social networks.
The scale can be used both for those with and without aphasia.
Footnotes
Acknowledgements
The authors would like to thank all the participants as well as the clinical teams at St Mary’s Hospital, London, and the Royal Free Hospital, London, without whom this project would not have been possible. Thanks also go to Alice Lamb for her help at the data collection stage.
Conflict of interest
None declared.
Funding
This study was supported by a grant from the Consortium for Healthcare Research of the Health Foundation and a PhD studentship funded by City University London.
References
Supplementary Material
Please find the following supplemental material available below.
For Open Access articles published under a Creative Commons License, all supplemental material carries the same license as the article it is associated with.
For non-Open Access articles published, all supplemental material carries a non-exclusive license, and permission requests for re-use of supplemental material or any part of supplemental material shall be sent directly to the copyright owner as specified in the copyright notice associated with the article.