
Abstract
Objective:
We aimed to determine prevalence of pre-stroke frailty in acute stroke and describe validity of a Frailty Index–based assessment.
Design:
Cross-sectional.
Setting:
Single UK urban teaching hospital.
Subjects:
Consecutive acute stroke unit admissions, recruited in four waves (May 2016–August 2018). We performed the assessments within first week and attempted to include all admissions.
Main measures:
Our primary measure was a Frailty Index, based on cumulative disorders. A proportion of participants were also assessed with the ‘Frail non-disabled’ questionnaire. We evaluated concurrent validity of Frailty Index against variables associated with frailty in non-stroke populations. We described predictive validity of Frailty Index for stroke severity and delirium. We described convergent validity, quantifying agreement between frailty assessments and a measure of pre-stroke disability (modified Rankin Scale) using kappa statistics and correlations.
Results:
We included 546 patients. A Frailty Index–defined frailty syndrome was observed in 427 of 545 patients (78%), of whom, 151 (28%) had frank frailty and 276 (51%) were pre-frail. Phenotypic frailty was observed in 72 of 258 patients (28%). We demonstrated concurrent validity via significant associations with all variables (all p < 0.01). We demonstrated predictive validity for stroke severity and delirium (p < 0.01). Agreement between the frailty measures was poor (kappa = –0.06) and convergent validity was moderate (Frail non-disabled ‘Cramer’s V’ = 0.25; modified Rankin Scale ‘Cramer’s V’ = 0.47).
Conclusion:
Frailty is present in around one in four patients with acute stroke; if pre-frailty is included, then a frailty syndrome is seen in three out of four patients. The Frailty Index is a valid measure of frailty in stroke; however, there is little agreement between this scale and other measurements of frailty.
Introduction
Stroke and frailty are prevalent conditions in the elderly and are associated with mortality, long-term hospitalization, and disability.1–6 Frailty assessment is increasingly being incorporated into routine practice in the acute care setting. 7 However, the prevalence of frailty and methods for frailty assessment are largely unstudied in the acute stroke population.
Frailty is widely recognized as a clinical condition; however, there is currently no universally accepted operational definition. The two predominant positions on the frailty concept are the Rockwood ‘accumulated deficits’ and the Fried ‘frailty phenotype’.8,9 The Rockwood model defines frailty as a state of heightened risk of adverse health that is a by-product of the accumulation of age-related health conditions. The Fried model frames frailty as a biological syndrome characterized by common factors including weight loss, exhaustion, slow mobility, limited physical activity, and weakness. In addition to frank frailty, there is also a potential state of ‘pre-frailty’, defined as a state of heightened risk for becoming frail but not currently considered frail.
There are variable methods of frailty assessment, depending upon the definition applied. A Frailty Index can be calculated as a measure of cumulative deficits. 10 Alternatively, the frailty phenotype can be detected via self-report questionnaire. 11 These two approaches are validated in older adults and increasingly used in clinical practice and research. However, neither assessment has been adequately validated in stroke. In stroke, pre-stroke function is often measured using the modified Rankin Scale. This has been used as a proxy of frailty but was never designed for this purpose and is not well suited for describing the pre-stroke state. 12
Given the frailty state’s association with adverse outcomes, 13 it is important to establish frailty prevalence and validate the predominant means of assessment within the stroke population.
We aimed to describe the prevalence of pre-stroke frailty in a ‘real world’ acute stroke setting and validate a commonly used method for determining frailty status. Our primary focus was frailty assessment using the Rockwood Frailty Index approach. We then assessed concurrent, predictive, and convergent validity of the Frailty Index. To allow comparison, we also assessed frailty as measured by a phenotypic (Fried) approach and used the modified Rankin Scale as a pre-stroke disability assessment.
Method
We conducted a cross-sectional analysis, based on prospectively collected anonymized patient-level data. Full National Health Service (NHS) research ethics approval was granted for this project (ws/16/0001). The design, conduct, and reporting of this study was informed by the Strengthening the Reporting of Observational Studies in Epidemiology (STROBE) 14 and Standards of Reporting of Neurological Disorders (STROND) guidance. 15 The data that support the findings of this study are available from the corresponding author upon reasonable request.
We recruited patients consecutively admitted to the acute stroke unit at a single urban teaching hospital. The unit is part of a nationally funded healthcare service and admits all suspected and confirmed stroke and transient ischaemic attack (TIA) patients and operates no exclusions around age, disability, or comorbidity.
Patient recruitment occurred in four waves, chosen to ensure no confounding from temporal variation in stroke case mix: Wave 1 was from May 2016 to February 2017, Wave 2 from April to June 2017, Wave 3 from October to December 2017, and Wave 4 from July 2018 to August 2018. All patients with stroke were included. Our approvals allowed for inclusion of patients who were unable to consent to assessment.
Clinical and demographic data were collected for each patient at point of assessment by trained researchers. Assessments occurred on the day of admission up to five days after admission. Data collected were a mix of prospective assessment and retrospective chart review. Pre-stroke functioning was established using modified Rankin Scale, 16 where a cut-off of ⩾2 was used to define disability. In addition, stroke severity was determined by National Institutes of Health Stroke Scale (NIHSS); 17 pre-stroke cognitive impairment and post-stroke delirium were assessed by stroke physicians guided by the informant section of the General Practitioner Cognitive Assessment 18 (cut-off ⩾3 used to identify pre-stroke cognitive impairment) and the ‘4 A’s test’ (www.the4AT.com; cut-off ⩾4 used to identify possible delirium). Age, medication count, and pre-stroke care-home residence were established via medical notes.
We used two methods for the assessment of pre-stroke frailty; one conformed to the Rockwood accumulated deficits concept and the other to the Fried ‘frailty phenotype’ model. Based on the former, a 33-item Frailty Index was created according to recommended guidelines 19 (Supplementary Figure S1). Patient medical records were used to identify medical conditions present before the stroke. Frailty Index scores were then generated for all patients by two researchers (M.T.-R. and G.C.). We created a list of 33 frailty indicator conditions, symptoms, or problems. The Frailty Index was created by dividing the number of pre-specified conditions on our list that were present before the stroke by the total number of conditions defined in the index list (i.e. 33). Thus, possible scores ranged from 0.0 to 1.0, with scores closer to 1.0 suggesting greater frailty. Patients were categorized as ‘robust’, ‘pre-frail’, and ‘frail’ using recommended cut-points of <0.08, 0.08–0.24, and >0.24, respectively. 20
An assessment of Fried phenotype frailty was added to the prospective data set after the first-wave data collection was complete. We used the self-report ‘Frail non-Disabled’ questionnaire. 21 This frailty assessment method was introduced to complement, and did not replace, the Frailty Index assessment method. Patients were categorized as frail if they and/or a proxy reported any one of the following: unintentional loss of more than 4 kg of weight over the previous year, self-reported exhaustion for more than two days in the week before admission, and less than 4 hours of physical activity over a two-week period before admission. Patients who could not fully complete the self-report Frail non-Disabled questionnaire for any reason (e.g. unconscious, too confused, and severely aphasic) were deemed non-testable.
Analyses
For analysis of prevalence of pre-stroke frailty, we performed a sample size calculation, based on expected prevalence of 15% and error of 0.05; we required a minimum of 196 participants to give us an estimate of prevalence with 95% confidence.
We described prevalence of ‘frailty’, ‘pre-frailty’, and ‘robust’ status based upon observed percentages within the population; confidence intervals (CIs) were generated for each prevalence estimate via Z-tests. As Frail non-Disabled questionnaire data were only available for a proportion of patients, we conducted a post hoc logistic regression analysis with Frail non-Disabled (testable/untestable) as the dependent variable and stroke severity (NIHSS score) as the independent variable to examine cause of missing frailty phenotype data.
To evaluate the Frailty Index as a measure of frailty in stroke, we conducted a series of validity assessments. We assessed concurrent validity by exploring associations between Frailty Index and a series of factors plausibly related to frailty: age, sex, 22 number of medications, pre-stroke cognitive impairment, and care-home residence. We used Spearman’s correlation for continuous variables and chi-square for dichotomous variables.
We assessed predictive validity of the Frailty Index as a measure of pre-stroke frailty based on associations with a common complication of stroke that frail patients are typically vulnerable to – post-stroke delirium. We used a logistic regression analysis with incident delirium as the dependent variable and score on Frailty Index as the independent variable. As frail patients are generally vulnerable to acute stressors, we also examined if pre-stroke frailty was associated with stroke severity (NIHSS) using linear regression analysis, with score on NIHSS as the dependent variable and Frailty Index as the independent variable. We then used multiple regression analyses, controlling for age, sex, and number of medications, to further explore the associations between scores on the Frailty Index and delirium and stroke severity. All variables were forced into the regression model.
We assessed convergent validity describing chi-square correlation between Frailty Index (dichotomized: frail/non-frail), phenotypic frailty (dichotomized: frail/robust), and pre-stroke modified Rankin Scale (dichotomized: disabled/non-disabled). We also explored agreement between the measures using kappa statistics; overlap in frailty assessment results were compared for the differing frailty measures via 2 × 2 tables and Venn diagram.
We used SPSS statistics for Windows, version 24.0 (IBM Corp., Armonk, NY) for all analyses.
Results
A total of 546 patients were included. Population descriptive statistics are shown in Table 1.
Population demographics.
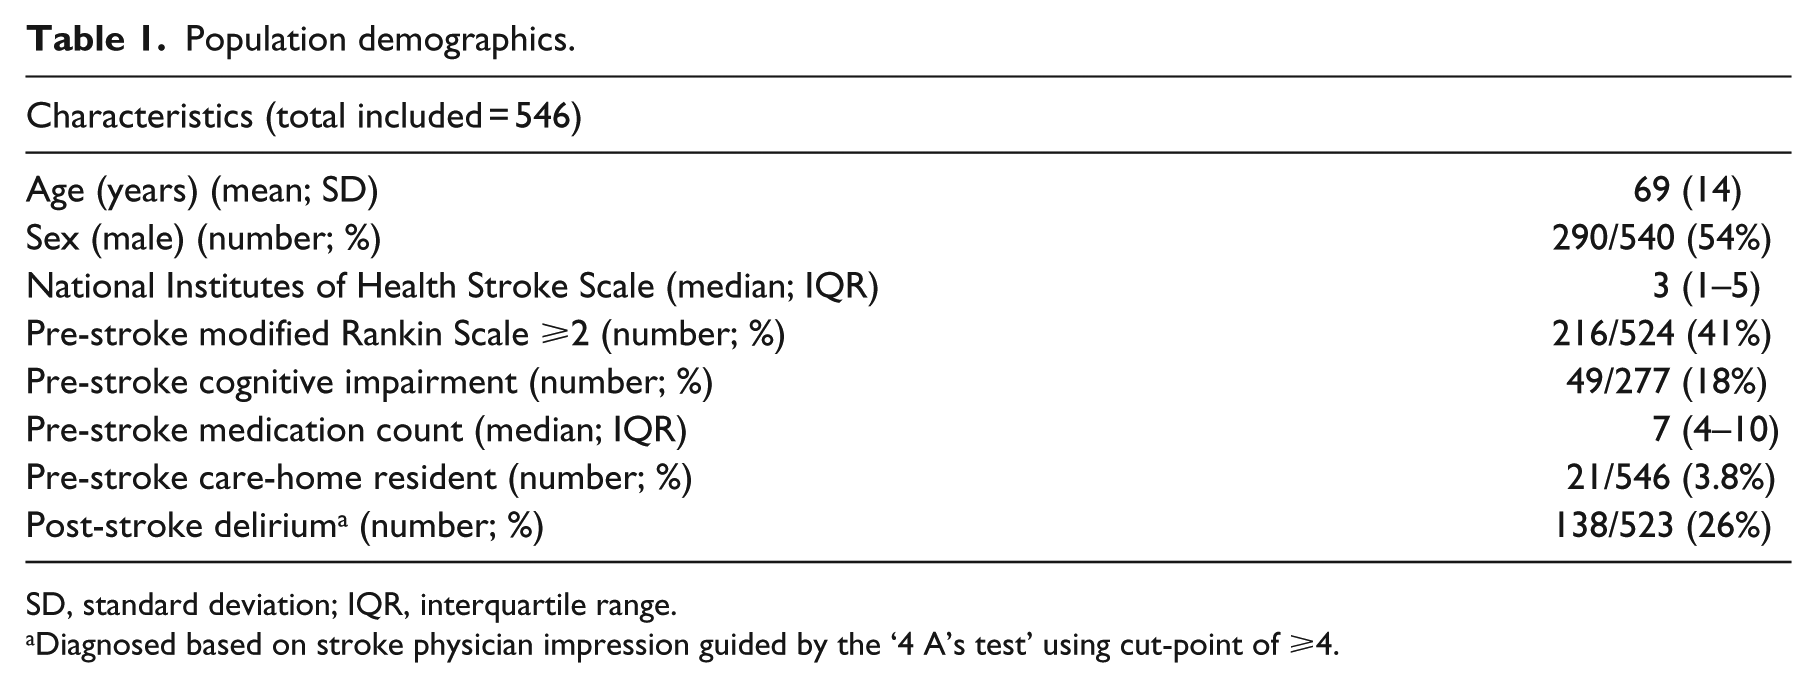
SD, standard deviation; IQR, interquartile range.
Diagnosed based on stroke physician impression guided by the ‘4 A’s test’ using cut-point of ⩾4.
Frailty prevalence
Frailty Index data were available for 545 of 546 patients (99.8%), of whom 151 (28%; 95% CI = 24%–31%) were frail according to Frailty Index. A further 276 (51%) were pre-frail and 118 (22%; 95% CI = 46%–55%) were robust. Median Frailty Index score was 0.18 (interquartile range (IQR) = 0.09–0.26).
Phenotypic frailty data were available for 258 of 347 patients; 89 of 347 (26%) patients’ full data were missing due to inability to complete the Frail non-Disabled questionnaire. Of patients with data available, 72 of 258 (28%; 95% CI = 23%–34%) were frail. Our post hoc logistic regression analysis indicated that more severe strokes were associated with non-completion of the Frail non-Disabled questionnaire (odds ratio (OR) = 1.21, 95% CI = 1.13–1.29; p < 0.01; Supplementary Table S2).
Concurrent validity
Frailty Index scores were significantly associated with all our pre-specified pre-stroke variables. Specifically, older patients, women, patients on higher numbers of medication, patients with pre-stroke cognitive impairment, and patients in a care home had significantly higher Frailty Index scores. Strength of correlations is described in Table 2.
Correlations between pre-stroke variables and Frailty Index.
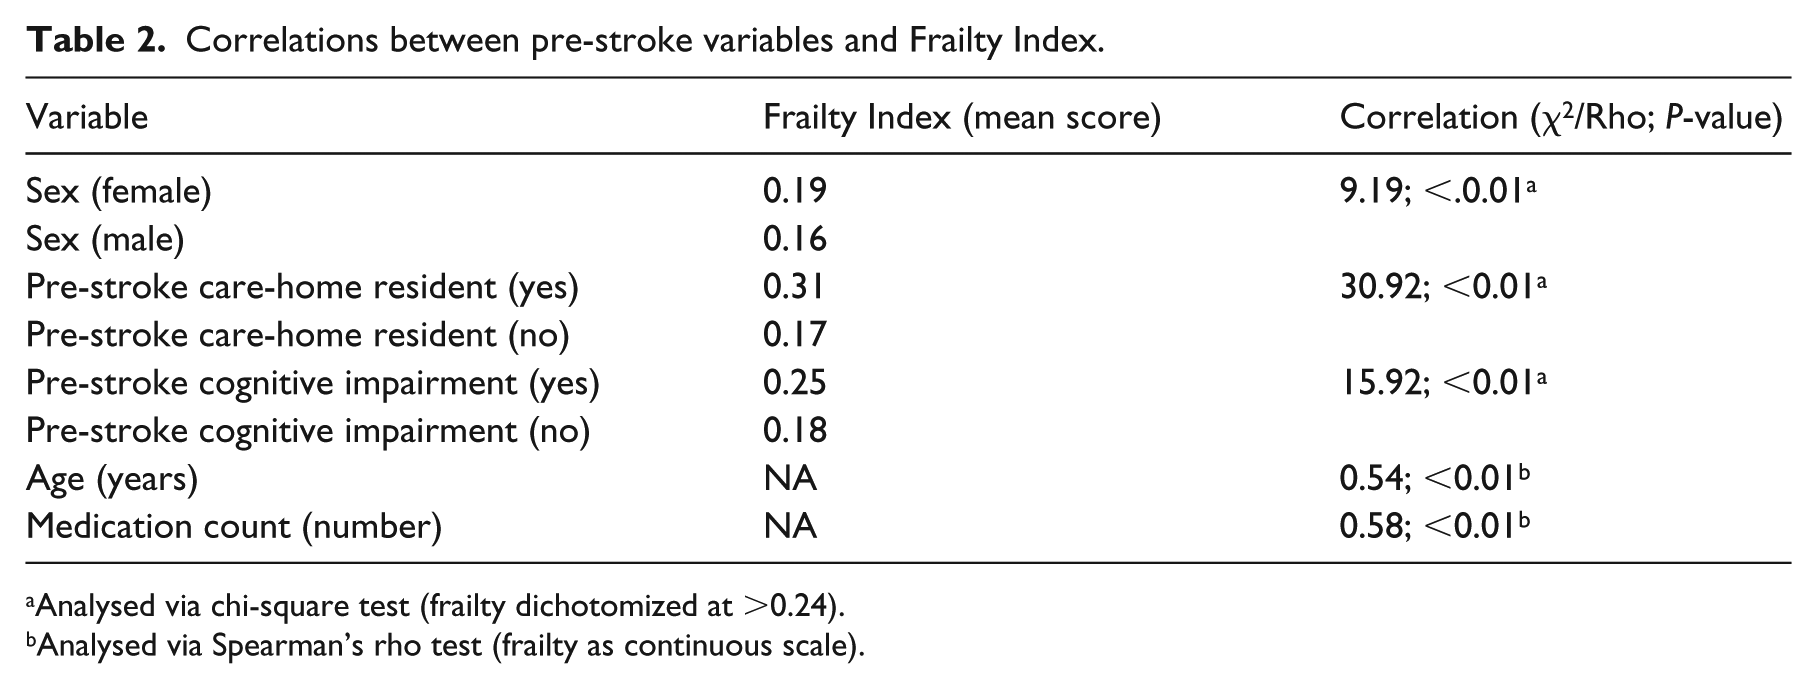
Analysed via chi-square test (frailty dichotomized at >0.24).
Analysed via Spearman’s rho test (frailty as continuous scale).
Predictive validity
Frailty Index was significantly associated with both the NIHSS (unstandardized beta = 0.085, 95% CI = 0.046–0.125; p < 0.01) and incident delirium (OR = 1.06, 95% CI = 1.04–1.08; p < 0.01) on univariate analysis. Specifically, as Frailty Index scores increased, so too did NIHSS scores and odds of delirium. However, after controlling for age, sex, and medication count, only the association between Frailty Index and delirium remained borderline significant (OR = 1.03, 95% CI = 1.00–1.05; p = 0.05; Table 3).
Regression analysis of the association of the Frailty Index with stroke severity (NIHSS) and odds of post-stroke delirium onset.
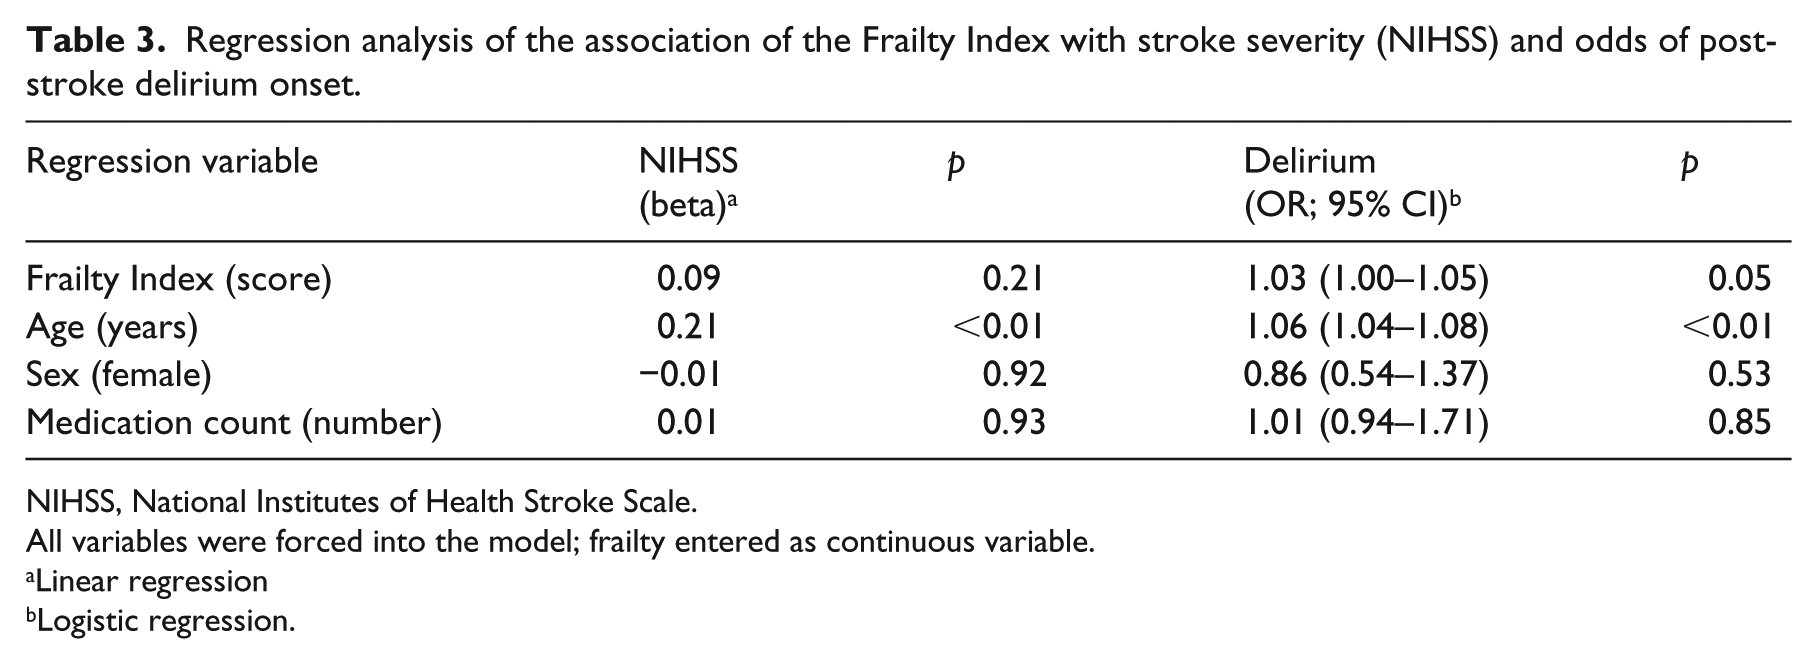
NIHSS, National Institutes of Health Stroke Scale.
All variables were forced into the model; frailty entered as continuous variable.
Linear regression
Logistic regression.
Convergent validity
For the 258 patients with Frail non-Disabled questionnaire data available, the Frailty Index demonstrated a moderate positive correlation with the Frail non-Disabled questionnaire (χ2 = 15.76; Cramer’s V = 0.25). Similarly, for the 524 patients with pre-stroke modified Rankin Scale data available, the Frailty Index demonstrated a moderate correlation with the pre-stroke modified Rankin Scale (χ2 = 116.55; Cramer’s V = 0.47).
There was only slight agreement between Frailty Index and phenotypic frailty (kappa = –0.06), with just 16 of 81 (20%) frail patients categorized as frail on both frailty measures (Table 4). For Frailty Index and pre-stroke modified Rankin Scale, agreement was moderate (kappa = 0.45) with 110 of 216 (51%) patients classified as disabled according to pre-stroke modified Rankin Scale also classified as frail according to the Frailty Index. There was only slight agreement between phenotypical frailty and modified Rankin Scale (kappa = –0.02) with 28 of 68 (41%) patients classified as phenotypically frail being classified as disabled according to the modified Rankin Scale (Figure 1).
Agreement between frailty/disability measures.
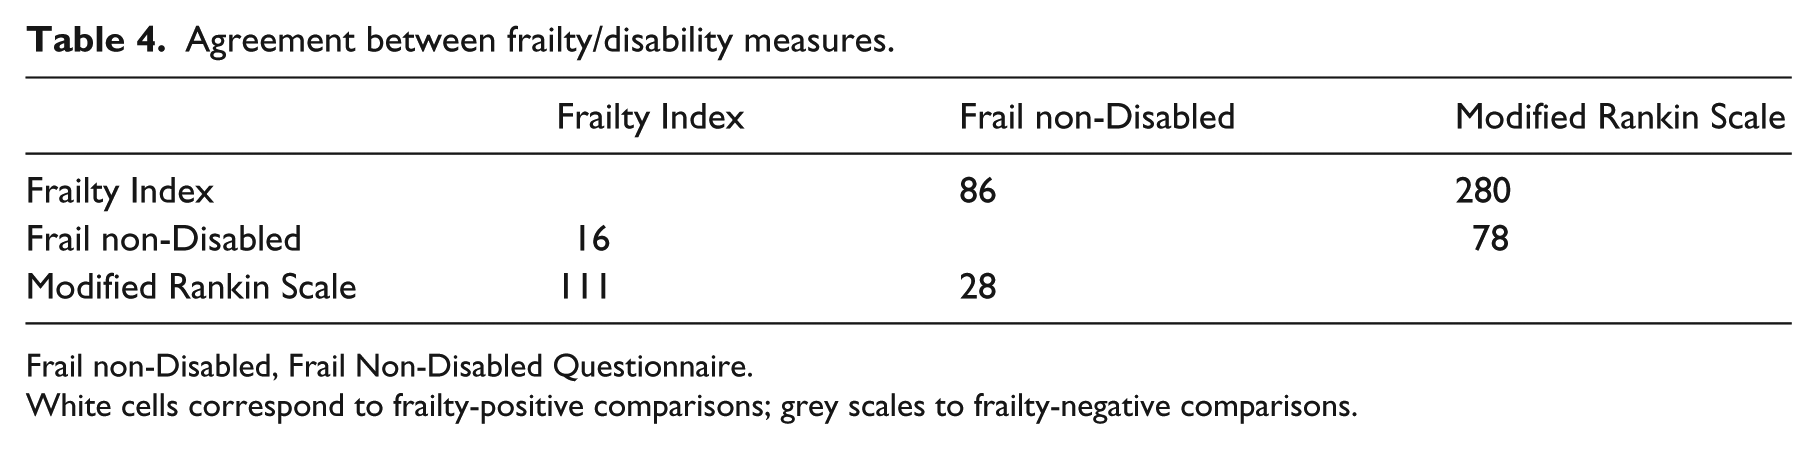
Frail non-Disabled, Frail Non-Disabled Questionnaire.
White cells correspond to frailty-positive comparisons; grey scales to frailty-negative comparisons.
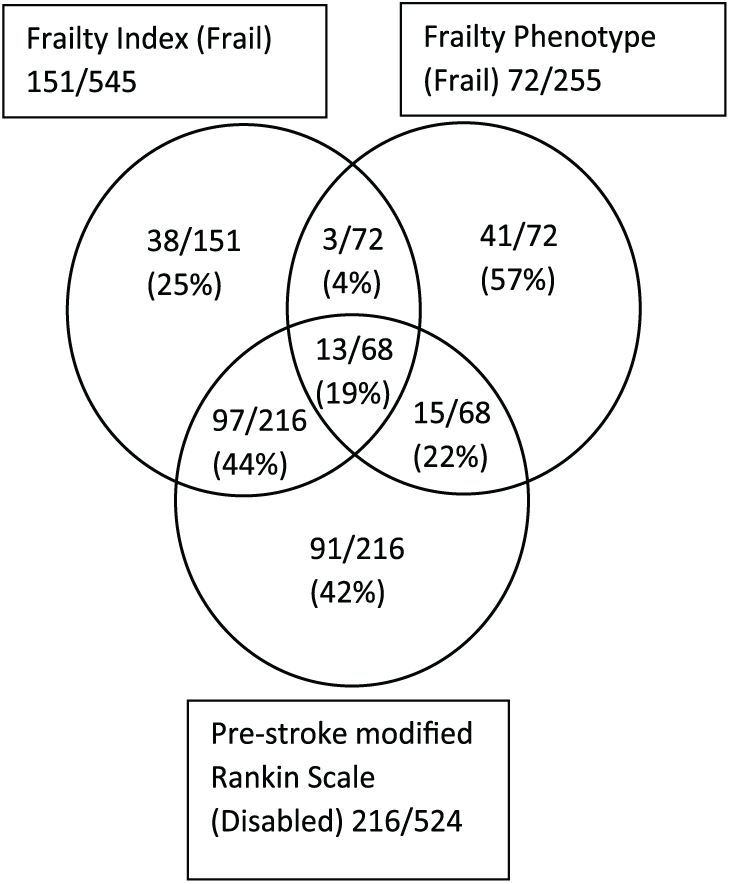
Frailty and disability overlap based on method of assessment.
Discussion
We sought to investigate the prevalence of frailty in stroke. We found that almost 80% of the patients admitted to an acute stroke unit were either frail or pre-frail according to Frailty Index criteria. Both the Frailty Index and frailty phenotype approach gave respective prevalence rates of 28%. These rates contrast with the 14% rate reported within a non-stroke hospital population and the 11% prevalence reported in community settings.23,24 Our results suggest that frailty presents a particularly significant burden in stroke, beyond what is typically observed in undifferentiated older adult populations. The pre-frail categorization is contentious, but that more than half of our sample were considered pre-frail before the stroke is particularly relevant. These patients may be at risk of becoming frail following stroke, with the stroke event pushing many across a threshold from ‘pre-frail’ to ‘frail’ status.
There are different ways to measure frailty. We chose to primarily evaluate the Frailty Index approach as this has been well validated in other acute settings and is being adopted in acute care settings; we also anticipated that it would be available for the majority of stroke admissions. Our intention was not to create a novel tool, rather we operationalized our Frailty Index using the same process that was used to develop the electronic Frailty Index that is being introduced in NHS England. 25
Our concurrent validity analyses were reassuring, confirming Frailty Index associations with variables previously demonstrated to be associated with frailty (age, sex, medication count, pre-stroke cognitive impairment, and care-home residence).20,24,26,27 The core concept in frailty is vulnerability to an acute stressor, with adverse outcomes when the person is exposed to acute illness or other insults. In this regard, our assessment of the association of frailty and incident delirium offers the most compelling validation, as delirium is considered an exemplar manifestation of the frailty state.
Our comparative analyses suggest that the method chosen for assessing frailty in stroke is important. There were only modest correlations between the Frailty Index, the phenotype measure, and pre-stroke modified Rankin Scale. Similar correlations were found by Rockwood’s group in an earlier paper. 20 Although prevalence rates suggested by our two frailty measures were similar, there was little agreement regarding which patients were classified as frail: only 20% of frail patients were categorized as such by both frailty measures, and kappa-based measures of agreement were little better than chance. These findings may be partly explained by non-completion bias for the phenotype measure, although previous studies have also highlighted issues with frailty identification based upon definition and assessment methods used. As few as 9.4% of frail patients were categorized as such by both a frailty phenotype and Frailty Index measure in one study, 28 while others reported that 30% of patients categorized as frail by an Frailty Index were categorized as ‘robust’ according to a Fried phenotype measure. 26 This lack of agreement likely reflects the differences in the respective concepts of frailty that are applied by our two measures. Our analyses are not designed to suggest a favoured approach to frailty assessment. An important assessment in this regard would be to compare post-stroke outcomes according to frailty defined using differing models, and this could be the basis for future research around stroke and frailty.
We have conducted a highly inclusive study with sequential recruitment involving patient groups (e.g. aphasic, acutely unwell, physically disabled, and cognitively impaired) that are typically excluded from stroke studies. We have also incorporated frailty measures assessing the two predominant frailty concepts.
However, there are some important limitations to our study. First of all, while inclusive, our population was restricted to a single urban teaching hospital that admits a largely socioeconomically deprived and Caucasian population. As such, our frailty prevalence rates may not be generalizable to settings with a very different case mix. 29 Our measure of the frailty phenotype may be more indicative of frailty symptoms rather than full phenotypical frailty per se. Moreover, this measure was introduced during study recruitment and could have been biased by missing data. Finally, our comparisons between ‘phenotypic’ and ‘cumulative deficits’ frailty models should recognize that the two measures were never designed to be equivalent. The Frail non-Disabled scale is intended to be used as a screening tool and its properties will differ from a Frailty Index, which is said to be diagnostic.
The timely accurate and acceptable identification of frailty in practice is a current clinical priority.30–32 Advances have been made in frailty assessment in community, care home, and older adult secondary care settings, but it is equally important to determine the most suitable methods of assessing frailty in stroke. Our results are not definitive, and further epidemiological and validation work around frailty assessment and stroke is required. While it would be premature to make recommendations around practice or policy based on our data, we can offer cautious suggestions. The high prevalence of frailty and pre-frailty reminds us that vulnerable older adults are core business in stroke care. There is a danger that this may be forgotten in the move towards increasingly aggressive interventional strategies for acute stroke. The relationship of frailty with the complication of incident delirium may suggest that a brief frailty assessment could become part of the initial ‘work-up’ in stroke. This would mirror changes in practice in other healthcare settings where front-door frailty screening is being introduced.
Our results have implications for research. Pre-stroke modified Rankin Scale is often used as exclusion criterion or case-mix adjustor in stroke trials. The modified Rankin Scale was never designed for this purpose, and previous studies have suggested it may not be the best measure as it may both under and over-estimate function. 33 Using a simple measure of frailty as a baseline measure in trials could improve efficiency, and our data suggest that assessing a Frailty Index is relatively simple in an inpatient stroke population.
Future studies of frailty in stroke should offer longitudinal follow-up to determine the longer-term prognostic validity of frailty measures. Frailty has previously been associated with long-term prognosis in older adult populations. 34 It is highly likely that this will also be the case in the stroke population; hence, this is an important area for future research. Finally, our work suggests that different tests of frailty may be assessing differing constructs. We now need more comparative studies of the different frailty measures, and concepts, when used in the stroke population.
Conclusion
The prevalence of frailty in acute stroke is substantial; the condition appears to exist, before the stroke occurs, in around one in every four patients or around three out of every four patients if pre-frailty is included. Identification of frailty may be influenced by the assessment method employed. Our results suggest that the Frailty Index approach is valid for use in stroke and can be employed for assessment of almost all stroke patients; albeit, it has limited agreement with other measures of frailty. More research is needed to describe the optimal method of assessing frailty and the prognostic and treatment implications when a frailty diagnosis is made in stroke.
Clinical messages
Frailty exists in around one-quarter of all stroke patients.
A Frailty Index–based assessment is valid in acute stroke settings and can be completed for almost all stroke patients.
Identification of which stroke patients are frail will differ substantially based upon the assessment method employed.
Supplemental Material
Clinical_rehab_frailty_prevalence_supplementary_material – Supplemental material for The prevalence of frailty among acute stroke patients, and evaluation of method of assessment
Supplemental material, Clinical_rehab_frailty_prevalence_supplementary_material for The prevalence of frailty among acute stroke patients, and evaluation of method of assessment by Martin Taylor-Rowan, Gillian Cuthbertson, Ruth Keir, Robert Shaw, Bogna Drozdowska, Emma Elliott, David Stott and Terence J Quinn in Clinical Rehabilitation
Footnotes
Author contributions
M.T.-R. and T.J.Q. conceived the study. M.T.-R., T.J.Q., and G.C. drafted the paper. M.T.-R., G.C., T.J.Q., R.S., B.D., R.K., and E.E. contributed to patient assessment and recruitment. D.S. contributed to data interpretation and supervision. All authors contributed to writing.
Declaration of conflicting interests
The author(s) declared no potential conflicts of interest with respect to the research, authorship, and/or publication of this article.
Funding
The author(s) disclosed receipt of the following financial support for the research, authorship, and/or publication of this article: M.T.-R. is partly funded by Chest Heart and Stroke Scotland; this study is part of the APPLE program of work funded by the Stroke Association and Chief Scientist Office Scotland. T.J.Q. is supported by a Stroke Association, Chief Scientist Office Senior Lectureship.
Supplemental material
Supplemental material for this article is available online.
References
Supplementary Material
Please find the following supplemental material available below.
For Open Access articles published under a Creative Commons License, all supplemental material carries the same license as the article it is associated with.
For non-Open Access articles published, all supplemental material carries a non-exclusive license, and permission requests for re-use of supplemental material or any part of supplemental material shall be sent directly to the copyright owner as specified in the copyright notice associated with the article.