
Abstract
The recent publication of the first English/Welsh Commercial Victimisation Survey (CVS) in over 10 years represents a good time to consider both ‘crimes against businesses’ and the place of commercial victims within the discipline of victimology. While some research points to high crime rates against the commercial sector, it has been argued that the abstract concept of ‘crimes against businesses’ has been used by government and businesses to construct a notion of business victimhood in order to place businesses at the centre of policy concerning crime prevention. Critics suggest this recognition of the ‘business as a victim’ not only moves attention away from the illegal behaviours of businesses (businesses as victimisers), but also it gives corporations that can already absorb crime costs the power to dominate debates around law, order and crime prevention. Using data from the CVS, patterns of crimes against business are outlined and some of the main characteristics of victims are identified. Consideration is then given to what these data mean in relation to the concept of businesses as victims. Using Christie’s notion of the ideal victim as a heuristic device, it is explored whether businesses can ever be viewed as ‘ideal’ victims and why achieving victim status might be important. Finally, some fruitful areas for further research are considered.
Introduction
Internationally, there is a paucity of contemporary data on crimes against businesses. Although some surveys have been conducted in a number of European countries and as far afield as China, Australia, Mexico and Nigeria (for a review, see Australian Government, 2004; Mugellini, 2013), data are not regularly collected and often focus on the retail sector (see British Retail Consortium, 2015) rather than the wider business community. It would also be true to say that, although a body of academic research has explored commercial victimisation, the subject remains on the periphery of mainstream victimology (Maguire, 2012). While governments have a responsibility to be seen to be acting proactively to protect businesses and trade bodies work to protect the economic interests of their members (Burrows and Hopkins, 2005), it can be argued that academics have been reluctant to research commercial victimisation as businesses are viewed as being ‘undeserving’ or not having true victim status. For example, Karman (2012: 2) asserts that victimology focuses on the ‘scientific study of physical, emotional and financial harm people suffer because of illegal activities’. As businesses are not ‘people’, one could possibly argue that the commercial sector should not be of interest to victimologists. Indeed, central to the study of victimology is Christie’s (1986) concept of the ‘ideal victim’ who is defined as ‘a person or category of individual who when hit by crime most readily is given the complete and legitimate status of being a victim’ (Christie, 1986: 18). Van Wijk (2013: 160) notes that it is a sort of ‘public status’ of ‘hero or traitor’ and although it is not clear who deserves victim status, we ‘generally have an understanding of what is meant’. Indeed, many scholars have used the analogy of the ‘little old lady’ as the ideal victim (as she is weak and easy to sympathise with) and Christie (1986) asserts that the ideal victim should be (1) weak; (2) carrying out a respectable project; (3) is not to be blamed; (4) is victimised by a big/bad offender; (5) the offender is unknown; but the victim (6) is powerful enough to make his or her case known without threatening strong countervailing vested interests.
As academic criminology has often cast businesses as powerful corporations that tend to be offenders rather than victims (see DeKeseredy, 2011; Whyte, 2007), arguing that businesses could ever be considered as ‘ideal’ victims is difficult. Indeed, the widely held view that businesses are economically vibrant and able to take care of their own security needs (Burrows and Hopkins, 2005) adds to this notion of the undeserving victim. Despite this, some research has identified high rates of victimisation and costs of crime for business when compared to households (see, for example, British Retail Consortium, 2015; Burrows and Hopkins, 2005; Gill et al., 2002). However, some scholars have noted that this abstract notion of the ‘victimised business’ or ‘crimes against businesses’ has an important social effect (Whyte, 2007). As Green (2007: 452) suggests in the context of businesses, the notion of victimhood has been reconstructed as interested parties have ‘assert[ed] that a crime against business is a crime against all of us’. Therefore, large corporations express the negative effects of crimes against businesses by emphasising wider social impacts – for example, by suggesting that crimes such as shoplifting can result in increased pricing of goods for all (see, for example, BBC Wales, 2014). It has also been noted that by constructing their position as ‘victims’, powerful corporations have been allowed to take centre stage in debates around law, order and crime prevention. This is despite the growing recognition of the ‘devastating social impact of corporate offending’ (Whyte, 2007: 453).
The publication of the first Commercial Victimisation Survey (CVS) in England/Wales (see Home Office, 2013, 2014) in over 10 years shows the government’s commitment to crimes against businesses as a policy issue. It also represents a good time to reflect on the notion of ‘crimes against businesses’ within victimology. Therefore, this paper has two principal aims. Firstly, through re-analysis of CVS data, contemporary patterns of crime across six business sectors and some of the key characteristics of victims are presented. Secondly, the concept of ‘the ideal victim’ is explored in relation to business and it is considered whether (a) the label could ever be applied to commercial victims and (b) why achieving victim status might be important. The purpose of the analysis is not to argue that business should have more power in debates around law and order or even leverage more crime prevention resource from government, but to illustrate that a more nuanced understanding of crimes against businesses might not only help to debunk the abstract concept of business crime, but also enable victimologists to identify fruitful areas for future research.
The Commercial Victimisation Survey
The findings are based on the re-analysis of data collected for the 2012 and 2013
1
sweeps of the CVS in England/Wales.
2
Telephone-based interviews were conducted with the owners or managers of 4,017 business premises in 2012 and 4,041 in 2013. Respondents were asked whether the business had fallen victim to a range of crime types (burglary, theft, vehicle crime, fraud, assaults, threats and intimidation) over a 12-month recall period and how many incidents occurred during that time. In addition, there was a smaller ‘online’ element to the survey that asked a random subset of around 50% of businesses about their experiences of e-crimes such as hacking, online theft, phishing, online information theft, online vandalism and computer viruses.
3
One of the key strengths of the survey was its sector coverage. The two previous surveys (conducted in 1994 and 2002) only sampled businesses from the retail and manufacturing sectors (see Mirrlees-Black and Ross, 1995; Shury et al., 2005). The 2012 survey (see Home Office, 2013) extended its coverage to four sectors (wholesale/retail, manufacture, transport and accommodation/food), and the 2013 survey (see Home Office, 2014) also covered retail and accommodation/food, but it introduced agriculture and arts/recreation (at the expense of manufacturing and transport).
4
The sectors covered were defined as follows:
5
wholesale and retail: wholesale and retail of products (including repair of motor vehicles or motorcycles);
accommodation and food services: hotels and hostels; restaurants, cafes, public houses and food takeaway businesses;
manufacturing: manufacture and repair of products (excluding repair to motor vehicles or motorcycles);
transport and storage: passenger services (taxi, bus, rail and air), road, rail and air freight, postal services, warehousing in relation to transport services;
arts, entertainment and recreation: arts, library and museum activities; operation of sports and fitness clubs; gambling and betting activities; operating of amusement parks/arcades;
agriculture, forestry and fishing: animal and crop farming, support services for agriculture and fishing.
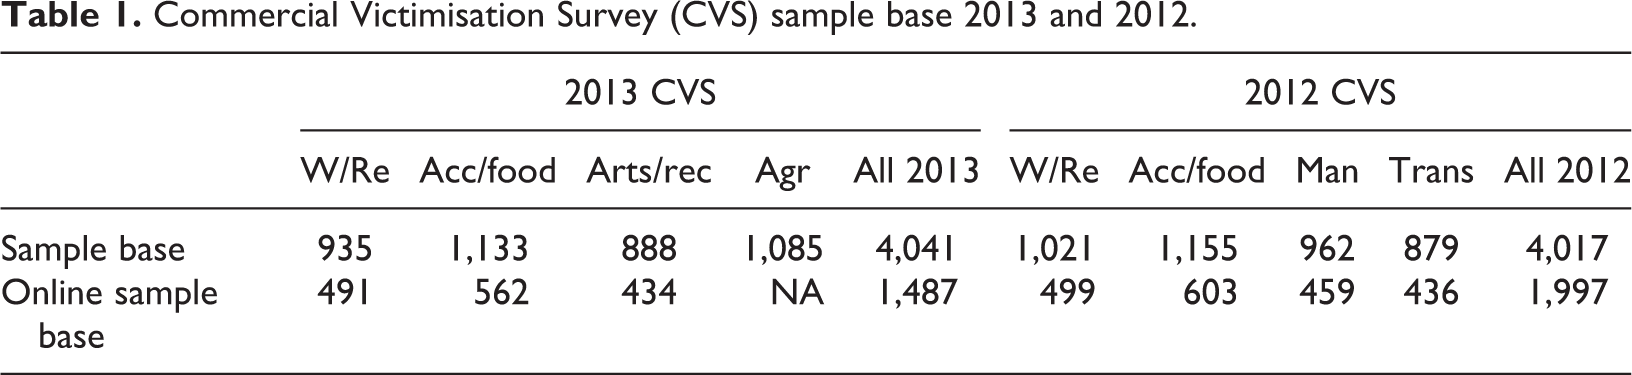
The number of businesses across each sector responding to the surveys is presented in Table 1. It should also be noted that both samples included a mixture of small/large businesses and those that had premises on several sites. For example, 49% (n = 1,959) of the 2012 sample and 64% (n = 2,614) of the 2013 sample businesses employed less than 10 staff on site. Over half of all businesses (58%: n = 2,314 in 2012 and 67%: n = 2,728) operated out of just one location.
Commercial Victimisation Survey (CVS) sample base 2013 and 2012.
In addition to data on experiencing crime, other useful data were collected in relation to the costs of crime, crime prevention devices installed and details of some of the characteristics of the communities in which the businesses are located.
Crimes against businesses: The extent of victimisation
In this section, rates of crime observed in the CVS are presented. In order to capture the nature of victimisation against businesses (and for ease of presentation), the crime types are typologised into three groups as follows.
Table 2 outlines the crime prevalence rate (the proportion of business premises who were victims of crime in the recall period) for property, violent and e-crimes by business sector for 2012 and 2013. Across all sectors, the highest prevalence rate is for property crime, with 45% (n = 1,813) of all businesses being victims of at least one incident in 2012 and 42% (n = 1,714) in 2013. In comparison, 14% (in both years) were victims of interpersonal crime and around one in 10 fell victim to an e-crime. The highest rates of property crime were in the retail sector and arts/recreation sectors. For example, in 2013, one in four retail businesses experienced a theft (25% prevalence rate) and 12% were burgled, while 18% of arts/recreation businesses experienced theft and 16% were burgled. While a body of now fairly dated research illustrates that businesses suffer from higher rates of property crimes than households (see Burrows and Hopkins, 2005), the recent CVS data again point to this pattern. For example, between June 2013 and June 2014, 2.7% of households were burgled in England and Wales (Office for National Statistics, 2014). In comparison, rates of burglary against the commercial sector ranged from a low of 13% in the manufacturing sector (in 2012) to a high of 16% in arts/recreation in 2013.
Prevalence of crime by business sector.
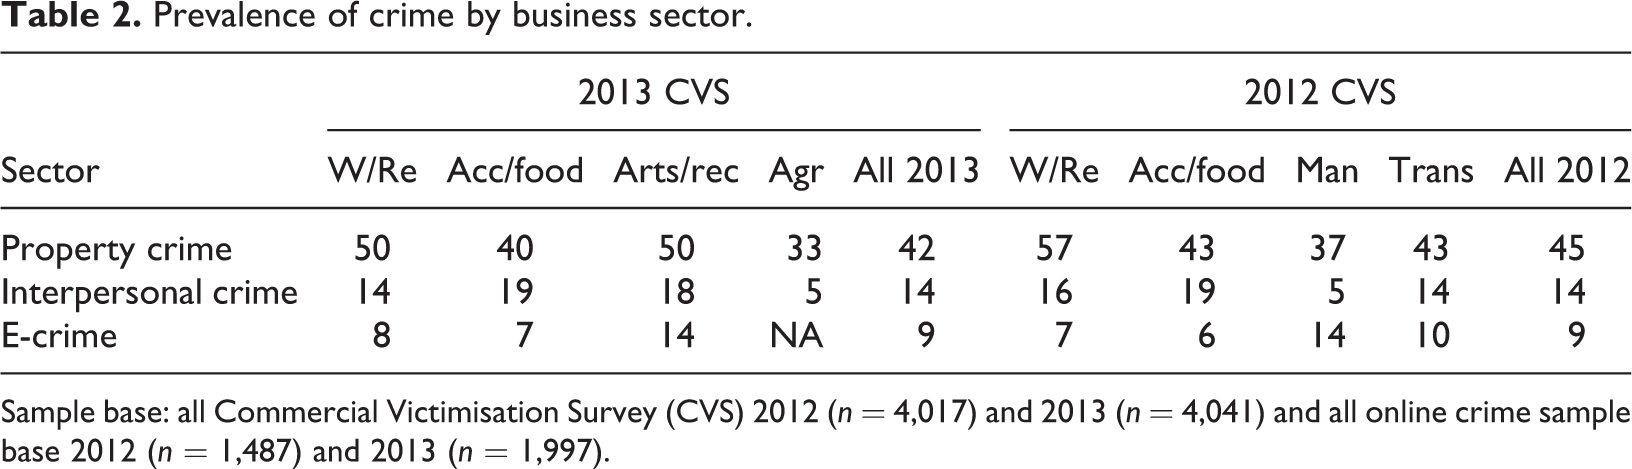
Sample base: all Commercial Victimisation Survey (CVS) 2012 (n = 4,017) and 2013 (n = 4,041) and all online crime sample base 2012 (n = 1,487) and 2013 (n = 1,997).
When examining interpersonal crime, the data also show high prevalence rates when compared to non-commercial victims. The highest rate in both 2013 and 2014 was in the accommodation/food sector (with a 19% prevalence rate), although around one in six businesses in the arts sector also witnessed an incident in 2013. In both surveys, over one in seven retail businesses witnessed an incident and a similar rate was observed for transport businesses in 2012. Of course, comparing prevalence rates of violent crimes against business premises to non-commercial samples is problematic, as the unit of analysis (business premises to the individual) is not comparable. However, between June 2013/2014 a total of 1.7% of the general population were victims of violence with or without injury (Office for National Statistics, 2014); this was a much lower rate than that observed across any business sector in the CVS.
Finally, the data suggest that e-crime is growing as a crime problem in the commercial sector. Between 6% and 14% of businesses were victims, with around one in seven businesses in the arts and manufacturing sector experiencing an e-crime. By comparison, the 2002 CVS reported that only 2% of manufacturers and 1% of retailers were victims of e-crimes 7 (Shury et al., 2005). Of course, as most businesses now have internet access and as e-commerce becomes more established, the risks are likely to continue to increase. This concern has been raised by the British Retail Consortium, who in their crime costs survey 2014–2015 state that ‘such attacks continue to pose a critical threat to businesses’ (British Retail Consortium, 2015: 14).
Table 3 presents the incidence rates of crime expressed as the average number of incidents per 100 businesses. Here, it can be seen that the higher prevalence rate of property crimes translate into higher rates of repeat victimisation. Indeed, there was an average of 1,117 property crimes per 100 businesses in 2013 and 1,403 per 100 businesses in 2012, compared to 250 and 305 interpersonal crimes per 100, respectively. These rates of property crime are also high when compared to non-commercial samples. Using burglary as an example, 3.3 out of every 100 English/Welsh households were victims of domestic burglary between June 2013 and June 2014 (Office for National Statistics, 2014). In comparison, the lowest incident rate for burglary recorded in the CVS was 30 per 100 transport sector businesses in 2012. Particularly high incidence rates of burglary were recorded in the arts/recreation sector (87 per 100 in 2013) and retail sector (44 per 100 in 2012).
Incidence of crime (per 100 businesses) by business sector.
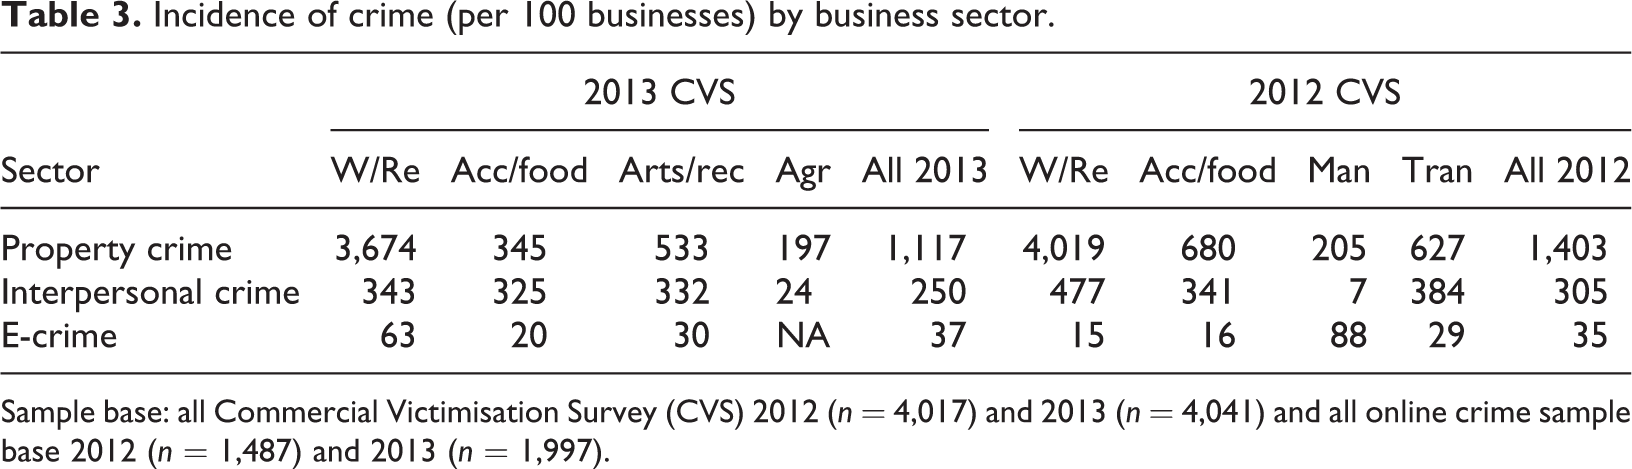
Sample base: all Commercial Victimisation Survey (CVS) 2012 (n = 4,017) and 2013 (n = 4,041) and all online crime sample base 2012 (n = 1,487) and 2013 (n = 1,997).
Despite suffering high rates of victimisation, it has previously been suggested that businesses are able to withstand the financial burden of crime. This notion is explored below (Table 4) by considering the financial impact of crime against those businesses with a turnover of over £100,000 per annum compared to those with a lower turnover. In this paper, turnover (defined as the total revenue a business generates over the course of a year before expenses are considered) is used as a proxy measure of prosperity. 8 For those businesses with turnovers of over £100,000 per annum, the costs of property crimes (which include total loss and damage) 9 and the costs of security are compared to those businesses with a turnover of less than £100,000 for 2012 and 2013. 10 It is observed that the higher crime rates for the larger turnover businesses translate into greater average financial losses to crime, with these businesses losing around £6,000 to property crime each year. However, the financial burden of crime appears to be most greatly felt by businesses with a lower turnover. When expressed as a proportion of turnover, crime loss for these businesses is 4.2% in 2012 and 1.6% in 2013 – significantly larger than that of the higher turnover businesses. Indeed, the final column shows that expenditure on crime prevention/security is also significantly higher for the smaller businesses (as a proportion of turnover) – at 3.7% in 2012 and 1.2% in 2013. This indicates that larger businesses might face higher crime risks, but they can possibly absorb crime costs and preventative expenditures much better than smaller businesses.
Risk of property crime and the financial burden of crime (Commercial Victimisation Survey (CVS) 2012 and 2013).
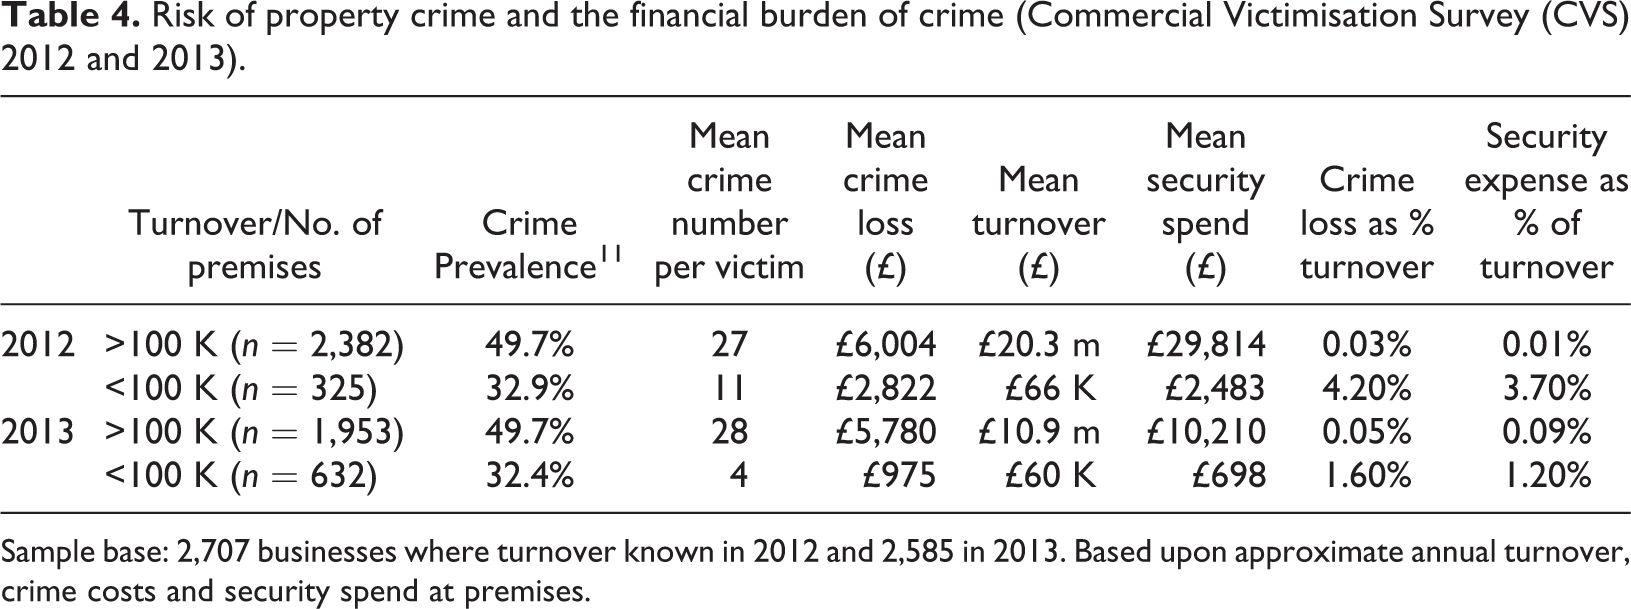
Sample base: 2,707 businesses where turnover known in 2012 and 2,585 in 2013. Based upon approximate annual turnover, crime costs and security spend at premises.
The CVS also illustrates that much of the burden of commercial victimisation falls upon frontline staff in the form of interpersonal violence. Around one in every six crimes experienced in both sweeps of the CVS involved direct people contact – including around one in two crimes in the accommodation/food sector and one in three in the arts and transport sector. 12 Table 5 13 presents the rates of interpersonal crime per 10,000 employees and shows that there were 703 incidents of contact crime per 10,000 employees in 2013 and 428 in 2012; in other words, in 2013, around one in 14 employees were involved in an interpersonal crime and one in 24 were in 2012. While previous research has highlighted the elevated risk of abuse/violence of staff in the transport and retail sectors (see British Retail Consortium, 2015; Burrows et al., 1999; Stutzenberger and Fisher, 2014), the CVS also illustrates high risks to staff in the arts/recreation sector, followed by the accommodation/food sector. As might be expected, the highest risk is for abuse/threats, where one in 17 employees in 2013 and one in 32 in 2012 were involved in an incident. Rates of physical assault and robbery are much lower across all sectors: in 2012 there was a one in 2,000 chance of a staff member being physically assaulted and a one in 2,500 chance in 2013, although the risks do increase for staff working in the accommodation/food, arts/recreation and transport sectors. The risk of robbery is highest in the retail sector, where at least one in 40 staff members in 2012 and one in 52 in 2013 were involved in incidents.
Incidence of interpersonal crime per 10,000 employees by sector.
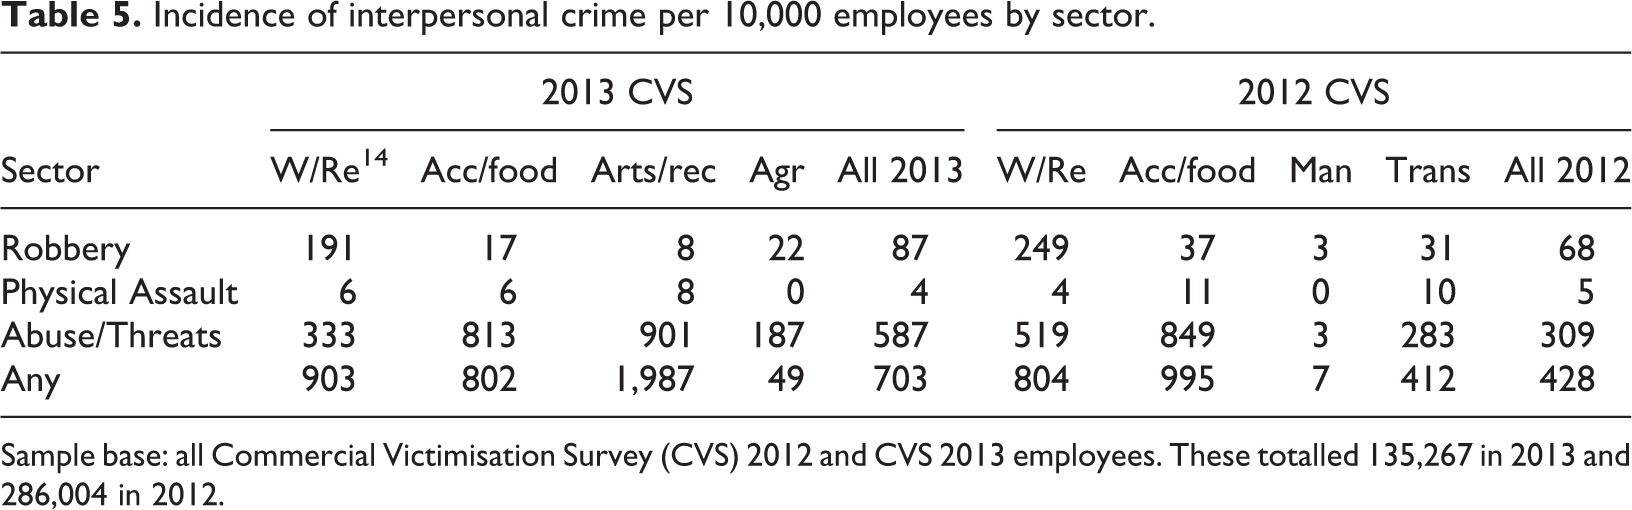
Sample base: all Commercial Victimisation Survey (CVS) 2012 and CVS 2013 employees. These totalled 135,267 in 2013 and 286,004 in 2012.
The costs of interpersonal crime are commonly physical and psychological rather than financial. 15 Indeed, Chappell and Di Martino (2006), Jones et al. (2011) and Stutzenberger and Fisher (2014) have identified the physical/psychological impacts, such as increased stress and anxiety to staff, and high-profile cases of injuries to staff in retail and service-based businesses are commonly reported in the media (see Asian Trader, 2014; Lightfoot, 2014). Analysis of the CVS data reveals that robberies were most likely to result in physical injury to staff. In 2012, 19% (n = 22) of robberies resulted in an injury to a staff member (as compared to 12% (n = 10) in 2013). In comparison, in 2012, 15% (n = 76) of all other violent incidents resulted in an injury to staff, as did 11% (n = 58) in 2013.
The CVS data do, however, suggest that the risk of physical injury as a result of robbery is lower in the commercial sector than in non-commercial environments. According to Crime Survey for England and Wales (CSEW) data, around 46% of street robberies result in physical injury to the victim, which is over twice the rate recorded in the CVS (Office for National Statistics, 2014). 16 Despite this, there is further evidence that frontline workers also face other situations that might generate anxiety. For example, in 26% (n = 30) of robberies in 2012 (as compared to 16%: n = 14 in 2013), the assailant threatened staff with a weapon (either a gun, knife or other). 17
Business vulnerability to crime: Characteristics linked to victimisation
Further analysis was conducted to identify characteristics of the businesses most likely to be victims of property and interpersonal crime. Eight independent variables (or predictors) were identified in the CVS datasets that one might expect to be associated with vulnerability to crime (these are presented in Table 6). These were run in three logistic regression models to test (a) whether they were statistically significant and (b) the odds of these factors being associated with property crime, external assaults/threats and robbery. 18 The models were run by merging data from both sweeps of the CVS into a dataset of 8,058 businesses.
Variables used in the model.
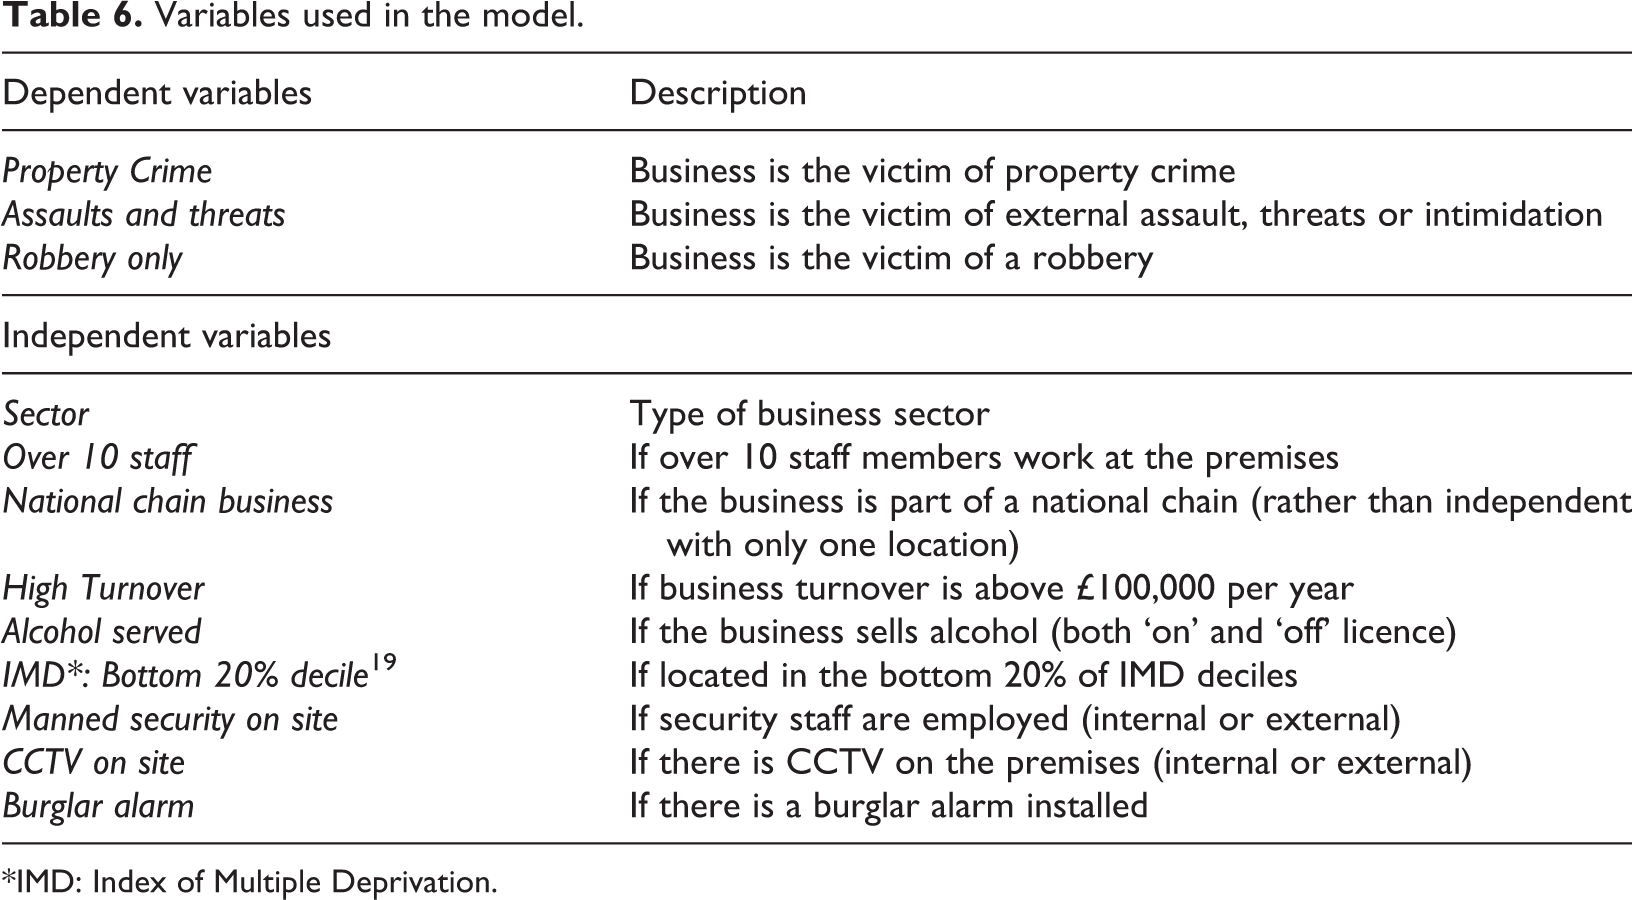
*IMD: Index of Multiple Deprivation.
Table 7 presents the output from three models. Looking at property crime, the biggest predictors are being a retail business 20 and employing 10 or more staff members. Both of these predictors double the risk of property crime. However, businesses with a turnover of over £100 K and those that are part of a chain of businesses are 1.5 times more likely to be victims than those without these characteristics. This confirms previous research that has illustrated higher risks of property crime for businesses with larger numbers of employees (Burrows et al., 1999) and (obviously) for businesses that stock high volumes of desirable consumer items (Australian Government, 2004). However, it is also worth noting that businesses with burglar alarms 21 or manned security did not appear to have reduced risk of property crime and those with CCTV actually have a slightly increased risk. 22
Factors associated with property crime, violence and robbery in commercial settings (Commercial Victimisation Survey (CVS) data 2012 and 2013).
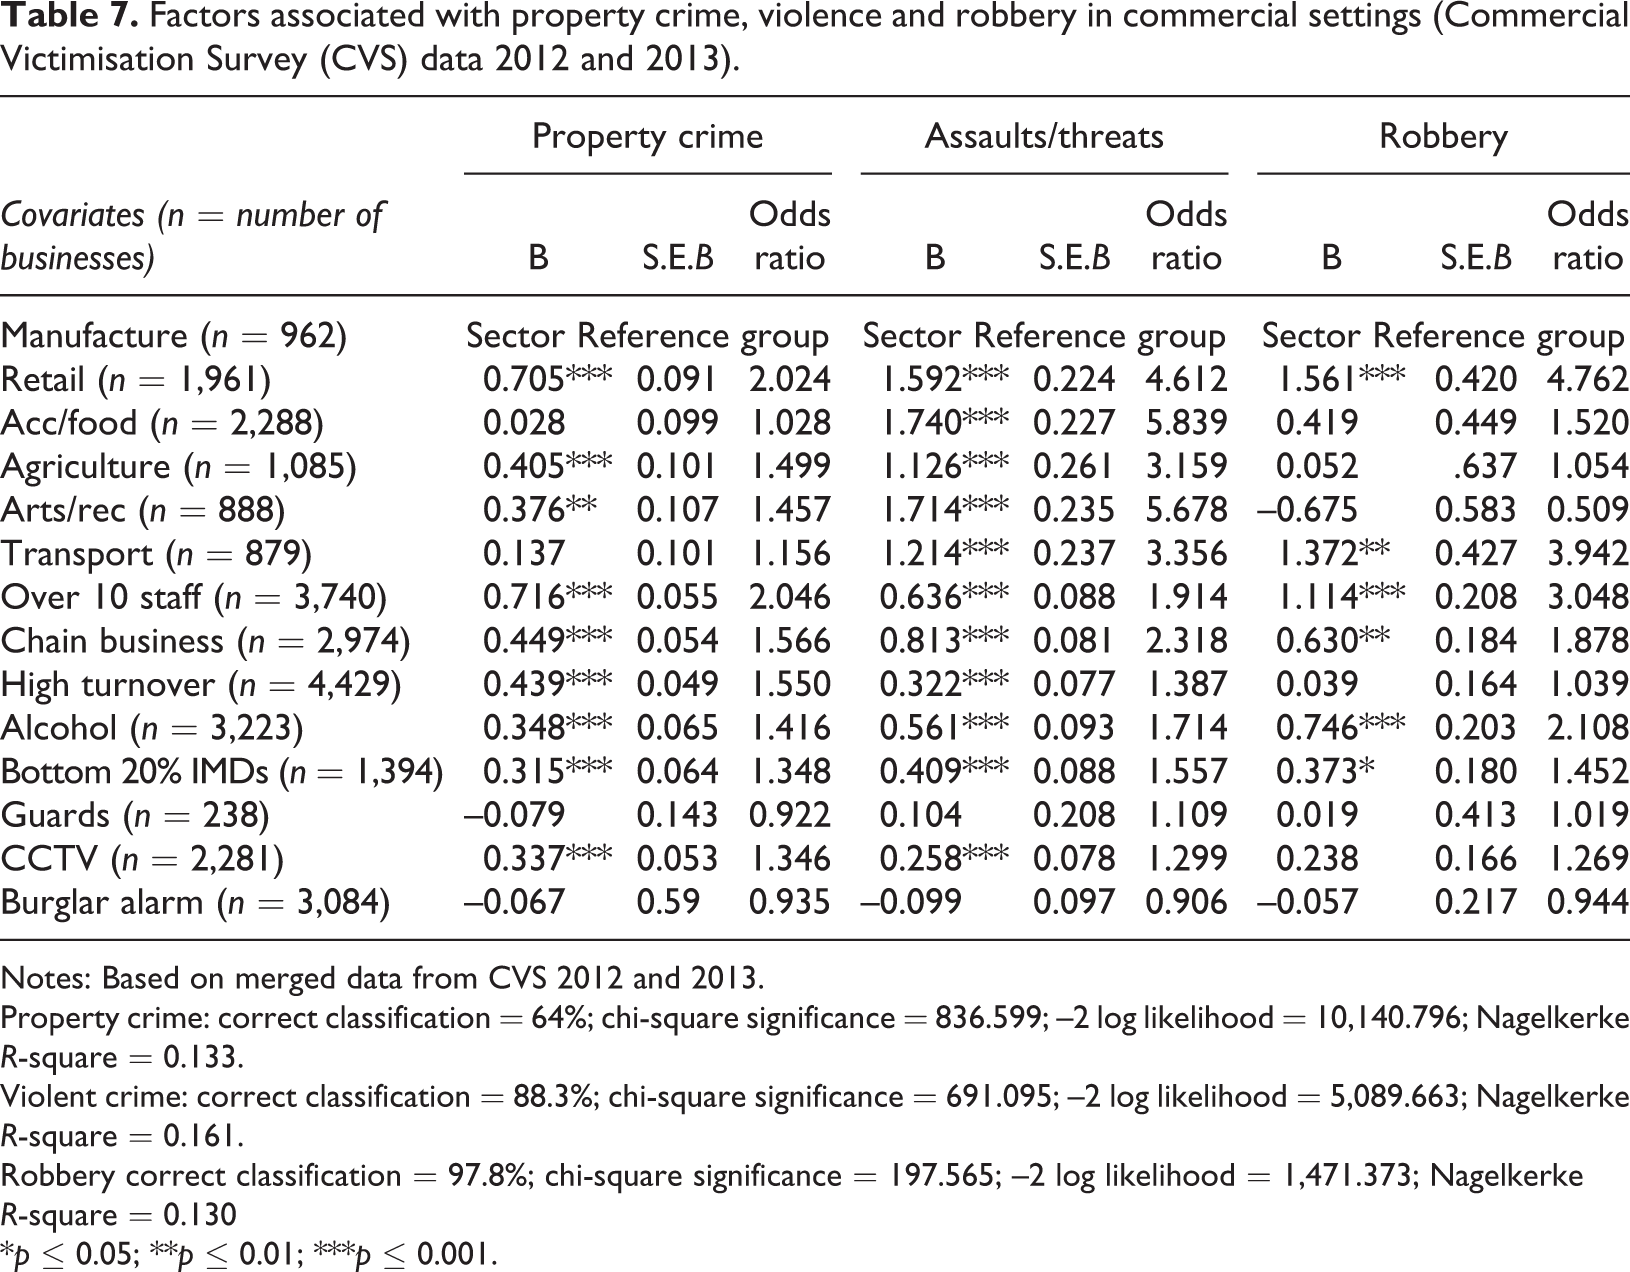
Notes: Based on merged data from CVS 2012 and 2013.
Property crime: correct classification = 64%; chi-square significance = 836.599; –2 log likelihood = 10,140.796; Nagelkerke R-square = 0.133.
Violent crime: correct classification = 88.3%; chi-square significance = 691.095; –2 log likelihood = 5,089.663; Nagelkerke R-square = 0.161.
Robbery correct classification = 97.8%; chi-square significance = 197.565; –2 log likelihood = 1,471.373; Nagelkerke R-square = 0.130
*p ≤ 0.05; **p ≤ 0.01; ***p ≤ 0.001.
A number of the variables were significantly related to assaults/threats. Businesses in the accommodation/food, arts/recreation and retail sectors were over five times more likely to experience assaults/threats, as compared to the manufacturing sector. Being part of a chain business doubled the risk (similar to property crime), and businesses employing over 10 staff members had nearly twice the risk. Although one might not expect to see burglar alarms impacting on assault/threats, it is surprising to see that the presence of manned security has no impact on the risk of assaults/threats and (as with property crime) businesses with CCTV have increased risks of assault/threats. Some previous research has identified that working in food/accommodation, retail or transport sectors promotes risk, as there is close customer contact and cash handling is often required (see, for example, Chappell and Di Martino, 2006). Indeed the British Retail Consortium (2015: 32) notes that violence is most likely to occur ‘when staff challenge customers suspected of theft, when asking for proof of age, in relation to a store ban, or if customers are being detained on suspicion of an offence’. The data also reveal high risks of assault/threats for the arts/recreation sector. Further analysis highlighted that 31% of all victims (n = 151) in this sector were in sports clubs, 19% were in gyms and 13% were in gambling businesses. Some previous research has noted a high risk of violence in licensed gambling premises (Griffiths and Hopkins, 2001), although little known research to date has focused on the risks for staff in gyms and sporting environments.
The key risk factors for robbery are being in the retail sector, employing over 10 staff members and selling alcohol – 44% (n = 87) of all robbery victims were retailers that sell alcohol. This confirms previous research suggesting that offenders will select targets where there will be guaranteed cash or goods (such as alcohol/cigarettes) that are easy to consume/resell (Gill and Pease, 1998). However, the regression output also illustrates that it is the businesses that employ over 10 staff members and those that are part of chains that carry higher risks (rather than smaller independent businesses). Again, the presence of manned guarding or CCTV seems to make little difference to the risk of victimisation. This finding is counterintuitive to what one might expect. However, evaluations of the efficacy of CCTV in business settings report mixed findings (see Lasky et al., 2015; Taylor and Gill, 2014) and little work has identified whether manned guarding actually reduces the risk of violence or robbery in commercial settings. However, some evidence suggests that, especially in licensed premises, security guards can act as generators of violence (Hobbs et al., 2002).
The data also highlight two further issues worthy of discussion. Firstly, while it has been observed that larger businesses tend to be at higher risk of crime, little research has identified that businesses that are part of a ‘chain’ (rather than independent locations) carry higher risks of victimisation. Across each model, being part of a ‘chain’ increased risk (especially in relation to violence). Further analysis revealed that the increased pattern of risk for chain businesses was common across all business sectors. For example, in 2013, 34% and 30% of chain businesses in the accommodation and arts sectors (respectively) were victims of at least one violent crime, compared to 12% and 10% of businesses in these sectors that were not part of a chain. A factor that might partially explain this is that the chain businesses have higher footfalls than independent businesses. For example, in 2013, 43% of all chain businesses claimed to have a footfall of over 1,000 customers per week, compared to only 8% of independent businesses. It is plausible to suggest this higher footfall might also bring a higher flow of motivated offenders into these businesses.
Secondly, as Table 8 illustrates, there is a relationship between the Index of Multiple Deprivation (IMD) of businesses and the risk of both interpersonal and property crime. For interpersonal crime, the highest rates per 1,000 employees are generally observed in the most deprived areas. For example, across the two CVS sample groups, there were 114 violent incidents per 1,000 employees in IMD 1 as compared to 12 per 1,000 in IMD 10. In relation to property crimes, those businesses located in the top five most deprived areas all had higher rates of property crime compared to those in the five least deprived areas. Indeed, previous research has highlighted that residents located in the poorest areas of cities have higher risks of victimisation than those in more affluent areas (Bottoms, 2012). This pattern appears to be replicated for commercial victims of crime.
Average number of interpersonal crimes per 1,000 business employees and property crimes per 100 businesses by Index of Multiple Deprivation (IMD) area: merged Commercial Victimisation Survey (CVS) data 2012 and 2013 (rank order in brackets).
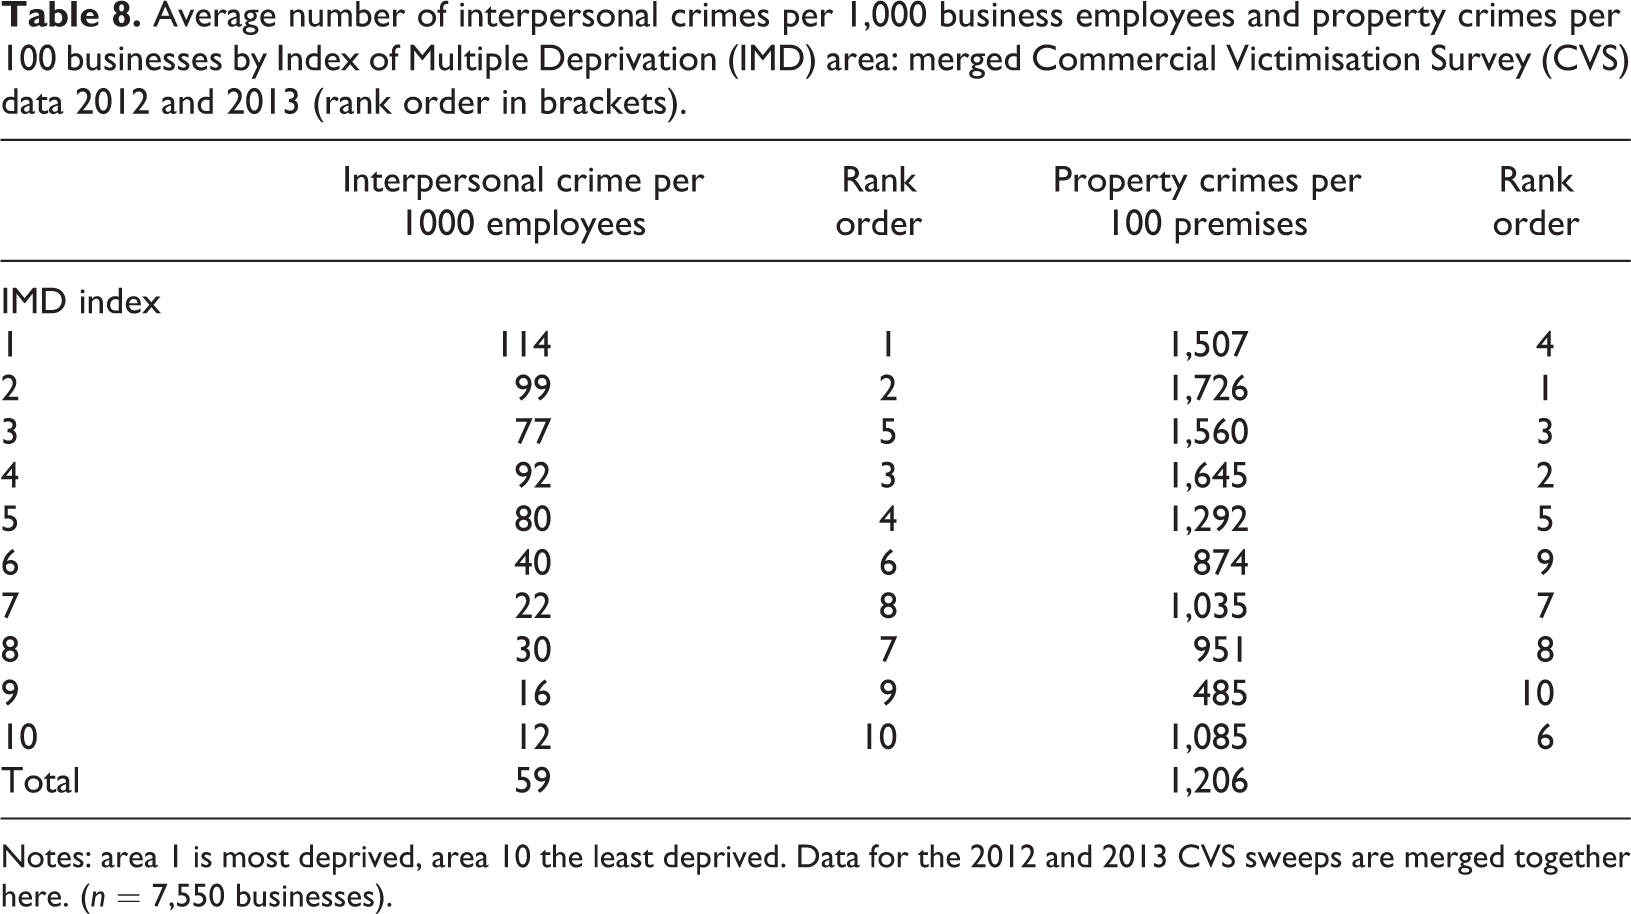
Notes: area 1 is most deprived, area 10 the least deprived. Data for the 2012 and 2013 CVS sweeps are merged together here. (n = 7,550 businesses).
Some reflections: Businesses as ideal victims?
Some scholars have argued that businesses have managed to gain sympathy in policy circles by perpetrating the notion of the ‘victimised business’ and emphasising the economic burden of the crimes they face (Whyte, 2007). However, simply identifying that businesses suffer from high rates of victimisation does not automatically allow one to conclude they should be considered as ‘ideal’ or ‘deserving’ victims. In the following section, Christie’s (1986) ideal victim framework is used as a heuristic device to explore whether a business could ever be considered as an ‘ideal’ or ‘deserving’ victim. The analysis is based upon the findings from the CVS presented above, although it draws upon other sources where relevant. 1.
2.
3.
Marketing activities designed to attract legitimate customers generate crime. For example, Curtis (1971) notes that retailers encourage crime by placing tempting consumable items freely in view and making them easily accessible to customers.
Businesses are perceived to overprice goods. Often businesses are accused of generating crime through overpricing of goods. For example, as a consequence of the overpricing of fuel, it has been reported that many drivers have felt morally justified to engage in fuel theft (see Euro2 day, 2014).
Organisational practices generate crime. As Beck (2011) illustrates, self-check-out payment systems designed to allow customers to scan and pay for their items can generate increased shrinkage as customers often choose not to scan items. It has also been suggested that some large retailers are aware that such practices can increase crime, but are willing to accept crime if costs are offset by savings on labour (see Beck and Hopkins, 2015).
Sufficient efforts are not made to prevent crime (or to protect staff from crime). This raises questions about what expectations there should be on businesses to prevent crime and what police/crime prevention measures should be used to protect staff. Indeed, analysis from the CVS suggests that even where businesses took steps to install burglar alarms, CCTV or employ security staff, this made little difference to their crime risk. In addition, in their definition of corporate crime, DeKerseredy and Hinch (1991: 100) state that ‘acts of omission, in which decision makers, etc. refuse to take action to reduce health and safety risks’ should be considered as corporate violence. It may be argued that where businesses knowingly promote crime or refuse to take appropriate action, such inaction makes them blameworthy for victimisation. Furthermore, Burrows and Hopkins (2005) note that questions may also be asked about the extent businesses should be entitled to local police support if they ‘knowingly’ generate crime. 4.
5.
6.
Concluding comments
The recent flurry of activity by the UK government in relation to commercial victimisation represents possibly the largest effort seen globally to collect data on the subject. While the CVS data confirm the findings of previous research – that high rates of crime (in comparison to households) can be observed in the wholesale/retail and accommodation/food sectors – it also presents data on some relatively unexplored sectors, such as arts/recreation and agriculture. Importantly, the analysis identifies that while larger business with a turnover of over £100 K are most at risk for crime, the burden of crime appears to be felt most by those with a smaller turnover (<£100 K). Compared to non-commercial contexts, it is also observed there can be high risks of interpersonal violence to frontline staff, most notably in the accommodation/food, arts/recreation and retail sectors.
A primary purpose of this paper was to consider the notion of businesses as ‘ideal’ victims. By using Christie’s (1986) concept of the ideal victim as a heuristic device, the analysis suggests that while businesses might not readily be ascribed victim status in the same sense as Christie’s ‘little old lady’, there is some utility in the concept. It allows for factors that might be ascribed to the ‘deserving’ commercial victim to be identified and suggests that a broad spectrum exists from the deserving victim to the undeserving. However, the analysis indicates that it has been in the best interests of businesses to amplify the notion of themselves as victims of crime. In keeping with the sentiments expressed by Whyte (2007), it is illustrated that within policy circles, there has now been an acceptance of the concept of the ‘business as a victim’ and, as a consequence, there has been a growing effort to develop crime prevention efforts to support businesses. Whether policy officials would label businesses as ‘ideal’ victims is unclear, but there appears to be support for the idea that businesses require policy support and that the reduction of business crime provides wider benefits to the society (presumably in terms of lower prices for customers and in providing jobs within communities). Whether this actually materialises into help for those smaller businesses that appear most exposed to the effects of crime or if it just allows the larger and most powerful businesses to play a central role in shaping crime prevention agendas is unclear.
A key criticism of current policy activity and previous academic research in this area may be that ‘crimes against businesses’ is used as a catch all term and it can perpetrate the idea that all crime against any business is worthy of attention. However, through utilising Christie’s model, it is suggested that a more nuanced understanding of business crime can be developed and further research attention possibly directed towards analysis of the impact of crime on businesses that appear most economically vulnerable and less able to protect themselves. Although not exhaustive, victimologists might fruitfully explore the following areas.
Finally, the data in this paper are based on surveys of businesses in England/Wales. Internationally, data on commercial victimisation are patchy, although some research has been conducted across several nations (see Mugellini, 2013). While some contemporary international comparative research on the extent of commercial victimisation would be useful, reflection about how businesses are perceived as victims across different countries would also be a welcome addition to the paucity of literature in this area.