
Abstract
Blockade of the cardiac hERG channel is recognized as the main mechanism underlying the QT prolongation induced by many classes of drugs, including antipsychotics. However, antipsychotics interact with a variety of other pharmacological targets that could also modulate cardiac function. The present study aims to identify those key factors involved in the QT prolongation induced by antipsychotics. The interactions of 28 antipsychotics were measured on a variety of pharmacological targets. Binding affinity (Ki), functional channel blockade (IC50), and the corresponding ratios to total and free plasma drug concentration were compared with the corrected QT changes (QTc) associated with the therapeutic use of these drugs by multivariable linear regression analysis to determine the best predictors of QTc. Besides confirming hERG as the primary predictor of QTc, all analyses consistently show the concomitant involvement of NaV1.5 channel as modulating factor of the QTc related to hERG blockade. In particular, the hERG/NaV1.5 ratio explains the 57% of the overall QTc variability associated with antipsychotics. Since it is known that inhibition of late INa could offset the dysfunctional effects of hERG blockade, we hypothesize the inhibition of late INa as a crucial compensatory mechanism of the QTc associated with antipsychotics and hence an important factor to consider concomitantly with hERG blockade to appraise the arrhythmogenic risk of these drugs more accurately.
Introduction
Prolongation of the QT interval of the electrocardiogram reflects delayed ventricular repolarization which is associated with Torsades de Pointes (TdP), a life-threatening ventricular tachyarrhythmia that may degenerate into ventricular fibrillation and sudden death (Moss, 1999). Although prolongation of the QT interval is not the sole aspect related to the occurrence of TdP (Antzelevitch, 2007; Kannankeril and Roden, 2007; Killeen, 2009a), it remains the most widely used surrogate marker to appraise the risk of a drug in developing TdP (Heist and Ruskin, 2010; Nielsen et al., 2011; Salvi et al., 2010), to the extent that the risk of inducing QT interval prolongation is the most common cause for withdrawal or restriction of marketed drugs, thus becoming a major safety concern for the pharmaceutical industry (Gintant, 2011; Killeen, 2009b; Lasser et al., 2002). Numerous drugs of a variety of therapeutic classes are known to prolong the QT interval, with a significant number associated with the development of TdP (De Ponti et al., 2001; Roden, 2004). In particular, antipsychotic drugs are among the most frequently prescribed medications known to cause QT interval prolongation with a high risk for TdP, leading to the withdrawal, temporary suspension or restricted use of a number of them (Curtis et al., 2003; Killeen, 2009a; Nielsen et al., 2011). Therefore, precise elucidation of the mechanisms underlying the ability of antipsychotics to prolong the QT interval is a crucial goal for the design of more efficacious and safer compounds.
Inhibition of the rapidly activating component of the delayed rectifier potassium current (IKr) mediated by the potassium KV11.1 channel encoded by the human ether-a-go-go-related gene (hERG, KCNH2) is considered as the primary mechanism by which most drugs delay cardiac ventricular repolarization and prolong the QT interval. The potency of a drug for blocking hERG is a critical factor in predicting the capability of a drug to prolong the QT interval and, therefore, the occurrence of TdP (Belardinelli et al., 2003; De Bruin et al., 2005; Gintant, 2011; Gintant et al., 2006; Gupta et al., 2007; Redfern et al., 2003; Titier et al., 2005). Because most typical and atypical antipsychotics are effective in blocking hERG (Ekins et al., 2002; Silvestre and Prous, 2007), this also appears to be the crucial risk factor for QT prolongation and TdP associated with these drugs (Crumb, Jr. et al., 2006; Haddad and Anderson, 2002). However, and similarly to other drugs, antipsychotics show an important dissociation between hERG blockade and QT prolongation (Sager, 2008; Titier et al., 2005; Witchel et al., 2003), suggesting that factors other than hERG may also play a significant role in the ability of a drug to prolong QT. In fact, hERG represents only one of the multiple currents involved the cardiac action potential and, therefore, able to modulate the QT interval (Antzelevitch, 2007; Gintant, 2011). For instance, since NaV1.5 and CaV1.2 channels are also involved in the cardiac action potential, multichannel blockade affecting the sodium Nav1.5 current (INa) and calcium Cav1.2 current (ICa) is accepted as a confounding factor in relating hERG blockade to QT prolongation (Gintant et al., 2006; Martin et al., 2004). Similarly, effects on receptors involved in cardiac autonomic tone, such as muscarinic M2 and α- and β-adrenergic receptors, may also participate in the effects of drugs on the QT interval and modulate the dysfunctional effects caused by blocking hERG (Agelink et al., 2001; Fossa, 2008; Taggart et al., 2003). This is of particular importance for antipsychotics, since these drugs are characterized by interacting with a wide range of pharmacological targets that are responsible not only for their therapeutic effects but also for most of their adverse effects, including those related to cardiac function (Kroeze et al., 2003; Silvestre and Prous, 2005; Stahl, 2003). However, the role played by these factors in modulating the effects of drugs on the QT interval has yet to be precisely identified in a single study where all compounds have been assayed under comparable conditions.
The present study aims to identify those pharmacological factors most involved in the QT interval prolongation induced by antipsychotics in order to generate new rational working hypotheses. For this, multivariable linear regression analysis (MVLR) was used to compare the mean change of heart rate-corrected QT (QTc) associated with the therapeutic use of 28 antipsychotics to their potencies to interact with a variety of pharmacological targets, including receptors, monoamine transporters and cardiac ion channels. Since it is generally assumed that tissue drug levels are proportional to free (non-protein bound) plasma drug concentrations, additional datasets constituted by the ratios to total and free plasma drug concentration were also considered and separately analysed.
Materials and methods
Compounds
Any commercially available antipsychotic used for the treatment of schizophrenia with reliable published clinical data for effects on QTc (msec) was initially considered. Only 28 antipsychotics meeting all data requirements needed for the study were finally considered (see Table S1 in Supplemental Content for details of the compounds). Data requirements include those concerning in vitro assays, such as activities associated with all the 24 pharmacological targets considered and plasma-binding protein, as well as those from clinical studies such as the effects on QTc interval and plasma drug concentrations (steady-state Cmax [Css, µg/L]) at therapeutic dosages (see Tables 1 and 2, and Table S2 in Supplemental Content for further details).
Mean corrected QT interval change (QTc, msec) associated to antipsychotics at therapeutic doses derived from different correction formulas.
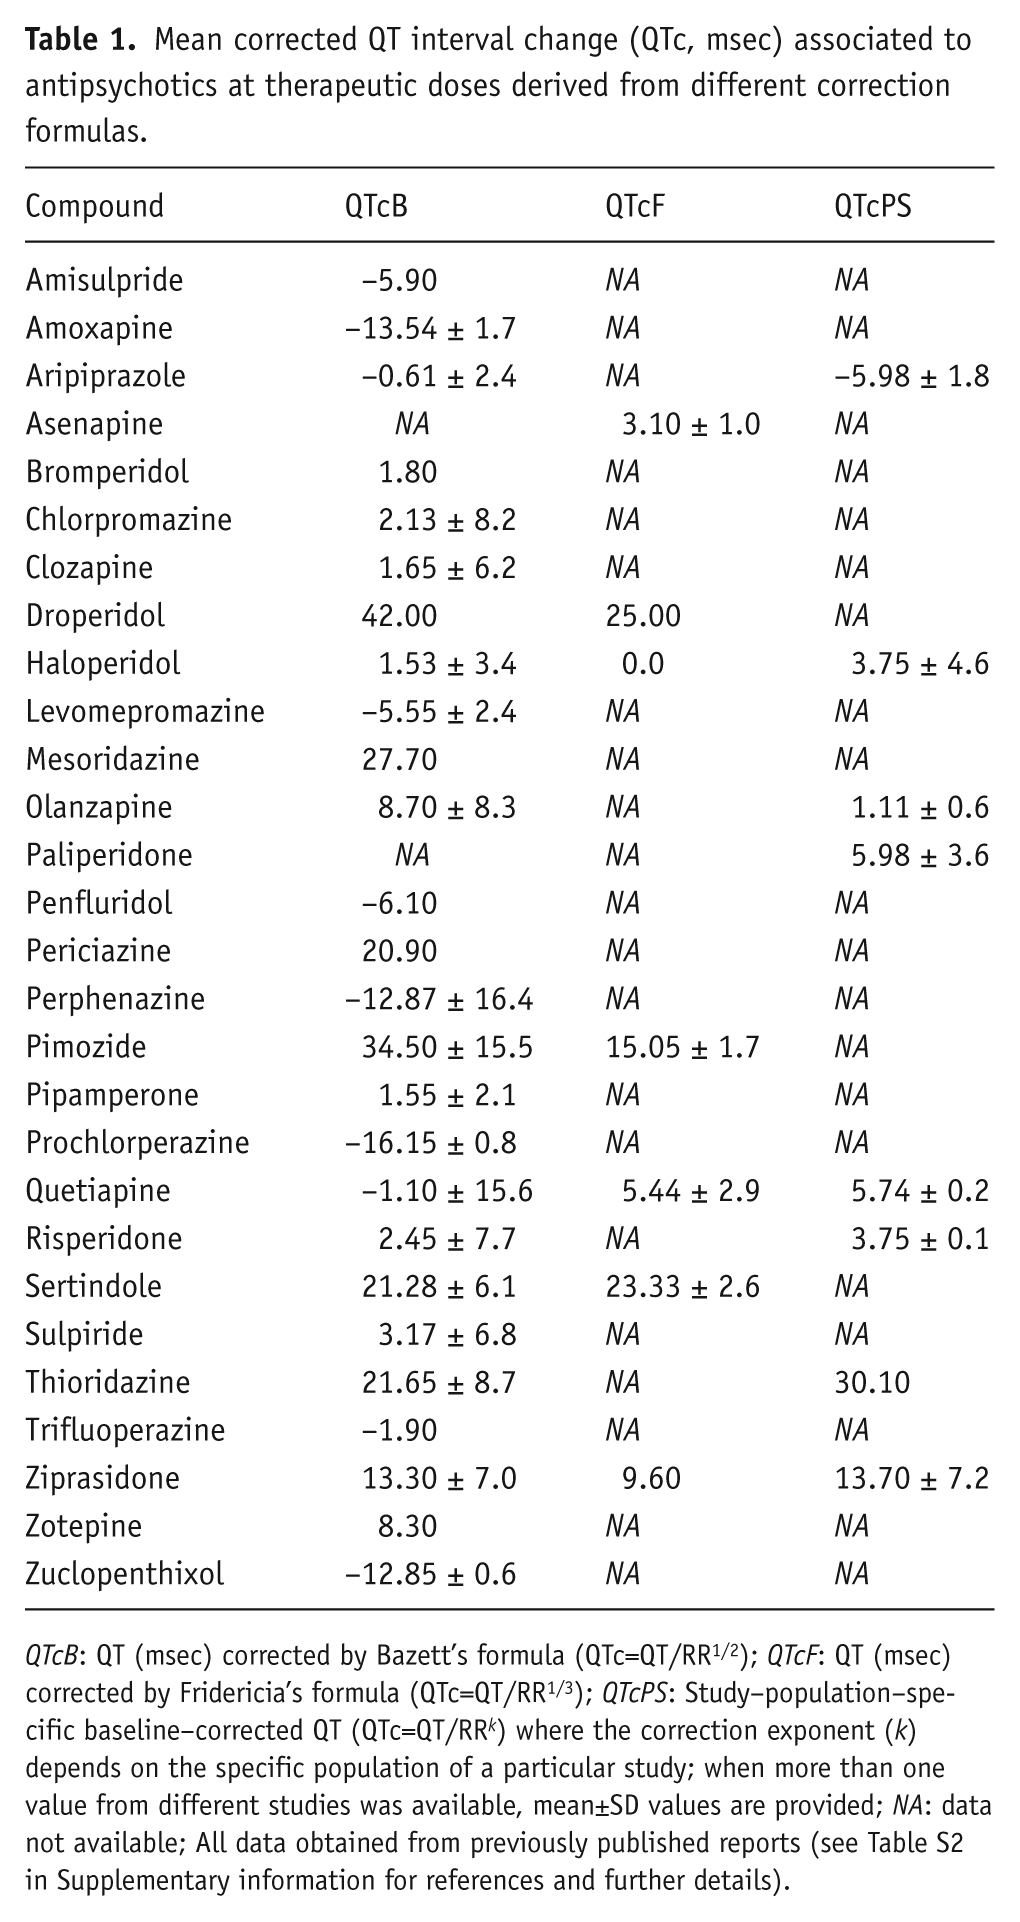
QTcB: QT (msec) corrected by Bazett’s formula (QTc=QT/RR1/2); QTcF: QT (msec) corrected by Fridericia’s formula (QTc=QT/RR1/3); QTcPS: Study–population–specific baseline–corrected QT (QTc=QT/RR k ) where the correction exponent (k) depends on the specific population of a particular study; when more than one value from different studies was available, mean±SD values are provided; NA: data not available; All data obtained from previously published reports (see Table S2 in Supplementary information for references and further details).
Data for total (TPCT) and calculated free (non-protein bound) therapeutic plasma concentration (TPCF) associated to antipsychotics at therapeutic doses.
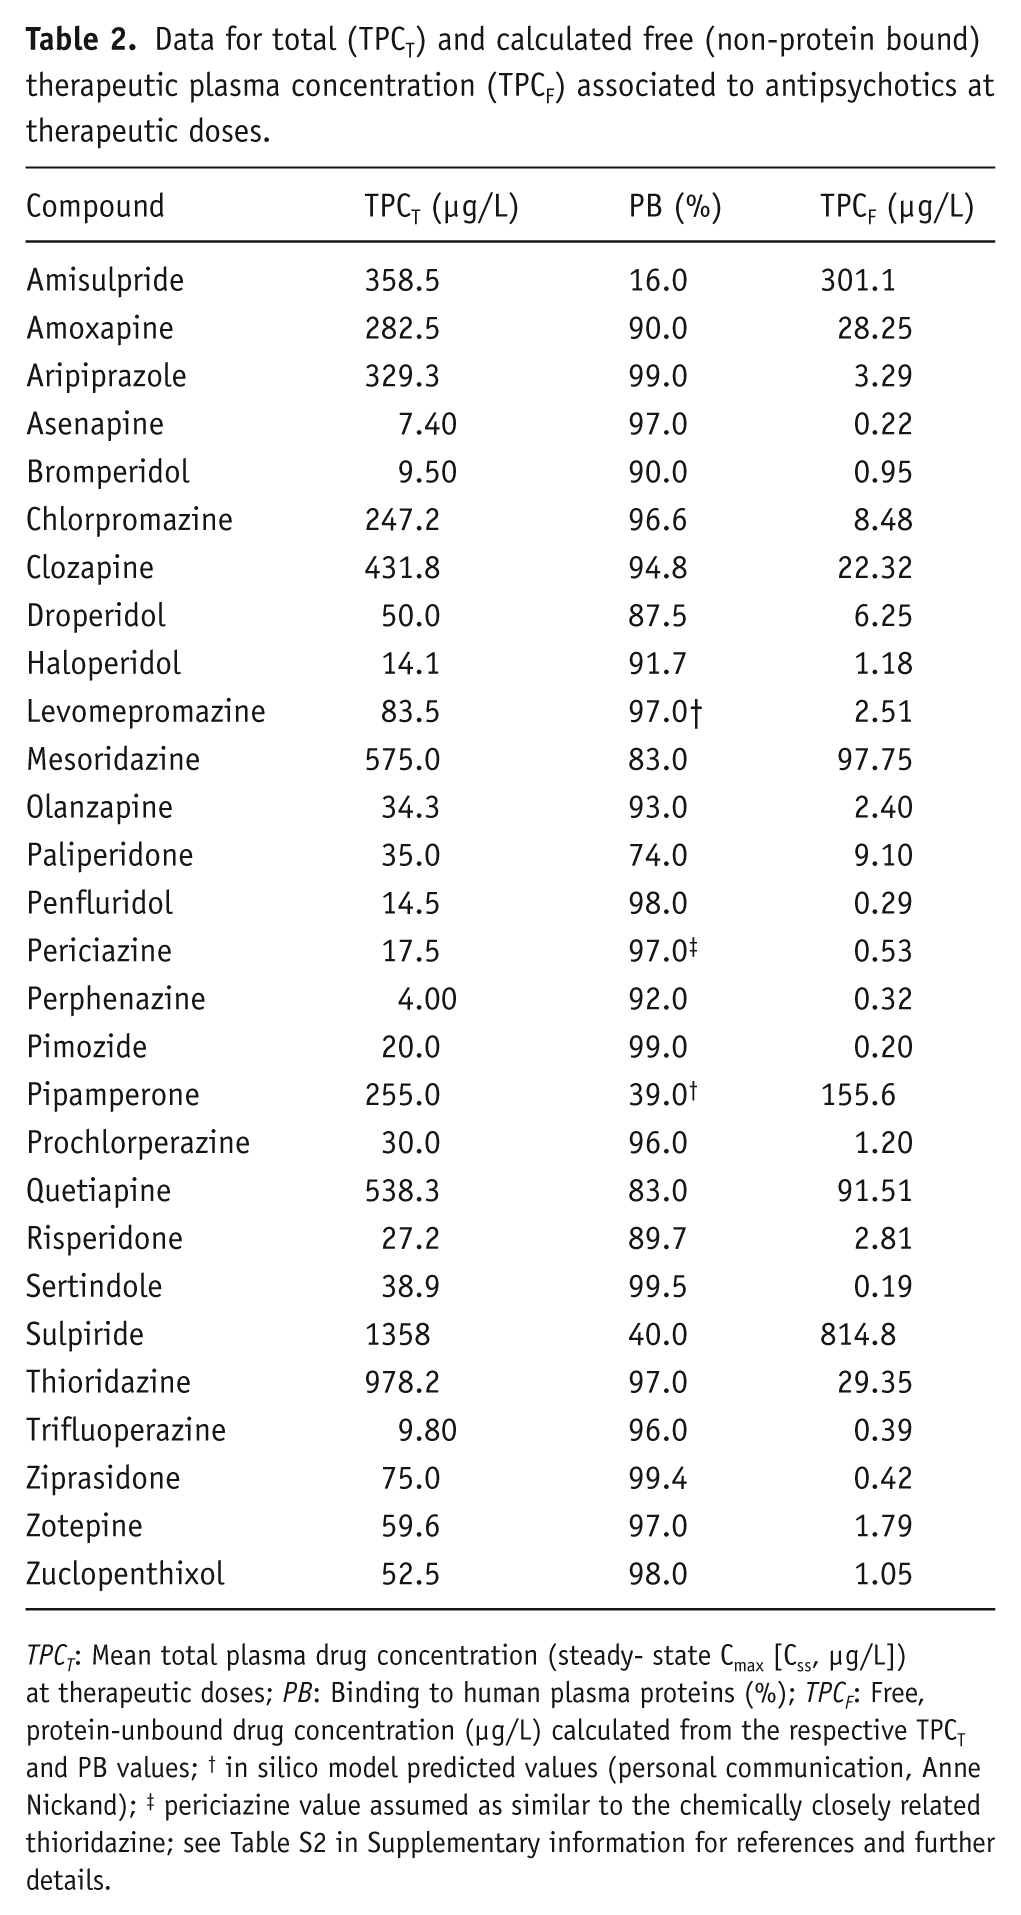
TPCT: Mean total plasma drug concentration (steady- state Cmax [Css, µg/L]) at therapeutic doses; PB: Binding to human plasma proteins (%); TPCF: Free, protein-unbound drug concentration (µg/L) calculated from the respective TPCT and PB values; † in silico model predicted values (personal communication, Anne Nickand); ‡ periciazine value assumed as similar to the chemically closely related thioridazine; see Table S2 in Supplementary information for references and further details.
Pharmacological targets
Binding affinity and functional data regarding 24 different pharmacological targets were initially considered. These included affinities (Ki) from competitive binding assays to receptors α1-, α2- and β-adrenergic, dopamine D1, D2, D3 and D4, serotonin 5-HT1A, 5-HT2A, 5-HT2C, 5-HT3, 5-HT6 and 5-HT7, cholinergic M1, M2 and M3, sigma1 (σ1) and histamine-1 (H1); dopamine (DAT), noradrenaline (NET), and serotonin (SERT) transporters; as well as functional current blocking activities (IC50) for potassium KV11.1 (hERG), sodium Nav1.5 and calcium Cav1.2 channels (see Table 3). Data were obtained from different resources, including available published literature and pharmacological databases (e.g. NCBI PubChem Compound, http://www.ncbi.nlm.nih.gov/pccompound; IUPHAR-DB, http://www.iuphar-db.org; BindingDB, http://www.bindingdb.org; NIMH Psychoactive Drug Screening Program, http://pdsp.med.unc.edu/pdsp.php; Thomson Reuters IntegritySM, https://integrity.thomson-pharma.com/integrity/xmlxsl) or expressly determined as specified at the section below. In order to ensure data homogeneity, only hERG-blocking values (IC50) obtained from whole-cell patch-clamp electrophysiological assays in HEK293 human embryonic kidney cells stably transfected with recombinant channel were considered. Similarly, functional current blockade (IC50) of human cardiac Nav1.5 and Cav1.2 channels were also considered when available. Unfortunately, available data regarding the functional blockade of Nav1.5 and Cav1.2 for the antipsychotics considered in the study were limited. Therefore, affinity values (Ki) for Na+ channel were considered when functional data were not available. Similarly, and because functional data for CaV1.2 for the compounds considered were extremely scarce, data for Ca2+ refer basically to binding affinity to cardiac Ca2+ channel.
Pharmacological binding profile of the antipsychotics included in this study.
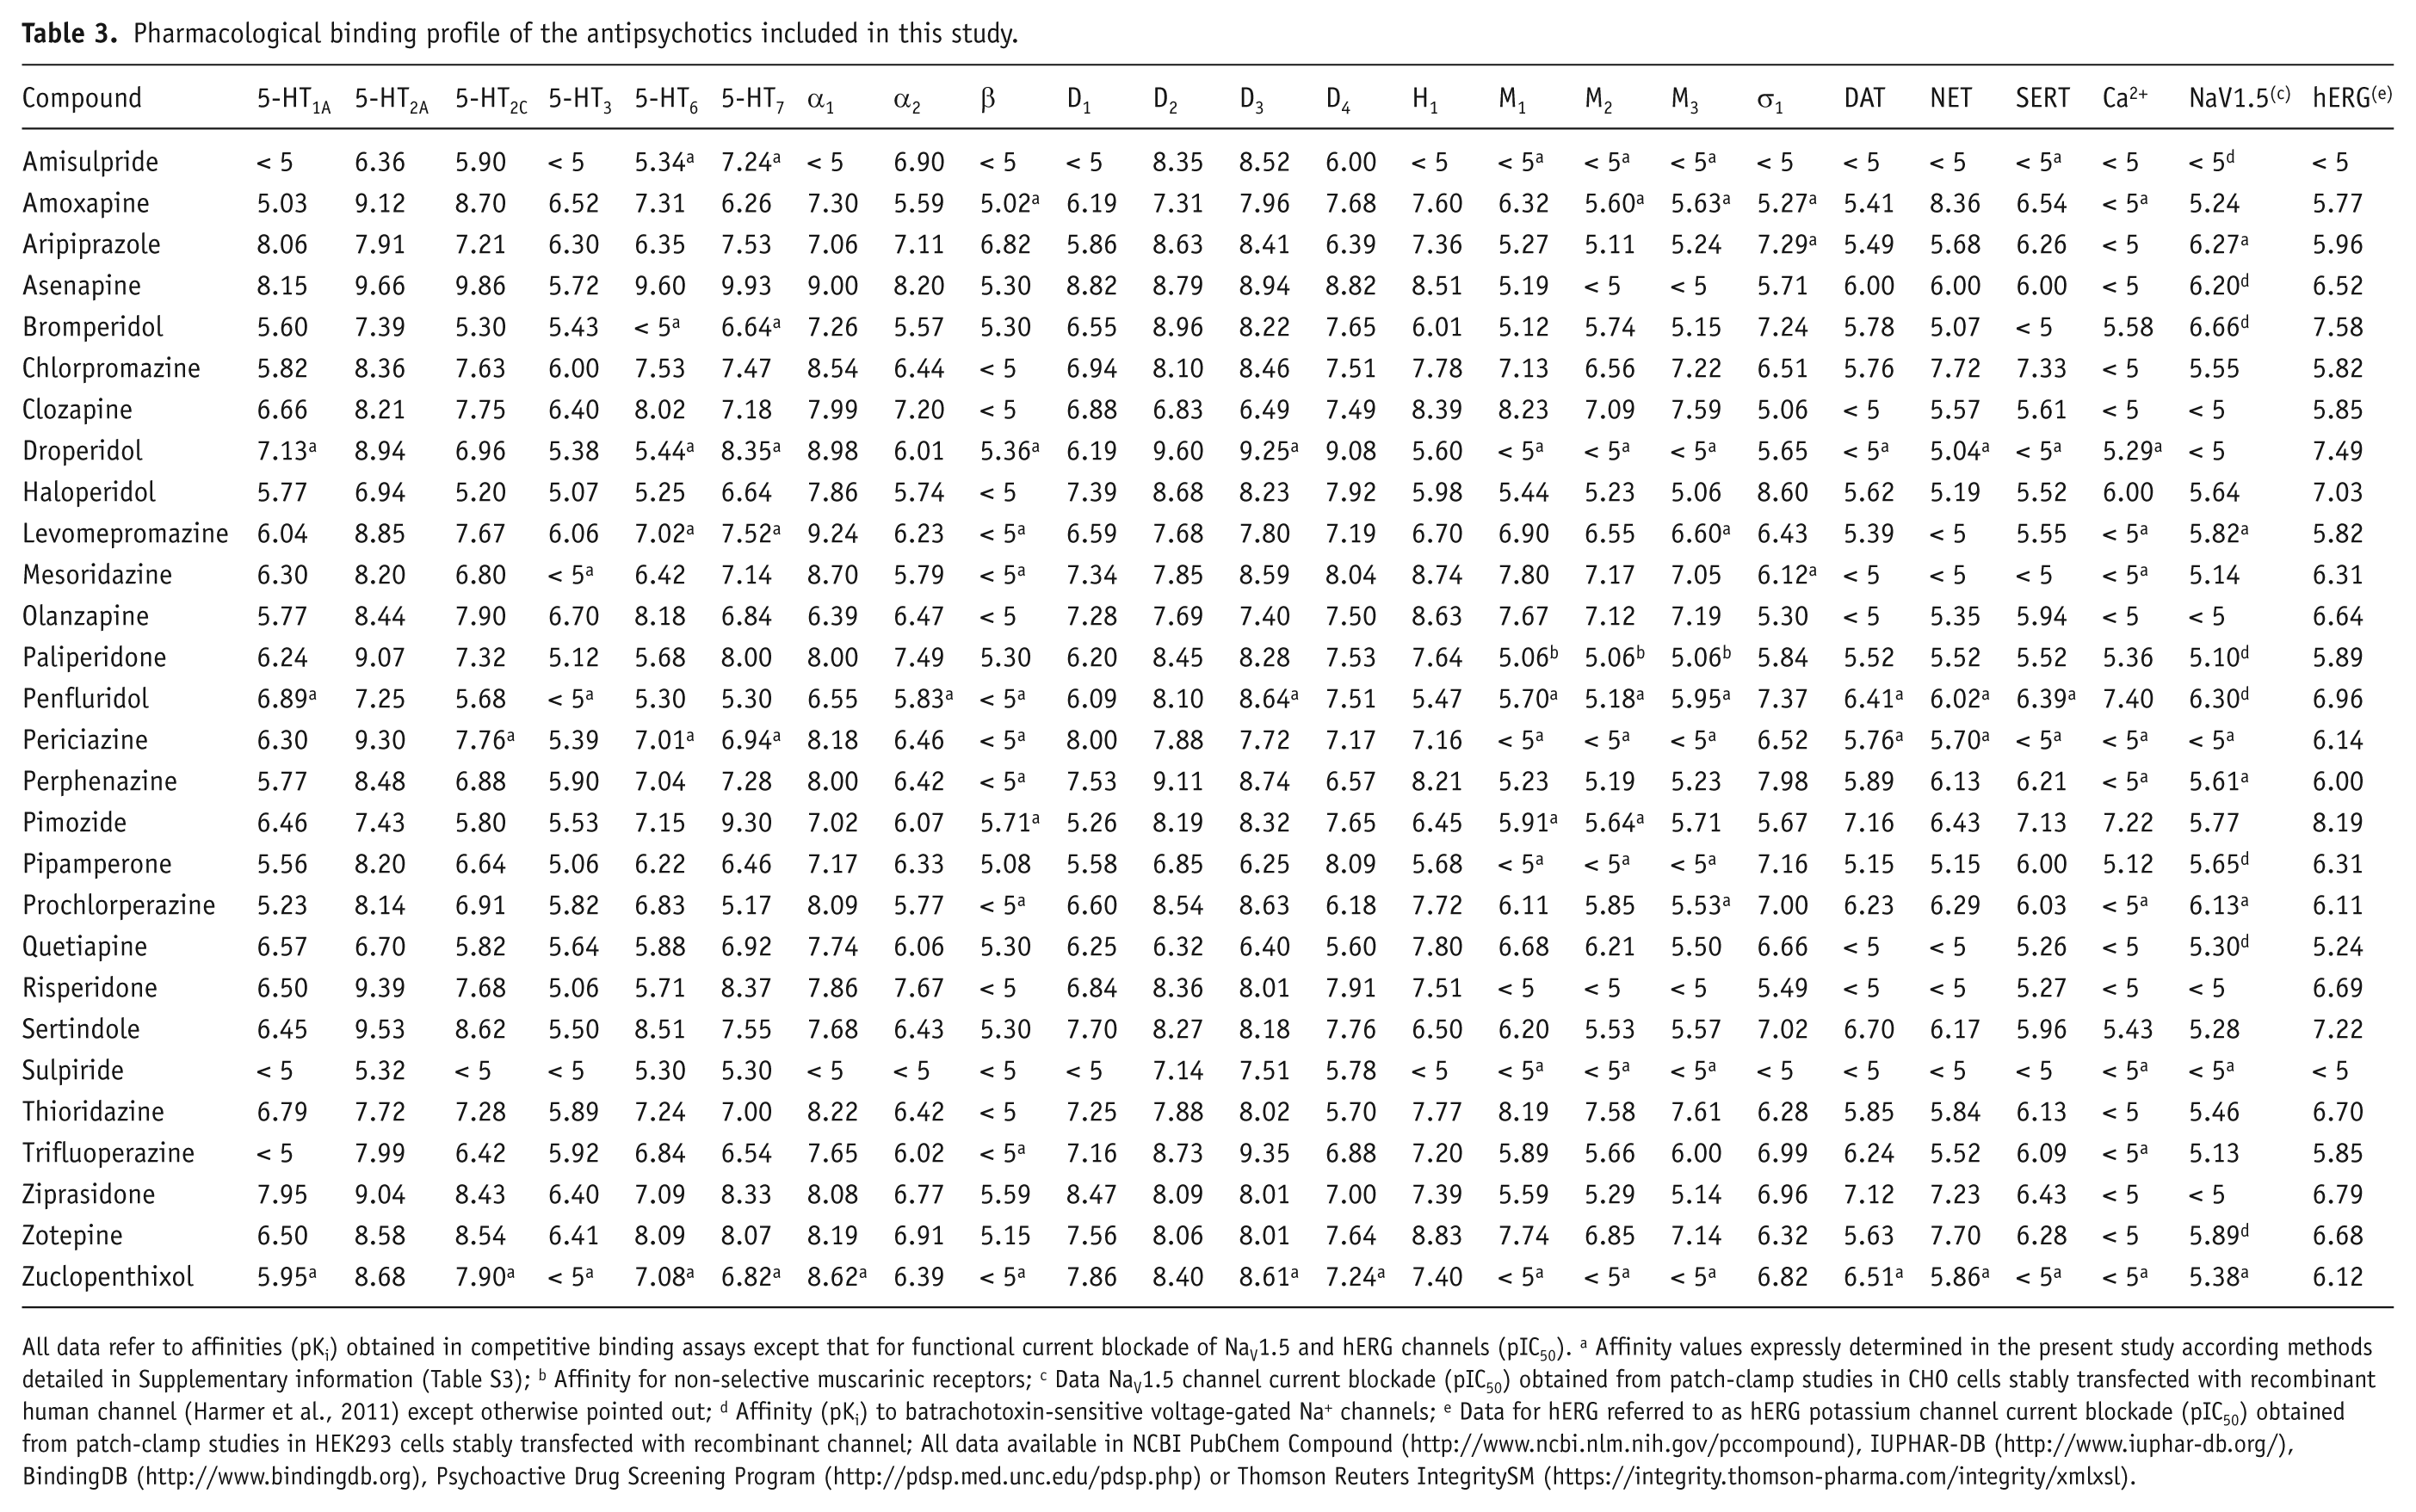
All data refer to affinities (pKi) obtained in competitive binding assays except that for functional current blockade of NaV1.5 and hERG channels (pIC50). a Affinity values expressly determined in the present study according methods detailed in Supplementary information (Table S3); b Affinity for non-selective muscarinic receptors; c Data NaV1.5 channel current blockade (pIC50) obtained from patch-clamp studies in CHO cells stably transfected with recombinant human channel (Harmer et al., 2011) except otherwise pointed out; d Affinity (pKi) to batrachotoxin-sensitive voltage-gated Na+ channels; e Data for hERG referred to as hERG potassium channel current blockade (pIC50) obtained from patch-clamp studies in HEK293 cells stably transfected with recombinant channel; All data available in NCBI PubChem Compound (http://www.ncbi.nlm.nih.gov/pccompound), IUPHAR-DB (http://www.iuphar-db.org/), BindingDB (http://www.bindingdb.org), Psychoactive Drug Screening Program (http://pdsp.med.unc.edu/pdsp.php) or Thomson Reuters IntegritySM (https://integrity.thomson-pharma.com/integrity/xmlxsl).
Binding affinity assays
For our purposes, the complete pharmacological profile of compounds for all the pharmacological targets considered in the study was a basic requirement. However, once assessed in the available literature and other data sources (see above), the binding affinity profile of 17 out of the 28 compounds remained incomplete for a variety of pharmacological targets. Therefore, additional competitive binding affinities (Ki) of these compounds were expressly determined according previously reported methods (Ricerca Biosciences, www.ricerca.com; see Supplemental Content and Table S3 for details). Compounds for which the affinities (Ki) to different pharmacological targets were expressly determined in the present study were: amisulpride, amoxapine, bromperidol, droperidol, mesoridazine benzenesulfonate, penfluridol, perphenazine, pimozide, pipamperone HCl, prochlorperazine dimaleate, (±)-sulpiride, thioridazine HCl, trifluoperazine HCl (all from Sigma-Aldrich Química, Spain); aripiprazole (Sequoia Research Products, UK); levomepromazine HCl (Chemos Laborbedarf GmbH, Germany); periciazine (MicroSource Discovery Systems, USA); and zuclopenthixol HCl (purified from a commercially available preparation at the Prous Institute for Biomedical Research).
Analysis and expression of data
More than 6600 individual values from over 400 different references were retrieved from the various resources (see above). Mean values for binding affinities (Ki) or channels current blockade (IC50) were calculated and subsequently converted to their -log10 values (pKi or pIC50, respectively), which were finally used as independent variables (predictors) in the subsequent statistical analyses (Table 3).
QTc interval change
The QT interval depends on several factors of which heart rate is the most influential, so that the QT interval shortens with increased heart rate (Cavero et al., 2000; Mason et al., 2007; Salvi et al., 2010). Many methods have been developed to correct the QT interval for the effects of heart rate in order to eliminate the effects of this confounding factor, including Bazett’s, Fridericia’s, Hodges’s, Framingham’s or that of study-population-specific baseline-correction (Cavero et al., 2000; Mason et al., 2007; Salvi et al., 2010). However, there is still no clear consensus on which is the preferred (Chiladakis et al., 2010; Desai et al., 2003; Salvi et al., 2010). For the present study, mean corrected QT interval changes (QTc, msec) from any correction formula derived from clinical studies of any commercially available antipsychotic at therapeutic dosages were considered. However, only data regarding Bazett’s (QTcB), Fridericia’s (QTcF), and study-population-specific baseline-corrected (QTcPS) formulas were available in the current literature for antipsychotic drugs (see Table 1 and Table S2 in Supplemental Content). Since QTc values of the same compound could vary among different studies, the mean QTc values (msec) were calculated and thereafter considered as the dependent variable (criteria) for subsequent statistical analyses.
Therapeutic plasma drug concentration (TPC)
Since drug binding to plasma protein modulates drug distribution, and given that total and free (unbound) plasma drug concentration of compounds relative to concentrations for blocking hERG are both important to estimate the risk of a drug of causing QTc prolongation (Gintant, 2011; Redfern et al., 2003), the ratios of activity on each of the pharmacological targets to total and free plasma drug concentration were separately considered for comparing them with QTc. Mean maximal plasma drug concentration (steady-state Cmax [µg/l]) of each compound at therapeutic dosages obtained from previously published clinical studies was considered as total plasma drug concentration (TPCT), which in turn was used to calculate the corresponding free (non-protein bound) plasma drug concentration (TPCF) by adjusting the TPCT values of the compounds for the respective protein-binding (%) values available from literature (see Table S2 in Supplemental Content for details). To normalize TPCT and TPCF values for statistical analyses, values originally expressed in g/L were converted to mols/L (M) and subsequently transformed to their -log10 values (pTPCT and pTPCF, respectively). Therefore, two different datasets were generated from the ratios to pTPCT and pTPCF which were separately considered for subsequent statistical analyses (see Tables S4 and S5 in Supplemental Content).
Statistics
The statistical package SPSS® v15.0 was used. MVLR analysis (stepwise method; F≥3.84 p<0.05 as criteria for variable(s) inclusion; exclusion criteria: F≤2.71 p≥0.1), was performed to determine the variables (independent variables or predictors) that best predict the outcome for a given measure (dependent variable). This was followed by proper linear regression analyses (linear regression coefficient, r2) for curve estimation in order to establish the exact nature of a previous established relationship when appropriate. Correlation analyses were made with either Pearson correlation or non-parametric Spearman’s rho when pertinent. The level of significance was always set at p<0.05.
Results
The complete pharmacological activity profile of 28 distinct antipsychotics on 24 different pharmacological targets is presented for the first time, including 94 new binding affinity values (Ki) for 17 antipsychotics that lacked data for some of the considered targets (see Table 3). In general, these antipsychotics show a wide range of activities on all of the pharmacological targets tested. The data for binding at the monoamine receptors will be specifically analysed in an upcoming, separate study. In particular, the compounds displayed a range of hERG blockade (IC50) from nM (e.g. pimozide, bromperidol, droperidol, sertindole), to μM or higher (e.g. clozapine, quetiapine, olanzapine, amisulpride, sulpiride). Similarly, the present study presents an exhaustive dataset on QTc associated with the therapeutic use of antipsychotics (Table 1), revealing that these compounds show a wide range of related QTc interval changes, as several appear associated with a low risk for prolonging QTc (e.g. prochlorperazine, perphenazine, zuclopenthixol, amoxapine, perphenazine) while others are associated with a high risk for QTc prolongation, with mean QTc changes higher than 20 msec (e.g. droperidol, pimozide, mesoridazine, thioridazine, sertindole). The Bazett’s corrected QTc (QTcB) was by far the most common QT corrected value found for antipsychotics in the current literature. Despite other corrected QT values from different formulas, such as the Fridericia’s (QTcF) and the study-population-specific (QTcPS) correction, also being identified for some of the compounds considered in the study (Table 1), no suitable statistical analyses by using these measures were feasible due to their limited availability. However, a high degree of correlation was detected between QTcB and QTcPS (Pearson’s correlation coefficient, r=0.87 p<0.01) and QTcB and QTcF (r=0.85 p<0.05). Therefore, and despite known limitations related to Bazett’s correction (Salvi et al., 2010), QTcB was chosen as the reference QTc value for subsequent statistical analyses.
In order to screen variables for subsequent analyses, data were initially examined to detect noticeable relationships between QTc and any variable of each dataset considered in the study by means of Pearson’s correlation analysis (see Tables S7–S10 in Supplemental Content). The hERG-related factors show the highest significant relationships with QTc through any of the sets of independent variables with r values ranging from 0.57 to 0.69 (p<0.001). It is interesting to note that the ratio of hERG to NaV1.5 (hERG/NaV1.5) shows the highest relationship with QTc (r=0.76; p<0.001). Although other targets (e.g. 5-HT1A, 5-HT7, D4) appeared somehow related to QTc, these relationships are partial and weaker than those involving hERG (e.g. Tables S7–S9 in Supplemental Content).
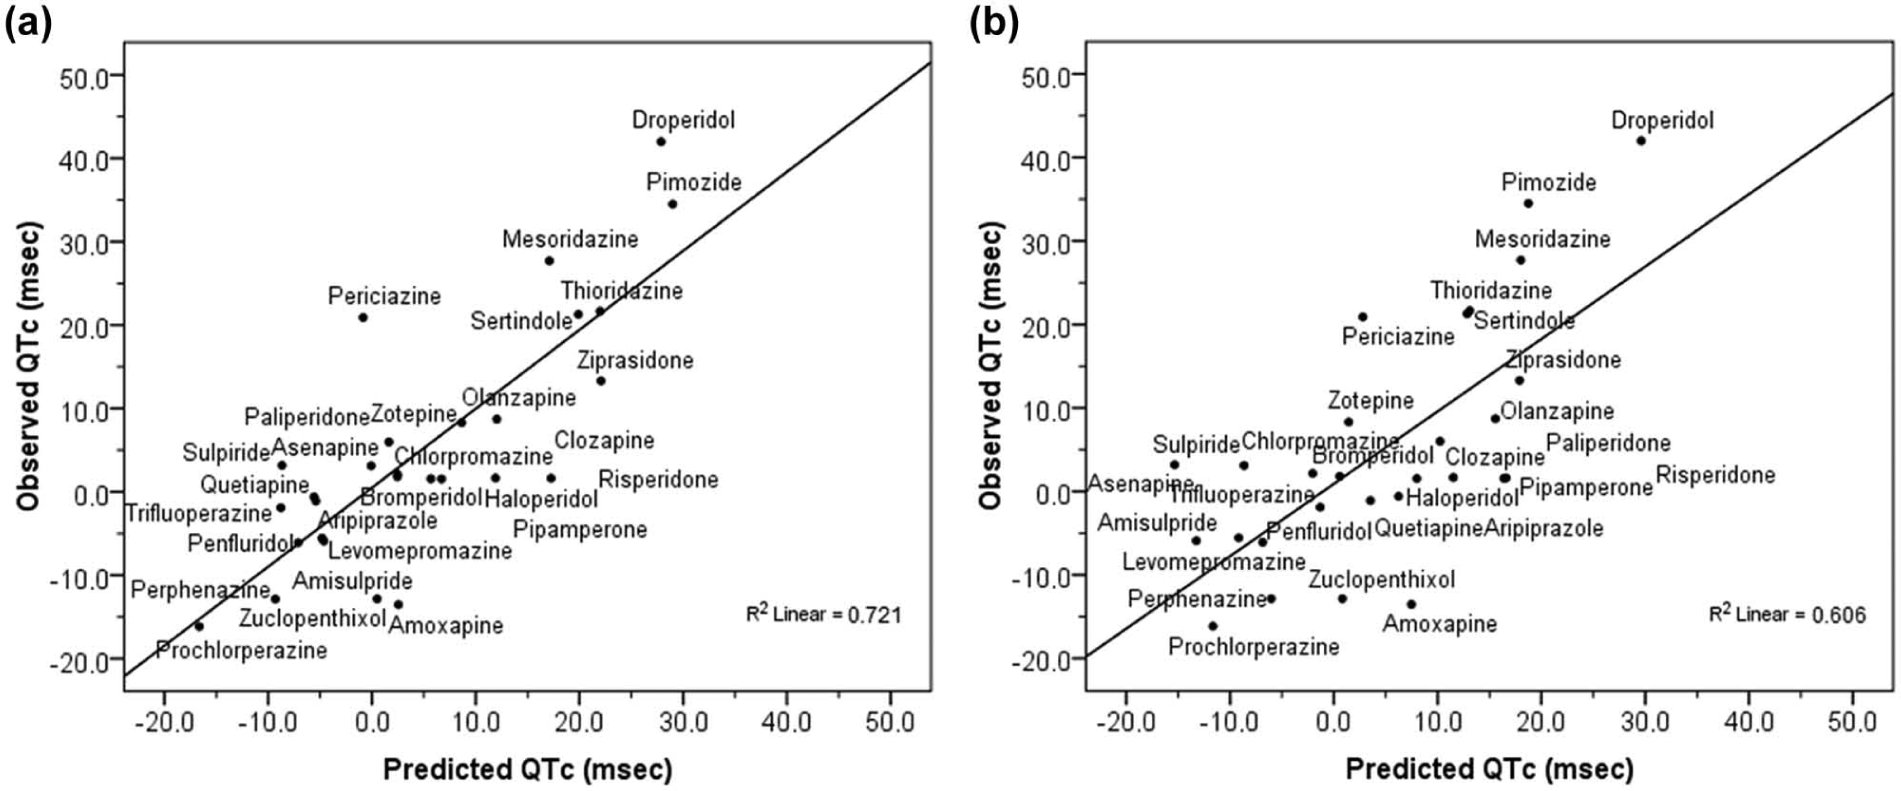
Subsequently, more detailed analyses were conducted to identify those pharmacological factors that best predict the ability of antipsychotics to cause QTc changes. For this, a specific MVLR for each of the datasets considered was used to estimate the coefficients of the linear equation that best predict QTc. Therefore, QTc was modelled separately for each dataset by means of the corresponding MVLR analysis. Taking first the original dataset regarding pharmacological target interaction (Table 3), the MVLR analysis showed the potency for blocking hERG (pIC50) as the major predictor factor for QTc (r=0.57; F(1,27)=12.70; p<0.001). However, a model with hERG blockade along with NaV1.5 blockade was shown as the most appropriate (r=0.76; F(2,27)=16.97; p<0.0001). In fact, the explained variability of QTc increased from 33% when considering hERG alone to 57% when considering hERG and NaV1.5 together; that is 43%, which is quite substantial. The resulting regression equation provided the corresponding adjusted predicted values for QTc as outlined graphically (Figure 1(a)). Subsequent curve estimations from linear regression analyses between QTc changes (msec) and hERG and NaV1.5 channels blockade (pIC50) were performed, of which the positive relationship of QTc with hERG blockade (r=0.57; F(1,26)=12.70; p<0.001) as well as the negative relationship with NaV1.5 blockade (r=-0.28; F(1,26)=2.23; p<0.2) were illustrated (Figure 1(b)).
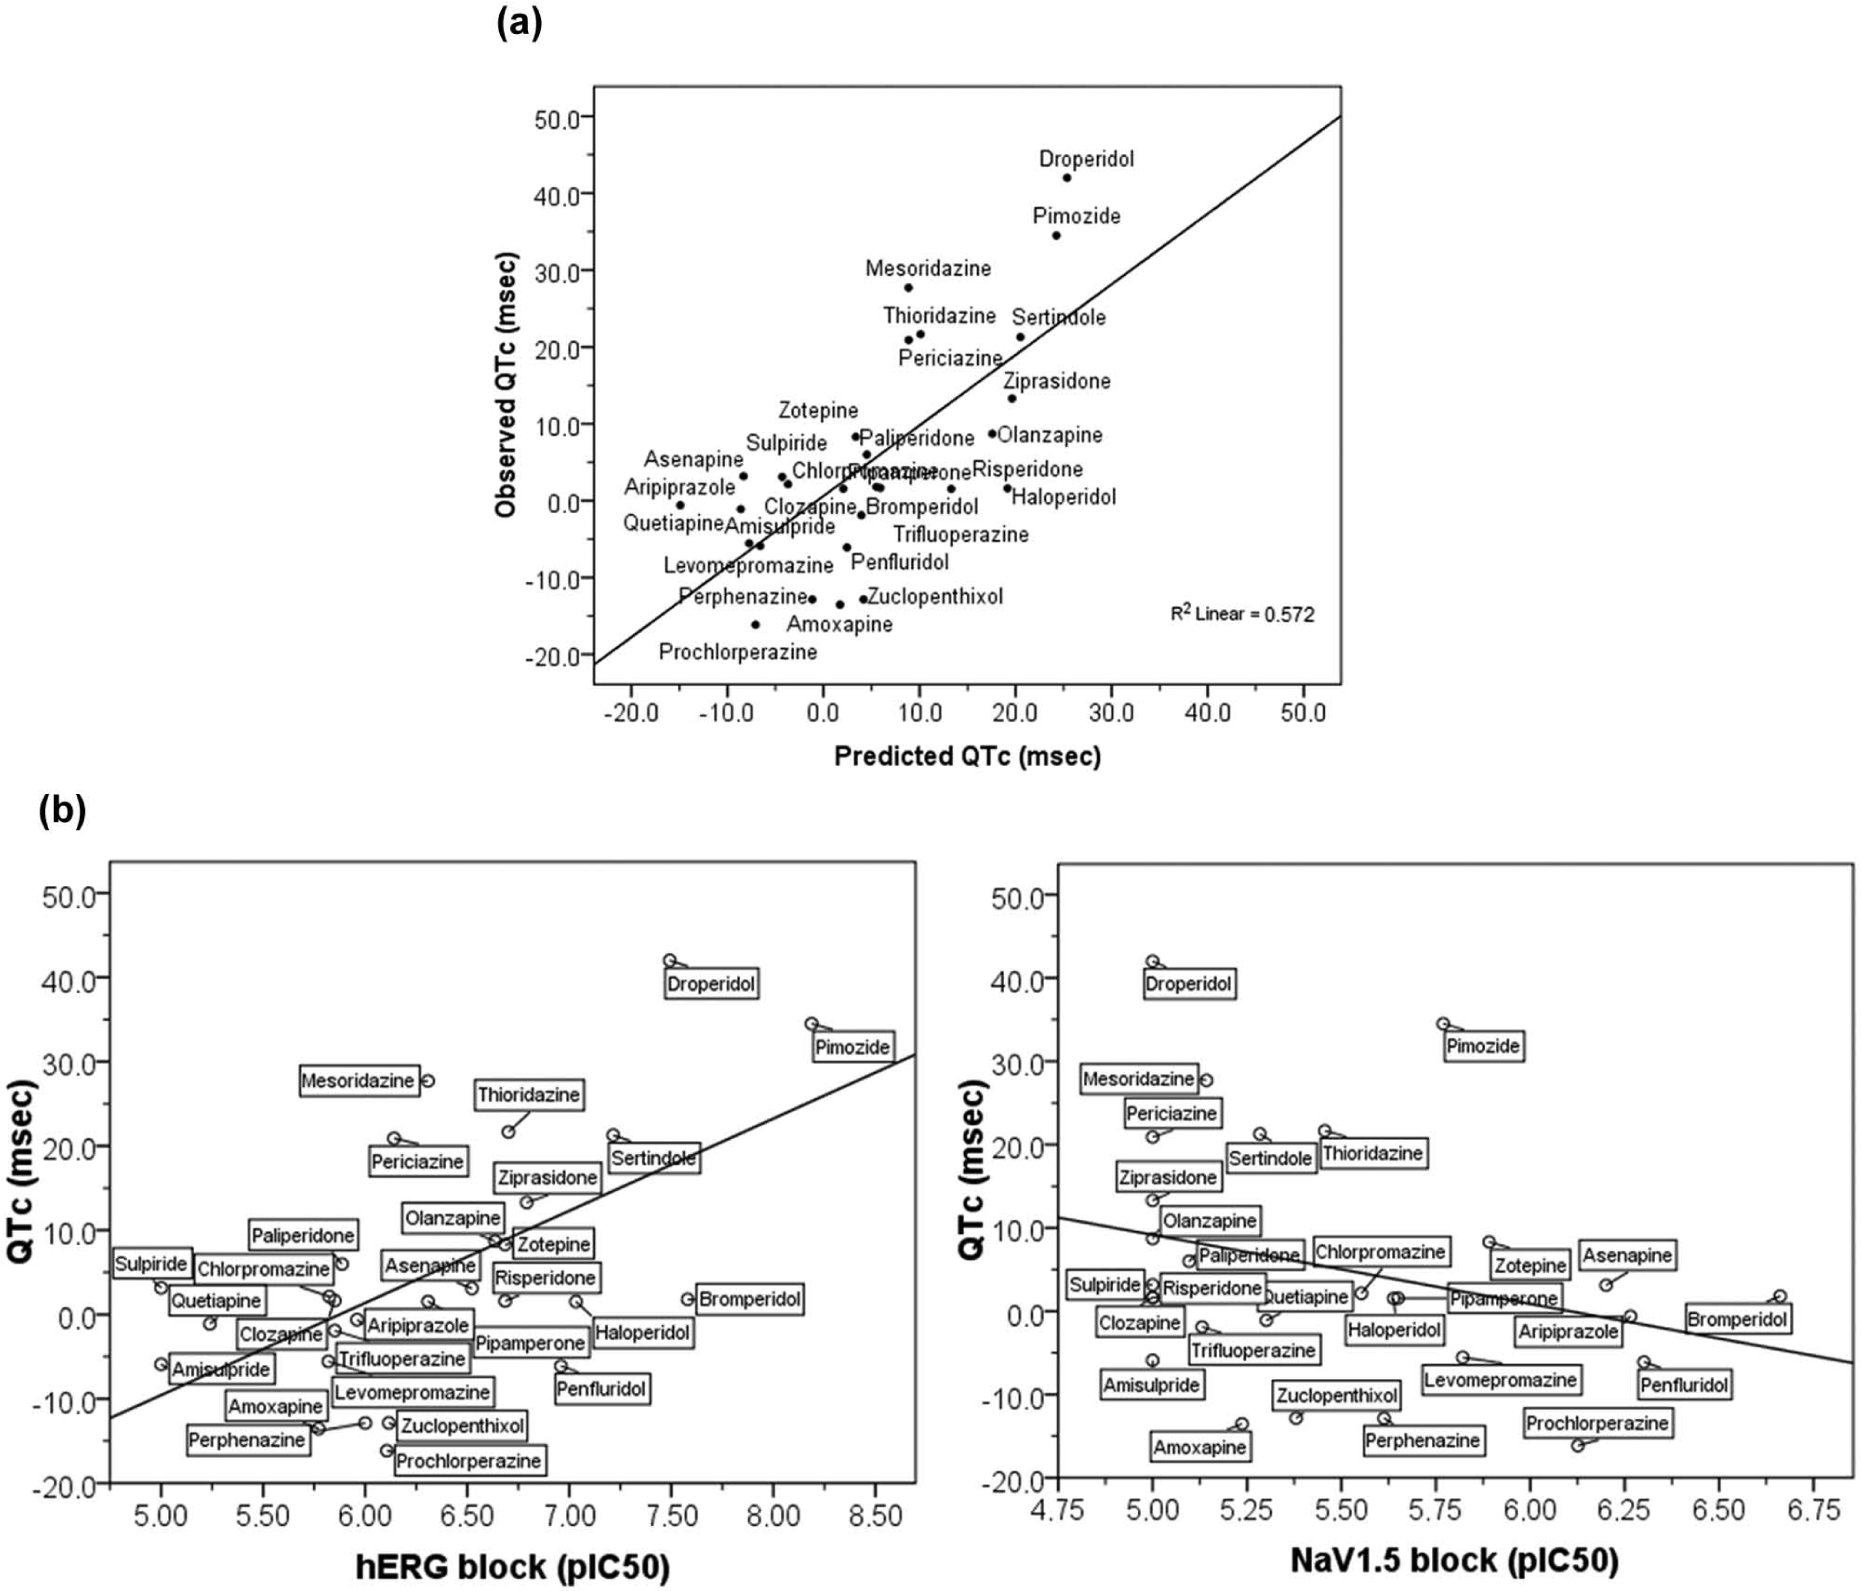
(a) Blockade of hERG and NaV1.5 channels (pIC50) as main predictors of QTc change (msec) associated with antipsychotics (r=0.76; p<0.0001) as revealed by the MVLR using original data for interaction to pharmacological targets as the set of independent variables. Figure shows the linear regression relationship for the observed and predicted values of the QTc change as a function of hERG and NaV1.5 blockade (pIC50) provided by the prediction regression equation QTc = - 0.077 + 14.24(hERG) - 15.54(NaV1.5) obtained by the corresponding MVLR analysis; (b) Curve estimations from linear regression analyses between blockade of either hERG or NaV1.5 (pIC50) with QTc change (msec) showing the positive relationship between hERG and QTc (r=0.57; F(1,26)=12.70; p<0.001, slope=10.93) as well as the negative relationship between NaV1.5 and QTc (r=-0.28; F(1,26)=2.23; p=0.14, slope=-8.29).
Since the total (TPCT) and free (TPCF) plasma drug concentration of a compound relative to its concentration for blocking hERG are both important to appraise the effects of a drug on QTc (Gintant, 2011; Gintant et al., 2006; Kongsamut et al., 2002; Webster et al., 2002), data were additionally analysed using the datasets established from ratios to TPCT and TPCF (see Tables S4 and S5 in Supplemental Content). The corresponding MVLR analyses provide similar results, with models showing hERG/TPCT (r=0.69; F[1,27]=23.1; p<0.0001) and hERG/TPCF (r=0.58; F[1,27]=13.17; p<0.001) as main predictors of QTc as well as the significant effect of concomitantly considering the corresponding ratios of hERG and NaV1.5 to TPC. In the case of the model for ratios to TPCT (r=0.82; F[2,27]=25.30; p<0.00001), the explained variance of QTc due to the inclusion of the effects on NaV1.5 (factor NaV1.5/TPCT) increased from 47% of when considering hERG/TPCT alone to 67%: that is a substantial 30% (change F[1,25]=15.03; p<0.001). Similarly, in the model for ratios to TPCF (r=0.70; F[2,27]=12.07; p<0.0001) the explained variance of QTc due to the inclusion of the corresponding NaV1.5 related factor (NaV1.5/TPCF) increased 31% (from 34% to 49%; change F[1,25]=7.62; p<0.05). However, models best fitting with QTc included supplementary factors other than those related to hERG and NaV1.5 channels. In fact, a MVLR model including ratio of 5-HT7 receptor affinity to TPCT was revealed as the best fitting with QTc (r=0.85; F[3,27]=21.02; p<0.000001). Otherwise, when using the dataset constituted by the ratios to TPCF, the best fit model was one including the β-adrenergic receptor affinity (r=0.78; F[3,27]=12.50; p<0.0001). It is noteworthy that while the inclusion of the ratio 5-HT7/TPCT in its MVLR model slightly increases the explained variance of QTc by 7.5% (change F[1,24]=4.78; p<0.05), the inclusion of β/TPCF increases the explained variance of QTc by 19.5% (change F[1,24]=7.29; p<0.05). The corresponding prediction regression equations for QTc, derived from the ratios to TPCT and TPCF as a function of the different factors involved in each case, allow the calculation of the respective adjusted predicted values for QTc as outlined graphically (Figure 2(a) and 2(b), respectively). Furthermore, and since blockade of hERG consistently appears as the major predictor of QTc changes associated with antipsychotics, an additional MVLR analysis was performed using the ratios of potency of blocking hERG (pIC50) to the rest of the targets as the dataset of independent variables (see Table S6 in Supplemental Content). In this case, the ratio constituted by the potency for blocking hERG and NaV1.5 (hERG/NaV1.5) was revealed as the only significant predictor for QTc (r=0.76; F[1,27]=35.23; p<0.00001), able to explain by itself 57% of the overall QTc variability. The corresponding prediction regression equation enables calculation of the respective adjusted predicted values for QTc as a function uniquely of the ratio hERG/NaV1.5 (Figure 3).
(a) Linear regression relationship for the observed and predicted values of the QTc change (msec) associated with antipsychotics as a function of ratios to total plasma drug concentration (TPCT) of hERG, NaV1.5 and 5-HT7 (r=0.85; p<0.000001) provided by the prediction regression equation QTc= -54.6 + 106.1(hERG/TPCT) -79.1(NaV1.5/TPCT) + 22.7(5-HT7/TPCT) obtained by the MVLR analysis using ratios to TPCT as the set of the independent variables; (b) Linear regression relationship for the observed and predicted values of the QTc change (msec) associated with antipsychotics as a function of ratios to free plasma drug concentration (TPCF) of hERG, NaV1.5 and β-adrenoceptor (r=0.78; p<0.0001) provided by the prediction regression equation QTc= -38.7 + 103.6(hERG/TPCF) -135.2(NaV1.5/TPCF) + 85.3(β/TPCF) obtained by the MVLR analysis using ratios to TPCF as the set of the independent variables.
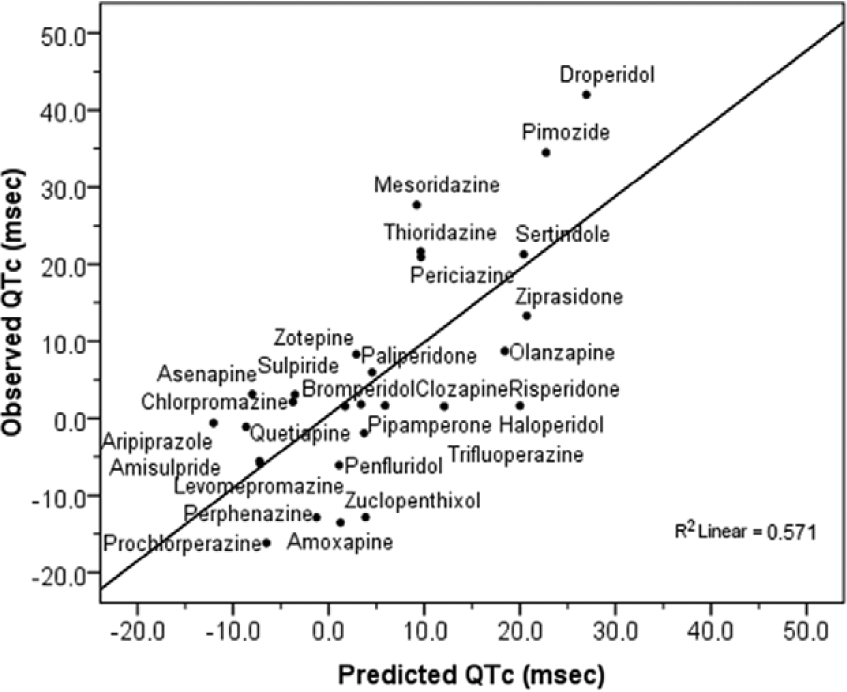
Ratio hERG/NaV1.5 as main predictor factor of QTc change (msec) associated with antipsychotics (r=0.76; p<0.00001) as revealed by the MVLR using ratios of hERG as the set of independent variables. Figure shows the linear regression relationship for the observed and predicted values of the QTc change as a function of the hERG/NaV1.5 ratio provided by the prediction regression equation QTc = -82.78 + 75.69(hERG/NaV1.5) obtained by the corresponding MVLR analysis.
Additionally and in order to test the reliability and consistency of data, we set out to confirm the known relationship between the therapeutic dosage and affinity to the dopamine D2 receptor of antipsychotics by performing a MVLR, taking the mean total plasma drug concentration at therapeutic doses of compounds (pTPCT) as the dependent variable. According to previous reports (Creese et al., 1976; Seeman et al., 1976; Silvestre and Prous, 2005), MVLR provided a highly statistically significant regression model with affinity to D2 as the main predictor for pTPCT (see Figure S2 in Supplemental Content).
Discussion
Inhibition of IKr resulting from hERG blockade is considered the primary mechanism by which most of the commonly prescribed drugs delay the cardiac ventricular repolarization and prolong the QT interval. However, hERG is not the sole factor in determining the QT interval. Other ion channels and receptors involved in cardiac function may also participate in the effects of drugs on the QT interval and, therefore, act as confounding factors in relating hERG blockade to QT prolongation, though there is no clear consensus about the precise role played by these other factors in the risk of drug-induced QTc prolongation (Agelink et al., 2001; Fossa, 2008; Gintant, 2011; Martin et al., 2004; Taggart et al., 2003). This is of particular importance for antipsychotics, since these drugs are characterized by interacting with a wide range of pharmacological targets (Kroeze et al., 2003; Silvestre and Prous, 2005; Stahl, 2003). The aim of present study was to identify those pharmacological targets playing a critical role in the risk of antipsychotics to prolong QTc, in order to generate rational working hypotheses suitable to be experimentally tested. For this purpose, the mean corrected QT interval changes (QTc, msec) associated with the therapeutic use of a number of marketed antipsychotics were collected and compared with their activity with a variety of pharmacological targets by means of MVLR, in order to obtain statistical models useful to predict the extent of QTc as a function of the activity of antipsychotic on those crucial pharmacological targets.
All our analyses show the hERG blockade as the main predictor of QTc changes associated with antipsychotic drugs at therapeutic doses, hence confirming the capability for blocking hERG as the primary mechanism underlying the risk of antipsychotics to prolong QTc, in agreement with previous reports (Crumb, Jr. et al., 2006; Kongsamut et al., 2002; Redfern et al., 2003). Also in accordance with previous studies (De Bruin et al., 2005; Redfern et al., 2003; Viskin, 1999), the margins between the hERG blockade and plasma exposure of the drug (assessed as the ratios of blocking hERG IC50 values to TPC) are shown as more useful parameters to predict the risk of QT prolongation as opposed to the potency for blocking hERG alone. Despite the assumption that drug bound to proteins is not able to interact with ion channels on the cell surface (Gintant, 2011; Webster et al., 2002), we obtained similar results from considering ratios to total (TPCT) and free (TPCF) plasma drug concentration, indicating that both measures may be useful when reviewing safety margins of antipsychotic drugs. Although antipsychotics may exhibit a wide range of plasma protein-binding values, such a concordance could be due to the fact that most antipsychotics have values in the range of 90% (see Table 2), which reduces the variability between bound and free plasma concentration. However, despite the similarity of results from using ratios to TPCT and TPCF, QTc appears to be better explained by hERG blockade when considering its ratio to total (TPCT) than when considering the ratio to free (TPCF) compound. This finding opposes the general assumption that the ratio of blocking hERG to TPCF is preferable for establishing safety margins regarding risk of adverse effects associated with hERG blockade (De Bruin et al., 2005; Gintant, 2011; Redfern et al., 2003), but is partially in agreement with a previous study on a series of antipsychotics showing that the ratios of hERG blockade to TPCT could fit better to the degree of QTc than do the ratios to TPCF (Kongsamut et al., 2002).
Further to confirm the blockade of hERG as the main predictor of QTc prolongation associated with antipsychotics, all analyses consistently show the concomitant involvement of NaV1.5 as a compensatory factor of the effects of antipsychotics on the QTc caused by hERG blockade (see Figures 1 and 2), so that QTc changes could largely be explained when considering together the blocking effects on hERG and NaV1.5 channels. This was evident in any model resulting from MVLR analyses using different sets of independent variables, since the inclusion of the corresponding factors involving NaV1.5 blockade increases substantially the explained variability of QTc by 30–43% compared with models only considering hERG-related factors. The key role of NaV1.5 in the QTc caused by hERG blockade was particularly evident from the model using ratios of hERG as the dataset (see Table S6 in Supplemental Content), since the ratio hERG/NaV1.5 is revealed as the only predictive factor of the QTc prolongation able to explain, by itself, 57% of the overall QTc variability (see Figure 3). Although these results do not imply a causal effect, it is interesting to note their agreement with previous evidence. In fact, the finding showing the channel NaV1.5 as a modulator of the effects on QTc caused by hERG fits well when one considers the role of NaV1.5 in the cardiac action potential and, in particular, that of the slowly inactivating component of INa, namely late INa. Activation of the cardiac NaV1.5 channel is responsible for rapid ventricular depolarization due to the brief but powerful INa. Although most cardiac Na+ channels are rapidly inactivated, a small percentage may remain active, allowing a sustained or late INa to distinguish it from the first peak or transient INa. Whereas peak INa is associated with the rapid ventricular depolarization, late INa constitutes an important inward current during ventricular repolarization contributing to prolong the action potential and hence the QT interval (Belardinelli et al., 2004, 2006). Consequently, the failure of late INa to inactivate may result in a sustained inward current that can delay ventricular repolarization and prolong QTc. In fact, enhanced late INa is related to several cardiac abnormalities associated with QT interval prolongation. For instance, the enhanced late INa due to gain-of-function mutations in SCN5A, the gene encoding the cardiac NaV1.5 channel, is responsible for the inherited LQT3 (Paulussen et al., 2004). Similarly, compounds able to induce a sustained enhancement of late INa also cause prolongation of QT interval. This is exemplified by the sea-anemone toxin ATX-II which, due to its QT-prolonging effects through the enhancement late INa, is frequently used to mimic LQT3 in experimental models (Antzelevitch and Belardinelli, 2006; Belardinelli et al., 2004). In contrast, relatively pure late INa inhibitors such as tetrodotoxin (TTX) and lidocaine shorten the QT interval (Belardinelli et al., 2004, 2006). This role of late INa in the action potential has led to the consideration of the blockade of NaV1.5 channel as a compensating mechanism of the disrupting effects caused by hERG blockade (Antzelevitch and Belardinelli, 2006; Belardinelli et al., 2004, 2006), which is consistent with our results. In fact, in the experimental model of perfused rabbit left ventricular wedge, the QT prolongation caused by ATX-II and that induced by the relatively pure IKr inhibitor sotalol are both effectively reverted by ranolazine through its ability to inhibit late INa (Jia et al., 2011), which explains the modest prolongation of QT associated with ranolazine despite its capability to inhibit IKr by blocking hERG. The compensatory concept by which the dysfunctional hERG-related effects can be offset through the inhibition of late INa has been previously indicated to justify the dissociation between hERG blockade and the low prevalence of long QT syndrome (LQTS) exhibited by several drugs, including ranolazine, mefloquine, amiodarone, and verapamil, all able to effectively inhibit late INa further to their hERG-blocking activities, as well as the effectiveness of drugs such as mexiletine and ranolazine for treating LQT2-based arrhythmias, the inherited LQTS caused by hERG mutation (Antzelevitch and Belardinelli, 2006; Belardinelli et al., 2003, 2006; Shimizu et al., 2005). Therefore, a compensatory effect of the hERG-induced QTc prolongation associated with antipsychotics by assuming the capability of these compounds to inhibit late INa fits pretty well with previous evidence, and could explain why some antipsychotic drugs such as penfluridol and bromperidol, both able to effectively interact with hERG and Na+ channels at micromolar concentrations, exhibit a lower QTc prolongation than would be expected from only considering its potency for blocking hERG (see Figure 1(b)), and thus allows us to hypothesize that these compounds are also effective in inhibiting late INa. However, and since specific functional blockade of late INa was not directly considered, the association remains subject to be evaluated in appropriate functional assays.
In addition, it is interesting to note that the best-fitting models with QTc yielded in the present study included other factors besides those related to hERG and NaV1.5. In fact, the inclusion of the ratios of 5-HT7 to TPCT (5-HT7/TPCT) and of the β-adrenergic receptor to TPCF (β/TPCF) in their corresponding MVLR models contributes to an increase, to some extent, of the explained variance of QTc. Although the impact of including these factors is relatively limited, the results are of interest as these receptors are involved in the autonomic modulation of cardiac output and, therefore, in the cardiac action potential and QT interval. Action potentials through the heart are influenced by the autonomic state rate which, in turn, is regulated by both sympathetic and parasympathetic nervous inputs involving a variety of neurochemical modulatory systems, including those of muscarinic, serotonin and α- and β-adrenergic receptors (Cavero et al., 2000; Fossa, 2008). For instance, under normal conditions, β-adrenergic-mediating stimulation of the sympathetic nervous system results in an increase of cardiac output which is accompanied by a concomitant reduction of action potential duration (APD) at cellular levels and the corresponding QT interval prolongation (Sampson and Kass, 2010). Thus, β-adrenergic antagonism can increase the disrupting effect on APD caused by hERG blockade by disturbing the β-adrenergic sympathetic stimulation on cardiac output and, therefore, prolong QTc. Similarly, serotonin receptors play an important role in central autonomic regulation of cardiac function (Jordan, 2005). In particular, the 5-HT7 receptor would play a facilitating role in reflex activation of vagal cardiac outflow causing bradycardia (Kellett et al., 2005), which is also a factor known to contribute to QTc prolongation (Cavero et al., 2000; Fossa, 2008). Therefore, although the effects of 5-HT7 and β-adrenergic receptors on the capability of antipsychotics to cause QTc appear limited, an additional contribution of these receptors as positive modulators in the manner indicated by its respective models (e.g. Figure 2(a) and 2(b), respectively), cannot be completely disregarded.
Despite the consistency of the results, we are aware that the study has potential limitations. One comes from using Bazett’s correction of QT interval (QTcB) as the reference QTc value for analyses, since Bazett’s formula tends to overcorrect and undercorrect the QT interval at high and low heart rates, respectively (Salvi et al., 2010). Other correction methods such as those of Fridericia, Framingham, Hodges, or study-population-specific baseline-correction, are considered more appropriate for evaluating the impact of drugs on the QT interval (Chiladakis et al., 2010). However, none appears free of limitations. In fact, the corrections from Fridericia or Framingham formulas also exhibit some degree of imprecision depending on heart rate, while the use of the study-population-specific formula, although possibly providing more precise corrections, has not been widely extended (Desai et al., 2003; Salvi et al., 2010). In contrast, despite its well-known limitations, most important data on QTc have historically derived from Bazett’s correction due to its uniformly extensive use in clinical practice, being the correction method that most clinicians use and recognize (Nielsen et al., 2011; Tisdale et al., 2012). Therefore, although we assume that the use of other corrected values of QT less sensitive to heart rate variability would be better for our purposes, the Bazett’s corrected QTc was our best option because of the low availability of other corrected measures.
As mentioned above, another limitation of the present study would come from the limited availability of functional data for NaV1.5 and CaV1.2 current blockade. We are aware that the ideal scenario would be to consider only data from functional assays for all the channels involved in cardiac function. Unfortunately, the availability of these data for the antipsychotics included in the study was limited, forcing us to consider data for binding affinity in cases where functional data from electrophysiological assays were not available. This may be considered as a valid approach since previous reports have associated binding to other cardiac channels such as hERG directly to the functional outcome (Chiu et al., 2004). Similarly, a significant positive relationship is found between functional potency for blocking NaV1.5 (IC50) and binding affinity (Ki) for batrachotoxin-sensitive Na+ channel (see Figure S1 in Supplemental Content). Therefore, and despite its evident limitations, binding affinity for Na+ channel was considered as a valid alternative when functional data for NaV1.5 were not available.
As discussed above, it should be noted that our results would fit well with the rationale only by assuming that antipsychotics may effectively inhibit the late INa. However, since no specific data about this were found for antipsychotics, the data for NaV1.5 blockade considered in the study do not distinguish between late INa and peak INa, which makes it difficult to ascribe the compensating effect observed for the Na+ channel to the blockade of late INa. Most of the potencies for blocking NaV1.5 considered in the present study are from the study of Harmer et al. (2011), which shows that pharmacological blockade of NaV1.5 is associated with QRS prolongation. Although the safety implications of blockade of NaV1.5 and QRS prolongation remain a matter of debate (Gintant et al., 2011), the fact is that some evidence indicates that pharmacological inhibition of INa may also cause arrhythmias associated with an increased mortality rate (Echt et al., 1991). Since inhibition of late INa is associated with QT shortening (Belardinelli et al., 2004, 2006), the relationship between blockade of NaV1.5 and QRS prolongation observed by Harmer et al. (2011) could be attributed rather to the inhibition of peak INa than late INa. By contrast, and as we find that the role of the NaV1.5 blockade related to antipsychotics appears to be protective for the associated QTc, their effects are unlikely to be due to inhibition of peak INa, but rather to the inhibition of late INa. However, note again that the association needs to be tested in proper functional assays.
Other factors that could limit the scope of our results are those concerning drug metabolism as well as drug–drug interactions. Drug–drug interactions, such as those drugs interfering with the metabolism of antipsychotics, may precipitate the development of arrhythmias and QT prolongation of drugs by altering plasma concentrations (Redfern et al., 2003). However, this is unlikely to affect our results since QTc data were carefully collected from clinical studies assessing the effects caused specifically by the studied drug (e.g. Table S2 in Supplemental Content). In addition, metabolites of several of the antipsychotics considered in the present study can also block hERG, and therefore participate in the QTc changes of parent compounds. For instance, one of the active metabolites of thioridazine, mesoridazine, is also able to effectively block hERG similarly to thioridazine and contribute to the QTc prolongation associated with thioridazine. However, the potency for blocking hERG of antipsychotic metabolites, such as those of clozapine, olanzapine or risperidone, is usually lower than that of the parent compound, and they are unlikely to reach concentrations that might contribute to clinically significant QT interval prolongation (Crumb, Jr. et al., 2006; Ekins et al., 2002).
Despite the limitations mentioned above, the present study also has several valuable strengths that are worth highlighting. This study markedly extends the number of compounds for which pharmacological data have been gathered; it has also extended the range of pharmacological targets studied and the clinical factors evaluated (see Tables 1–3). For instance, the present study incorporates the largest number of antipsychotic drugs for which hERG-blocking activities were produced under comparable standard conditions (Silvestre and Prous, 2007). Therefore, the homogeneity and accuracy of key data is also a strength that contributes to the consistency and reliability of our dataset, as demonstrated not only by showing the expected relationship between hERG blockade and QTc over all the analyses performed using different datasets, but also because it allows the corroboration of the well-known relationship between D2 receptor affinity and TPC (Figure S2 in Supplemental Content), in concordance with previous reports (Creese et al., 1976; Seeman et al., 1976; Silvestre and Prous, 2005).
The clinical implications of the current findings are evident. Firstly, the data presented reveal clear differences in the hERG properties of antipsychotics as well as in their associated QTc, strongly indicating that these compounds cannot be treated as a single class and that the corresponding arrhythmogenic risk must be assessed on a compound-by-compound basis, as also shown in a recent meta-analysis study of 15 different antipsychotics (Leucht et al., 2013). Secondly, since the capacity of antipsychotics to interact with the cardiac Na+ channel could compensate the dysfunctional effects due to hERG blockade, both should be considered together in order establish the capability to prolong QTc and, therefore, the arrhythmogenic risk of an antipsychotic in a more precise way. However, it is noteworthy that although the present study focused on the QTc changes associated with antipsychotic therapy, QTc alone is a relatively poor predictor of arrhythmogenic risk since some agents that substantially prolong QTc produce very low rates of TdP while other agents with relatively small QTc effects exhibit a substantial proarrhythmic risk (Belardinelli et al., 2003; Heist and Ruskin, 2010). This could be due to factors beyond the QTc prolongation. It is now widely recognized that drug-induced TdP requires both a substrate, constituted by the propensity of a drug to increase transmural dispersion of repolarization (TDR) across the ventricular wall, and a trigger, provided by the capability of the drug to generate early after-depolarizations (EAD) (Antzelevitch, 2007; Kannankeril and Roden, 2007). Although inhibition of IKr is considered the common mechanism underlying QT prolongation, and TDR and EAD are implicated in TdP occurrence, other ion currents such as INa and ICa also play important roles (Antzelevitch, 2007; Killeen, 2009a). For instance, augmentation of late INa amplifies TDR hence providing the substrate for TdP, while agents that reduce late INa are effective in suppressing TDR as well as TdP (Antzelevitch and Belardinelli, 2006; Killeen, 2009a). Thus, the hypothetical blockade of the late INa here alleged by the antipsychotics would not only be effective in reducing the impact on the QT interval due to hERG blockade, but also in decreasing its arrhythmogenic risk by reducing the TDR. These results would be of particular importance for patients with a higher risk of suffering cardiac adverse events, such as those with inherited LQTS or the elderly population (Kannankeril and Roden, 2007; Moss, 1999; Viskin, 1999). In particular, patients with schizophrenia also constitute a vulnerable group since they exhibit a higher prevalence of cardiovascular disease and higher risk for sudden death independent of drug treatment (Glassman, 2005; Killeen, 2009a), suggesting that schizophrenia may also be a risk factor for LQTS; thus the drug treatment should be carefully chosen.
In summary, the present study confirmed the potency for blocking hERG as the key factor to predict the risk of antipsychotics to cause QTc interval prolongation. In addition, and in concordance with previous studies indicating the inhibition of late INa as a compensatory factor of cardiac dysfunctional effects due to hERG blockade, our results show that the effects of antipsychotics on cardiac Na+ channels could modulate the disrupting effect of hERG blockade on QTc, allowing us to hypothesize that antipsychotics may be effective in inhibiting late INa. Taking into account these results, we suggest that the capability of antipsychotics to block hERG and NaV1.5 channels (e.g. late INa) should be concomitantly considered prior to establishing an authoritative arrhythmogenic risk assessment for these drugs. Due to the close relationship between QTc prolongation and TdP, we think that these results may be useful for developing new and safer antipsychotics, and in avoiding exposing particularly vulnerable individuals as well as the general public to the unnecessary risk of potentially fatal arrhythmias.
Footnotes
Acknowledgements
We would like to thank Dr. Garry Gelade (Business Analytic Ltd.) for his valuable suggestions, guidance and technical assistance in statistical analyses.
Conflict of interest
The authors declare that there are no conflict of interest.
Funding
This research received no specific grant from any funding agency in the public, commercial, or not-for-profit sectors.
References
Supplementary Material
Please find the following supplemental material available below.
For Open Access articles published under a Creative Commons License, all supplemental material carries the same license as the article it is associated with.
For non-Open Access articles published, all supplemental material carries a non-exclusive license, and permission requests for re-use of supplemental material or any part of supplemental material shall be sent directly to the copyright owner as specified in the copyright notice associated with the article.