
Abstract
During the middle years of life, sleep becomes more fragile and its sensitivity to psychostimulants may increase. This study evaluated the effects of 200 mg and 400 mg of caffeine on sleep in young and middle-aged adults. The sleep of 22 young (23.5 ± 1.9 years) and 24 middle-aged (51.7 ± 11.5 years) adults was recorded using polysomnography in two conditions (placebo and caffeine) in a double-blind cross-over design. Compared to placebo, caffeine increased sleep latency, shortened total sleep duration and reduced sleep efficiency. At the higher dose, these effects were more pronounced in middle-aged than in young adults. Furthermore, the higher dose of caffeine increased absolute stage 1 sleep in young adults, whereas it decreased absolute stage 2 sleep in middle-aged adults. Caffeine also induced dose-dependent increases in relative stage 1 sleep and reductions in absolute and relative slow wave sleep and absolute rapid eye movement sleep in both age groups. There was no dose- or age-related modulation of the effects of caffeine on quantified electroencephalographic measures. These results indicate that, compared to young adults, middle-aged adults are generally more sensitive to the effects of a high dose of caffeine on sleep quantity and quality.
Introduction
Building evidence highlights the diversity of physiological and psychological consequences of caffeine consumption. These range from increased anxiety, insomnia and higher risk for hypertension to enhanced mood, alertness and cognitive performance in conditions of sleep loss (Charney et al., 1984; Hartley et al., 2000; Killgore et al., 2009; Landolt et al., 1995; Quinlan et al., 2000; Warburton, 1995; Wesensten et al., 2005). Caffeine is also thought to have potential protective effects against age-related neurodegenerative diseases (Arendash et al., 2006; Maia and de Mendonca, 2002; Schwarzschild et al., 2003; Stone et al., 2009). The negative or positive nature of these effects is likely to relate to caffeine dosage and its effects on brain functions.
Caffeine blocks the action of adenosine, a neuromodulator involved in the homeostatic regulation of the sleep–wake cycle (Fredholm et al., 1999; Landolt, 2008). Caffeine ingestion increases sleep latency and wakefulness during sleep and reduces slow wave sleep (SWS) and slow wave activity (SWA; spectral power between 0.5 and 4.0 Hz) (Bonnet and Arand, 1996; Landolt et al., 1995, 2004). Studies have demonstrated dose-dependent effects of caffeine on sleep, with higher doses leading to more pronounced increases in sleep latency and wake after sleep onset, and greater decreases in SWS (Hindmarch et al., 2000; Karacan et al., 1976; Schwierin et al., 1996; Yanik et al., 1987). Interestingly, these studies have also found that higher doses of caffeine were required to induce significant reductions in rapid eye movement (REM) sleep under habitual sleep conditions and to attenuate the build-up of SWA following sleep deprivation.
Epidemiological data reveal that the average caffeine consumption during adulthood is highest in people aged in their fifties and sixties (Garriguet, 2008; Mitchell et al., 2014). This age group is known to undergo extensive sleep changes, many of which are reminiscent of caffeine-induced sleep alterations. Compared to the young, middle-aged and older adults show decreased sleep efficiency, shorter sleep duration, reduced SWS, and lower SWA (Carrier et al., 1997, 2001; Gaudreau et al., 2001; Landolt et al., 1996). Surprisingly, the age-related modulation of caffeine effects on the sleep–wake cycle has received little attention. One recent study reported that compared to young individuals, older adults show reduced effects of 200 mg of caffeine on vigilance during acute sleep deprivation (Landolt et al., 2012). Conversely, age-related differences on the effects of caffeine on sleep suggest higher sensitivity in older adults. In a previous study, our group detected subtle age differences in the response to 200 mg of caffeine, with caffeine decreasing low delta spectral power in prefrontal derivations and increasing beta spectral power in parietal derivations in middle-aged adults, but not in younger adults (Drapeau et al., 2006). Subsequently, we assessed the effects of 200 mg of caffeine on daytime recovery sleep following a night of sleep deprivation. The results indicated that the combined effects of caffeine and circadian phase misalignment had a dramatic impact on the sleep of middle-aged adults, leading them to be awake for more than 50% of the overall sleep period (Carrier et al., 2009). However, the effects of caffeine per se were similar in young and middle-aged participants.
The present study compared the effects of 200 mg and 400 mg of caffeine on sleep in young and middle-aged adults. It was hypothesized that caffeine would disrupt sleep in a dose-dependent manner and that age differences in the response to caffeine would be more prominent with the higher dose.
Materials and methods
Participants
Twenty-two young (10 males, 12 females; 20–30 years old, mean age 23.5 ± 1.9 years) and 25 middle-aged (12 males, 13 females; 40–60 years old, mean age 51.7 ± 11.5 years) healthy adults participated in this study. All participants reported being moderate caffeine consumers, ingesting the equivalent of one to three cups of coffee per day. Exclusion criteria were: smoking, use of medication known to influence sleep, sleep complaints, night work or transmeridian travel in the 3 months prior to the study, presence or history of a psychiatric or neurological illness, body mass index (BMI) higher than 29, and score higher than 10 on the Beck Depression Scale (Beck and Steer, 1987). Furthermore, all participants were free of any drug that affects the sleep–wake cycle. Blood sample analysis (complete blood count and serum chemistry comprising hepatic and renal functions, prolactin levels, levels of testosterone in men, and levels of oestrogen, follicle-stimulating hormone (FSH) and luteinizing hormone in women), and urinalysis results were checked by a certified physician to rule out significant medical conditions. Peri-menopausal women and women using hormonal contraceptives or receiving hormonal replacement therapy were excluded. Premenopausal women reported having regular menstrual cycles (25–32 days) during the year preceding the study, no vasomotor complaints (i.e. hot flashes, night sweats) and showed low FSH levels (< 20 IU/L). Premenopausal women were studied in the laboratory during the follicular phase of their menstrual cycle. All postmenopausal women reported an absence of menses during the past year and their FSH levels were > 20 IU/L.
Prior to data acquisition, participants underwent a poly-somnographic adaptation and screening night with a nasal/oral thermistor and electromyographic (EMG) leg electrodes. The presence of sleep disturbances such as sleep apnoeas and hypopnoeas (index per hour associated with microarousals > 10), periodic leg movements (index per hour associated with microarousals > 10), prolonged sleep latency (> 30 min), or low sleep efficiency (< 85%) resulted in the participant’s exclusion. All participants signed an informed consent form and received a monetary compensation for their participation. This study was approved by the Hospital’s Ethics Committee.
Procedure
Participants attended the chronobiology laboratory for two nonconsecutive experimental nights separated by 6–9 days. They arrived at the laboratory 6–8 hours before their habitual sleep time and left 1–1.5 hours after their habitual wake up time. During their first visit to the laboratory, each participant’s height and weight were measured to determine BMI. One week prior to the first night, and until the end of the study, participants were instructed to keep a regular sleep–wake pattern within 30 minutes of their habitual sleep–wake schedule and to maintain their habitual caffeine intake. During this time, they were asked to complete the French version of the Pittsburgh Sleep Diary on a daily basis (Monk et al., 1994). Bedtime and wake time in the laboratory were based on each individual’s habitual sleep–wake cycle, averaged from the sleep diary.
Participants also kept a daily log of the amount of caffeinated products they consumed. The mean number of milligrams of caffeine consumed per day was approximated for each participant according to the following criteria: 250 mL of coffee = 100 mg of caffeine; 250 mL of tea = 50 mg of caffeine; 250 mL of cola = 35 mg of caffeine; 10 g of chocolate = 5 mg of caffeine. On experimental days, participants were required to abstain from alcohol and were permitted to maintain their habitual caffeine consumption in the morning, so as to prevent potential caffeine withdrawal effects. Starting at noon, participants stopped consuming caffeine-containing beverages and foods.
All participants were submitted to both a caffeine and a placebo (lactose) condition in a double-blind cross-over design using stratified randomization. Participants within each age group were allocated to one of two dosage groups (except one participant who took part in both groups). In the low dose group, 26 participants (12 young (six males, six females; mean age 23.7 ± 2.1 years) and 14 middle-aged (seven males, seven females; mean age 50.4 ± 5.4 years)) received 200 mg of caffeine and placebo. In the high dose group, 21 participants (10 young (four males, six females; mean age 23.2 ± 1.6 years) and 11 middle-aged (five males, six females; mean age 53.4 ± 7.0 years)) received 400 mg of caffeine and placebo. One capsule containing half the dose of either caffeine (100 mg or 200 mg) or placebo (lactose) was administered 3 hours prior to habitual bedtime, and the remaining dose of caffeine or placebo (100 mg or 200 mg) was administered 1 hour before bedtime. The doses were administered at these two times to test the effects of caffeine on vigilance (data not presented here). All capsules were two-piece telescopic hard capsules, allowing the ingestion of caffeine without oral contamination.
Salivary caffeine concentration
Salivary caffeine concentration was measured in saliva samples collected upon arrival at the laboratory (T1), 5 minutes before bedtime after the two caffeine/placebo capsules had been administered (T2), and 5 minutes after wake time the following morning (T3). Saliva was collected with Salivette devices (Sarstedt, Inc., Nümbrecht, Germany), and was then centrifuged and frozen immediately. A rapid high-performance liquid chromatographic (HPLC) method (Alkaysi et al., 1988) was used for the analysis of caffeine in saliva. The HPLC system consisted of a Spectra SYSTEM pump and a spectra SYSTEM UV detector (Thermoseparation Products Inc., Fermont, CA, USA). An Ultrasphere (5 µm) column (250 × 4.6 mm; Beckman) was used for the separation. The mobile phase was made of 0.05 M ammonium acetate buffer:acetonitrile:methanol (82:15:3, v/v). The flow rate was set at 1 mL/min and the injection volume was set at 50 µL. The detection wave length was 254 nm. The concentrations of caffeine solution used for the standard curves were 0.5, 0.25, 0.125, 0.1 and 0.05 µg/mL. Standard curves were constructed by plotting concentration versus area under the curve. The retention time of caffeine was 5 minutes. The limit detection was 0.024 µg/mL. The intra- and inter-assay coefficients of variation were below 7%.
Polysomnographic recording
Electroencephalographic (EEG) electrodes were placed according to the international 10–20 system, using a referential montage with linked ears, chin, and leg EMG and left and right electrooculography. A Grass Model 15 Neurodata Amplifier System with 15A54 amplifiers (10,000 gain, 0.3–100 Hz bandpass, -6 dB; Astromed, West Warwick, RI, USA) was used, and signals were digitized at a sampling rate of 256 Hz by a National Instruments PCI6033E card and recorded using commercial software (Harmonie 5.1, Stellate Systems, Montréal, Québec, Canada). Sleep stages were visually scored on a computer screen (Harmonie, Stellate Systems, Montréal, Québec, Canada) according to standard criteria (Rechtschaffen and Kales, 1968) that were modified according to scoring based on 20 s epochs. EMG artefacts were detected automatically and rejected prior to analysis (Brunner et al., 1996). Further artefacts were also eliminated by visual detection. Epochs containing artefacts were considered as missing data to preserve sleep continuity. The following sleep variables were calculated from lights off to lights on: sleep latency, the percentages (relative values) and number of minutes (absolute values) spent in stage 1 sleep, stage 2 sleep, SWS (i.e. stage 3 and stage 4 sleep combined) and REM sleep, total sleep duration and sleep efficiency (calculated as total sleep duration divided by the duration of the period between sleep onset and lights off). Power spectral analysis was performed on C3 during non-REM sleep with a commercial software package (Sensa, Stellate Systems, Montréal, Canada), which computes fast Fourier transforms on 4 s epochs with a cosine window tapering and a spectral resolution of 0.25 Hz. Five 4 s spectral epochs were averaged to maintain correspondence with the 20 s sleep scoring windows. Analyses were performed per 1 Hz frequency bin ranging from 1.0 to 32 Hz. Analyses between 0.5 and 1 Hz were also performed.
Statistical analyses
Shapiro–Wilk tests were used to assess normality in all data sets.
Sample characteristics
A two-way analysis of variance (ANOVA) with two independent factors (two age groups: young or middle-aged, and two doses: 200 mg or 400 mg) was performed on BMI. Three-way ANOVAs with two independent factors (two age groups: young or middle-aged, and two doses: 200 mg or 400 mg) and one repeated measure (two conditions: caffeine and placebo) were performed on habitual sleep duration, habitual bedtimes and wake times, and mean caffeine consumption prior to each sleep recording. Mean daily caffeine consumption was log transformed to improve normality. BMI and habitual sleep schedule data were missing for two participants. Daily caffeine consumption data were missing for one middle-aged woman in the 200 mg dose group and one middle-aged man in the 400 mg dose group.
Caffeine concentrations
In order to assess the effects of age, dose, condition and moment while limiting the analyses to a maximum of three factors, analyses on salivary caffeine concentrations were conducted in two steps. Firstly, three-way ANOVAs with one independent factor (two age groups: young or middle-aged) and two repeated measures (two conditions: placebo and caffeine, three sampling times: T1, T2 and T3) were performed on salivary caffeine concentrations for each dose (200 mg and 400 mg) separately. Secondly, since there was no significant age effect or interaction with age for any of the two doses, the two age groups were combined and a three-way ANOVA with one independent factor (two doses: 200 mg or 400 mg) and two repeated measures (two conditions: placebo and caffeine, three sampling times: T1, T2 and T3) was performed. To decompose significant triple interactions, doses (200 mg and 400 mg) by condition (placebo and caffeine) interactions were assessed by contrast analyses for each sampling time (T1, T2 and T3) separately. Significant age by condition interactions were decomposed using contrast analyses comparing the placebo and caffeine conditions separately for each sampling time.
For all salivary caffeine data sets, participants were excluded from the analyses if half or more of their data points were missing. This was the case for four participants from the high dose group (three young and one middle-aged participant). For participants who had fewer than half of data points missing, missing data were replaced using the Yates technique (Yates, 1933). This was the case for two young and two middle-aged participants from the low dose group (two of six caffeine concentrations for three participants and one of six for one participant). To improve normality, salivary caffeine concentrations were square root transformed.
Polysomnographic variables and quantitative sleep EEG
Three-way ANOVAs with two independent factors (two age groups: young or middle-aged, and two doses: 200 mg or 400 mg) and one repeated measure (two conditions: caffeine and placebo) were performed on polysomnographic variables and spectral power in each frequency bin. To decompose significant triple interactions, age group (young and middle-aged) × condition (placebo and caffeine) interactions were assessed by contrast analyses for each dose (200 mg and 400 mg) separately. Significant dose × condition interactions were decomposed using contrast analyses comparing the placebo and caffeine conditions separately for each dose. Significant age × condition interactions were decomposed using contrast analyses comparing the placebo and caffeine conditions separately for each age group. Sleep latency, the number of minutes and percentages of each sleep stage, and spectral power for each frequency band were log transformed to improve normality. A Bonferroni correction was used for the analyses on spectral power in the 31 frequency bins, yielding an alpha of 0.001.
Results
Sample characteristics
BMI, habitual sleep schedule and habitual caffeine intake are reported in Table 1. No significant interaction between age, condition and dose, or main effect for any of these factors was found for mean habitual caffeine consumption or habitual bedtime. Habitual wake time occurred significantly earlier in middle-aged compared to younger adults. The middle-aged group had a significantly higher BMI than the young group (F(1,41) = 8.4, p = 0.006), but there was no significant difference between dose groups or interaction between dose and age groups.
Sample characteristics.
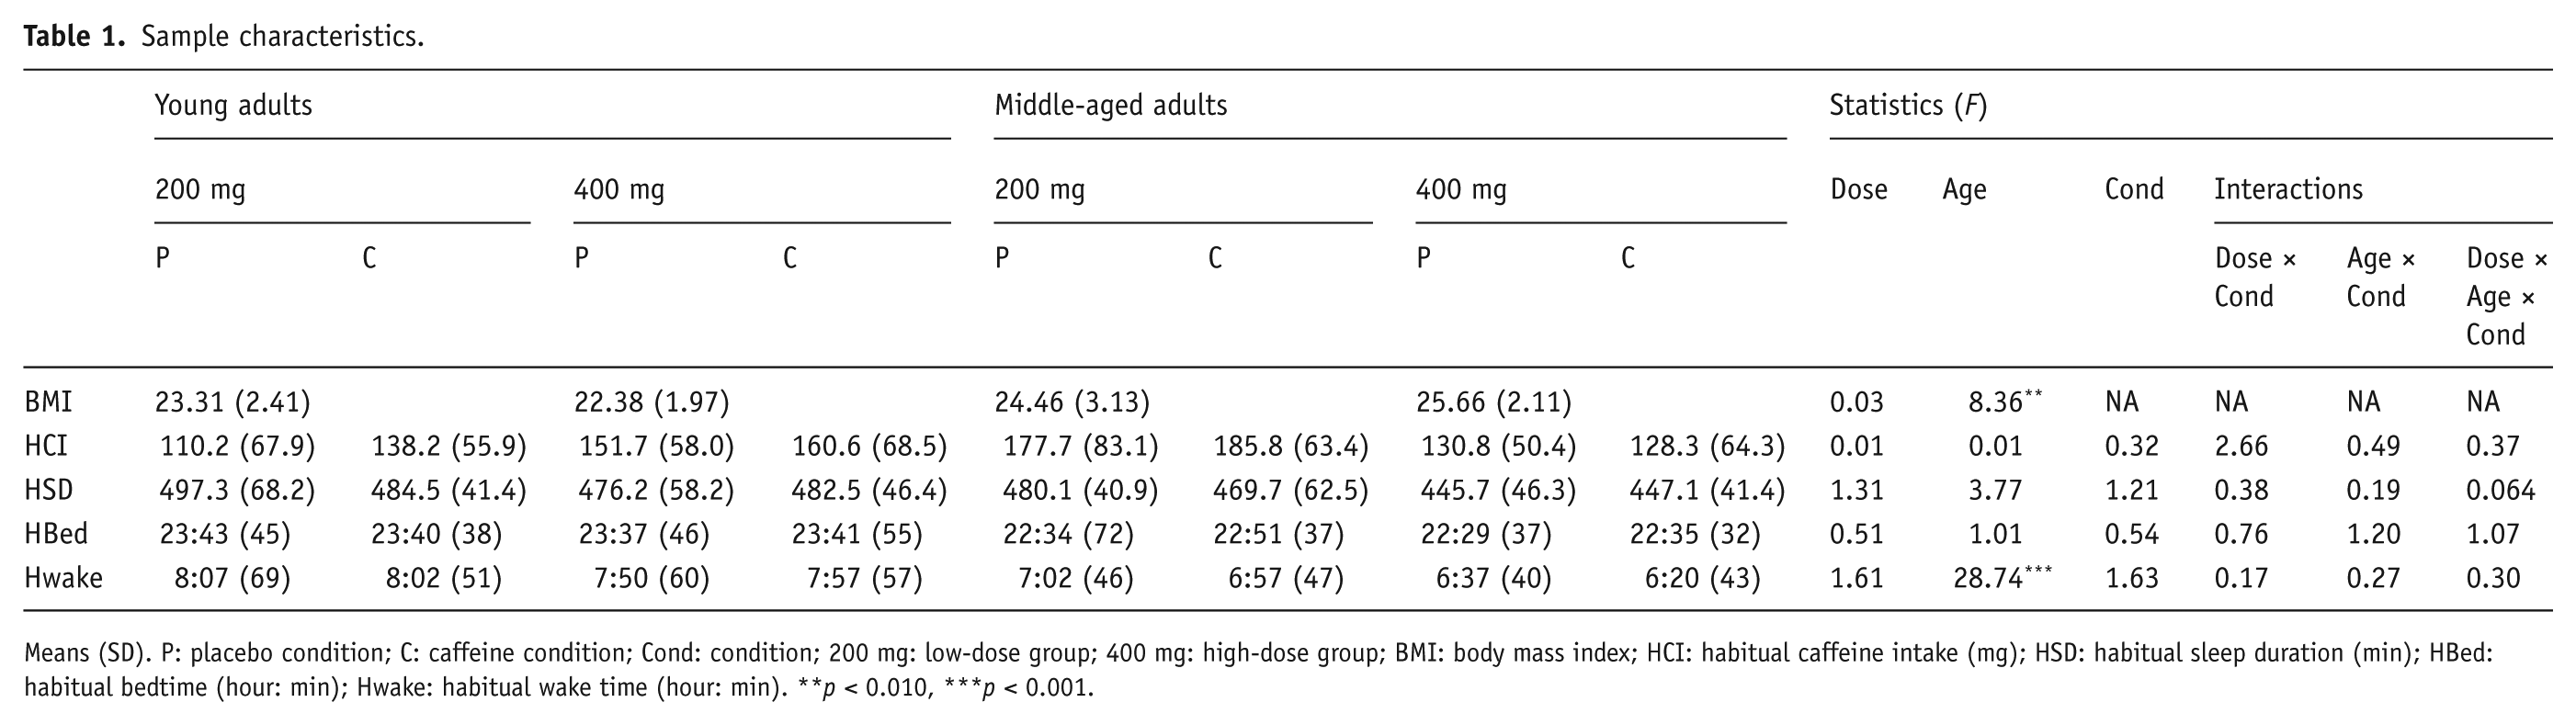
Means (SD). P: placebo condition; C: caffeine condition; Cond: condition; 200 mg: low-dose group; 400 mg: high-dose group; BMI: body mass index; HCI: habitual caffeine intake (mg); HSD: habitual sleep duration (min); HBed: habitual bedtime (hour: min); Hwake: habitual wake time (hour: min). **p < 0.010, ***p < 0.001.
Salivary caffeine concentration
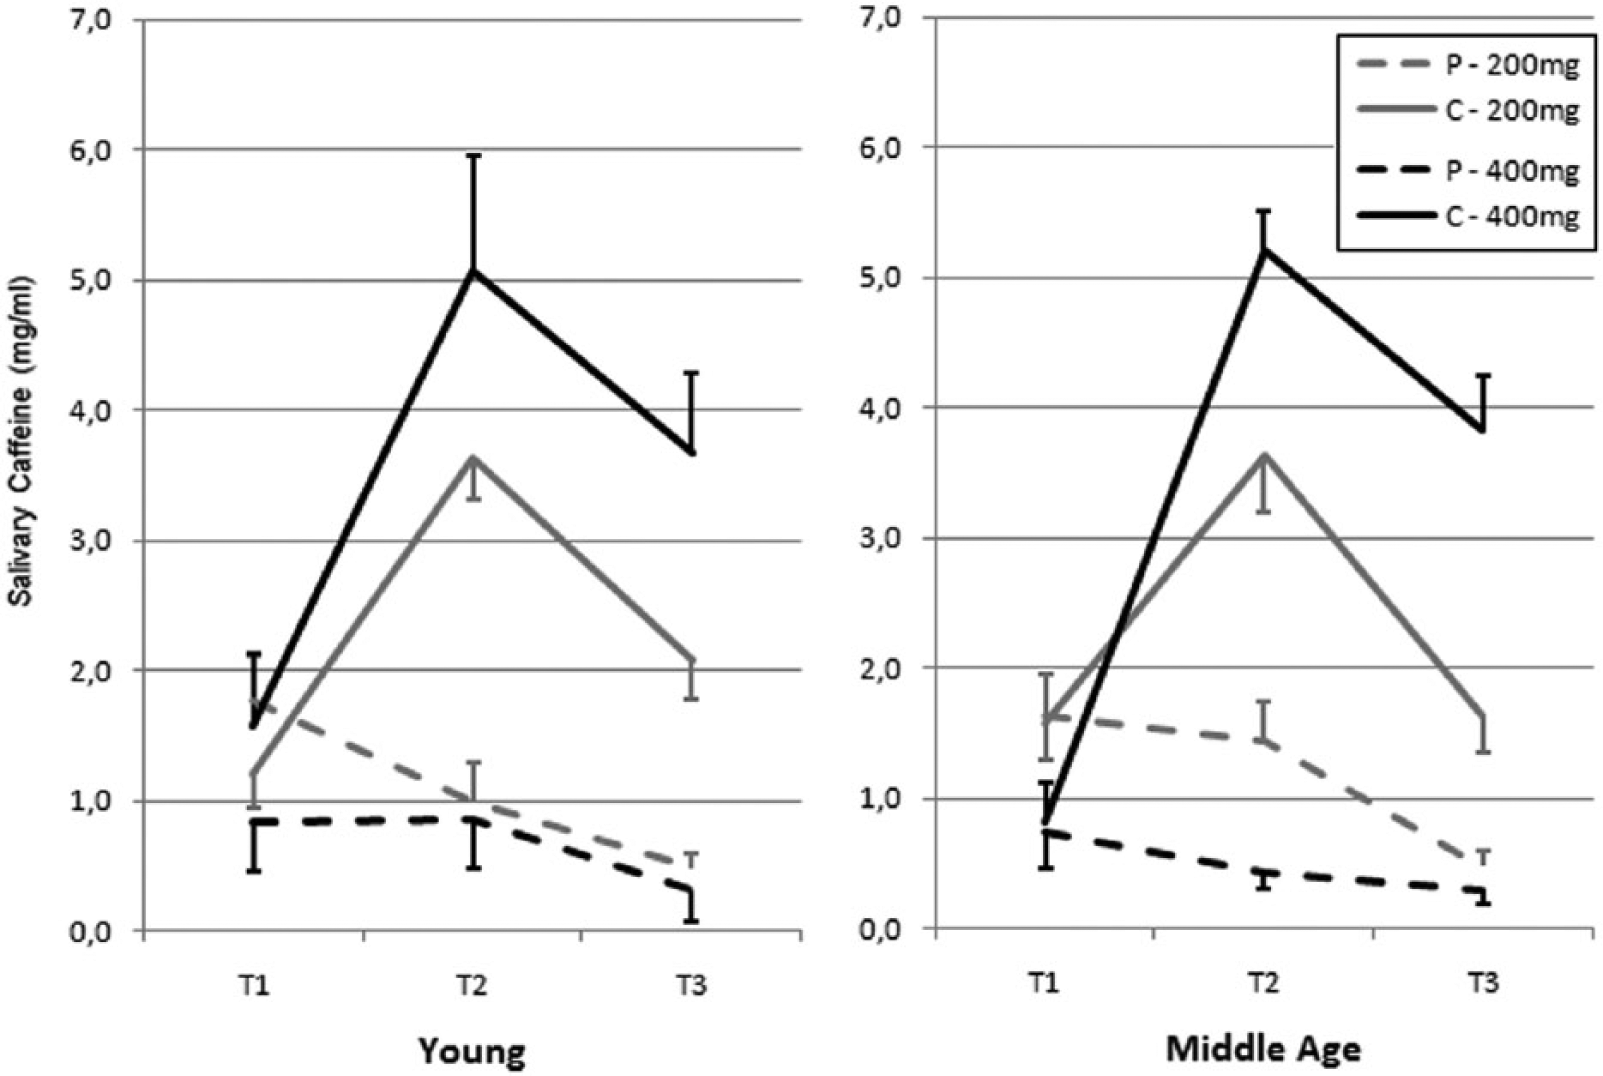
Figure 1 presents caffeine concentrations in the young and middle-aged groups for the three sampling times in the caffeine and placebo conditions for the 200 mg and 400 mg doses.
Salivary caffeine concentration.
Three-way ANOVAs comparing salivary caffeine concentrations between age groups, conditions and sampling times for each dose separately showed significant condition × sampling time interactions for the 200 mg dose (F(2,48) > 41.0, p < 0.001) and the 400 mg dose (F(2,30) > 76.1, p < 0.001; see Figure 1). For both doses, contrast analyses revealed no significant difference in caffeine levels between the placebo and caffeine conditions at T1, but significantly higher caffeine levels in the caffeine condition compared to the placebo condition at T2 and T3 (all p < 0.001). There was no significant age effect or interaction involving age for any of the two doses.
Three-way ANOVAs assessing the effects of sampling time, dose and condition on caffeine concentrations for the two age groups pooled together revealed a significant triple interaction (F(2,82) = 6.4, p = 0.003). A dose effect at T1 showed that caffeine concentrations were lower in the high compared to the low dose group (F(1,41) = 5.5, p = 0.025). Significant interactions between dose and condition were found at T2 (F(1,41) = 22.7, p < 0.001) and T3 (F(1,41) = 32.5, p < 0.001). At T2 and T3, caffeine concentrations were significantly higher in the caffeine condition compared to the placebo condition in both the low (p < 0.001 at both time points) and high (p < 0.001 at both time points) dose groups. The magnitude of the difference between the placebo and the caffeine condition was nearly twice as large with the higher dose compared to the lower dose at both T2 and T3.
Polysomnographic variables
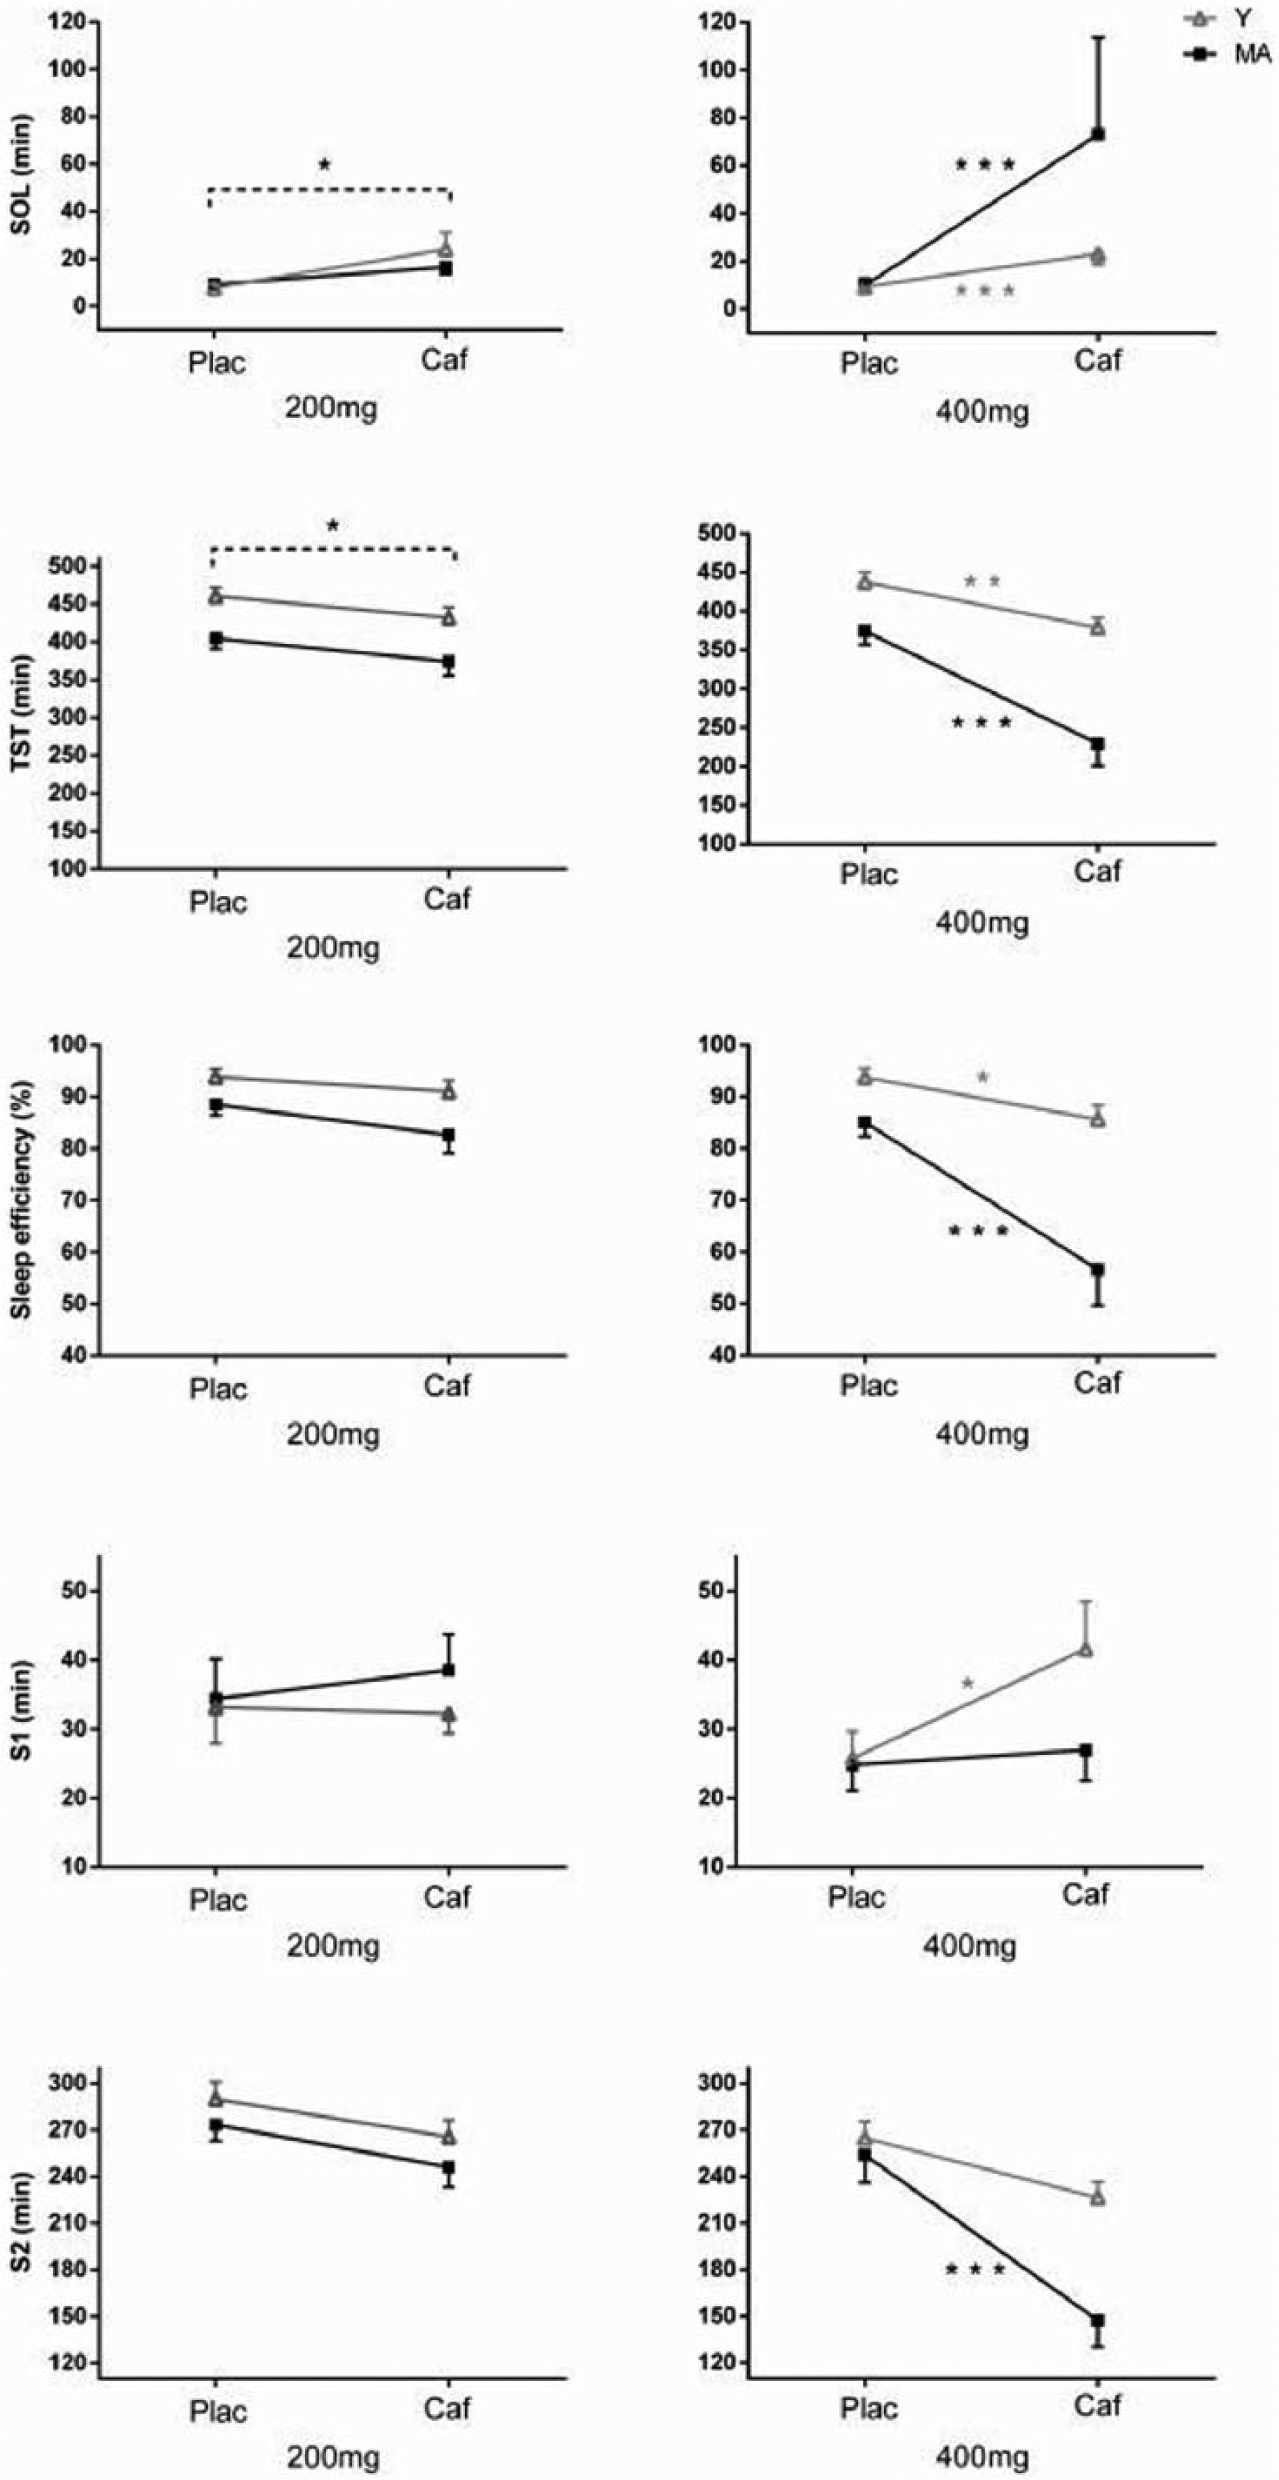
Table 2 presents means and standard deviations for polysomnographic variables. Significant interactions between age, dose and condition were found for sleep latency (F(1,43) = 5.5, p = 0.023), total sleep time (F(1,43) = 5.5, p = 0.024), sleep efficiency (F(1,43) = 5.7, p = 0.021), absolute stage 1 sleep (F(1,43) = 4.8, p = 0.034) and absolute stage 2 sleep (F(1,43) = 4.8, p = 0.033; see Figure 2). In the low dose group, there was no significant interaction between condition and age, but, compared to placebo, caffeine increased sleep latency and shortened total sleep time (condition effects: F(1,43) > 6.0, p < 0.020 in all cases) and tended to reduced sleep efficiency (condition trend: F(1,43) = 3.3, p = 0.078). In the high dose group, condition × age interactions were found for sleep latency (F(1,43) = 4.1, p = 0.049), total sleep time (F(1,43) = 10.4, p = 0.003), sleep efficiency (F(1,43) = 14.3, p < 0.001), absolute stage 1 sleep (F(1,43) = 5.4, p = 0.024) and absolute stage 2 sleep (F(1,43) = 9.6, p = 0.003). These condition × age interactions showed that: (a) caffeine significantly increased sleep latency, shortened total sleep time and reduced sleep efficiency compared to placebo in both age groups, but these effects were more pronounced in the middle-aged group (all p < 0.001) than in the young adult group (all p < 0.043); (b) caffeine significantly increased absolute stage 1 sleep in young (p = 0.002) but not middle-aged (p = 0.875) adults; and (c) caffeine significantly decreased absolute stage 2 sleep in middle-aged (p < 0.001) but not young (p = 0.097) adults.
Sleep variables across conditions, doses and age groups.
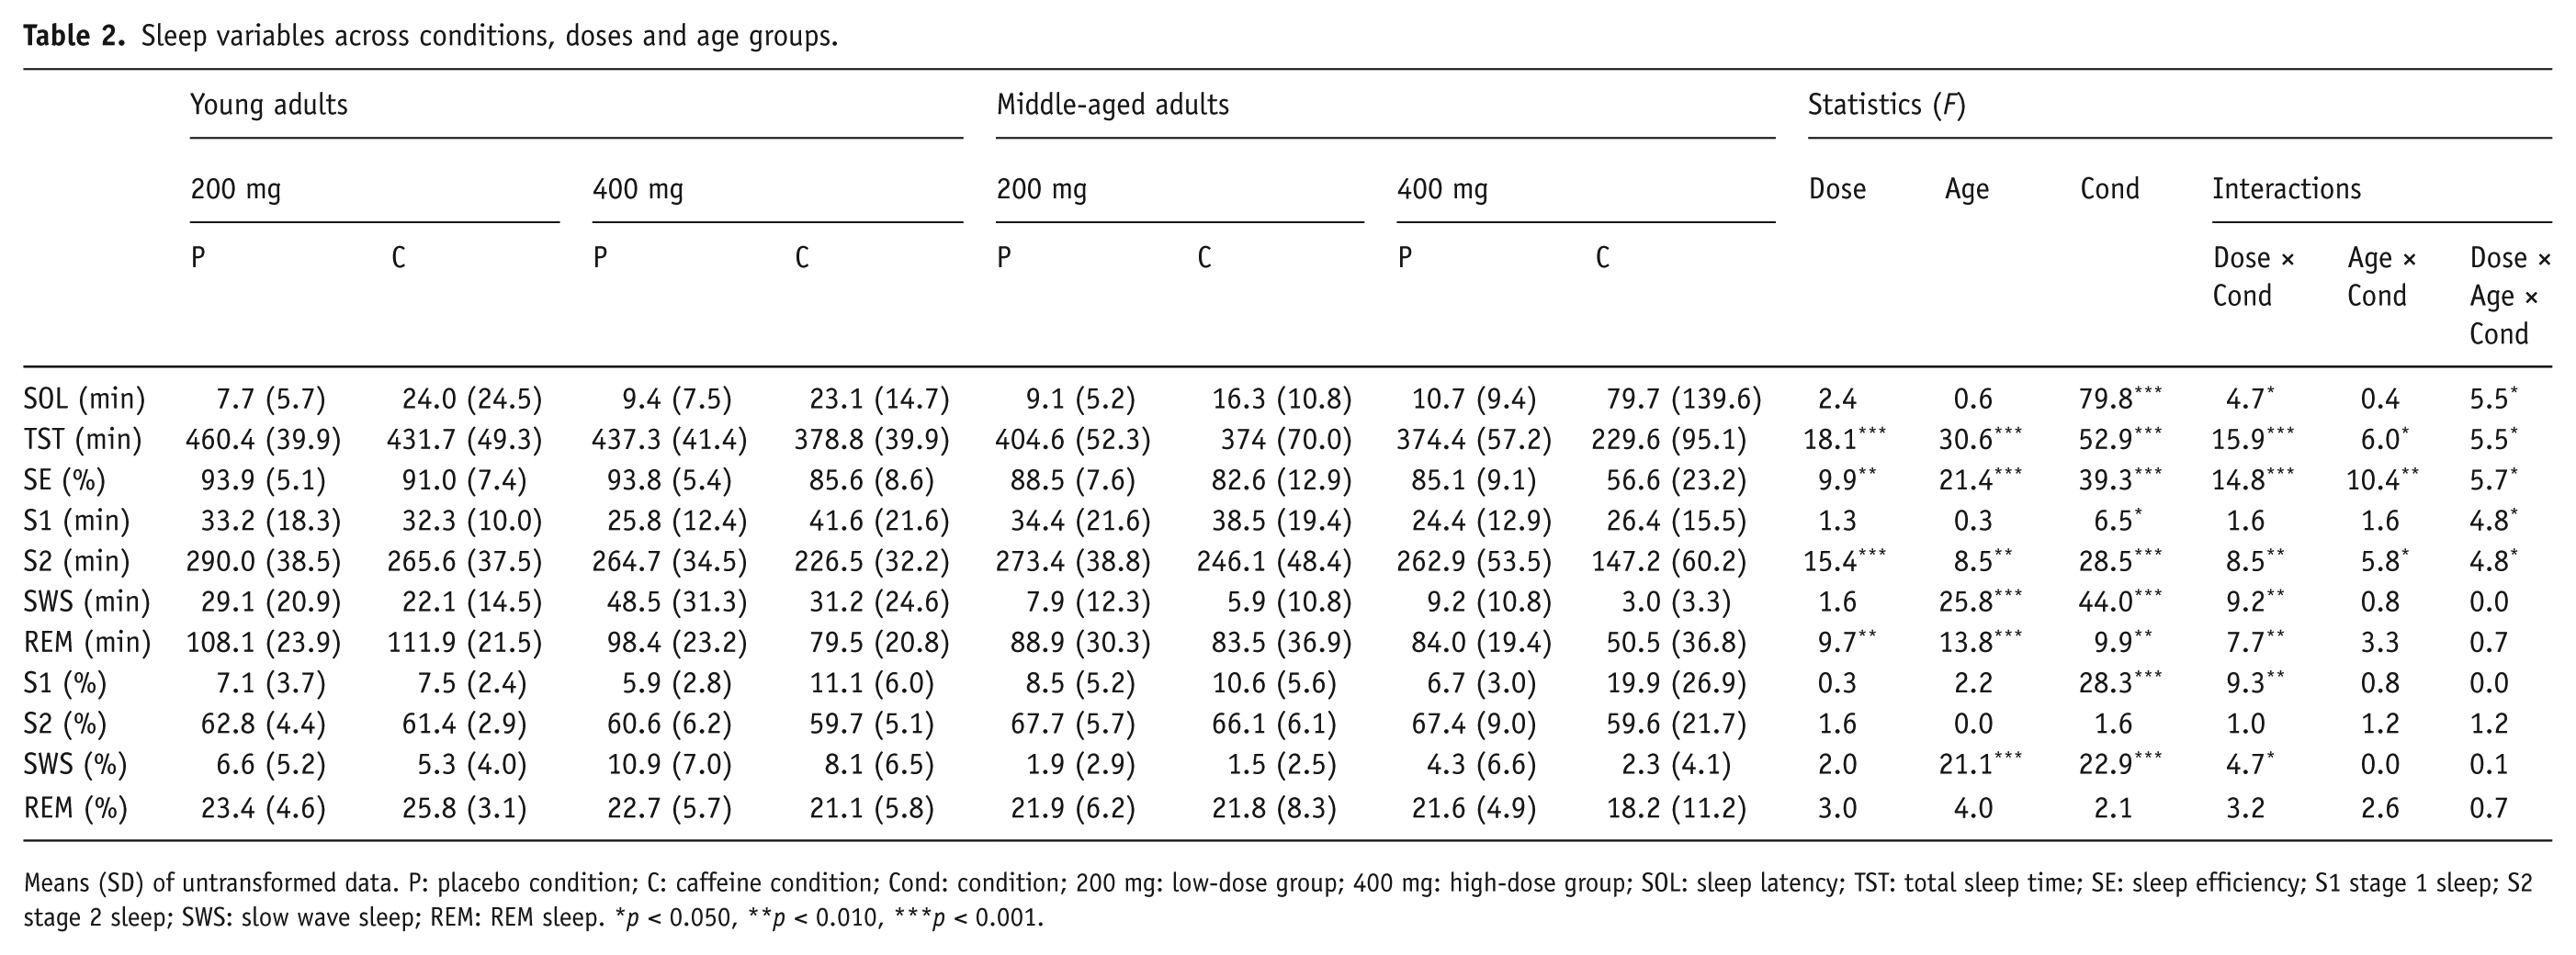
Means (SD) of untransformed data. P: placebo condition; C: caffeine condition; Cond: condition; 200 mg: low-dose group; 400 mg: high-dose group; SOL: sleep latency; TST: total sleep time; SE: sleep efficiency; S1 stage 1 sleep; S2 stage 2 sleep; SWS: slow wave sleep; REM: REM sleep. *p < 0.050, **p < 0.010, ***p < 0.001.
Significant interactions between age, dose and condition.
Significant dose × condition interactions (Figure 3) were found for relative stage 1 sleep (F(1,43) = 9.3, p = 0.004), absolute and relative SWS (F(1,43) > 4.7, p < 0.036) and absolute REM sleep (F(1,43) = 7.8, p < 0.008). Caffeine significantly increased relative stage 1 sleep in the high dose group (p < 0.001) but not in the low dose group (p = 0.096). Caffeine decreased absolute and relative SWS compared to placebo, and these effects were more pronounced in the high dose group (both p < 0.001) than in the low dose group (p = 0.010 and 0.057 for absolute and relative SWS, respectively). Compared to placebo, caffeine significantly reduced absolute REM sleep in the high dose group (p < 0.001) but not in the low dose group (p > 0.785).
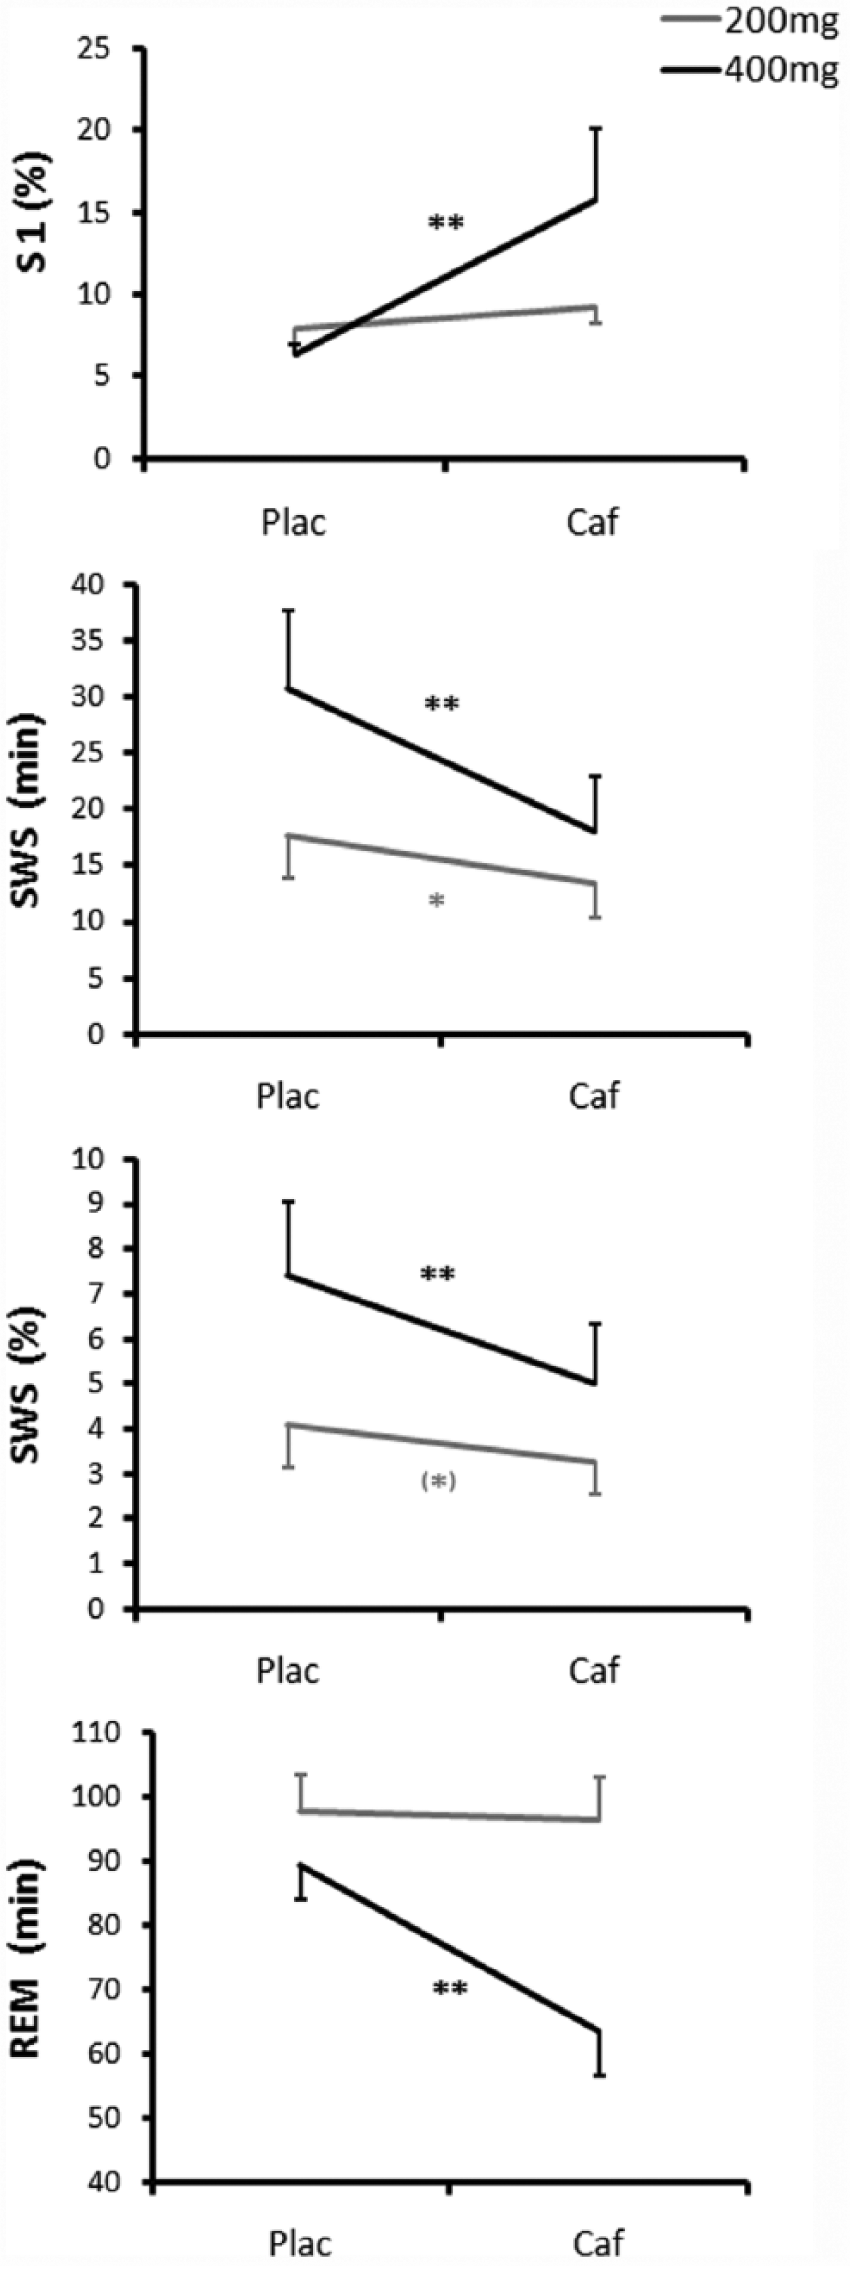
Dose × condition interactions.
The middle-aged group had less absolute and relative SWS and less absolute REM sleep than the younger group (age effects: F(1,43) > 13.8, p < 0.001 in all cases).
Quantified EEG
Compared to placebo, caffeine reduced spectral power in the 0.5 Hz frequency bin, and increased spectral power in frequency bins between 14 and 19 Hz and between 27 and 32 Hz (condition effects: F(1,42)
Discussion
Compared to that of the young, the sleep of older adults was generally more sensitive to the effects of a higher dose of caffeine. The effects of 200 mg of caffeine were similar across both age groups, but the 400 mg dose of caffeine increased sleep latency, shortened total sleep time and the absolute amount of stage 2 sleep, and reduced sleep efficiency more extensively in older compared to younger adults. However, the 400 mg dose of caffeine enhanced stage 1 sleep in the young group only. This last result suggests that the 400 mg dose caffeine induced mostly wakefulness in the older subjects, whereas it promoted stage 1 sleep in young subjects.
Importantly, it is unlikely that the age-related higher sensitivity to caffeine observed in this study resulted from metabolic differences. Across sampling times and conditions, salivary caffeine concentrations were similar between the two age groups. These findings are consistent with previous results from our group and others which showed similar effects of a lower dose (200 mg) of caffeine on salivary caffeine concentration in young and in older adults (Carrier et al., 2009; Drapeau et al., 2006; Landolt et al., 2012).
The physiological mechanisms underlying the interactions between age and caffeine dosage remain to be determined. This is even more challenging considering a previous study, which showed reduced caffeine effects with age on waking EEG and alertness measures during acute sleep deprivation (Landolt et al., 2012). In this previous study, the older group was older than the current study’s middle-aged participants. Yet, considering the progressive nature of the effects of aging on sleep and wake systems, it appears unlikely that the discrepancies in these findings would be attributable to age differences. While some of the underlying mechanisms regulating the effects of caffeine on vigilance and sleep may differ, the effects of caffeine on arousal and sleep operate notably via the blockade of adenosine A1 and A2a receptors (Fisone et al., 2004; Fredholm et al., 1999; Huang et al., 2005; Retey et al., 2007; Van Dort et al., 2009). Both animal and human studies have highlighted age-related changes in the adenosinergic system, including reduced A1 and enhanced A2a receptor binding, increased adenosine-forming enzymes, and higher adenosine concentration especially in brain areas involved in sleep–wake regulation (Cunha et al., 1995; Mackiewicz et al., 2006; Meerlo et al., 2004; Meyer et al., 2007; Murillo-Rodriguez et al., 2004; Pazzagli et al., 1995). Some authors have suggested that a reduced sensitivity of adenosine receptors may underlie the age-related reduction in SWS, lower vulnerability to sleep loss and shallower effects of caffeine on nighttime vigilance (Landolt et al., 2012). The present results showing enhanced sensitivity of older adults to the detrimental effects of caffeine on sleep calls for other mechanisms, which still need to be determined. Considering the inhibitory/stimulatory influence of A1/A2 receptors and the age-related changes in the balance between these two types of receptors, it is possible that a complex interaction between age and dosage modulates adenosinergic activity. For instance, the release of excitatory amino acids in the striatum is increased by a low dose of an adenosine antagonist (mostly binding to A1 receptors) in young but not older rats, and is reduced by a higher dose of the same adenosine antagonist (presumably affecting both A1 and A2 receptors) in older, but not younger, rats (Corsi et al., 1997). Furthermore, previous research has shown that older adults are more sensitive to sleep–wake cycle challenges, including the daytime circadian waking signal and stress hormones (Carrier et al., 2009; Lafortune et al., 2012; Vgontzas et al., 2001). Higher caffeine doses (e.g. 500 mg) produce unpleasant effects including tension, nervousness, anxiety and restlessness (Kaplan et al., 1997), which can challenge one’s ability to sleep. Caffeine also induces other ‘wake-promoting’ physiological effects likely to interfere with sleep, including the suppression of melatonin concentration (Shilo et al., 2002; Wright et al., 1997) and the attenuation of the nighttime drop in core body temperature (Wright et al., 1997, 2000). Interestingly, in humans, only higher doses of caffeine seem to induce an increase in catecholamine, which may interfere more intensely with the sleep of older individuals (Kamimori et al., 2000). It is thus possible that, compared to younger individuals, older adults are more sensitive to a caffeine challenge inducing unpleasant or more prominent ‘wake-promoting’ physiological effects. Considering the progressive changes in sleep mechanisms from middle-aged to elder years, it could be postulated that this increased sensitivity to higher doses of caffeine may be further enhanced across senescence.
In line with previous findings (Hindmarch et al., 2000; Karacan et al., 1976; Nicholson and Stone, 1980), our results indicate that the shortening, fragmentation and shallowing of sleep induced by caffeine are dose dependent. Compared to the low dose (200 mg), the high dose (400 mg) of caffeine further prolonged sleep latency, increased the proportion of stage 1 sleep, and decreased total sleep time, sleep efficiency and the amounts of SWS and REM sleep. In fact, compared to those who received 200 mg of caffeine, participants who had the 400 mg dose of caffeine took more than twice as long to fall asleep, subsequently woke up for almost twice as long during the night, and their sleep duration was shortened by about 1.5 hours. While the two doses of caffeine induced similar decreases in SWA, the suppression of SWS induced by caffeine was significantly more pronounced with the higher dose. SWA and SWS are considered to be markers of the homeostatic process and are known to be modulated by adenosine. Despite the absence of a dose × condition interaction for SWA, the progressive inhibitory effects of increasing doses of caffeine on SWS appear to be consistent with the postulated ability of caffeine to alleviate homeostatic sleep pressure via the dose-dependent blockade of adenosine receptors (Landolt, 2008). In accordance with previous findings, the higher dose of caffeine also reduced the absolute amount of REM sleep. However, no significant effect was found for the relative amount of REM sleep, suggesting that the reduction in absolute REM sleep may be driven by the reduction in total sleep time.
Some methodological limitations inherent to the present study should be noted. Although all participants completed the placebo and caffeine conditions, the low and high doses were administered to two distinct groups of participants. While the demographic characteristics of these two groups were carefully matched, the possibility that random inter-individual differences contributed to some of the dose differences cannot be ruled out. In line with normal age-related changes in weight, the mean BMI was higher in the middle-aged than the younger adults. However, since higher BMI is linked to lower sensitivity to the effects of caffeine, this difference cannot explain the present finding of a stronger sensitivity of the middle-aged group to high doses of caffeine. The sample size was relatively small; although statistical power was sufficient to verify the principal hypotheses concerning interactions between age, conditions and dosage for sleep latency, total sleep time and sleep efficiency, statistical power may have been too low to detect interactions for other variables. Nevertheless, the magnitude of the interactions on these variables was very low. For instance, power analyses suggest that, with an alpha of 0.05, 340 and 1700 participants would have been required to have an 80% chance of detecting triple interactions on absolute and relative SWS, respectively.
The current findings confirm the dose modulation of the response of sleep to caffeine in humans. The sleep of middle-aged individuals was generally more sensitive to increasing doses of caffeine than that of younger adults. This is especially relevant considering age-related alterations in sleep and the elevated caffeine intake reported by epidemiological studies in older populations.
Footnotes
Acknowledgements
The authors wish to thank Sonia Frenette and Jean Paquet for their contribution to this work.
Declaration of Conflicting Interests
The authors declared no potential conflicts of interest with respect to the research, authorship, and/or publication of this article.
Funding
The authors disclosed receipt of the following financial support for the research, authorship, and/or publication of this article: This work was supported by the Natural Sciences and Research Council of Canada (NSERC to JC) and the Fonds de recherche du Québec – Santé (FRQS scholarships to RR, MB and JC).