
Abstract
Olanzapine, an antipsychotic agent mainly used for treating schizophrenia, is frequently associated with body weight gain and diabetes mellitus. Nonetheless, studies have shown that not every individual is equally susceptible to olanzapine’s weight-gaining effect. Therefore, Roman high and low avoidance rat strains were examined on their responsiveness to olanzapine treatment. The Roman high avoidance rat shares many behavioral and physiological characteristics with human schizophrenia, such as increased central dopaminergic sensitivity, whereas the Roman low avoidance rat has been shown to be prone to diet-induced obesity and insulin resistance. The data revealed that only the Roman high avoidance rats are susceptible to olanzapine-induced weight gain and attenuated glucose tolerance. Here it is suggested that the specific olanzapine-induced weight gain in Roman high avoidance rats could be related to augmented dopaminergic sensitivity at baseline through increased expression of prefrontal cortex dopamine receptor D1 mRNA and nucleus accumbens dopamine receptor D2 mRNA expression. Regression analyses revealed that olanzapine-induced weight gain in the Roman high avoidance rat is above all related to increased prolactin levels, whereas changes in glucose homeostasis is best explained by differences in central dopaminergic receptor expressions between strains and treatment. Our data indicates that individual differences in dopaminergic receptor expression in the cortico-mesolimbic system are related to susceptibility to olanzapine-induced weight gain.
Introduction
During the last decades, tremendous advancements have been made in understanding the neurobiology of psychogenetic diseases, in part by using animal models reflecting disease etiology and/or disease end-points (Degen et al., 2005; Ellenbroek et al., 1995). The Roman high and low avoidance (RHA/RLA) rat strains, for instance, have been instrumental in unraveling neuronal pathways underlying certain behaviors reflected in schizophrenia (Río et al., 2014). Despite the fact that the selection of these strains is based on high or low active avoidance performance in a shuttle-box, the two selection strains are additionally characterized by several behavioral differences. Compared to the RLA, the RHA rats show reduced prepulse-inhibition (Oliveras et al., 2015), lower emotional reactivity (Corda et al., 1997; Steimer et al., 1997), higher amphetamine and apomorphine-induced stereotypic behavior (D’Angio et al., 1988; Driscoll et al., 1986) and differences in central nervous system monoaminergic pathways render the RHA more prone to develop addiction like behavior (D’Angio et al., 1988; Driscoll et al., 1980; Giorgi et al., 1994; Steimer and Driscoll, 2003). Furthermore, the RHA and RLA strains differ in metabolic characteristics, with the RLA being more sensitive under sedentary conditions for the development of medium/high fat diet-induced obesity (DIO) and related disturbances in glucose homeostasis compared to the RHA (Boersma et al., 2009). However, when allowed access to a running wheel, RLA rats are able to maintain energy balance and glucose homeostasis by increasing running wheel activity in direct relation to increased caloric intake (Boersma et al., 2011). The RHA rats, on the other hand, are less prone to DIO and do not have to maintain their glucose homeostasis by means of running wheel activity (i.e. which is in fact consistent with the idea that schizophrenic patients are more sedentary than healthy subjects (McNamee et al., 2013). These characteristics of RHA and RLA rats render these animals not only of interest in studying the underlying neurobiology of schizophrenia, but also for studying some of the known behavioral and metabolic side effects of antipsychotic drug treatment on body weight regulation, food intake, locomotor activity, and glucose homeostasis.
One of the most widely used antipsychotic drugs is the second-generation antipsychotic olanzapine (OLZ). Compared to the first-generation specific dopamine antagonistic antipsychotics, OLZ exhibits improved mood-stabilizing properties and limiting of extrapyramidal side effects (e.g. tardive dyskinesia, akinesia, and akathisia (Johnsen et al., 2010; Suzuki et al., 2011). These effects result from the atypical character of OLZ, antagonizing predominantly dopamine (D) and serotonin (5-HT) receptors and to a lesser extent muscarinic, histaminergic, and α-adrenergic receptors (Bymaster et al., 1996a,b). During the past decades OLZ has become notorious for inducing severe weight gain (Cordes et al., 2014; Millen et al., 2011; Tsuneyama et al., 2016). However, OLZ-induced weight gain is not equal among individuals: Kinon et al. (2005) observed among 1336 patients included in their survey that 15% displayed severe weight gain during the first six weeks of treatment (≥7% body weight gain). The remaining 85% showed slower weight gain or no weight gain during OLZ treatment (Kinon et al., 2005), suggesting a large individual difference in weight-gain susceptibility to OLZ treatment. Interestingly, the authors noted that individuals showing severe weight gain responded better to OLZ’s potency to reduce the positive symptoms of schizophrenia (e.g. delusions, and hallucinations). Kinon and colleagues concluded that “antipsychotic drug-induced weight gain may reflect a complex interplay among environmental factors, a patient’s psychiatric history and genetic predisposition, and the receptor binding profile of the antipsychotic drug” (Kinon et al., 2005). Indeed, changes in ingestive and locomotor components of energy balance (Evers et al., 2010; van der Zwaal et al., 2010, 2012), as well as alterations in neuroendocrine axes (Evers et al., 2016) have been suggested to play a role in OLZ-induced weight gain.
In the present study, the aim was to investigate OLZ’s effect on total body weight, body composition, food intake, locomotor activity, glucose homeostasis and endocrine profiling in rats of both the RHA and RLA strain. The study is performed in female rats, because only female rats tend to increase weight gain on OLZ (Cooper et al., 2005, 2007), a phenomenon that has been observed in humans as well (Bobes et al., 2003), but is not as clear as in rodents. OLZ is known to markedly attenuate locomotor activity in humans (Gothelf et al., 2002) and rats (Evers et al., 2010; Hillebrand et al., 2005), therefore it was first hypothesized that OLZ-induced metabolic disturbances would occur particularly in the RLA strain, since this strain needs locomotor activity to maintain glucose homeostasis on a palatable diet. On the other hand, based on higher baseline turnover rates of D in the caudate nucleus (Driscoll et al., 1986) and more intense stereotypy in response to the D receptor agonist apomorphine (Giménez-Llort et al., 2005) in RHA rats compared to the RLA rats, it was alternatively hypothesized that the RHA would be more susceptible to – and perhaps behaviorally and metabolically more affected by – OLZ treatment due to higher D and 5-HT receptor expression (Bymaster et al., 1996b; Giorgi et al., 2004; Guitart-Masip et al., 2006b; Klein et al., 2014). Moreover, pharmacogenomic studies highlight the role of both dopaminergic and serotonergic receptor gene variants in the stimulatory effects of olanzapine on weight gain (Houston et al., 2010; Laika et al., 2010). Therefore, a further assessment on central D and 5-HT receptor mRNA expression in the cortico-mesolimbic system was performed to examine if those neurobiological circuits known to be different in schizophrenic patients compared to controls (Cons) (Abi-Dargham et al., 2002) are related to the observed different metabolic responsiveness of the RHA and RLA strain to OLZ treatment.
Material and methods
Animals
All procedures were approved by the Animal Experimentation Committee of the University of Groningen, The Netherlands.
RHA/RLA breeding pairs were obtained from the breeding colony of the Clinical Psychopharmacology Unit (APSI; University of Geneva, Switzerland), and bred locally at the animal facility of the University of Groningen. Breeding pairs were characterized for avoidance behavior at arrival and female offspring was kindly provided by CM Coppens (Department of Behavioral Neurosciences, Rijksuniversiteit Groningen, The Netherlands; Coppens et al., 2013). To avoid a litter effect, animals from each litter were divided equally over the experimental groups.
Animals had ad lib access to water and standard chow (3.8 kcal/g, 14% fat, RMB-H 2181, Arie Blok Diervoeding, Woerden, The Netherlands) and were individually housed in Nalgene polycarbonate running wheel (RW) cages (50×27×36 cm) filled with wood chip bedding, a gnawing stick, and had free access to a running wheel (diameter=27 cm; circumference=85 cm; Mini Mitter, Oregon, USA). Spontaneous RW activity was registered continuously during the experiment. Climate was controlled at 20±2°C, humidity 60±5%. Lights went off at 11:00 (circadian time (CT) 12) on a 12:12 h light-dark cycle. The group consisted of 12 RLA rats (257±3.2 g) and 12 RHA rats (255±3.8 g) that were split into a Con and OLZ-treated group (n=6) matched for body weight. At experimental day −1, all animals were put on a medium fat (MF) diet with lard (4.7 kcal/g; 45% fat, Arie Blok Diervoeding, Woerden, The Netherlands). This food paradigm was chosen to minimize possible effects of strain-dependent diet-induced obesity on drug responsiveness (Boersma et al., 2010). During this study the estrus cycle was not measured.
Drug and administration protocol
OLZ (powder) was kindly provided by Abbott (Fournier Laboratory, France). To obtain an administration of 2 mg/kg, OLZ was diluted in 0.9% NaCl saline, using 1M HCl, the final solution was adjusted to pH 6.5 using 1M NaOH and diluted to a concentration of 1 mg/mL OLZ. Animals were administered 2 mL/kg OLZ solution or saline twice a day at CT12 and CT18 via a permanent gastric catheter, drug doses were based on previous work (Cooper et al., 2005). Saline was administrated twice a day from day −7 to day 0, to habituate all animals to the administration protocol. To mimic human oral drug intake and to be able to administer weight dependent, the drug or placebo was administered via a permanent subcutaneously guided gastric catheter.
Surgical procedure
All surgical procedures were performed using isoflurane-O2/N2O gas-anesthesia. Animals were equipped with a permanent gastric catheter for intragastric drug administration. A silicon catheter (1.40 mm outside diameter (OD), 0.80 mm inside diameter (ID)) was inserted through the gastric wall at the level of the corpus, extending 0.5 cm into the gastric lumen.
Two silicon catheters (sampling cannula: 0.95 mm OD, 0.50 mm ID, infusion cannula: 0.64 mm OD, 0.28 mm ID) were inserted into the right and left jugular vein and kept in place with a ligature. Both catheters were pulled subcutaneously towards the head where they were connected to bent sleeves of surgical steel. These bent sleeves were fixed to the skull with dental cement and screws. To prevent the formation of blood clots, catheters were filled with a 55% polyvinyl pyrolidone-heparin (PVP) solution (Steffens, 1969). Both exteriorized jugular vein cannulas and gastric cannula were closed by plastic caps made of pieces of flame-sealed PE100 tubing. Post-surgery analgesia (0.1 mg/kg Finadyne diluted in 0.1 mL/kg saline subcutaneously) was administered 15 min before animals were taken off the inhalation anesthesia. Catheters were rinsed twice a week starting two days after surgery until the start of the experiment.
Experimental set-up
Body weight, food intake, and water intake were measured daily at CT12. From day −7 till day −1 all animals received 2 mL/kg saline intragastrically at CT12 and CT18; from day 0 till day 14 designated animals received 2 mL/kg OLZ while control animals continued on 2 mL/kg saline. A single blood sample (1 mL) was drawn at day −1 and day 7, and a final blood sample (trunk blood) was collected at day 14. All blood samples were collected in plastic tubes on ice containing per 1 mL whole blood 10 µL ethylenediaminetetraacetic acid EDTA; samples were centrifuged for 15 min, 2500 rpm at 4°C, and plasma was stored at −20°C until further analysis. At day 14, an intravenous glucose tolerance test (IV-GTT) was performed at CT12. Animals were sacrificed at CT16 on day 14; animals were placed in an isoflurane-filled chamber for sedation followed by decapitation. Trunk blood (±10 mL) was collected and brains were excised and frozen with liquid nitrogen and stored at −80°C for further analysis. Consecutively, parametrial, retroperitoneal, visceral, subcutaneous (skin), and brown adipose tissue; liver, kidneys, and adrenals were carefully excised and weighed. Carcass, skin and liver were dried in an oven at 80°C for five days. After drying, tissues were put in a petroleum-based Soxlet fat extractor to dissolve the remaining fat and dried for another 24 h. The dried tissues were weighed before and after fat extraction in order to measure the amount of fat content of each tissue.
IVGTT
An IVGTT was performed at day 14 at the start of the dark phase (CT12). Prior to the start of IVGTT, animals were fasted for four hours. During the fasting period and consecutive IVGTT the running wheel was removed from the cage. A baseline blood sample was drawn 60 min (t=−60) before starting of the intravenous glucose infusion (t=0). A single dose of 2 mg/kg OLZ was intragastrically administered immediately after the baseline blood sample was drawn. Blood samples (0.2 mL) were taken at time points −60, 0, 5, 10, 15, 20, 25, 30, 40, 60, and 120 min. Glucose (150 mg/mL) was infused via the infusion cannula starting at t=0 at a rate of 0.1 mL/min and terminated at I=30 min. Blood samples were immediately put on ice during IVGTT in vials containing 10 μL EDTA (0.09 g/mL). Whole blood samples of 50 µL diluted in 450 μL 2% heparin solution were stored at −20°C until analysis of glucose concentrations by the ferry-cyanide method (Hoffman, 1937) in a Technicon auto-analyzer. The remaining blood samples (150 μL) were centrifuged (15 min, 2500 rpm, 4°C) and plasma was collected and stored at −20°C until insulin determination. Plasma insulin levels were measured in duplicates using a commercial radioimmunoassay kit (Rat Insulin, 125I-Insulin Cat# RI-13K, Linco Reasearch, Nucli Lab, The Netherlands).
From the circulating glucose and insulin levels we determined the homeostatic model assessment (HOMA) of insulin action as the product of fasting baseline levels of circulating glucose and insulin divided by 22.5 (BasalGluc×BasalIns/22.5) (Matthews et al., 1985). Since our intravenous glucose infusion tests over 30 min delivered sustained elevated circulating glucose and insulin responses (as opposed to the ones after a single intravenous glucose injection, on the basis of which changes in the slopes of the declining circulating glucose and insulin several measures of glucose homeostasis and insulin action can be assessed (see Pacini et al., 2013), we chose to utilize the assessments of indices of insulin resistance and β-cell sensitivity that are frequently obtained from the oral glucose tolerance testing conditions (e.g. Cortez et al., 1991). Thus, insulin resistance index is calculated by the product of the area under the curves (AUCs) of the circulating glucose and insulin responses (AUCGluc×AUCIns) during the IVGTT, and β-cell sensitivity is calculated by the ratio of the area under the curves of the circulating insulin and glucose responses (AUCIns/AUCGlu) (Sugden and Holness, 2002). These indices deliver excellent surrogate markers from those that have for instance been obtained by hyperinsulinemic euglycemic clamps (Tran et al., 2003).
Plasma analysis
Circulating leptin, triglycerides (TGCs), free fatty acids (FFAs), corticosterone (Cort), and prolactin levels were determined in plasma samples collected at day −1 (baseline), day 7 (week 1), and day 14 (week 2), using a 125I-Rat Leptin RIA (#RL-83K, Linco Research, Nucli Lab, The Netherlands), L-type triglyceride M enzymatic kit (WAKO Chemicals GmbH, Germany), NEFA-HR2 enzymatic kit (WAKO Chemicals GmbH, Germany), ImmuChem Cort 125I-RIA KIT (MP Biomedicals, Germany GmbH, Eschwegge, Germany), and PRL 125I-RIA KIT (MP Biomedicals Germany GmbH, Eschwege, Germany).
Central gene expression
The prefrontal cortex (PFC), nucleus accumbens (NAc), and ventral tegmental area (VTA) were isolated from 500 μm thick frozen coronal sections using a Harris unicore tissue puncher (ID 0.75 mm and ID 1.20 mm; Ted Pella, Inc., Redding, California, USA) based on the coordinates for adult rat brains (Paxinos et al., 1985). mRNA expression on the following genes were measured using real time poly chain reaction (RT-PCR): the dopamine 1 receptor (Drd1), the dopamine 2 receptor (Drd2) in VTA, NAc, and PFC, the serotonin 1a receptor (5HT1A) in VTA and PFC, the serotonin 2a receptor (5HT2A), and the serotonin 2c receptor (5HT2C) in the PFC, and the dopamine transporter (DAT; Slc6a3), and tyrosine hydroxylase (TH) in the VTA. Total RNA from the tissue punches was obtained using the RNeasy Lipid Tissue Mini Kit with the Qiazol reagent (Qiagen, Valencia, California, USA). A QuantiTect Reverse Transcription Kit (Qiagen, Valencia, California, USA) was used to generate cDNA for subsequent quantitative real-time PCR. All reactions were carried out in triplicate using 1X Taqman master mix (Applied Biosystems, Foster City, California, USA), 1X Taqman probes for each gene (Drd1, Drd2, 5HT1A, 5HT2A, 5HT2C, TH, DAT and Actb) (Life technologies, Grand Island, New York, USA), and 1 μg of cDNA template in a total volume of 20 μL. Real-time reactions were performed with standard PCR conditions (50°C for 2 min; 95°C for 10 min; and 95°C for 15 s and 60°C for 1 min for 40 cycles) on an Applied Biosystems 7900HT Fast Real-Time PCR System. Each set of triplicates was checked to ensure that the threshold cycle (Ct) values were all within 1 Ct of each other. Negative RT samples were used to control for possible contamination of genomic DNA. To determine relative expression values, the −ΔΔCt method (Applied Biosystems, Foster City, California, USA) was used, where triplicate Ct values for each tissue sample were averaged and subtracted from those derived from the housekeeping gene β-actin (Actb). The average Ct difference for the RHA control group was subtracted from those of the test samples, and the resulting −ΔΔCt values were raised to a power of two to determine normalized relative expression.
Data analysis
All data are expressed as average±standard error of the mean (SEM). RW activity data were presented as absolute activity (revs/h) or analyzed as a change in percentage change of activity relative to baseline per individual. Baseline activity was calculated per individual as the average activity per day from day −7 until day −1. Body composition parameters were presented as absolute or analyzed as a percentage of total body weight at termination. Statistical analysis was performed using repeated measures analysis of variance (ANOVA) between subjects for time-dependent analysis. To calculate significance between groups one-way ANOVA (post-hoc Tukey honest significant difference (HSD)) was used. To measure Strain, Treatment, or interaction effects general linear model (GLM) repeated measures or univariate ANOVA was performed. Stepwise multiple linear regression modeling was performed (stepping method criteria; use probability of F: entry <0.05, removal >0.10), results were regarded significant when p<0.05 after Bonferroni correction (α<0.05/k, in which k is the amount of independent variables meeting the entry criteria (Curtin and Schulz, 1998; Mundfrom et al., 2006). All statistical analyses were performed in SPSS23 outcomes were regarded significant with a significance threshold of p<0.05.
Results
Body weight gain and food intake
OLZ only induced a relative body weight increase in the RHA and not in the RLA rats. Relative weight gain (Δbody weight (g)), as shown in Figure 1, was not affected by Strain, however, both a Treatment effect (F13,260=1.99, p<0.01) and a Strain*Treatment interaction were found (F13,260=2.32, p<0.01). Within strain analysis yielded a Treatment effect only within the RHA strain (F13,130=6.86, p<0.0001). No effect of OLZ on body weight change (ΔBW) was observed in the RLA strain. Of note is the jump in ΔBW in the RLA strain between day −1 and 0, this sudden increase is due to the switch from the chow diet to the MF diet (see Figure 1: arrowhead: F1,22=28.02, p<0.01, repeated measures ANOVA), which did not occur in the RHA strain and relates to the difference between strains and their response to a palatable diet (Boersma et al., 2010) but just as much how different coping styles respond to environmental changes (Pisula, 2003). Unlike the ΔBW, actual body weights after 14 days of treatment were not significantly different between groups or strains (RHA-Con=269±4.2 g, RHA-OLZ=277±7.5 g; RLA-Con=283±7.4, RLA-OLZ=279±7.7; Supplementary Material, Figure S1).
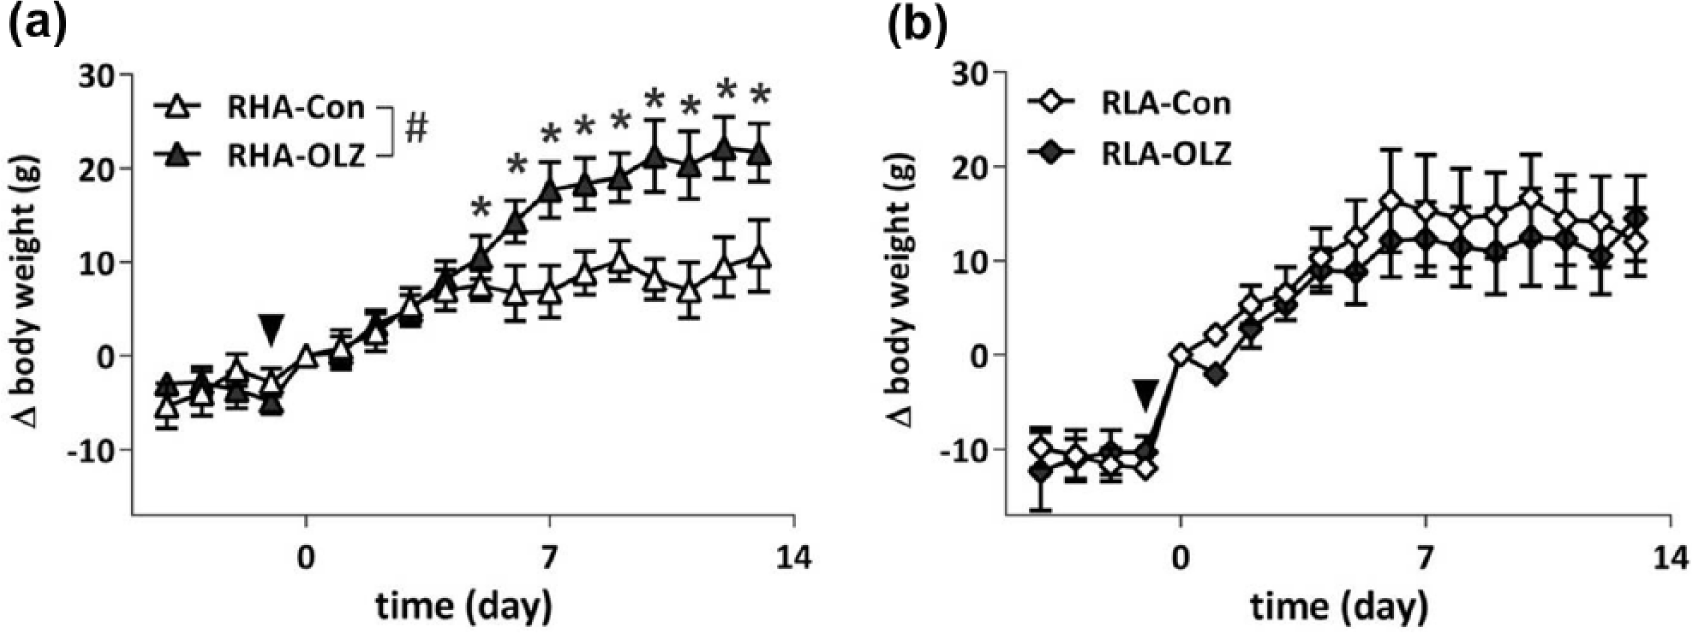
Body weight gain of olanzapine (OLZ)-treated rats and their controls in the Roman high avoidance (RHA) rat strain (a) and in the Roman low avoidance (RLA) rat strain (b). All rats were fed a medium fat diet from day −1 onwards, and treated with OLZ from day 0 onwards. A treatment effect was found in the RHA strain (#p<0.01), with differences (*p<0.05) from day 7 onwards. The arrowheads indicate the switch from a chow to a high fat diet one day before OLZ treatment commenced, the RLA animals increase a significant amount of body weight (BW) during the first day after the diet change compared to the RHA animals (p<0.01).
Figure 2 illustrates the effect of OLZ treatment on daily caloric intake of both strains. During baseline (day −7 to day −1), when animals had ad libitum access to regular chow, no differences between strains in caloric intake were observed. At day −1 (Figure 2(c)) animals were switched to the MF diet, and a clear increase of caloric intake was observed in both strains, however the increase in caloric intake was higher in the RLA compared to the RHA strain (F1,20=16.54, p<0.01). From day 0 till day 14, a Strain effect (F13,260=1.89, p<0.05) and a Strain*Treatment interaction (F13,260=1.94, p<0.05) were observed using repeated measures ANOVA; post-hoc analysis revealed a general difference between both control groups (F39,260=1.669, p<0.05). Olanzapine did not have an effect on daily caloric intake in the RLA strain, whereas an effect was observed in the RHA (F13,130=2.39, p<0.01, repeated measures ANOVA). Specifically, OLZ treatment increased caloric intake in the RHA at day 5 (F1,10=11.25, p<0.01), but for unknown reasons suddenly decreased at day 12 (F1,10=5.04, p<0.05) and 13 (F1,10=25.58, p<0.001). Altogether the most prominent effect observed on daily caloric intake is the general higher caloric intake of the RLA compared to the RHA control (F13,130=2.04, p<0.05), a difference that disappeared when both strains are treated with OLZ.
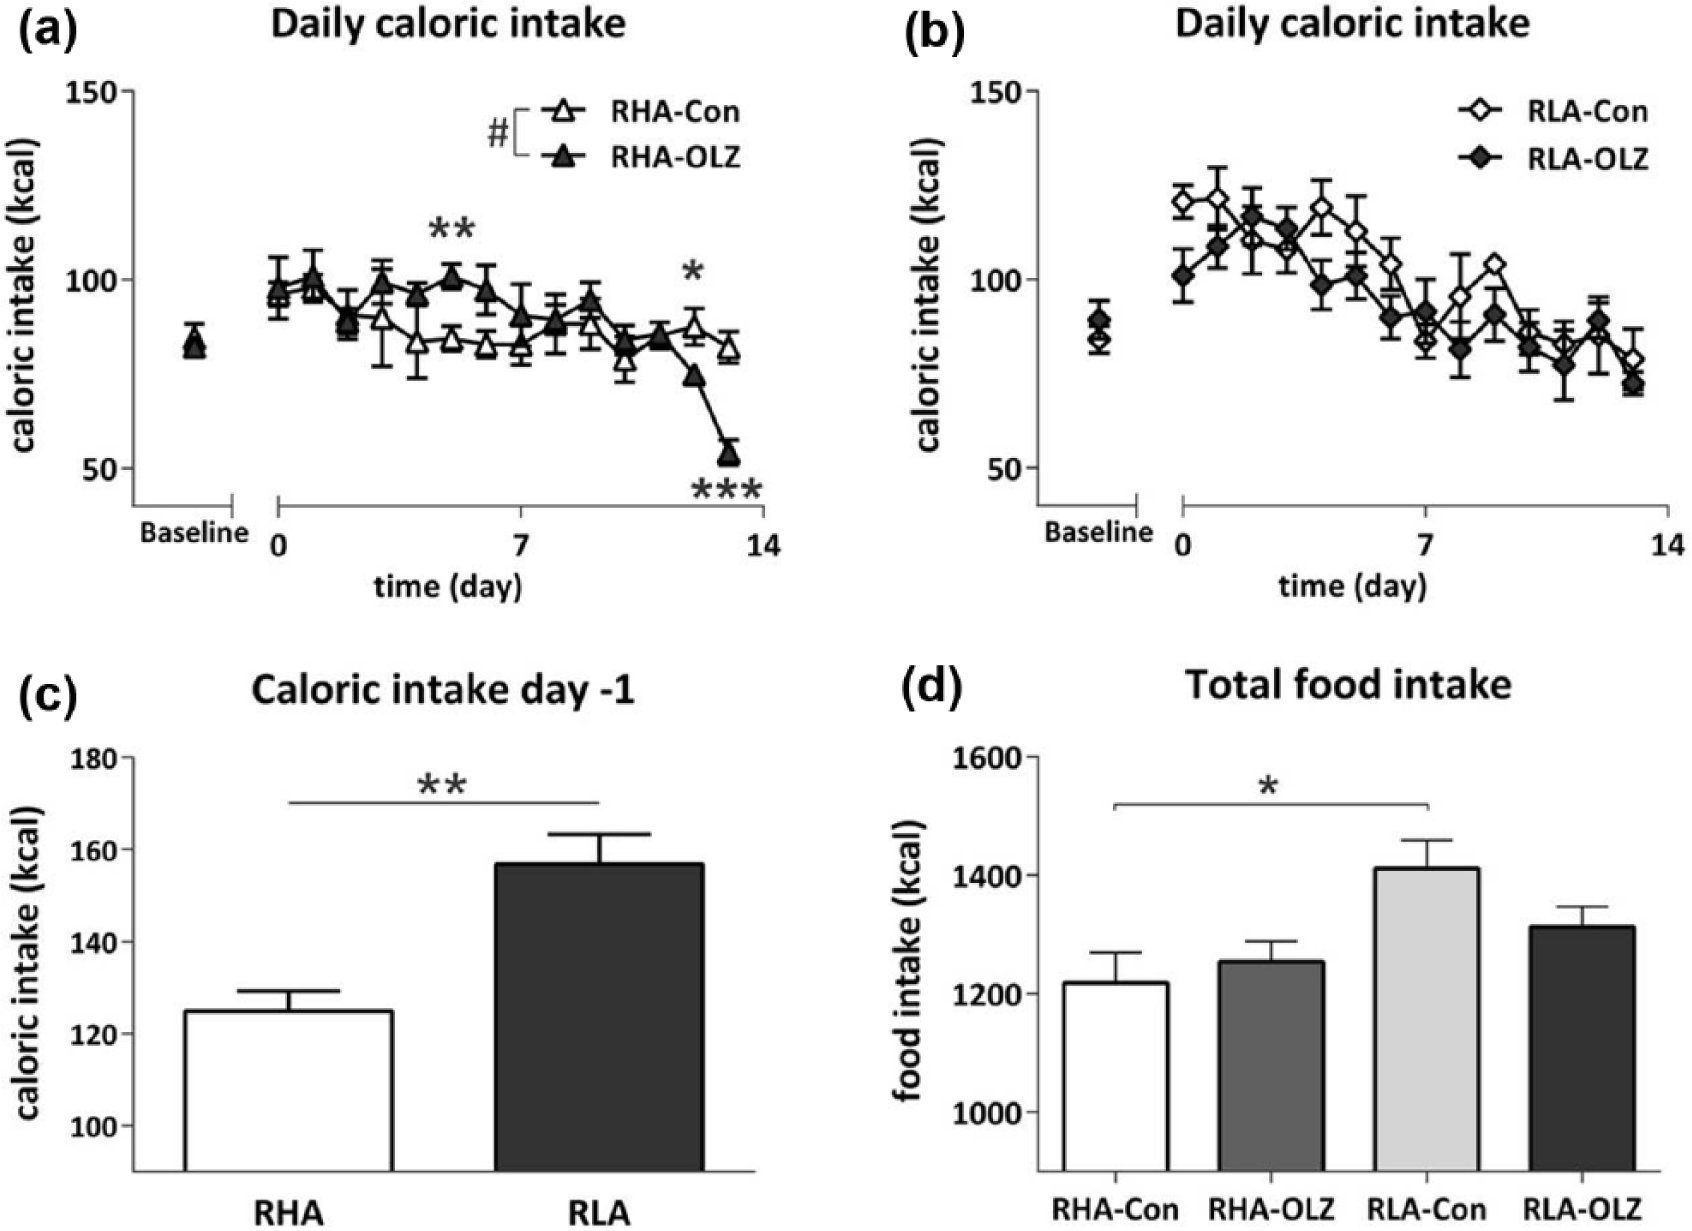
Daily caloric and cumulative food intake of olanzapine (OLZ)-treated rats and their controls of the Roman high avoidance (RHA) rat strain (a) and in the Roman low avoidance (RLA) rat strain (b). All rats were fed a medium fat diet from day −1 onwards, and treated with OLZ from day 0 onwards, during baseline all animals had ad lib access to a low fat (LF) diet. (c) Caloric intake at day -−1. All animals were switched from a LF to medium fat (MF) diet. RLA rats show increased caloric intake compared to RHA rats of the unfamiliar palatable diet (**p<0.01). (d) Total cumulative daily food intake over the 14 days treatment period in RHA and RLA rats treated with OLZ and their controls. *p<0.05, **p<0.01, ***p<0.001 one-way analysis of variance (ANOVA); #p<0.01 repeated measures ANOVA.
Analysis of cumulative total food intake over 14 days (Figure 2(d)) acknowledged a Strain effect (F1,20=7.99, p<0.05) of increased total food intake by the RLA; more specifically cumulative intake was higher in the RLA-Con compared to RHA-Con (F3,20=4.03, p<0.05, post-hoc).
RW activity
RW activity assessed over the course of the 14-day treatment period (Figure 3(a) and (b)) revealed a treatment effect (F14,266=3.09, p<0.05) in which OLZ treatment reduced running wheel activity in both strains. Analysis of daily running wheel activity over the course of 14 days (Figure 3(c)) revealed a Treatment effect (F1,24=20.06, p<0.001), Strain effect (F1,24=6.34, p<0.05), and a Strain*Treatment interaction (F1,24=4.42, p<0.05). Within strain analysis showed that OLZ decreased average daily total running wheel activity in both the RHA (F1,11=5.86, p<0.05) and the RLA strain (F1,11=14.26, p<0.01). Post-hoc analysis revealed increased total daily RW activity in the RLA-Con group compared to all other groups (F3,23=10.27, p<0.001), an effect which probably contributed heavily to the Strain*Treatment interaction. OLZ only decreased average dark phase activity in both the RHA strain (F1,11=7.95, p<0.05) and the RLA strain (F1,11=19.69, p<0.01) but no differences were observed for average light phase running wheel activity (data not shown). Overall, post hoc analysis revealed that average dark phase running wheel activity was higher in the RLA-Con group compared to all other groups (F3,23=13.26, p<0.01).
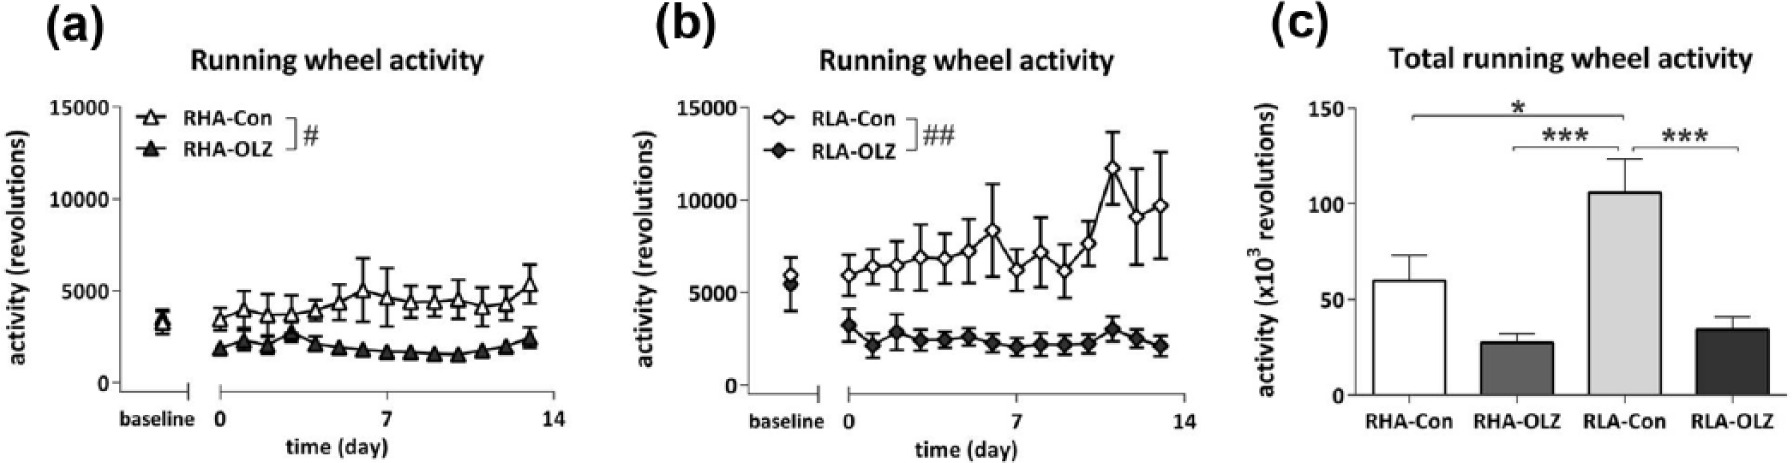
Daily running wheel activity of olanzapine (OLZ)-treated rats and their controls of the Roman high avoidance (RHA) rat strain ((a); #p<0.05) and in the Roman low avoidance (RLA) rat strain ((b); ##p<0.01). All rats were fed a medium fat diet from day −1 onwards, and treated with OLZ from day 0 onwards. Daily running wheel activity was affected by Treatment (p=0.016, repeated measures analysis of variance (ANOVA)). (c) Total running wheel activity over the 14day treatment period in RHA and RLA rats treated with OLZ and their controls. **p<0.01. Note: 100,000 revolutions equal 85 km.
When analyzing the average hourly pattern of running wheel activity over the course of one day (as illustrated in Figure 4), running wheel activity was affected by Treatment (F24,480=14.66, p<0.001), by Strain (F24,480=3.70, p<0.001), and by an interaction of Strain*Treatment (F24,480 =3.28, p<0.001). OLZ decreased diurnal running wheel activity in both OLZ-treated groups compared to their control-counterparts (RHA: F24,240=8.16, p<0.001; RLA: F24,240=9.20, p<0.001), which was based on a decrease in running wheel activity during the dark phase (see Figure 4), immediately after drug administration.
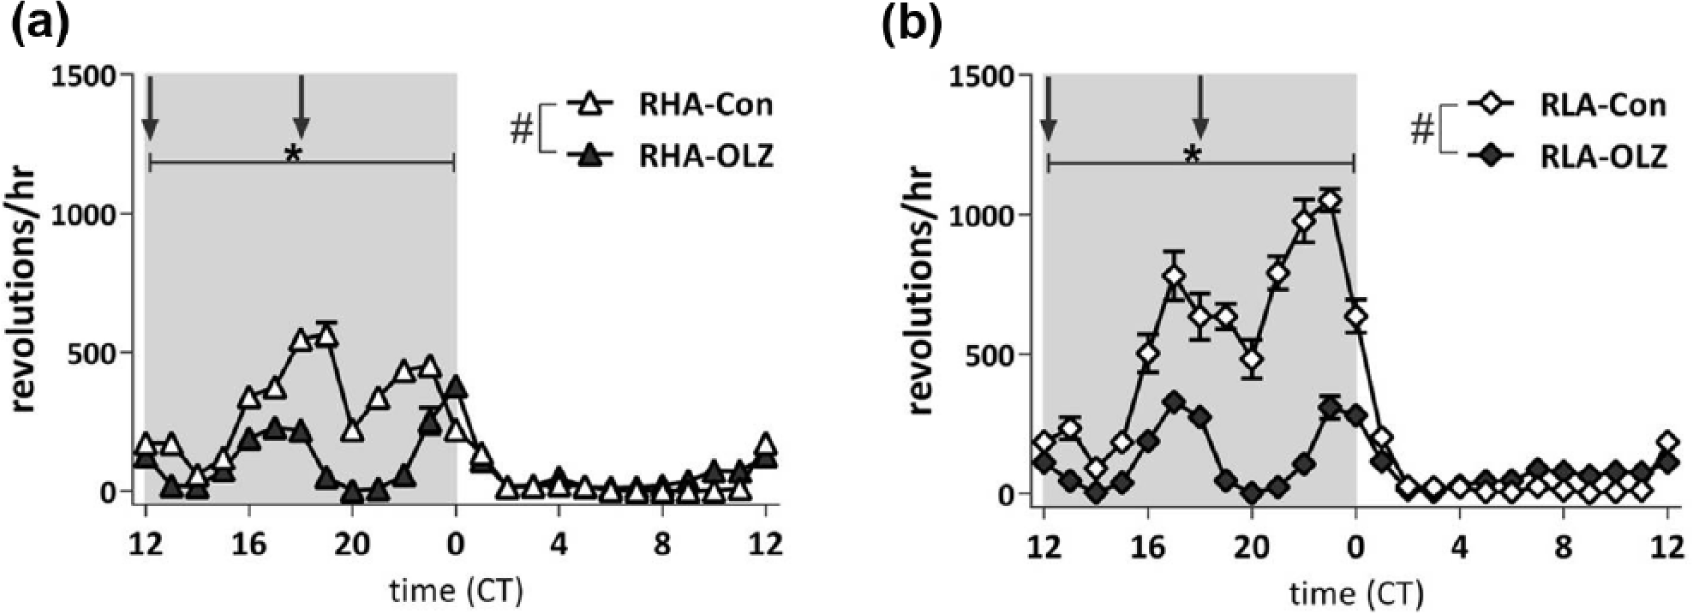
Diurnal running wheel activity of olanzapine (OLZ)-treated rats and their controls of the Roman high avoidance (RHA) rat strain (a) and the Roman low avoidance (RLA) rat strain (b). All rats were fed a medium fat diet from day −1 onwards, and treated with OLZ from day 0 onwards. Diurnal running wheel activity was decreased by OLZ (#p<0.01, repeated measures analysis of variance (ANOVA)), but this difference was based on a reduction of running wheel activity during the dark phase (*p<0.01, post-hoc testing). Lights on at CT0; arrows indicate drug/saline administration at CT12 and CT18. Open symbols indicate control treated groups; dark filled symbols indicate OLZ treated groups. Note: 1000 revs/h equals 850 m/h. CT: circadian time.
Glucose and insulin responses
Analysis of the glucose response during the IVGTT, as illustrated in Figure 5(a) and (b), revealed an overall Treatment effect (F8,160=3.00, p<0.01) with increased glucose levels in the OLZ-treated groups, but no Strain effect or Strain*Treatment interaction. Within Strain analysis yielded a significant increase of the glucose response by OLZ only in the RHA strain (F8,80=4.50, p<0.001) and not in the RLA strain. Area under the curve analysis (Table 1) revealed consistently that only within the RHA strain OLZ treatment caused an increased AUCgluc as compared to control treatment (F1,11=7.01, p<0.05). Basal circulating glucose levels were affected by Treatment (F1,20=4.64, p<0.05), with lower basal glucose levels in the OLZ-treated groups compared to the control groups (see Table 1).
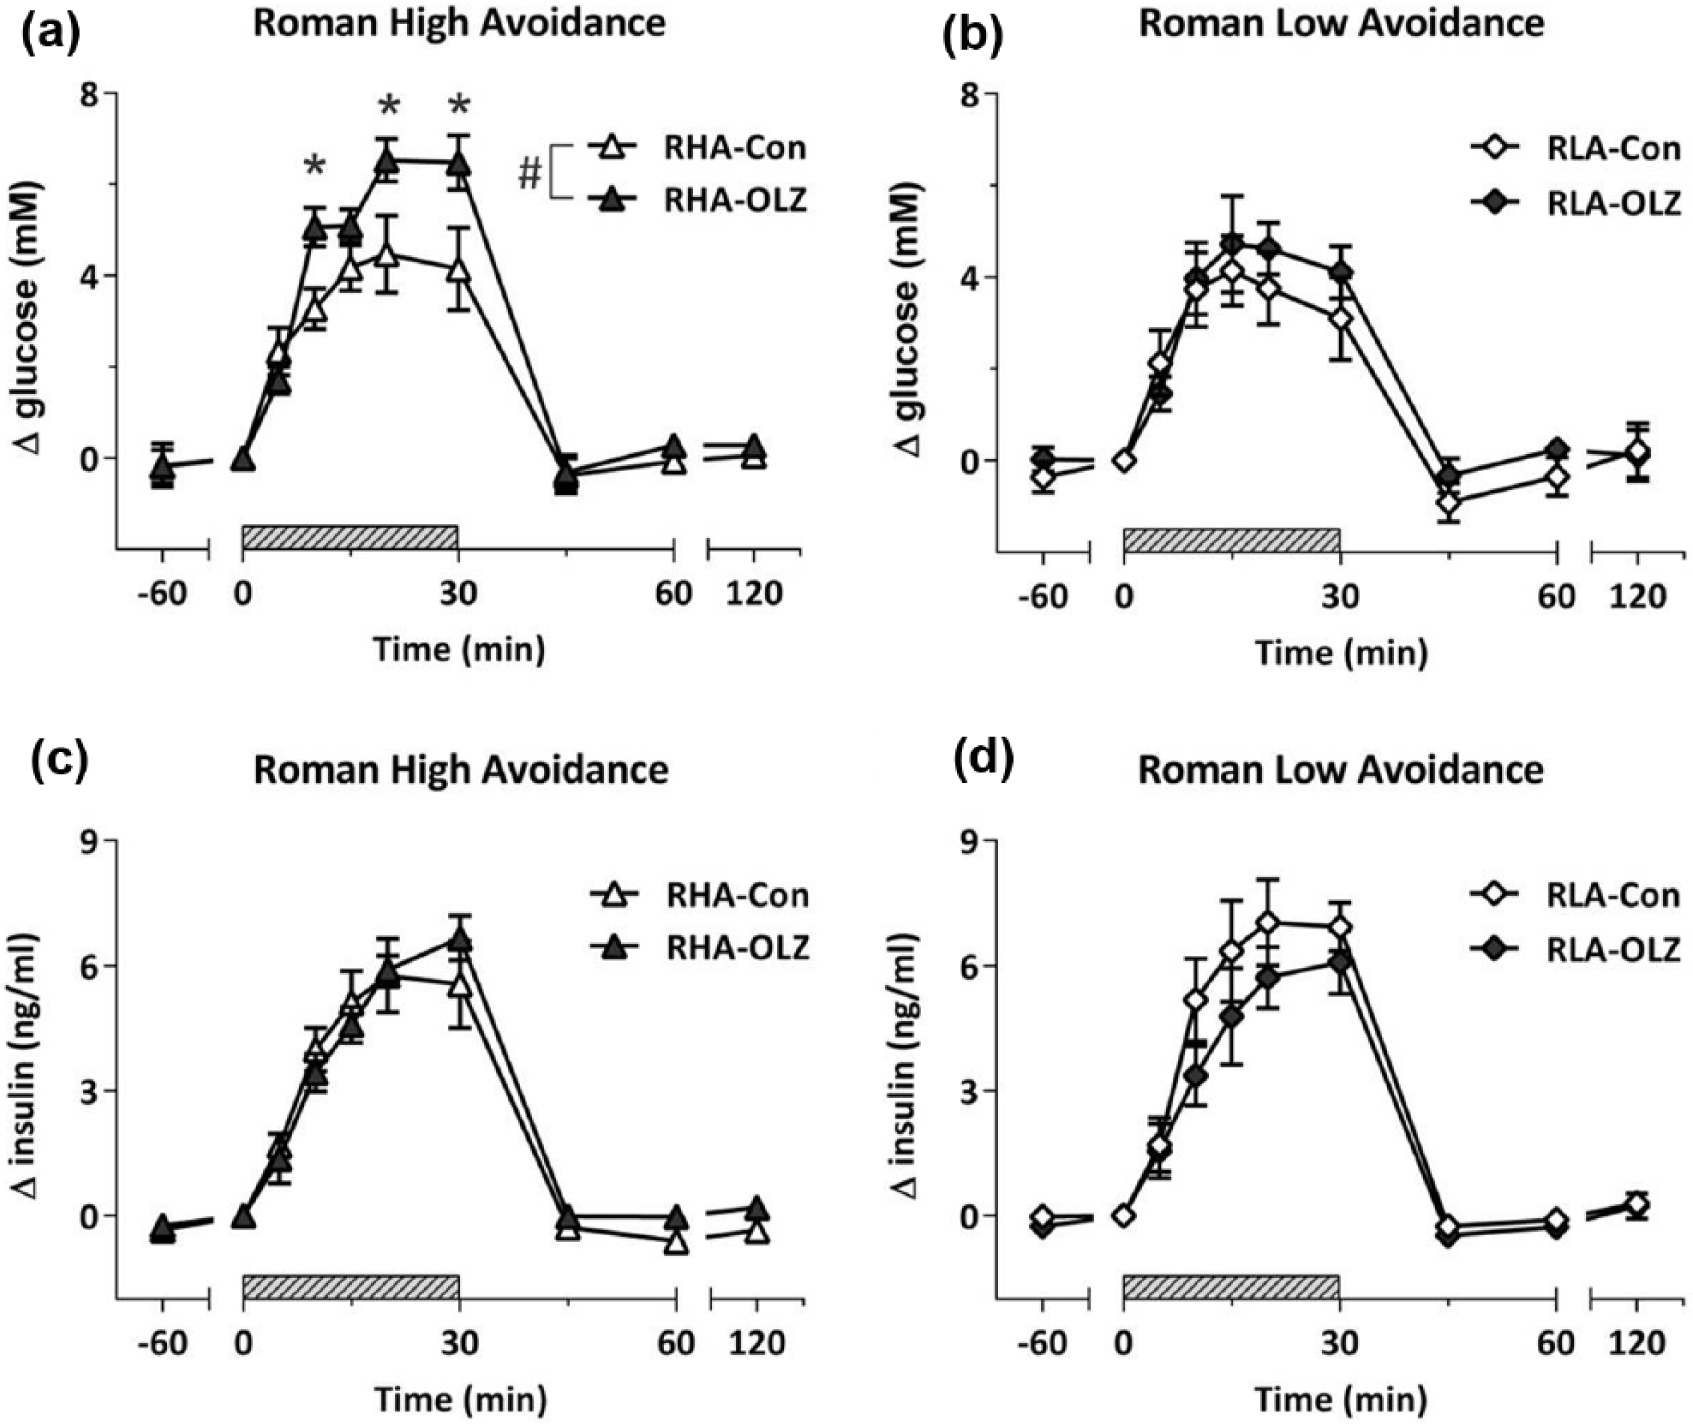
Delta glucose and insulin responses during intravenous glucose tolerance test (IVGTT). Blood glucose responses in the Roman high (a) and Roman low (b) avoidance rats before, during and after the IVGTT, and associated plasma insulin responses ((c) and (d) respectively). A Treatment effect was observed on circulating glucose levels in the OLZ groups compared to the Control groups (#p<0.05). Within strain analysis showed overall increase of circulating glucose levels in the RHA-OLZ group compared to the RHA control group (#p<0.001, repeated measures analysis of variance (ANOVA)) and at time point 15, 20, and 30 min (*p<0.05). Glucose (150 mg/mL) was infused intravenously (0.1 mL/min) from 0–30 min (shaded bar).
Baseline and area under the curves (AUCs) of glucose and insulin responses during the intravenous glucose tolerance test (IVGTT) and glucose homeostasis parameters.
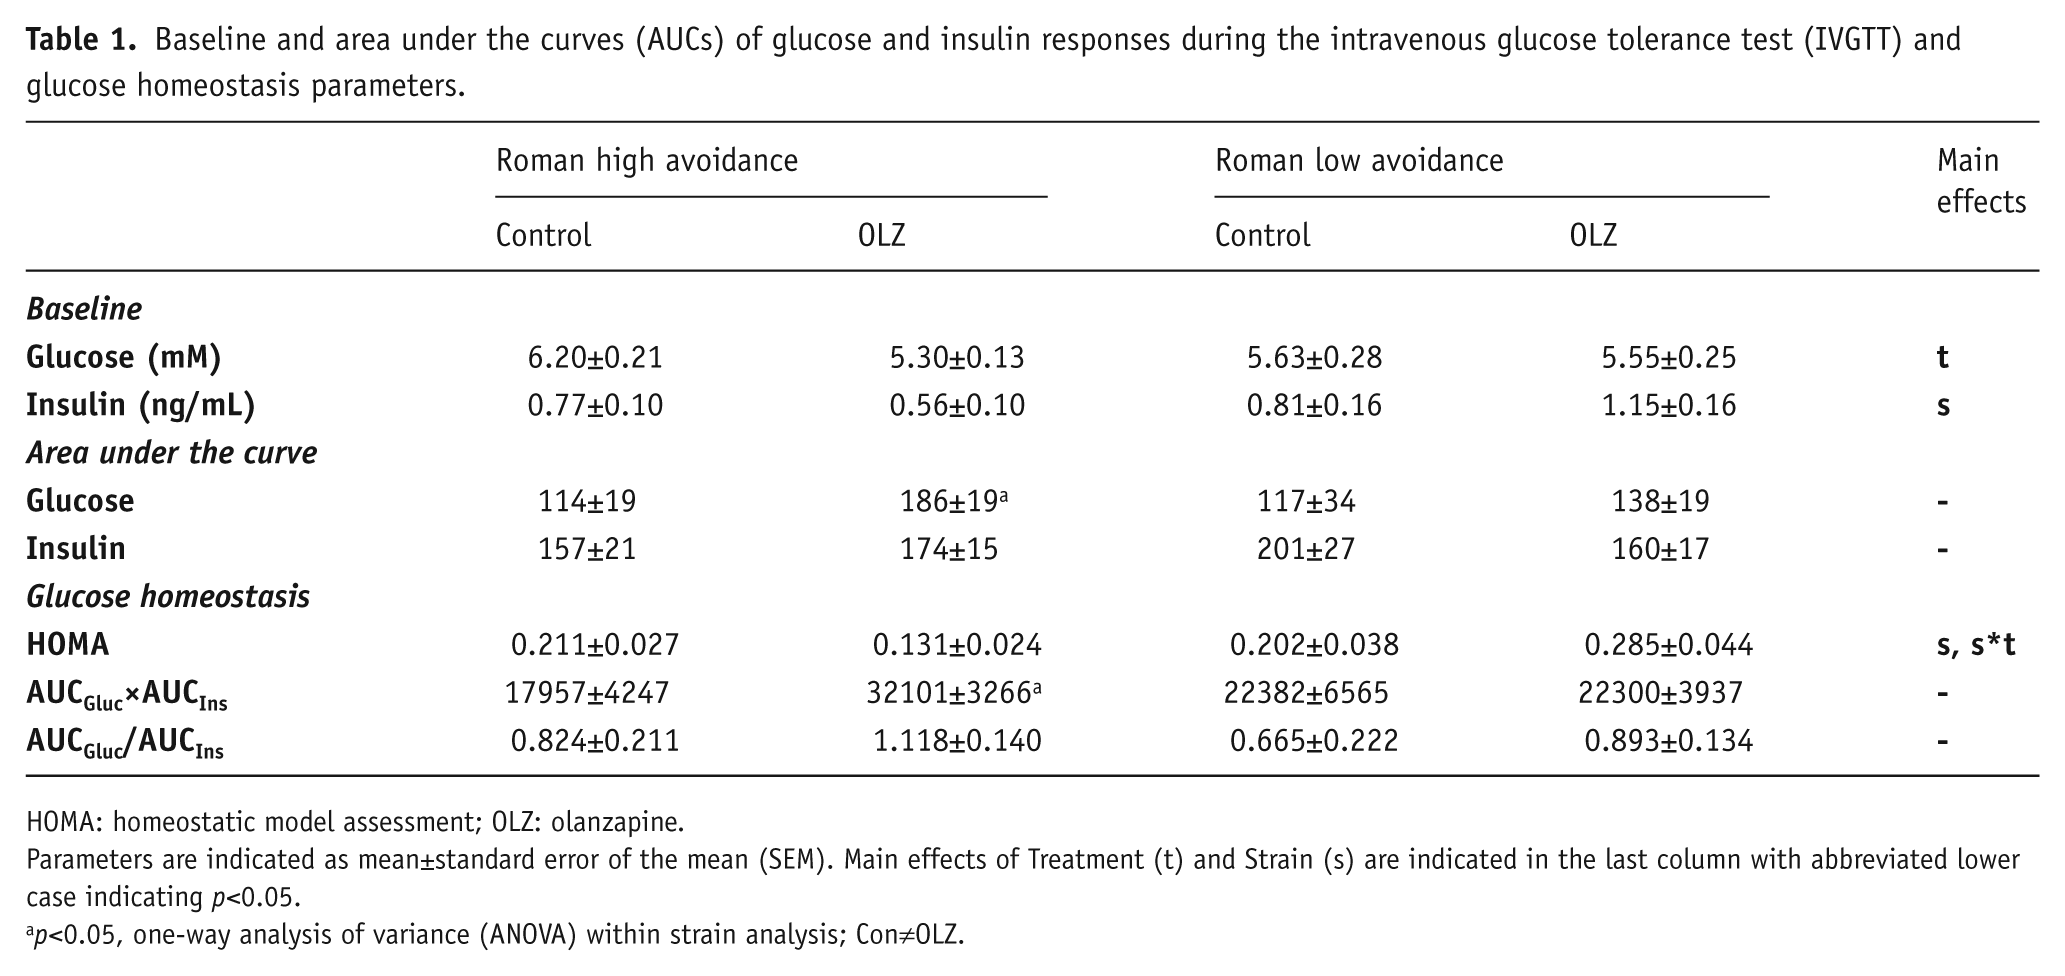
HOMA: homeostatic model assessment; OLZ: olanzapine.
Parameters are indicated as mean±standard error of the mean (SEM). Main effects of Treatment (t) and Strain (s) are indicated in the last column with abbreviated lower case indicating p<0.05.
p<0.05, one-way analysis of variance (ANOVA) within strain analysis; Con≠OLZ.
Analysis of the insulin response during the IVGTT (Figure 5(c) and (d)) did not reveal any effect of Strain and/or Treatment. In addition, no differences in AUCins between groups were observed. Nevertheless, basal insulin levels were dependent on Strain (F1,20=5.18, p<0.05,), with lower basal insulin levels in the RHA strain compared to RLA strain (see Table 1). Analysis of determinants of insulin action (see Table 1) yielded and overall effect on HOMA, with an overall effect of Strain (F1,20=4.38, p<0.05) and an interaction between Strain and Treatment (F1,20=5.54, p<0.05), which was mainly due to a reduction in HOMA in the OLZ-treated RHA rats. Within strain analysis additionally revealed a higher insulin resistance index based on AUCgluc×AUCins in the RHA-OLZ group. The β-cell sensitivity index AUCins/AUCglu yielded an overall effect of treatment as an overall result of a lower index in the OLZ treated groups.
Adiposity
Effects of Strain and Treatment on adipose tissue mass (relative to total body weight) from several fat depots are shown in Table 2. A Strain effect was observed on several adiposity markers, with overall higher adiposity levels in the RLA strain compared to RHA strain evidenced by higher total body adiposity (F1,23=7.66, p<0.05), subcutaneous adiposity (F1,23=10.24, p<0.01), and intermuscular adiposity (F1,23=10.15, p<0.01). The abdominal fat depots were mostly affected by a Strain*Treatment interaction with higher abdominal fat by OLZ treatment in the RHA strain, but not in the RLA strain. Within the RHA strain OLZ increased total (F1,11=13.77, p<0.01), abdominal (F1,11=10.11, p<0.01), parametrial (F1,11=12.46, p<0.01), retroperitoneal (F1,11=6.63, p<0.05), subcutaneous (F1,11=19.09, p<0.01), and intermuscular adiposity (F1,11=7.28, p<0.05). Within the RLA strain OLZ did not affect adiposity levels. Interscapular brown adipose tissue (iBAT) was carefully dissected and weighed. Whereas all collected white adipose tissue depots were lower in the RHA-Con group compared to the RLA groups, it was clear that the RHA have increased levels of iBAT (both total grams (not shown) as well as percentage of iBAT), which was acknowledged by the observed effect of Strain (F1,23=47.50, p<0.001). OLZ treatment did not affect iBAT mass within either the RHA or RLA strain.
Adipose tissue mass following 14 days of olanzapine (OLZ) treatment in Roman high avoidance and Roman low avoidance rats.
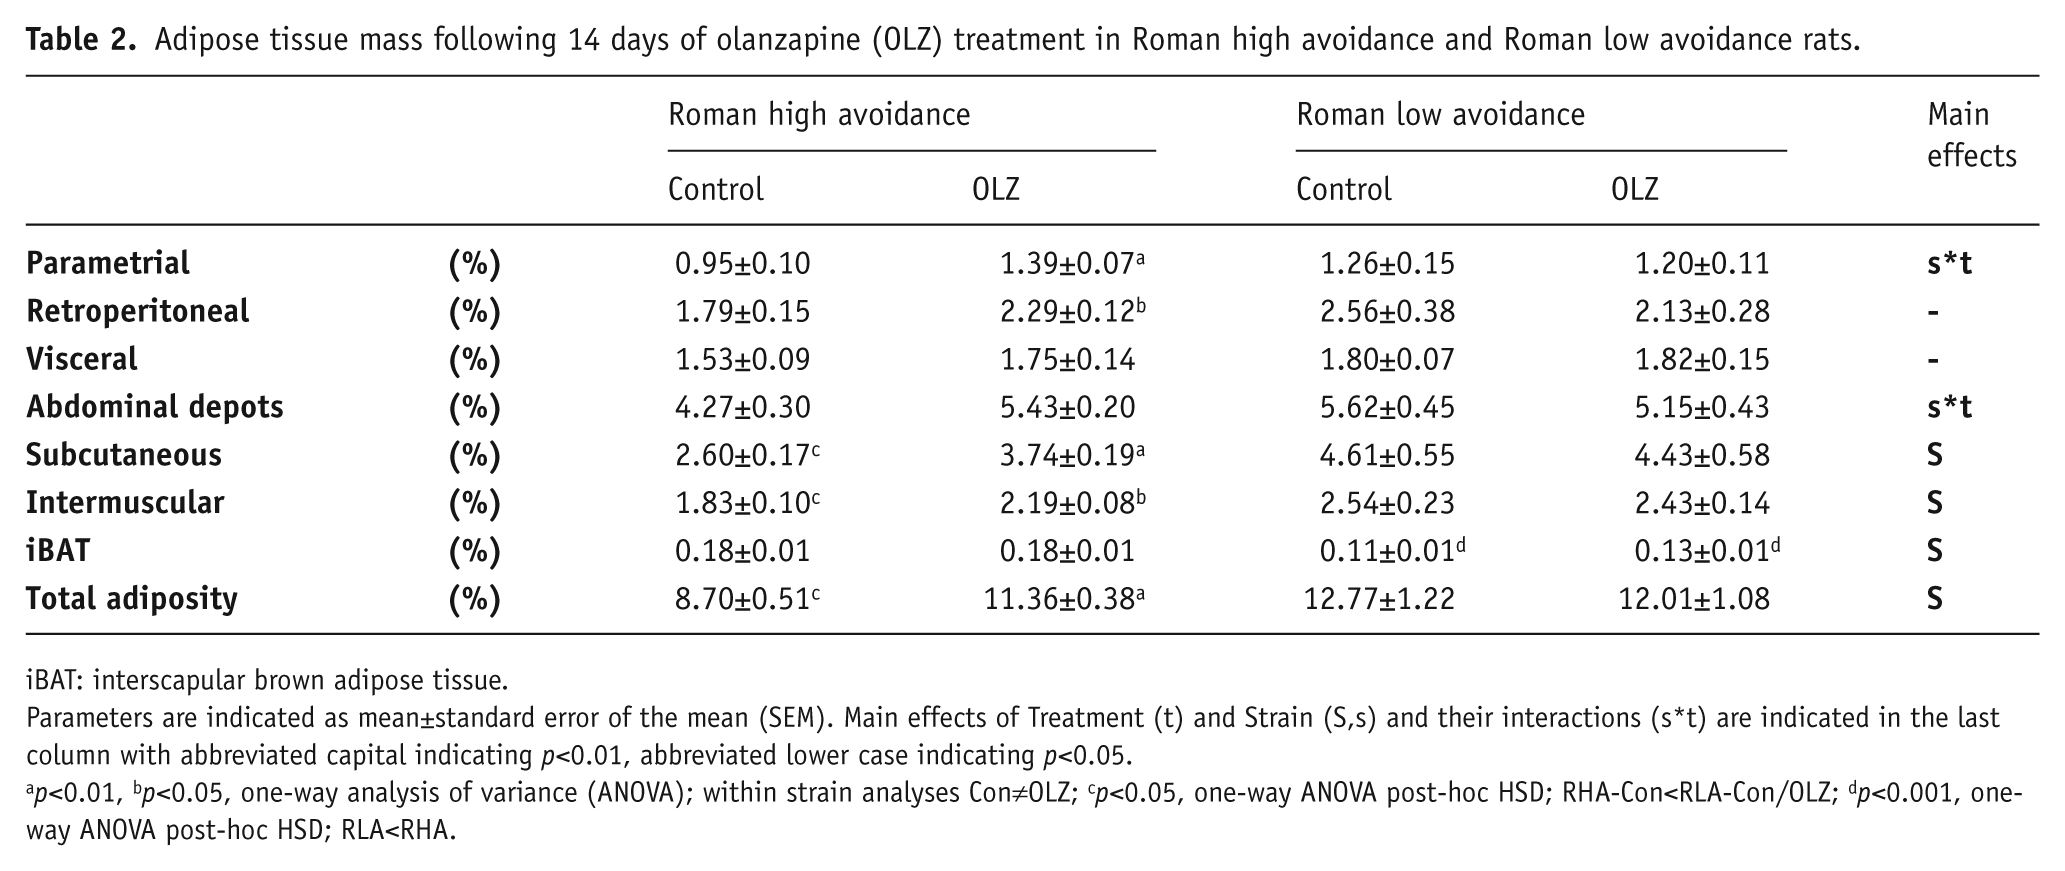
iBAT: interscapular brown adipose tissue.
Parameters are indicated as mean±standard error of the mean (SEM). Main effects of Treatment (t) and Strain (S,s) and their interactions (s*t) are indicated in the last column with abbreviated capital indicating p<0.01, abbreviated lower case indicating p<0.05.
p<0.01, bp<0.05, one-way analysis of variance (ANOVA); within strain analyses Con≠OLZ; cp<0.05, one-way ANOVA post-hoc HSD; RHA-Con<RLA-Con/OLZ; dp<0.001, one-way ANOVA post-hoc HSD; RLA<RHA.
Circulating factors
During baseline (day −1) and after sacrifice at day 14, blood samples were taken and circulating leptin, triglycerides, corticosterone, free fatty acids, and prolactin were measured (see Table 3). Plasma leptin levels were affected by Time (F1,19=6.04, p<0.05), an effect that was mostly due to its interaction with Strain (F1,19=11.24, p<0.01) irrespective of Treatment, based on the elevated levels of plasma leptin over time in the RLA group. No main effects of Strain or Treatment were observed over the duration of the study on circulating TGC or corticosterone levels. However, at day 14 of treatment a Strain*Treatment interaction was observed on plasma corticosterone levels, pointing out a specific increase in corticosterone levels in the RLA-Con group (F1,20=4.86, p<0.05). Plasma FFA levels reduced in all experimental groups over the course of treatment and analysis revealed a main effect of Time (F1,21=15.36, p<0.01). Prolactin levels were affected by Time (F1,20=32.94, p<0.0001), by an interaction between Time*Strain (F1,20=5.32, p<0.05), by Time*Treatment (F1,20=6.39, p<0.05), and by an interaction between Time*Strain*Treatment (F1,20=5.41, p<0.05). To investigate underlying effects, closer inspection revealed an effect of Strain on circulating prolactin levels before the start of drug treatment at day 0 (F1,24=7.26, p<0.05), based on the lower circulating prolactin levels in the RHA group versus the RLA group. Analysis of circulating prolactin levels at day 14 revealed a Treatment effect (F1,24=16.81, p<0.01) and a Strain*Treatment interaction (F1,24=14.06, p<0.01) indicative of increased prolactin levels in the RHA-OLZ group. Additionally, circulating prolactin levels in the RHA-Con group were lower at day 14 compared to all other groups (F3,23=10.69, p<0.05, one-way ANOVA post-hoc).
The effect of olanzapine (OLZ) on circulating leptin, triglyceride (TGC), free fatty acid (FFA), corticosterone, and prolactin in Roman high avoidance versus Roman low avoidance rats.
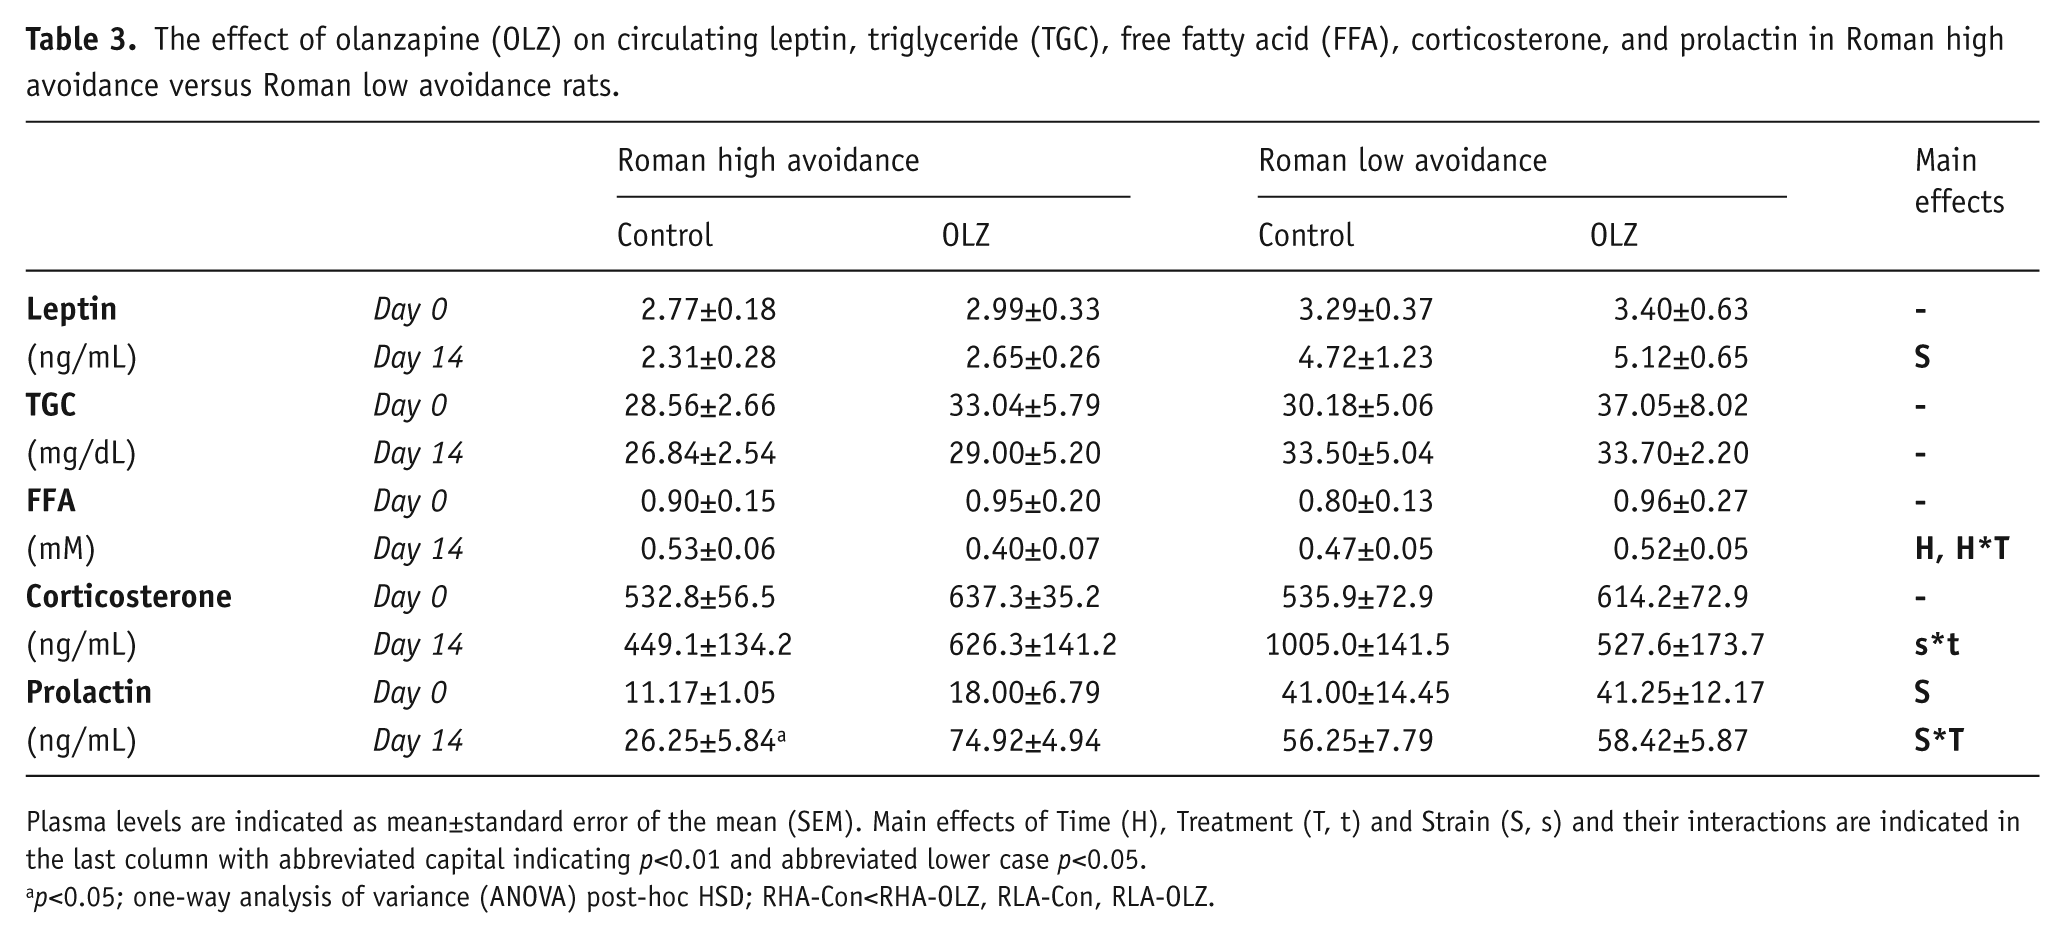
Plasma levels are indicated as mean±standard error of the mean (SEM). Main effects of Time (H), Treatment (T, t) and Strain (S, s) and their interactions are indicated in the last column with abbreviated capital indicating p<0.01 and abbreviated lower case p<0.05.
p<0.05; one-way analysis of variance (ANOVA) post-hoc HSD; RHA-Con<RHA-OLZ, RLA-Con, RLA-OLZ.
Central mRNA expression
Expression levels of mRNA in VTA, NAc, and PFC are expressed as a relative difference compared to the RHA-Con group (see Table 4).
The effects of olanzapine (OLZ) treatment on cortico-mesolimbic nervous system mRNA expression levels in the Roman high avoidance compared to the Roman low avoidance rats.
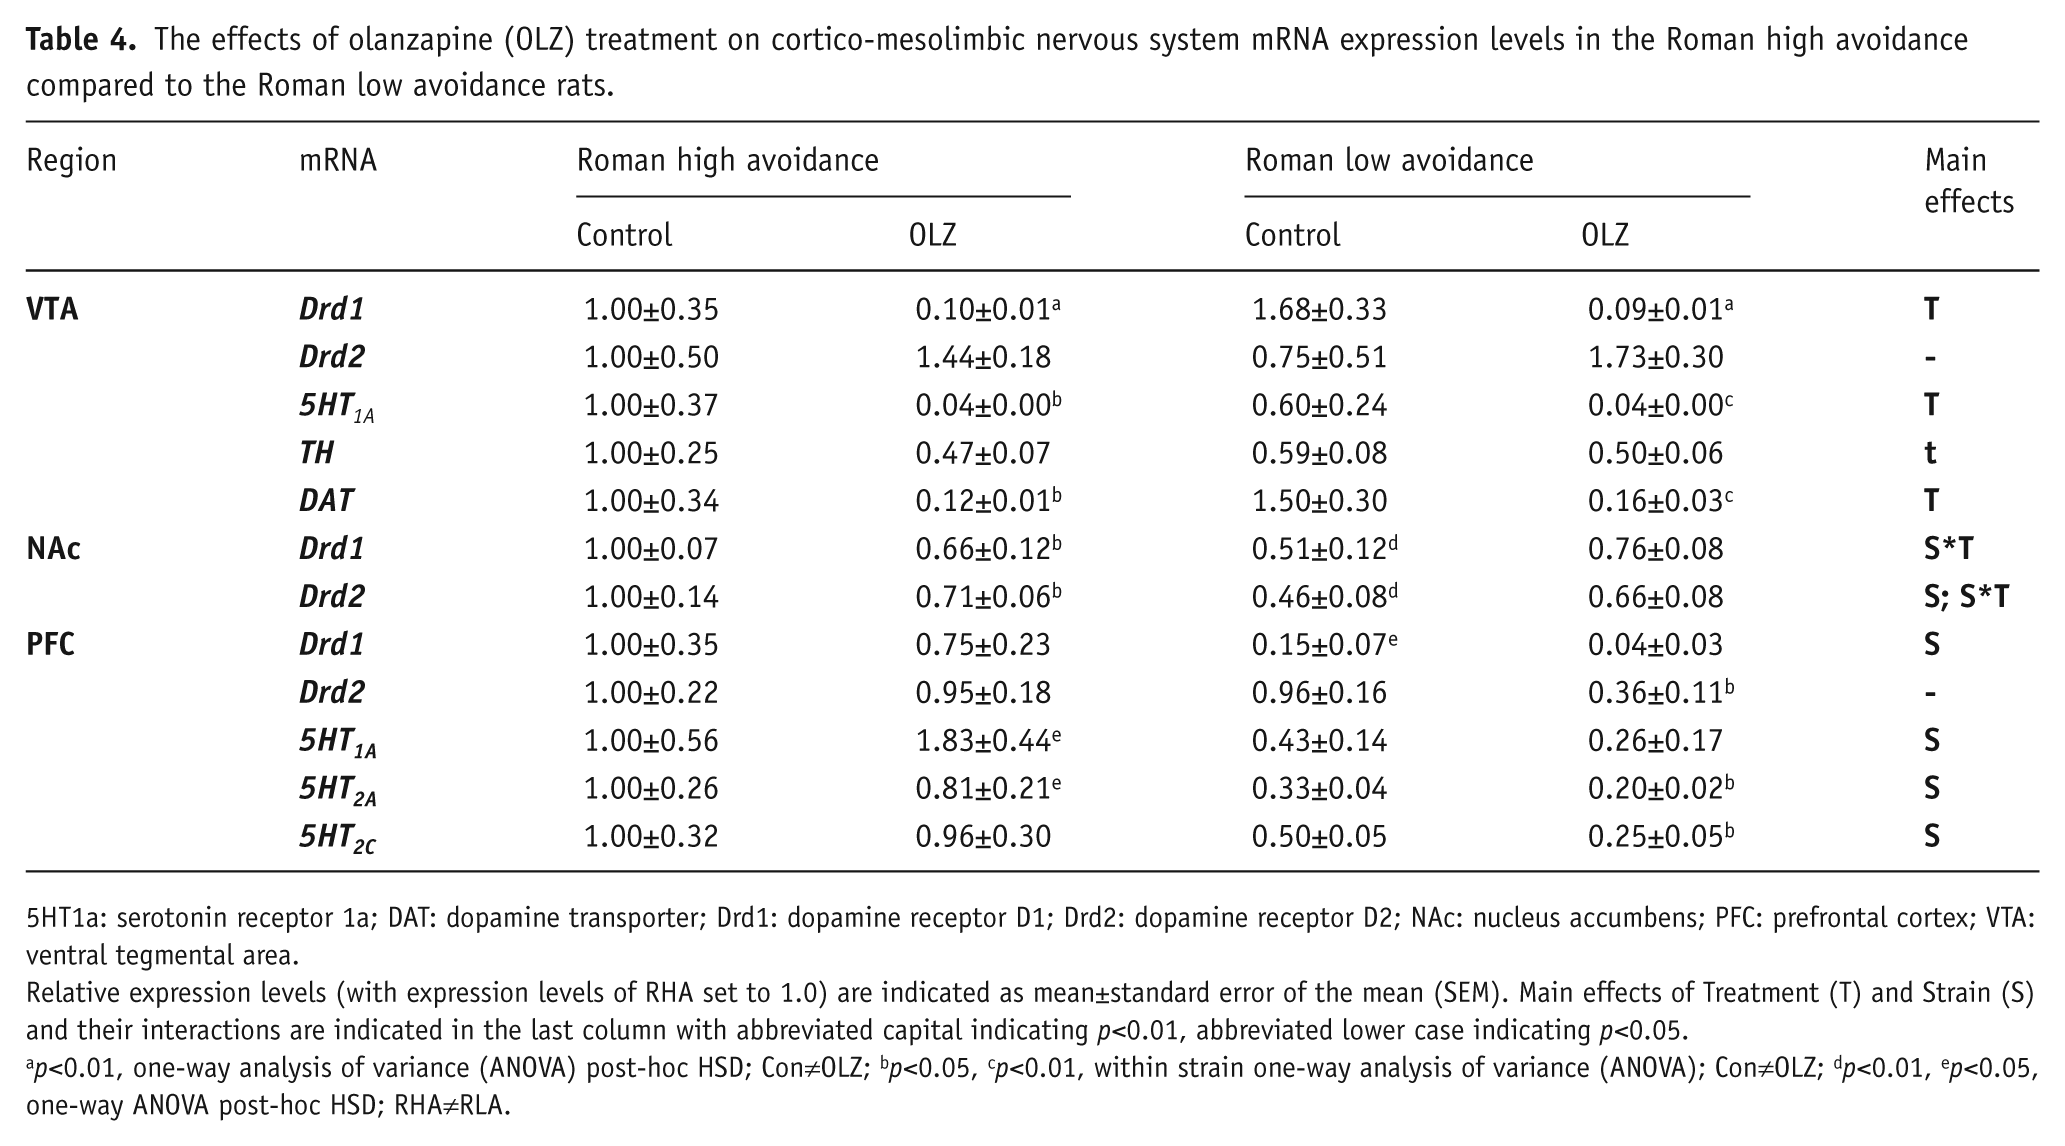
5HT1a: serotonin receptor 1a; DAT: dopamine transporter; Drd1: dopamine receptor D1; Drd2: dopamine receptor D2; NAc: nucleus accumbens; PFC: prefrontal cortex; VTA: ventral tegmental area.
Relative expression levels (with expression levels of RHA set to 1.0) are indicated as mean±standard error of the mean (SEM). Main effects of Treatment (T) and Strain (S) and their interactions are indicated in the last column with abbreviated capital indicating p<0.01, abbreviated lower case indicating p<0.05.
p<0.01, one-way analysis of variance (ANOVA) post-hoc HSD; Con≠OLZ; bp<0.05, cp<0.01, within strain one-way analysis of variance (ANOVA); Con≠OLZ; dp<0.01, ep<0.05, one-way ANOVA post-hoc HSD; RHA≠RLA.
VTA
Main effects of Treatment (irrespective of Strain) were found on mRNA expression levels of VTA Drd1 (F1,23=26.47, p<0.001), VTA 5HT1A (F1,23=11.62, p<0.01), VTA TH (F1,23=4.84, p<0.05), and on VTA DAT (F1,23=24.06, p<0.001), with generally lower levels found in the OLZ-treated groups relative to the control treated groups (see Table 4 for post-hoc comparisons). Strain was not a main factor in altering mRNA expression levels in the VTA. VTA Drd2 mRNA expression was not affected by Treatment or Strain.
NAc
An interaction effect of Strain*Treatment was found on the NAc Drd1 mRNA expression (F1,11=8.66, p<0.01), as well as on the NAc Drd2 mRNA expression (F1,22=6.44, p<0.01), with (compared to Control treatment) reduced Drd1 and Drd2 expression levels in the RHA-OLZ group, whereas an opposite trend was observed for increased expression levels of Drd1 and Drd2 mRNA by OLZ in the RLA strain. In addition, there was a main effect of Strain on NAc Drd2 mRNA expression (F1,22=9.37, p<0.01), with higher NAc Drd2 mRNA expression levels in the RHA rats compared to RLA rats irrespective of Treatment (see Table 4 for post-hoc comparisons).
PFC
Main effects of Strain were found on mRNA expression levels of PFC Drd1 (F1,23=12.94, p<0.01), PFC 5HT1A (F1,23=7.97, p<0.01), PFC 5HT2A (F1,23=13.71, p<0.01), and PFC 5HT2C (F1,23=7.00, p<0.01), with relatively lower mRNA expression levels measured in the RLA strain compared to the RHA strain (see Table 4 for post-hoc comparisons). No Strain or Treatment effects were observed on the PFC Drd2 mRNA receptor expression. However, within strain analysis revealed that OLZ did reduce PFC Drd2 mRNA expression levels (F1,11=7.52, p<0.05, one-way ANOVA) only in the RLA strain, whereas no effect of OLZ on PFC Drd2 mRNA expression was observed within the RHA strain.
Linear regression analysis
To examine the variation in (a) total adiposity at the end of treatment, (b) total food intake over the 14-day treatment period, (c) total RW activity over the 14-day treatment period, (d) the glucose response during an IVGTT, (e) insulin resistance, and (f) the β-cell sensitivity index, we performed stepwise linear regression analyses of these dependent factors with several independent random factors as well as Strain and Treatment (Table 5(a)–(f)). The variation in total adiposity (Table 5(a)) was best explained by plasma leptin levels at day 14 of treatment, which is consistent with the important role of leptin in body fat regulation (Ahima et al., 1996). This positive correlation was further improved by including plasma prolactin levels at day 14 and total food intake ingested over the 14-day treatment period. When examining the strains separately, total adiposity was strongly correlated to circulating leptin in the RLA strain, whereas in the RHA strain body fat was best explained by Treatment (which is in agreement with the combined data shown in Figure 1 and Table 2). When Treatment was taken out as an independent factor of the analysis, prolactin levels at day 14 best explained variation in body fat in the RHA strain, and this positive correlation was improved to a certain extent by a combination of circulating FFAs and TGCs, and VTA Drd1 expression.
Variation in total food intake over the 14-day treatment period in the whole group was best explained by circulating leptin levels at day 14, and this positive correlation was improved considerably by the expression of NAc Drd1 mRNA, an effect that can be mainly attributed to the RHA strain (see Table 5(b)). Total RW activity over the 14-day treatment period (Table 5(c)) was best explained by the variation in several expression factors measured in the VTA. Overall VTA-DAT mRNA expression best explained the variation in total RW activity (in a positive correlation), accompanied by the expression of VTA-5HT1A and circulating TGC levels. However, when strains were analyzed separately, total RW activity in the RHA was above all positively correlated to VTA mRNA expression, whereas in the RLA total RW activity was positively correlated to VTA-Drd1 mRNA expression (see Table 5(c)). Like total RW activity, the variation observed in the AUCGlu during the IVGTT was also best explained by variation in expression of relative VTA-DAT mRNA, but in a negative correlation. In the RHA strain, however, it was the expression of VTA-TH mRNA combined with total RW activity, whereas in the RLA it was the expression of VTA-Drd1 mRNA that yielded the highest negative correlations with AUCGlu. The insulin resistance index AUCGlu×AUCIns was overall in a negative correlation best explained by total RW activity (see Table 5(e)), an effect that can be attributed to the RLA strain. In the RHA strain, however, the observed variation in the insulin resistance index is mainly attributed to a positive correlation of a combination of VTA-TH and VTA-Drd2 mRNA expression. The β-cell sensitivity index (AUCIns/AUCGlu) in the whole group was best explained by VTA-DAT in a positive correlation, which remained significant when analyzing the strains separately (Table 5(f)). Stepwise regression analysis did not reveal any overall correlation on HOMA.
Multiple linear regression analysis.
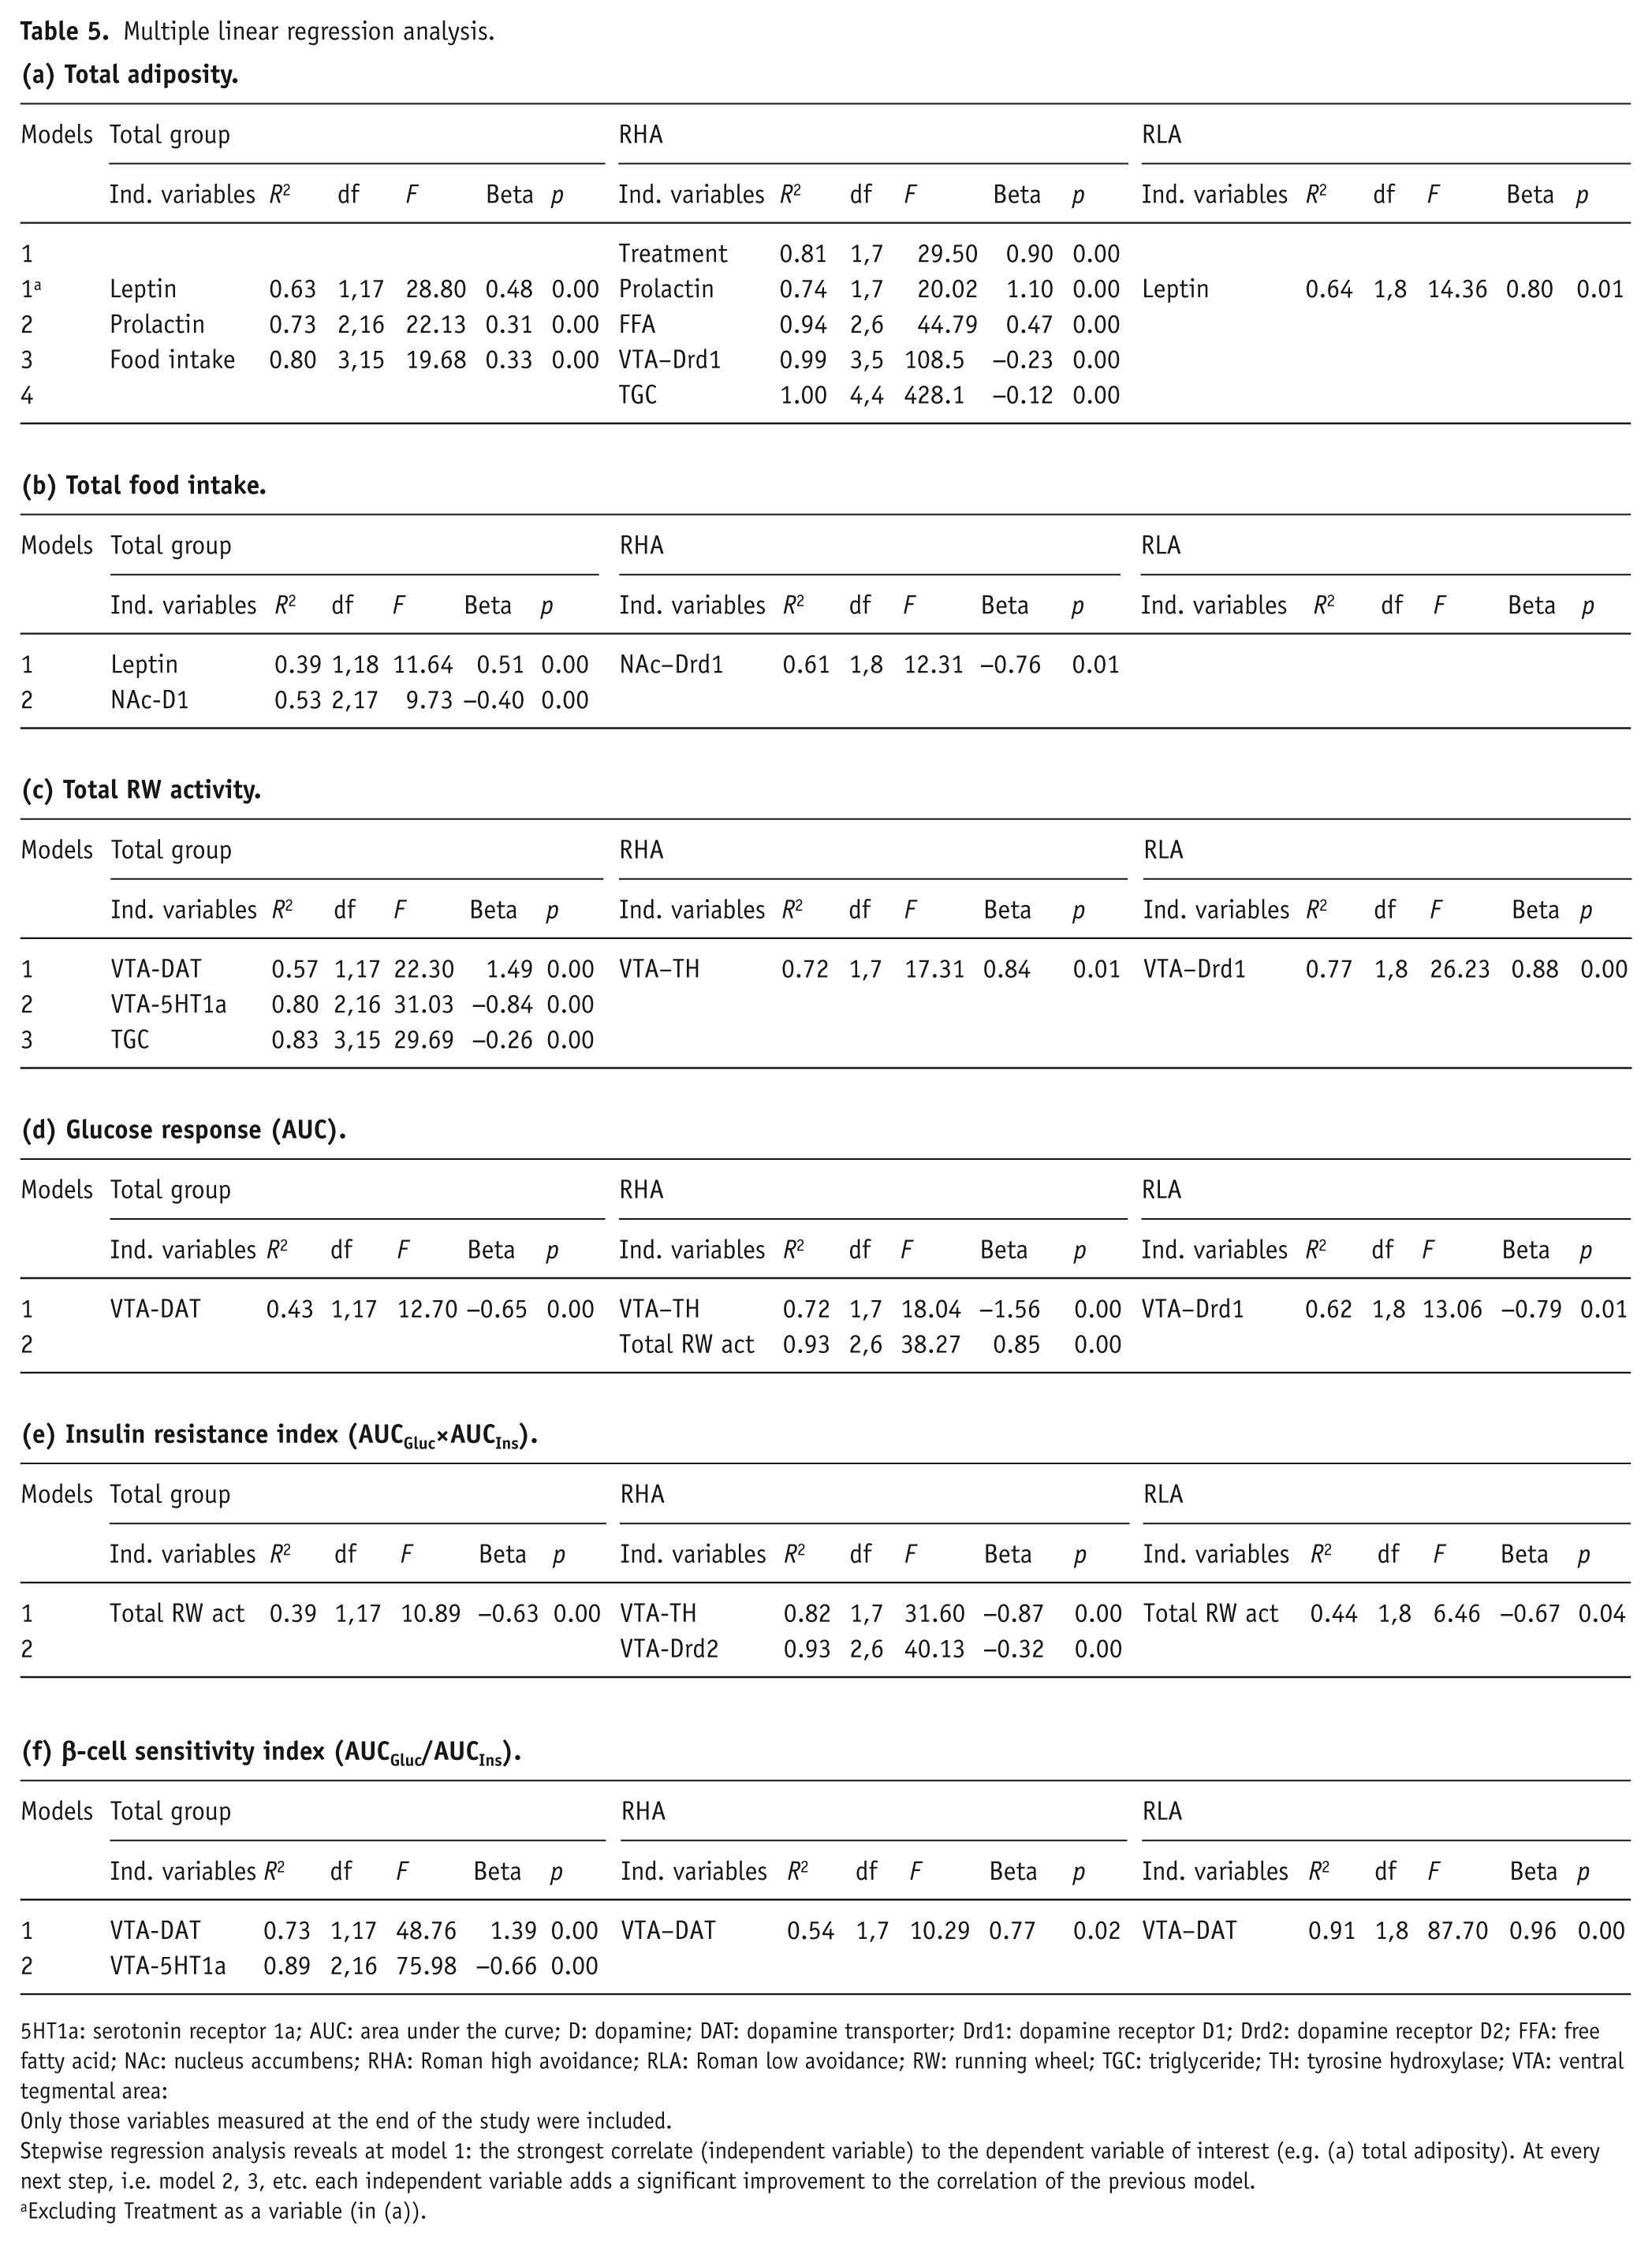
5HT1a: serotonin receptor 1a; AUC: area under the curve; D: dopamine; DAT: dopamine transporter; Drd1: dopamine receptor D1; Drd2: dopamine receptor D2; FFA: free fatty acid; NAc: nucleus accumbens; RHA: Roman high avoidance; RLA: Roman low avoidance; RW: running wheel; TGC: triglyceride; TH: tyrosine hydroxylase; VTA: ventral tegmental area:
Only those variables measured at the end of the study were included.
Stepwise regression analysis reveals at model 1: the strongest correlate (independent variable) to the dependent variable of interest (e.g. (a) total adiposity). At every next step, i.e. model 2, 3, etc. each independent variable adds a significant improvement to the correlation of the previous model.
Excluding Treatment as a variable (in (a)).
In summary, plasma leptin following 14 days of treatment was the best correlate to total adiposity at the end of treatment within the total group as well as in the RLA group. In contrast, within the RHA strain the factor Treatment followed by plasma prolactin level at day 14 was the best index of total fat content. Differences in expression levels within the NAc mostly explained variation in total food intake over 14 days, whereas the differences in expression levels within the VTA best explained variation in total RW activity. In turn, combinations of differences in VTA expression levels and total RW activity explained variation in AUCgluc, insulin sensitivity index, and β-cell sensitivity index. Apart from Treatment being an important factor explaining variation in total adiposity in the RHA strain, it is remarkable that neither Strain nor Treatment was important to explain variation in any of the other dependent factors.
Discussion and conclusions
The main outcome of the present study is that RHA and RLA rats differ substantially in their susceptibility to OLZ-induced weight gain. Only the RHA strain showed increased weight gain related to increased fat accumulation in several depots by OLZ treatment versus control (saline) treatment. Reduced locomotor activity without a simultaneous reduction in energy intake may have contributed to this effect. Furthermore, the increased OLZ-induced weight and adiposity accumulation in the RHA strain was associated with a reduction in glucose tolerance during an IVGTT, an effect that was not observed in the RLA strain. Thus, our findings demonstrate that rats of the RHA strain, which represents a rat model for schizophrenia (Corda et al., 1997; D’Angio et al., 1988; Driscoll, 1986; Oliveras et al., 2015; Río et al., 2014; Steimer et al., 1997), experience more profound metabolic side-effects from treatment with the antipsychotic OLZ than those of the RLA strain.
The switch from regular chow to MF diet itself revealed marked differences between the RHA and RLA strain, with a larger increment in food intake and RW activity displayed by the RLA rats versus the RHA rats. This is a pattern that we have seen previously in male rats from the same strains (Boersma et al., 2012). In the present study, OLZ treatment has a tendency to reduce caloric intake in the RLA strain and caused a profound reduction in RW activity, which apparently balanced energy homeostasis yielding no differences in body weight or adiposity level between the control and OLZ treated RLA groups. In the RHA strain, however, OLZ also induced a profound reduction in RW activity, but this was not accompanied by a reduction in total food intake. Together with other metabolic effects (Boyda et al., 2014; Evers et al., 2010; Girault et al., 2014), this most likely led to a relative increase in adiposity in the RHA strain (albeit that the RLA rats were generally heavier than the RHA rats). Important for consideration of our data is the fact that the rats in the present study had access to RWs over the course of the experiment, whereas in other studies they do not, which may have reduced the obesogenic properties of OLZ (Boyda et al., 2012; Weston-Green et al., 2011).
In the present study, OLZ treatment caused a reduction in the β-cell sensitivity index irrespective of strain. Capping of the insulin response by OLZ is in line with the work of Chintoh et al. (Chintoh et al., 2008b), and could have been caused by a direct effect of OLZ on the pancreas to limit insulin secretion (Chintoh et al., 2008a; Johnson et al., 2005), or indicate that a central component was involved in this effect (Hahn et al., 2014). While we did not find differences between the strains with respect to an OLZ-induced inhibition of β-cell responsiveness, an increase in the insulin resistance index was specifically found in the RHA rats that were treated with OLZ. The OLZ-induced increase of insulin resistance in the RHA strain may very well be a consequence of increased adiposity, in particular by accumulation of the visceral compartment (Masuzaki et al., 2001). Insulin resistance is usually compensated by hyperinsulinemia to maintain euglycemia (Rabinowitz and Zierler, 1962), but this was apparently not sufficient in the RHA rats treated with OLZ, due to possible inhibitory effects on insulin secretion as mentioned earlier. These data seemingly contradict with the outcome of the HOMA index (i.e. another surrogate marker for insulin resistance, based on basal circulating glucose and insulin levels), with HOMA being reduced by OLZ treatment in RHA rats versus non-treated RHA rats. The HOMA index, however, has been related primarily to the insulin-mediated inhibition of hepatic glucose production rather than changes in peripheral insulin sensitivity (Abdul-Ghani et al., 2006). This relates to the data of Albaugh et al. who observed lower basal insulin and glucose levels following OLZ treatment (Albaugh et al., 2006) and connected this result to a switch in fuel utilization from carbohydrates to FFAs (Albaugh et al., 2012). Collectively, these data suggest that OLZ under the given conditions causes minor peripheral insulin resistance selectively in the RHA strain, which was insufficiently compensated by an increased insulin response under hyperglycemic conditions and resulted in increased circulating glucose levels only in this group.
Besides the ingestive and locomotive changes underlying OLZ-induced weight gain in the RHA group, there are neuroendocrine factors that may either reflect or are causal to these changes. The fact that the estrus cycle has not been measured in this cohort, however, cannot rule out that the individual hormonal cyclicity affected part of the results of our study. The latter category may encompass prolactin, of which the circulating level increased three-fold by OLZ treatment in the RHA strain, but not in the RLA strain, although the RLA strain had higher baseline plasma prolactin levels before treatment. Furthermore, increases in systemic prolactin levels can stimulate weight gain through the reduction of fat metabolism (Le et al., 2011) and augment food intake in female rats (Heil, 1999; Noel and Woodside, 1993; Naef and Woodside, 2007). Hyperprolactinemia may have contributed to the adipogenic phenotype specifically in the OLZ-treated RHA rats, but clearly not in the RLA rats (i.e. prolactin levels were not affected by OLZ treatment in the RLA strain). Consistent with the above-mentioned mechanisms in the RHA strain was the outcome of the regression analysis showing that (after removal of Treatment as a fixed factor) 74% of the variation in total fat content was explained by prolactin levels in a positive direction, a relationship that was not observed in the RLA strain. Prolactin is secreted from the anterior pituitary and its secretion is inhibited by D (Ben-Jonathan and Hnasko, 2001). One may argue that the lower basal prolactin levels in the RHA strain opposed to the RLA strain is a sign of increased dopaminergic neurotransmission at baseline (Gold et al., 1979). Antagonism of Drd2 receptors by OLZ at the level of the anterior pituitary may potentially be more effective in removing the dopaminergic inhibition on basal prolactin secretion in the RHA strain, which is consistent with the observed three-fold elevation in circulating prolactin levels explicitly in the RHA-OLZ treated group. The observed lower prolactin levels in the RHA strain in non-treated rats reflects the work of Steimer et al. (1997), who also found lower prolactin levels in the RHA selection line (Steimer et al., 1997). This finding of lower basal prolactin levels in combination with hyperprolactinemia in the RHA strain due to OLZ treatment relates to other observations in humans revealing a link between the Drd2 receptor mutations and the susceptibility to OLZ-induced hyperprolactinemia (Houston et al., 2010, 2011). Like prolactin, also the release of thyroid stimulating hormone (TSH) is inhibited via Drd2 receptors at the levels of the adeno-pituitary. In line with the current data it was shown that healthy male subjects with comparatively low baseline TSH levels – but within the normal range – displayed increased weight gain when treated with OLZ (Evers et al., 2016). Unfortunately, no data was obtained on basal TSH level during this study to replicate and compare this effect between species.
In addition to the presumed increased dopaminergic control on prolactin secretion at the level of the pituitary, the RHA strain is known for its increased mesolimbic dopaminergic activity, presumably underlying its increased impulsivity, ethanol intake, amphetamine-induced stereotypic behavior, and vulnerability to drugs of abuse (Giorgi et al., 2005a,b; Guitart-Masip et al., 2006a; Moreno et al., 2010); a phenotype that resembles schizophrenia. The data in this study showing increased expression levels in the RHA strain compared to the RLA strain of mRNA encoding for dopamine receptors in the NAc and PFC, and of TH (i.e. the rate-limiting enzyme for production of dopamine) expression in the VTA are consistent with this. The relative higher gene expression level of the Drd1 in the NAc corresponds with previous observations by Guitart-Masip et al. (Guitart-Masip et al., 2006b), although in contrast to our data their study did not find a difference in NAc Drd2 binding activity between both strains. The higher Drd1 mRNA expression levels observed in the PFC of the RHA strain confirms the homology between the RHA and the drug-naïve schizophrenic patient population, who also show an increase in PFC Drd1 expression (Abi-Dargham et al., 2002). In this respect there are two points that deserve attention: (a) OLZ caused a significant down-regulation of dopamine-receptor1 (Drd1) and dopamine-receptor2 (Drd2) mRNA expression in the NAc of the RHA rats, but not of the RLA rats; (b) the stepwise regression analysis revealed that differences in the expression of TH in the VTA of RHA rats, but not of RLA rats, were negatively correlated to the AUCgluc as well as the insulin sensitivity index during the IVGTT. Despite the similar OLZ-induced reduction in expression of the dopamine transporter in the VTA (VTA-DAT; i.e. which level appeared to be positively correlated to the β-cell sensitivity index in both strains, potentially highlighting the stimulatory effect of insulin on VTA-DAT; Figlewicz et al., 1994), the data collectively indicate that the mesolimbic dopaminergic activity was down-regulated by OLZ more profoundly in the RHA than in the RLA strain, which (based on the regression analysis) was related to disturbances in glucose homeostasis in the RHA strain. Due to the observation that fluctuations in VTA TH mRNA expression in the RHA strain were also strongly linked to total RW activity over the 14-day treatment period, it may be speculated that mesolimbic dopaminergic activity, glucose homeostasis, and locomotor behavior are tightly linked. The causality between these factors in the RHA strain are not known, but recent data suggests that local mesolimbic insulin resistance may play a role in this process (Hryhorczuk et al., 2016; Kleinridders et al., 2015).
Low mesolimbic D activity has also been postulated to be related to increased susceptibility to DIO, as was noted in a study by Alsiö et al. (2010). In their study, in which DIO-prone Sprague-Dawley rats had lower NAc Drd1 mRNA expression compared to DIO-resistant Sprague-Dawley rats, the intake of a high fat/high sugar palatable diet was calorically matched to regular chow intake. From this study it could be deduced that not the calories but the palatability of the diet influenced NAc Drd1 expression, but primarily in the DIO-prone rats (Alsiö et al., 2010). This relates to the lower NAc Drd1, as well as Drd2 mRNA expression observed in the DIO-prone RLA rats. However, OLZ treatment increased reduced NAc Drd1/2 mRNA expression only in the RHA strain, whereas this was associated with increased adiposity it did not result in increased food intake characteristic of a DIO-prone phenotype. Nonetheless, the expression of NAc Drd1 mRNA in the present study was negatively correlated to total food intake only in the RHA rats. In relation to these findings, Geiger et al. (2009) also demonstrated a link between dietary obesity and deficits in dopaminergic neurotransmission, concluding that obese animals increase eating palatable food to compensate for depressed D activity (Geiger et al., 2009). This association is also acknowledged by a study of Rada et al. (Rada et al., 2010) in which the dynamic nature of the mesolimbic D pathway was highlighted and also found reduced dopaminergic activity in DIO rats. These findings relate to the increased palatable diet intake in the RLA compared to the RHA at day −1 prior to drug treatment, which has also previously been observed by Boersma et al. (Boersma et al., 2010) and Alsiö et al. (Alsiö et al., 2010). Important for consideration of these data is the observation that schizophrenic subjects who develop the most severe increases in body weight and associated metabolic co-morbidities during OLZ treatment generally also show the highest relief of symptoms of schizophrenia (Kinon et al., 2005). In this respect, it is of interest to note that the Otsuka Long-Evans Tokushima Fatty (OLETF) rat (i.e. which is a DIO/insulin resistance rat model based on the lack of the cholecystokinin (CCK)-A receptor) have a down-regulation of the mesolimbic dopaminergic pathway too (Anderzhanova et al., 2007). Interestingly, in humans, polymorphism of the CCK-A receptor is among the strongest factors associated with schizophrenia (Cáceda et al., 2007). The antipsychotic potential of CCK-A receptors (based on prepulse inhibition) has indeed been recognized in the past (Feifel et al., 1999). This relates to the finding that the expression pattern of CCK levels over multiple brain areas differs between the RHA and RLA as well and this difference has been linked to the RHA’s predisposition for alcoholism (Guitart-Masip et al., 2006a). Combined, these data give a perception of a positive correlation between individual differences in dopaminergic neurotransmission and the susceptibility of antipsychotic weight gain. Recent meta-analysis data gathered by Zhang et al. (2016) revealed comparable associations as our study in which an association is described between antipsychotic-induced weight gain susceptibility and Drd2 and 5-HT2C single nucleotide polymorphisms (Zhang et al., 2016). Comparable to the generally lower expression levels of D receptors in the mesolimbic regions of RLA versus RHA rats, also the expression of a number of serotonin receptors was reduced. Similar to others (Giorgi et al., 2005a; Klein et al., 2014), we found that the expression of serotonin receptors at the level of the PFC is higher in the RHA compared to the RLA strain. This further fits the observations by Piras et al. (2010, 2014) that selective serotonin reuptake inhibitors (SSRIs) are effective antidepressants in the RLA strain but have no or little effect in the RHA strain (Piras et al., 2010, 2014). Comparable with the current study, it is a clear example of the individual variation in responsiveness to neuroleptic drug treatment.
Interestingly, recent data (Oliveras et al., 2017) also shows a difference in responsiveness of the RHA and RLA strains to antipsychotic drug treatment. Oliveras et al. (2017) revealed that only the RHA rats are responsive to the typical antipsychotic haloperidol (Drd2 antagonist) in reducing prepulse inhibition (PPI). The a-typical antipsychotic clozapine did not show any difference in efficiency to reduce PPI between the RHA and RLA strains. The latter may be explained by the fact that PPI is dependent on dopaminergic neurotransmission and clozapine is predominantly a 5-HT2C antagonist with less affinity to the D receptors compared to OLZ (Selent et al., 2008).
As mentioned earlier, OLZ-induced severe body weight gain is associated with an improvement especially of the positive symptoms of schizophrenia (Kinon et al., 2005). Positive symptoms of schizophrenia include, among others, hallucinations and delusions and have been related to abnormal D functioning (Howes et al., 2012). In this line of thought, weight gain susceptibility may serve as a marker for drug responsiveness as well as changes in central receptor expression. Here we show that the susceptibility for OLZ-induced weight gain differs between rat strains selected on a different behavioral trait and that this weight gain is related to a difference in central dopaminergic receptor gene expression and basal circulating prolactin levels. These results correspond with the previously suggested possibility of using low basal circulating TSH levels as a predictor of weight susceptibility following OLZ treatment (Evers et al., 2016). Here, we add prolactin as another circulating hormone that is under dopaminergic regulation and is – prior to OLZ treatment – lower in the weight-gain susceptible group and like TSH increases specifically in the weight gain susceptible group following 14 days of OLZ treatment (Evers et al., 2016). Altogether, our data underscores the value of studying individual variation in drug responsiveness via selection strains, but above all it gives us the opportunity to study the underlying mechanisms of why some individuals gain so much weight on antipsychotics like OLZ whereas others do not. Studying antipsychotics in these selection strains will furthermore improve the face validity of translational studies to the patient population. Finally, these studies may lead to strategies focused on attenuating OLZ-induced weight gain and disturbances in glucose homeostasis by using neuroendocrine markers predictive for weight gain. This is especially relevant because, unfortunately, those who are most susceptible to OLZ-induced weight gain seem to benefit most of OLZ treatment at the level of reduced psychotic symptoms (Kinon et al., 2005).
Footnotes
Acknowledgements
The authors would like to thank J Bruggink for his technical support, i.e. surgery and plasma analyses; MM Adema, and JC Graver for their valuable support in daily animal care and data collection. The following author contributions were made: SSE collected data, performed data analyses, set up hypotheses, and wrote the manuscript. GJB performed and analyzed all mRNA expression data and edited the manuscript. KLT supported mRNA expression analyses and edited the manuscript. AJWS helped setting up the experiment and hypotheses, and edited the manuscript. GvD analyzed the results, set up hypotheses and wrote/edited the manuscript.
Declaration of conflicting interests
The author(s) declared no potential conflicts of interest with respect to the research, authorship, and/or publication of this article.
Funding
The author(s) disclosed receipt of the following financial support for the research, authorship, and/or publication of this article: This work was financially supported by the framework of the Dutch Top Institute Pharma project T2-105.
References
Supplementary Material
Please find the following supplemental material available below.
For Open Access articles published under a Creative Commons License, all supplemental material carries the same license as the article it is associated with.
For non-Open Access articles published, all supplemental material carries a non-exclusive license, and permission requests for re-use of supplemental material or any part of supplemental material shall be sent directly to the copyright owner as specified in the copyright notice associated with the article.