
Abstract
Background:
Negative expectancies can exacerbate withdrawal symptoms via the nocebo effect. As such, information provided about dose reductions during attempts to taper a drug could contribute to withdrawal symptoms and increase the likelihood of relapse. The current study tested whether blinding participants to dose reductions during a supervised caffeine dose taper reduced these nocebo-induced withdrawal symptoms.
Methods:
Three groups of moderate to heavy coffee drinkers had their dose of caffeine reduced (tapered) from 300 mg per day to 0 mg over the course of five days and reported withdrawal symptoms twice daily. Groups were given differing information about how much caffeine they were receiving. An Open Reduction group was given accurate information about dose reductions. A Blind Reduction group was given no dose information whatsoever. A Deceptive Reduction group was misinformed about dose, with instructions suggesting that the dose remained on 300 mg for three days then dropped to 0 mg.
Results:
The Open Reduction group reported more pronounced caffeine withdrawal symptoms than the Deceptive Reduction group on the days with the greatest discrepancy between actual dose and informed dose, indicating a nocebo effect of open versus deceptive reductions. In addition, the rate of increase in reported withdrawal symptoms in the Blind Reduction and Deceptive Reduction groups was less than that of the Open Reduction group.
Conclusion:
These results suggest that awareness of dose reductions during a dose taper can result in a nocebo withdrawal effect, and that removing this awareness can reduce withdrawal. This has important implications for standard supervised dose-tapering practice, where patients are aware of the timing and magnitude of dose reductions.
Introduction
Drug addiction exacts a heavy toll – on the individuals who suffer from it, their families, and the society in which they live. The National Institute on Drug Abuse estimates that, in North America alone, the costs related to crime, lost work productivity, and health care from abuse of tobacco, alcohol, and illicit drugs total US$712 billion (NIH, 2016). Drug addiction is notoriously difficult to treat, with high relapse rates following treatment reported for a range of drugs (Allsop and Saunders, 1989; Dimeff and Marlatt, 1998; Gossop, 1989; Mulé, 1984; Prochaska et al., 1991). Given the global disease burden of addiction, it is important to identify interventions that can improve addicted individuals’ chances of quitting. Targeting the negative expectancies that can exacerbate withdrawal may offer a cheap and ethical means of improving the outcome of existing treatments.
Medical treatments typically have two components, the direct effects of the treatment itself (the treatment effect), and the effects of knowing that the treatment has been administered (the placebo effect) (Benedetti et al., 2003a, 2011). The type of placebo effect that is elicited by a treatment depends primarily on the beliefs that individuals hold about the likely effects of that treatment. These beliefs – known as expectancies – can be derived from verbal information, direct experience with the treatment, and social observation (Bandura, 1977; Colagiuri et al., 2015; Colloca and Miller, 2011).
Evidence from the placebo literature suggests that when someone expects discontinuation of a treatment to result in negative outcomes, these expectancies can cause negative placebo (or nocebo) effects (Benedetti et al., 2006; Colagiuri et al., 2012; Colloca et al., 2008; Flaten et al., 1999). For example, Benedetti and colleagues (2003b) interrupted the dose of intravenous morphine given to patients recovering from throat surgery and found that those patients who were made aware that their dose was being interrupted showed a higher rate of increase in pain than patients who had their morphine interrupted surreptitiously.
When individuals addicted to a drug discontinue that drug or have their dose substantially reduced, they too expect negative effects, in the form of withdrawal symptoms (Huntley and Juliano, 2012; Zvolensky et al., 2018; Zywiak et al., 1996). Several studies have demonstrated that withdrawal symptoms are reduced when abstinent users believe they have consumed their drug of choice, independently of actual drug consumption (Darredeau and Barrett, 2010; Gottlieb et al., 1987; Juliano and Brandon, 2002; Mills et al., 2016, 2017). These placebo withdrawal-reduction effects indicate generally that withdrawal symptoms can be influenced by beliefs about how much of a drug has been consumed. However, recent evidence indicates that placebo and nocebo effects are not necessarily interchangeable (e.g. Colagiuri and Quinn, 2017). Therefore it is important to directly test whether the knowledge of dose reductions leads to increased withdrawal symptoms. Only one previous study has attempted to test this. However, it found that being aware of the timing and magnitude of dose reductions reduced withdrawal compared to a group that was given no dose information (Stitzer et al., 1982), the opposite of Benedetti and colleagues’ (2003b) result.
It is difficult to know what to make of these contradictory results – one from the placebo literature and one from the addiction literature. Complicating matters is the fact that both studies have limitations. Benedetti and colleagues (2003b) study was limited in its ability to inform us about nocebo withdrawal symptoms because participants were not addicted to the drug being tested. Stitzer et al. (1982), on the other hand, did use a sample of addicted individuals; however, several participants tested positive for outside opiate use, meaning that the observed between-group differences may have been due to differences in the dose of drug rather than differences purely in dose information. The end result of these contradictions and limitations is that it is not clear whether awareness of dose reductions leads to nocebo withdrawal in addicted individuals.
Our study tested whether blinding participants to dose reductions leads to less severe withdrawal symptoms. To do this we chose a procedure that is common in clinical practice to assist addicted individuals to transition off drugs – the medically supervised dose taper. Dose tapering involves reducing an individual’s dose of a drug in stages over time. The rationale is that small reductions in dose minimise withdrawal symptoms at any single time point (Greenland et al., 1998; Kaplan and Sellers, 1984) and decrease chances of relapse (Krabbe et al., 2003), although whether the latter is true can depend on the drug and length of the period-to-relapse being measured (Lindson-Hawley et al., 2016; Ling et al., 2009). A dose taper can be self-administered (e.g. a smoker purchasing nicotine patches that contain progressively lower doses), or supervised by a third party (e.g. the doctor and pharmacist dispensing steadily lower doses of methadone). It is not possible for a patient to blind themselves in a self-administered taper, but blinding is possible in a supervised taper. If blinding participants to the timing and magnitude of dose reductions reduces their ability to anticipate withdrawal, then it could reduce the nocebo component of withdrawal and improve chances of a successful taper..
In this study we compared withdrawal during a supervised dose tapering procedure in three groups with identical dose reduction schedules but differing dose information. We compared a group who were aware of the true dose reduction schedule (Open Reduction Group) with two groups given other types of dose information: one that was given no information (Blind Reduction Group) and another that was given inaccurate information (Deceptive Reduction group). We used caffeine, a non-selective adenosine antagonist, as the addictive substance with which to model nocebo withdrawal. There are several benefits to using caffeine to model withdrawal: (a) it has a well-proven pharmacological withdrawal syndrome (for a review see Juliano and Griffiths, 2004) that is also sensitive to expectancy effects (Dews et al., 1999; Rubin and Smith, 1999; Smith, 1996), (b) it is consumed on a daily basis by 80–90% of the adult population (Hughes and Oliveto, 1997), thus facilitating recruitment, and (c) its use is largely free from the negative financial and social repercussions associated with the use of illegal drugs. This freedom makes it possible for experimenters to use misinformation techniques that more accurately model real-world placebo and nocebo effects (Kirsch and Rosadino, 1993; Kirsch and Weixel, 1988), but which would be unethical if used in a clinical population.
Method
Design
The order of events in the study is presented in Figures 1 and 2.This study used a mixed between- and within-subjects design. The between-subjects factor was a three-level variable, Dose Information (Open Reduction vs Deceptive Reduction vs Blind Reduction), and the within-subjects factor was a four-level factor, labelled Time. The Time variable was an index of the dosing trajectory – the schedule of dose reductions – across the test period. Participants’ dose of caffeine was reduced by 100 mg each day, starting from 300 mg on the first day (always a Monday). The outcome variable in this study was caffeine withdrawal, as measured by the Caffeine Withdrawal Symptom Questionnaire (CWSQ; Juliano et al., 2012).
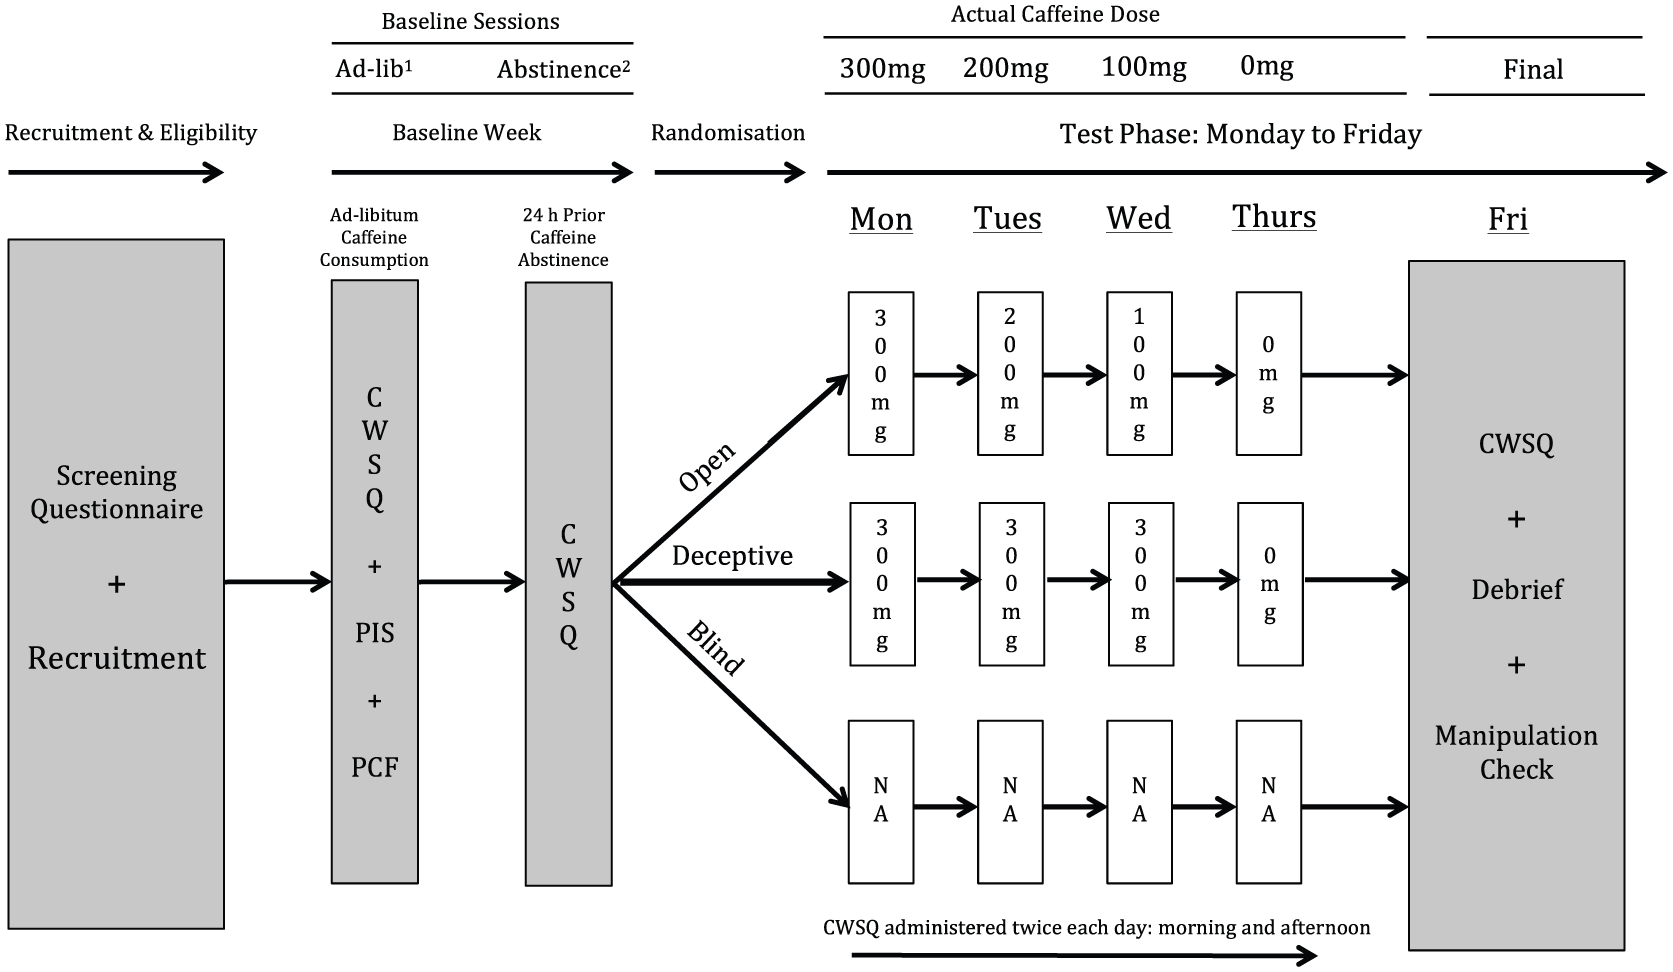
Study flow diagram. White boxes indicate the dose the participant was told they were receiving. Actual dose of caffeine administered to all participants is indicated at top of figure. Order of ad-libitum and abstinence baseline sessions was counterbalanced across subjects and groups. CWSQ: Caffeine Withdrawal Symptom Questionnaire; PIS: participant information statement; PCF: participant consent form.
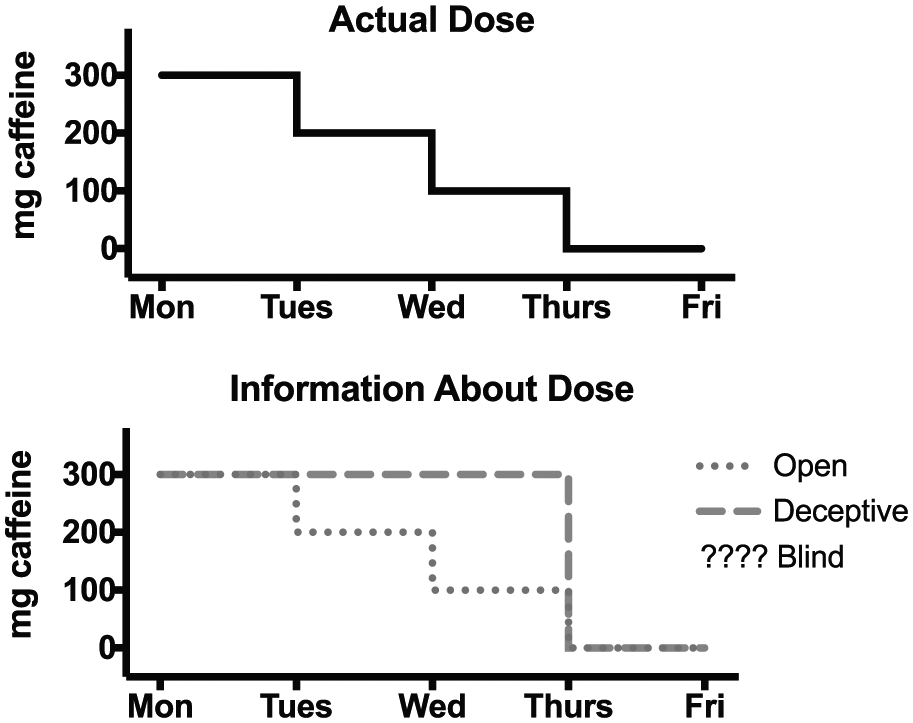
Actual dose reduction schedule vs dose information provided to groups. The Blind Reduction group received no dose information and therefore have no corresponding dose information to graph against time.
Participants
Participants were 48 adults (31 female; mean age=20.8, age range=18–40 years) who participated in exchange for course credit (n=44) or for AUD$100 (n=4). Participants were included in the study if they consumed at least 270 mg (⩾3 ~200 ml cups of coffee) per day, were 18 years of age or over, and had sufficient written and verbal English skills. Participants gave informed consent to take part in a study investigating the effect of caffeine dose on mood, but were fully debriefed as to the study’s true purpose upon completion.
Based on group sizes in two previous studies conducted in our laboratory (Mills et al., 2016, 2017) and on what could realistically be expected from a study with stringent exclusion criteria that required 11 visits, we decided that 20 participants per group would be sufficient to detect differences in patterns of CWSQ scores across groups. Recruitment was halted at 15 per group due to slow sign-up rates and a need to finish the study.
Materials and measures
Demographics and Caffeine Use Questionnaire
Participants’ demographic information and daily caffeine consumption were ascertained via a computer-based questionnaire (see Supplementary Material 1). Estimates of caffeine content of beverages were obtained from Barone and Roberts (1996) or from content listed on packaging by the manufacturer.
Drinks
Coffee was prepared in a DeLonghi Magnifica Automatic Coffee Machine using Peet’s Major Dickason’s Blend decaffeinated coffee beans. These beans contain approximately 4% of the caffeine content of regular caffeinated coffee beans, amounting to 4 mg or less of caffeine per 7–9 g ‘shot’ of blended beans (estimate obtained from correspondence with the manufacturer).
Caffeine/lactose powder
Caffeine dose was administered via 100% USA pharmaceutical grade anhydrous caffeine powder (1,3,7-trimethylxanthine; molecular formula–C8H10N4O2) obtained from the Melbourne Food Depot.
Scales
Caffeine/lactose powder was weighed on AND brand electronic scales (Model GF-300). These scales have an illuminated display indicating weight that is easily visible at close range.
CWSQ
A computer-based version of the CWSQ (Juliano et al., 2012) was used to assess withdrawal symptoms. This 32-item version of the scale is arranged in nine separate factors: drowsiness/fatigue; decreased alertness/difficulty concentrating; mood disturbances; decreased sociability/motivation to work; nausea/upset stomach; flu-like feelings; headache; acute caffeine effects; and craving. Participants were asked to rate to what extent they were experiencing each symptom on a five-item response scale from zero (‘not at all’) to four (‘extremely’). The maximum possible score was 128. See Supplementary Material 2 for the full CWSQ scale.
Exit Questionnaire/manipulation check
A computer-based Exit Questionnaire was given to all participants at the final experimental session (see Supplementary Material 3). It contained questions about: (a) history of daily caffeine consumption, (b) number of previous quit attempts, (c) compliance with the abstinence condition, and (d) awareness of deception (this did not apply to the Blind Reduction group).
Procedure
Recruitment
Student participants were recruited via the University of Sydney’s first-year Psychology Research Participation Scheme and paid participants via advertisements placed on the University of Sydney careers website (see Supplementary Material 4). Advertisements requested participants for a study testing the effect of caffeine dose on mood. No mention was made of dose reductions, ensuring that the Blind Reduction group had no expectation of having their dose reduced.
Measures were taken to ensure honest reporting of daily caffeine consumption:
Student participants could only see the advertisement if they indicated in a screening questionnaire taken at the commencement of semester (i.e. prior to being aware of the study) that they consumed three or more cups of coffee per day.
Paid participants: the advertisement for paid participants made no mention of how many cups per day were required to qualify for the study. In the email they were required to send to register their interest, paid participants were asked to indicate how many cups of coffee they drank on an average weekday.
Baseline week
The study took place over two weeks: a baseline week, and a test week. In the baseline week participants were required to attend an ad libitum baseline session and an abstinence baseline session prior to 12:00 on any two days during the week. The order of these two sessions was counterbalanced across the study. Before the ad libitum baseline session, participants were required to drink coffee as they normally would on an average weekday. Before the abstinence baseline session participants were told they were required to abstain from all sources of caffeine for 24 h. In order to enhance compliance with this requirement, a ‘bogus-pipeline’ procedure was used (Murray et al., 1987). Participants were told that their saliva would be collected at the abstinence baseline session and tested for presence of caffeine. However, while saliva was collected at this session, it was not analysed in any way.
Upon arrival at the first baseline session, participants were told that they were taking part in a study testing the effects of caffeine dose on mood and other symptoms. Participants were told that during the test week they were to consume no caffeine other than that supplied to them by researchers. Participants then had the purpose of the study explained to them and were given a participant information statement (PIS) to read. The PIS contained information about the purpose of the study, eligibility criteria, and study requirements (e.g. attendance and abstinence from all caffeine during the test period) (see Supplementary Material 5). Instructions contained in the PIS and given verbally at baseline sessions were identical for all participants. Importantly, no mention was made of dose reductions. After giving their consent to take part in the study participants completed the Demographics and Caffeine Use Questionnaire and CWSQ and were allowed to leave.
Upon arrival at the second baseline session participants completed a CWSQ questionnaire and were allowed to leave.
Test week
Participants were allowed to consume caffeine ad libitum until Sunday evening before the Monday of the test week, but then, from when they awoke on Monday morning until after their final session on Friday morning of the test week, they were required to abstain from all sources of caffeine other than that provided to them by experimenters. Participants were randomly allocated to their Dose Information group immediately prior to their arrival on Monday morning. Participants received their daily dose of caffeine via two cups of decaffeinated coffee – one in the morning and one in the afternoon – with anhydrous caffeine powder and lactose powder added. Daily dose was administered over two cups instead of a single large dose so as to simulate the way coffee is consumed by most people, i.e. by having multiple cups throughout the day. The first dose (morning) had to be consumed before 12:00 and the second (afternoon) after 12:00, with a minimum three-hour gap between doses. Caffeine withdrawal was measured via CWSQ questionnaire in both the morning and afternoon sessions. All participants’ actual dose reduction schedule was the same: Mon-300 mg; Tues-200 mg; Wed-100 mg; Thurs-0 mg; Friday-final day/no dose. On Monday morning upon arrival at their first test session participants were informed of their dose schedule for the week. The dose information given to the Open Reduction group matched the true dose reduction schedule. The Deceptive Reduction group were told that they would be receiving the following schedule: Monday-300 mg; Tuesday-300 mg; Wednesday-300 mg; Thursday-0 mg; Friday-final day/no dose. If they were allocated to the Blind Reduction group, they were told that they had been allocated to a control group and would receive no information about their dose.
A method of dosing was devised that allowed for actual dose of caffeine to be administered independently of dose information. At the beginning of each day, before participants arrived, the requisite caffeine powder for each day’s dose – which was the same regardless of group allocation – was measured and added to the bottom of empty coffee cups stacked on the table in the test room. The cups had white bottoms and the powder was white. This fact, combined with the height and position of the stack of cups, meant participants would have had to lean over the desk and peer into the cups at very close range in order to see the powder at the bottom of the cups. No participants were observed to do this.
The procedure for controlling dose information relative to actual dose was different across the three groups, as follows:
Open Reduction and Deceptive Reduction group, Monday–Thursday
When participants arrived for each session and began to complete their CWSQ questionnaire, their cup, containing the caffeine powder, was taken from the top of the stack and placed on the drip tray under the coffee dispenser. The machine was turned on and the automated process of grinding, filtering, and pouring the coffee initiated. While this process was taking place, lactose powder, which participants were told was caffeine powder, was taken from a resealable plastic pouch labelled ‘Caffeine Anhydrous, 200 gms’ sitting on top of the coffee machine and measured into a plastic ramekin sitting on the electronic scales in the testing room. The amount of lactose powder measured out in each cup on each day corresponded to the dose of caffeine participants were informed they were receiving. The weighing procedure took place in full view of participants. The electronic scales used were very close to participants and displayed weight in bright, easily visible numbers. This procedure allowed for the amount of white powder participants in the Deceptive Reduction group witnessed being deposited in their coffee cups each day to diverge from the actual dose of caffeine they received (for a labelled photo of the layout of the test room see Supplementary Material 6). Generally, participants completed the questionnaire before the coffee preparation was finished, but if they finished after coffee preparation, their coffee was not given to them until they had completed the questionnaire. On Thursday participants came in twice as usual and filled out a questionnaire, but were given no coffee.
Blind Reduction group, Monday–Thursday
The Blind Reduction group also visited twice each day and completed their questionnaires. However, once they had completed their questionnaire, they left the test room and sat on a chair outside while their coffee was prepared. In order to match as closely as possible, the taste of the coffee given to the other two groups, the Blind Reduction group had lactose powder added to their coffee in amounts closely matching the amounts given to the Deceptive Reduction group (i.e. two cups with 150 mg lactose per cup=300 mg lactose per day for the first three days).
It is important to note that at both visits on Thursday, the Blind Reduction group were given a cup of decaffeinated coffee, whereas the other two groups were given no beverage and simply completed their questionnaire. This cup of decaffeinated coffee had no caffeine added and contained 150 mg lactose powder. Thus, the procedure on Thursday for the Blind Reduction group was different from that of the Open Reduction and Deceptive Reduction groups. Giving the Open Reduction and Deceptive Reduction groups decaffeinated coffee without adding caffeine or lactose powder, while they were in the room, would have removed this difference. However, we chose not to do this, as we wanted to simulate as closely as possible the real-world difference between a blind-supervised dose taper (where patients can be transitioned to 0 mg without their knowledge by being given the drug vehicle only without any active drug) and a standard supervised taper (where patients stop taking both the active drug and the drug vehicle when they reach 0 mg).
All groups, Friday morning
At the final session on Friday participants completed a CWSQ questionnaire and the Exit Questionnaire. When they had completed the Exit Questionnaire, participants were asked: (a) if they had complied with the ‘no outside caffeine’ request during the test week; (b) if they suspected at any time before completing the Exit Questionnaire that their true dose of caffeine was different from the dose they were told they were receiving, and, if so, why they suspected it; and (c) general thoughts about the experiment and about the withdrawal symptoms they experienced. Participants were then debriefed concerning the true purpose of the experiment and, if they were in the Deceptive Reduction or Blind Reduction groups, were told their true dose reduction schedule and allowed to leave.
Data analysis
CWSQ data were analysed longitudinally using factorial mixed effect models for repeated measurement (MMRMs). MMRMs were selected because, unlike traditional mixed analyses of variance (ANOVAs), they generate maximum-likelihood estimates of the parameters of interest. All MMRMs had Dose Information as a categorical between-subjects factor, time as a categorical within-subjects factor, and participant ID as the random factor. Treating time as a categorical factor allowed for planned contrasts testing simple effects of group at each level of time to be conducted, as well as tests of linear trends via polynomial contrasts using least-squares means.
The first MMRM was used to test for any pre-existing group differences in CWSQ scores at the baseline sessions (abstinence and ad libitum) and on Monday morning. Custom contrast matrices within each MMRM were used to test for: (a) differences between these three baseline time points when averaged across groups and, (b) between groups within each time point. Each set of contrasts was corrected for type-1 error using the Westfall method, a step-down form of error correction that offers similar levels of protection against type-1 error to those of traditional single-step methods such as the Bonferroni procedure, but which is less conservative and therefore less likely to over-inflate p-values and conceal genuine effects (Bretz et al., 2016).
Data from the test week were split into morning CWSQ scores and afternoon CWSQ scores and each set of scores were analysed separately. Two MMRMs, one for morning scores and one for afternoon scores, tested group differences in CWSQ scores over the test week. Participants’ ad libitum and abstinence baseline CWSQ scores were included as covariates in these models so as to reduce the bias of group comparisons due to chance imbalances, thereby improving estimation of group effects (Crager, 1987; Frison and Pocock, 1992; Senn, 2006). Within each MMRM, custom contrasts were used to conduct two types of analysis. First, simple contrasts were used to test pairwise differences in CWSQ scores between all three groups at each time point, with total number of comparisons corrected for using the Westfall method. Second, orthogonal polynomial contrasts were used to estimate group differences in the rate of linear change in CWSQ scores across the test period. The Westfall method was used once again to correct for pairwise group comparisons of intercept and slope.
All the procedures in this study were approved by the University of Sydney Human Research Ethics committee and were conducted in accordance with the 1964 declaration of Helsinki.
Results
Exclusions
Data from three participants were excluded because of information provided in the Exit Questionnaire or in-person debriefing: caffeine consumption prior to the study by one participant was too low (three cups per week, not per day), another indicated they were suspicious that their dose information was inaccurate (‘psychologists are sneaky’), and another consumed caffeine during testing. This left 45 participants upon whose data analyses were performed. When questioned, no participants indicated that they had noticed any changes in their coffee’s taste during the test week.
Participants’ average daily caffeine consumption was 305.2 mg per day. All participants’ indicated that their principle source of caffeine was coffee. Average duration of daily caffeine use prior to enrolling in the study was 4.9 years and the modal number of quit attempts was one (mean=1.9). One-way ANOVAs indicated no significant differences across groups in any of these characteristics. Group averages for these variables are presented in Supplementary Material 7, Table 1.
Baseline data
There were no significant between-group differences at either abstinence baseline, ad libitum baseline, or on Monday morning (all ps>0.2). When averaged across groups, there was a highly significant difference in average CWSQ scores between the ad libitum baseline [M (SD)=26.4 (15.0)] and abstinence baseline [M (SD)=50.1 (18.1)] (estimated difference=23.73; t(84)=7.69; p<0.001; 95% confidence interval (CI)=17.83–29.64), indicating the sensitivity of the CWSQ to differences in withdrawal symptoms at different levels of caffeine consumption. There was also a highly significant difference in average CWSQ scores between the first measurement of the test week, Monday morning [M (SD)=42.1 (16.9)], and the ad libitum baseline (estimated difference=15.69; t(84)=5.09; p<0.001; 95% CI=9.78–21.59). Participants scored 8.00 points lower on Monday morning than at the abstinence baseline (estimated difference=8.04, t(84)=−2.61; p=0.009; 95% CI=−13.95– −2.14), suggesting that participants were experiencing lower withdrawals on Monday morning, following a day of ad libitum coffee consumption, than they were following 24 h of total caffeine abstinence. For results from baseline sessions see Supplementary Material 7, Figure 1.
Test week data
The results of the morning and afternoon MMRMs testing between-group differences in CWSQ scores across the test period are presented in Figure 3.
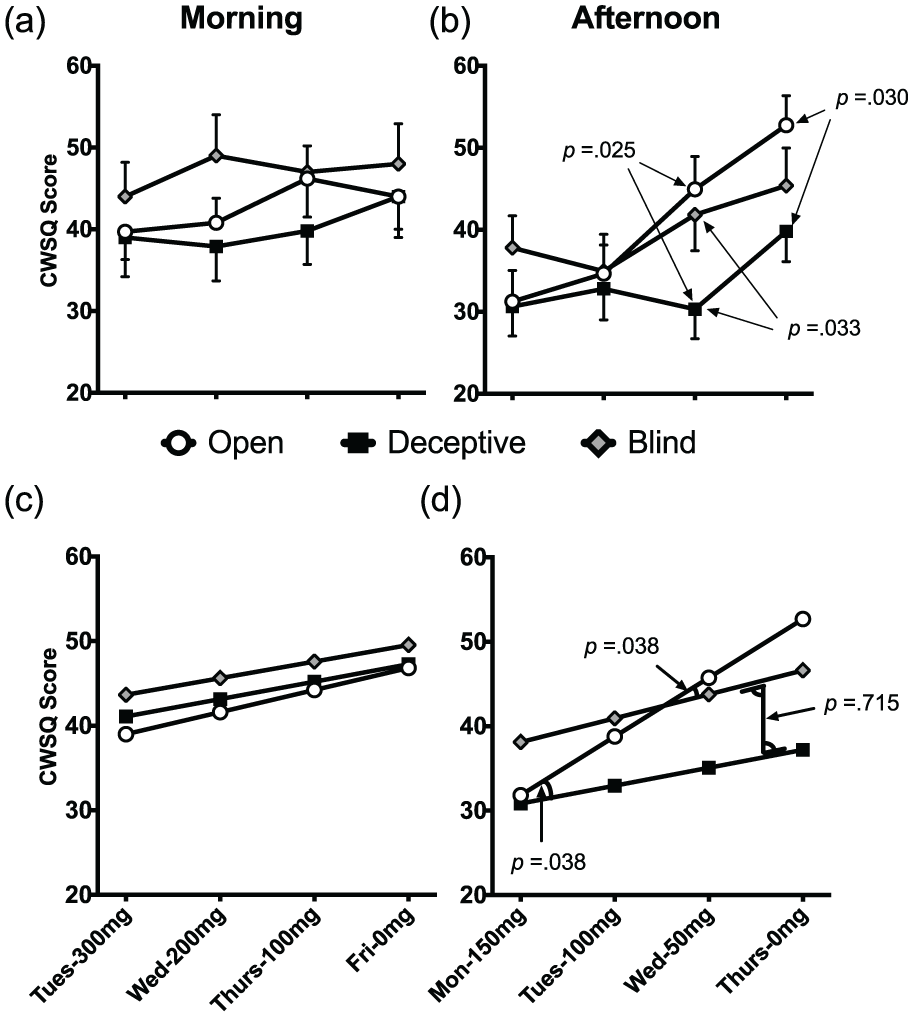
Change in caffeine withdrawal due to differing dose information.
Day-by-day comparisons: Figure 3(a) and (b)
In the morning sessions there were no significant differences between groups on any day during the test period (t=-0.01–1.67; p=0.223–0.994). In the afternoon, after correcting for multiple comparisons, there were significant differences on Wednesday, between the Open Reduction and Deceptive Reduction groups (estimated difference=−13.39; t(135)=–2.64; p=0.025; 95% CI=−25.42– −1.36) and between the Blind Reduction and Deceptive Reduction groups (estimated difference=-10.94; t(135)=–2.16; p=0.033; 95% CI=0.99–20.88), and on Thursday between the Open Reduction and Deceptive Reduction groups (estimated difference=−13.06; t(135)=–2.57; p=0.030; 95% CI=−25.09– −1.02). There were no other significant between-group differences at any individual time point. For full results table see Supplementary Material 7, Table 2.
Rate of change in withdrawal: Figure 3(c) and (d)
Morning
There were no significant between-group differences in rate of change in morning CWSQ scores across the four-day test period (all ts<1).
Afternoon
There were significant differences in estimated rate of change in afternoon CWSQ scores across the four-day test period. The estimated rate of increase in CWSQ scores in the Open Reduction group was an estimated 6.95 points per day (t(126)=5.04; p<0.001; 95% CI=4.22–9.68). The rate of increase in the Deceptive Reduction group was 2.12 points per day, a estimated rate of increase that was significantly lower than the Open Reduction group (estimated difference=-4.83; t(126)=-2.48; p=0.03; 95% CI=−9.46– −0.98). Importantly, the estimated rate of increase in the Blind Reduction group was 2.73 points per day, a rate of increase that was also significantly lower than the Open Reduction group (estimated difference=−4.12; t(126)=–2.11; p=0.038; 95% CI=−7.98– −0.25). The difference in rate of increase between the Blind Reduction and Deceptive Reduction groups was not significant (estimated difference=0.71; t(126)=0.37; p=0.715; 95% CI=−3.91–5.34). To provide estimates of between-group differences in the size of the total increase in CWSQ scores from Monday afternoon to Thursday afternoon, fitted means were calculated for each group based on intercept and slope coefficients from the afternoon MMRM. The Open Reduction group increased by an estimated 20.85 points from Monday to Thursday afternoon (CWSQ range 0-128); the Deceptive Reduction group 6.36 points (14.49 points less than the Open Reduction group); and the Blind Reduction group 8.49 (12.36 points less than the Open Reduction group). See Supplementary Material 7, Table 3 for full results table.
Discussion
In this study we administered moderate to heavy caffeine consumers an identical dose reduction schedule, while varying the information they received about their dose. The results indicated that withdrawal severity was affected by dose information. This was clearest for the Deceptive Reduction and Open Reduction groups, whose patterns of change in reported withdrawal across the study matched their dose information – or rather its inverse – quite closely (see Figure 4). Initially, on Monday and Tuesday, when these groups were receiving similar dose information, there were negligible differences in their withdrawal symptoms. However, as their dose information began to diverge more widely on Wednesday and Thursday, so did their reported withdrawal symptoms. Given that they received identical doses of caffeine, these day-to-day differences in reported withdrawal can only be explained by differences in expectancies. It is not clear from this comparison alone if these differences are due to the operation of a placebo effect in the Deceptive Reduction group, or a nocebo effect in the Open Reduction group, or both. Placebo effects are usually stronger when the information provided is unambiguous (Kirsch and Rosadino, 1993; Kirsch and Weixel, 1988). Thus, it was to be expected that these two groups would show the greatest differences in withdrawal.
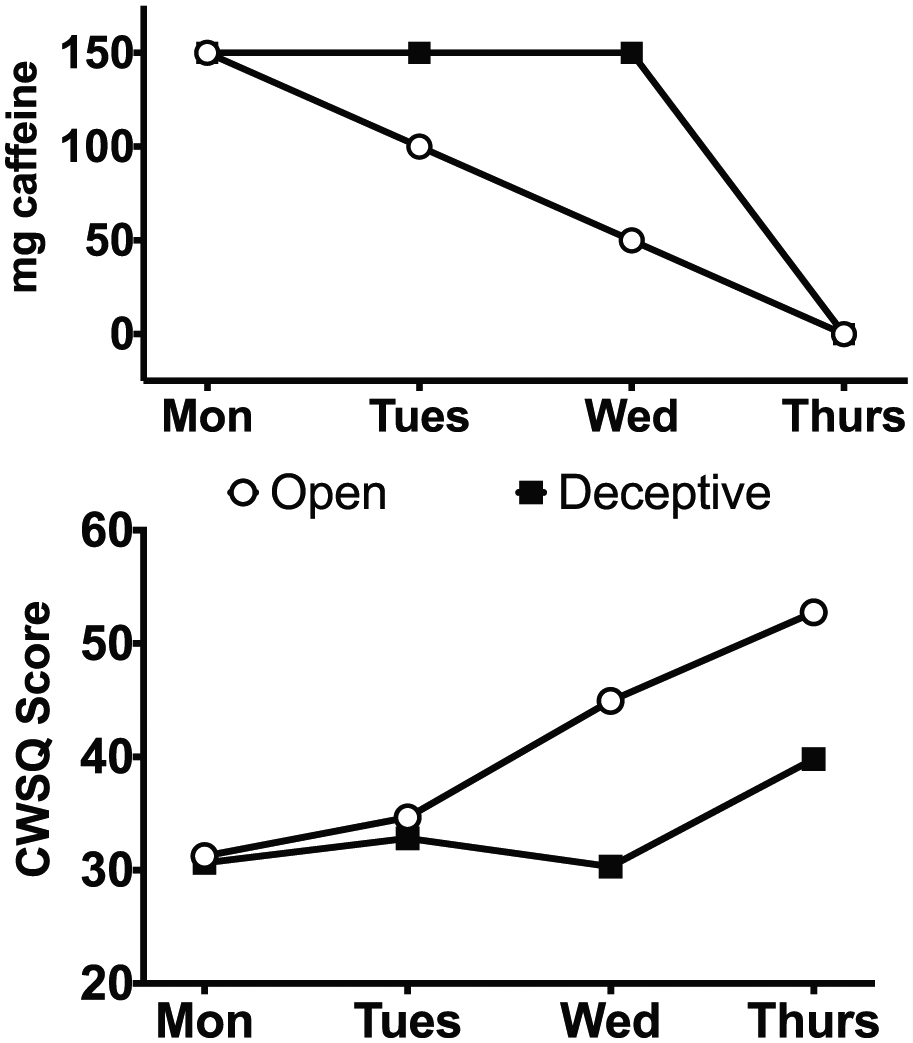
Dose information trajectory (in mg of caffeine per cup in morning of same day) and afternoon Caffeine Withdrawal Symptom Questionnaire (CWSQ) score trajectory across test days in Open Reduction and Deceptive Reduction groups.
While the differences between the Open and Deceptive Reduction groups are interesting from a theoretical standpoint, deceiving patients about their dose is not ethical in a clinical setting. The only ethically feasible real-world method of reducing nocebo withdrawal effects during supervised dose tapering is for the patient to agree, in advance and in consultation with their prescriber, that the staff responsible for dispensing the drug to the patient during the dose taper will keep the exact timing and magnitude of dose reductions hidden from the patient for the duration of the taper. The interesting result in this study from a practical standpoint was that, despite there being no significant differences between reported withdrawal in the Blind Reduction and Open Reduction group on any single day, the overall rate of increase in withdrawal in the Blind Reduction group was lower than in the Open Reduction group. This suggests two things: first, that being informed of the timing and magnitude of dose reductions leads to a nocebo withdrawal effect, and, second, that removing this information by blinding reduces this nocebo effect.
Voluntary blinded supervised dose tapering does occasionally occur in real-world clinical settings (Aegis Medical Systems, 2002; Lee, 2015); however, its effect on withdrawal symptoms compared to standard practice (i.e. open tapering) has not been studied systematically under controlled conditions. This study suggests the potential of voluntary blind dose tapers for transitioning off of any drug where there may be expectancies of negative effects following dose reductions.
The results of this study are also interesting from a theoretical standpoint as they support findings from the placebo literature, where awareness of dose reductions have been associated with nocebo effects (e.g. Benedetti et al., 2003b). The only study from the addiction literature that has tested the effects of dose expectancies during a supervised taper procedure reported the opposite outcome, that knowledge of dose reductions was associated with reduced withdrawal (Stitzer et al., 1982). The reason for the different findings in our study and theirs is unknown, but may be due to the fact that several participants in Stitzer and colleagues (1982) tested positive for outside use of opiates, which may have meant that actual dose was not identical across conditions. Another explanation is that caffeine withdrawal is more susceptible to placebo or nocebo effects than opiate withdrawal.
There was only one point of difference between the Blind Reduction and Deceptive Reduction groups: the Blind Reduction group reported more pronounced withdrawal on Wednesday afternoon. One explanation for this difference is that the Blind Reduction group’s lack of dose information led to more intense scrutiny of interoceptive signals, amplifying symptoms and causing a nocebo effect (Barsky et al., 1988, 1990) or, conversely, that the more certain information indicating a higher dose provided to the Deceptive Reduction group led to a placebo effect. The relative effect of uncertain versus certain dose information on withdrawal could be an important area of future study.
Why caffeine dose instructions produced differences in withdrawal in the afternoon but not in the morning is unknown. Caffeine takes 6–8 h to clear the body (Juliano and Griffiths, 2004). It is possible that in the mornings, when participants had not consumed caffeine for over 12 h, withdrawal was at a ceiling level upon which instructions about dose had very little effect.
An important point to note is that the dosing procedure in the Blind Reduction group was different on Thursday from the procedure in the Open Reduction and Deceptive Reduction groups, in that the Blind Reduction group received two cups of decaffeinated coffee when the two other groups did not. It may be that further exposure to cues associated with caffeine consumption, such as the taste and smell of coffee, caused a conditioned withdrawal reduction response on Thursday in this group that was not present in the other two groups, who received no coffee on this day. In addition this group received a very small amount of caffeine (~8 mg over the day). These differences compromise the internal validity of the study, as different processes were at work in the Blind Reduction compared to the two other groups on this day. All experimental studies that attempt to model real-world processes face the trade-off between internal and external validity. In this study, where our goal was to model the difference between a blind versus an open dose taper, we chose to favour the latter. In a real-world voluntary supervised blind dose taper patients can be transitioned to 0 mg without knowing exactly when the transition happens, as they can still be administered the vehicle for the drug without the active ingredient. In a standard open dose taper on the other hand, patients are aware of exactly when they reach 0 mg and stop taking both the drug and the vehicle. It was important to us to model this difference in process as faithfully as the constraints of the study allowed. For someone who has been using a drug habitually for a long time the mental barrier of reaching 0 mg is formidable. One of the strengths of the blind supervised dose taper is that patients can reach and pass this 0 mg barrier without knowing it and learn about it in retrospect– it is hard to imagine a more powerful demonstration that one can cope without a drug than finding out that one already has been coping.
There are a number of limitations to this study that could potentially affect its generalisability. First, the sample size was quite small, increasing the possibility that the differences observed between groups were due to type-1 error. This possibility was mitigated somewhat by the fact that participants were measured at multiple time points. Nevertheless, these results need to be replicated in a larger study. A second limitation is that dose expectancy conditions in the Blind Reduction group did not exactly match those that would exist in real-world supervised blind taper, where patients have a general awareness that their dose will be reduced, but a lack of specific knowledge of when and by how much. Third, caffeine withdrawal and addiction, though possessing the primary features of all addictive agents (e.g. tolerance and withdrawal) are relatively mild in comparison to more serious drugs. Fourth, the study was single-blind, with the same researcher conducting all testing and interacting with participants. Although efforts were made to standardise the delivery of information and other procedures, it is possible that unconscious researcher bias affected the results. Fifth, the taper that occurred in this study was more rapid than would typically occur with tapering procedures in a clinical setting. Finally, there was no objective testing of participants’ abstinence from outside sources of caffeine; during the debriefing one person did indicate that they had consumed outside caffeine, and was hence excluded, but it is possible that others consumed caffeine and did not inform us.
Despite many years of fruitful placebo research, it has proven challenging to translate what we know about the influence of expectancies into clinical interventions that are both ethical and practical. Voluntary supervised blind dose tapering is an intervention that acknowledges the potential negative impact that expectancies of withdrawal could have on treatment outcomes, and attempts to control for these expectancies. In a voluntary supervised blind-tapering procedure the patient would not be surrendering their autonomy. On the contrary they would willingly consent to having any verbal or environmental cues that might signal a dose reduction – and hence trigger a nocebo withdrawal response – removed in order to improve their chances of quitting.
It is difficult to establish the clinical significance of findings from a translational study where the outcome is a questionnaire score. The mean CWSQ score at ad libitum baseline was 26 points, and the highest possible CWSQ score is 128 points, suggesting a maximum range of 98 points for moderate to heavy coffee drinkers (though probably less given that scores of 128 points are unlikely). Compared against this 98-point range, the between-group differences in withdrawal scores of >12 points in our study suggest nocebo withdrawal effects of real impact.
The caffeine withdrawal syndrome is mild in comparison to more serious drugs. Therefore, how readily these findings generalise to different drugs and more prolonged dose tapers is unknown. However, if knowledge of dose reductions increases withdrawal from other drugs as it does from caffeine, our finding could have implications for all supervised dose-tapering procedures. Given the lasting damage that prolonged addiction can cause to the people who suffer from it, our findings at least suggest that the efficacy of voluntary blind dose tapers is worthy of systematic investigation in a large-scale study on a clinical population. If supervised blind-dose tapering were to prove effective at reducing withdrawal, it would have great potential as a treatment option; it would be cheap and easy to implement, involve no psychotherapy and, providing it is feasible to remove any cues signalling dose reductions, could easily be integrated into existing dose-tapering procedures.
Supplemental Material
JOP817158__supplemental_material – Supplemental material for The effect of dose expectancies on caffeine withdrawal symptoms during tapered dose reduction
Supplemental material, JOP817158__supplemental_material for The effect of dose expectancies on caffeine withdrawal symptoms during tapered dose reduction by Llewellyn Mills, Robert A Boakes and Ben Colagiuri in Journal of Psychopharmacology
Footnotes
Declaration of conflicting interest
The author(s) declared no potential conflicts of interest with respect to the research, authorship, and/or publication of this article.
Funding
The author(s) received no financial support for the research, authorship, and/or publication of this article.
References
Supplementary Material
Please find the following supplemental material available below.
For Open Access articles published under a Creative Commons License, all supplemental material carries the same license as the article it is associated with.
For non-Open Access articles published, all supplemental material carries a non-exclusive license, and permission requests for re-use of supplemental material or any part of supplemental material shall be sent directly to the copyright owner as specified in the copyright notice associated with the article.