
Abstract
Background:
The effects of panic disorder (PD) and pharmacotherapy on brain functional hubs in drug-free patients, and the utility of their degree centrality (DC) in diagnosing and predicting treatment response (TR) for PD, remained unclear.
Aims:
This study aimed to assess the effects of PD and paroxetine on brain functional hubs in drug-free patients and to identify neuroimaging biomarkers for diagnosing and predicting TR in patients with PD.
Methods:
Imaging data from 54 medication-free PD patients and 54 matched healthy controls (HCs) underwent DC and functional connectivity (FC) analyses before and after a 4-week paroxetine treatment. Diagnosis and prediction of TR models for PD were constructed using support vector machine (SVM) and support vector regression (SVR), with DC as features.
Results:
Patients with PD showed aberrant DC and FC in the anterior cingulum, temporal, and occipital areas compared with HCs at baseline. After treatment, DC of the patients increased in the calcarine cortex, lingual gyrus, and cerebellum IV/V, along with improved clinical symptoms. Utilizing voxel-wise DC values at baseline, the SVM effectively distinguished patients with PD from HCs with an accuracy of 83.33%. In SVR, the predicted TR significantly correlated with the observed TR (correlation coefficient (r) = 0.893, Mean Squared Error = 0.009).
Conclusion:
Patients with PD exhibited abnormal DC and FC, notably in the limbic network, temporal, and occipital regions. Paroxetine ameliorated patients’ symptoms while altering their brain FC. SVM and SVR models, utilizing baseline DC, effectively distinguished the patients from HCs and accurately predicted TR.
Introduction
Panic disorder (PD) is a common anxiety spectrum disorder characterized by sudden panic attacks lasting a few minutes and persistent worry for at least 1 month. The main symptoms of panic attacks include various autonomic nervous system dysfunctions with severe somatic distress, such as palpitation, sweating, tremors, and paranesthesia. Recently, the incidence of PD has increased, with a lifetime prevalence ranging from 1.6% to 4.7% worldwide (Roy-Byrne et al., 2006; Zhang et al., 2020) and 0.5% in China (Huang et al., 2019). Additionally, women are considered more prone to PD than men (Huang et al., 2019; Roy-Byrne et al., 2006). Misdiagnosis of PD is common in outpatient settings. Panic symptoms such as chest pain and anhelation are often mistaken for somatic disease (Liu et al., 2020), with a study reporting that nearly 98% of patients with PD were misdiagnosed (Fleet et al., 1996). Moreover, panic attacks can result from physical diseases; for instance, 6.3% of patients with cardiac sarcoidosis meet the criteria of PD (Goracci et al., 2008). Misdiagnosis of PD leads to a significant socioeconomic burden and hampers effective treatment with medication and psychotherapy (Liu et al., 2020). Therefore, developing reliable biomarkers for the diagnosis and prediction of therapy effectiveness in PD is of great significance.
Panic disorder treatment includes medication such as tricyclic antidepressants, benzodiazepines, and selective serotonin reuptake inhibitors (SSRIs), as well as psychotherapy, such as cognitive behavior therapy (Roy-Byrne et al., 2006). SSRIs are the first-line treatment of PD (Roy-Byrne et al., 2006; Zhang et al., 2020), with a high remission rate and a low incidence of adverse events (Chawla et al., 2022). Previous animal studies have revealed the association between serotonin type-1A receptor dysfunction and the development of anxiety (Neumeister et al., 2004; Sibille et al., 2000; Overstreet et al., 2003). Paroxetine, an SSRI drug, was first approved by the U.S. Food and Drug Administration for the treatment of PD (Zhang et al., 2020). Recently, various studies have confirmed the therapeutic efficacy and tolerability of paroxetine (Du et al., 2021; Zhang et al., 2020).
Since its first application to a human head in 1980, magnetic resonance imaging (MRI) has been widely used in clinics (Doyle et al., 1981). Resting-state functional MRI (rs-fMRI) is based on the blood oxygen level–dependent signal, reflecting the spontaneous activity of the brain during the resting state (Zhuo et al., 2019). The traditional pathological mechanism of PD primarily involves the fear network, which includes the prefrontal cortex (PFC), thalamus, brainstem, amygdala, and insula (Gorman et al., 2000). Currently, more extended regions are considered to be involved in the development of PD, including the occipital, parietal, temporal cortex (Lai, 2019), and putamen (Yoo et al., 2005). According to a meta-analysis in 2022, patients with PD tend to exhibit smaller gray matter volumes (GMV) in the right insula, left temporal pole, and bilateral superior temporal gyrus (STG) (Liu et al., 2022b). A study revealed altered functional connectivity (FC) between the right amygdala and the bilateral precuneus, as well as between the dorsal anterior cingulum (AC) and the frontal, parietal, and occipital gyrus of patients with PD (Pannekoek et al., 2013). Degree centrality (DC) estimates the connectivity level of one region with other brain regions, revealing the influence of a node on entire brain areas (Takeuchi et al., 2015). This study focuses on DC for several reasons: (1) Simplicity and interpretability: compared with other attributes of brain networks, DC is one of the most straightforward measures of centrality in network analysis, quantifying the number of direct connections of a node. This simplicity makes it easy to interpret and communicate findings, which is particularly important in clinical settings (Takeuchi et al., 2015). (2) Relevance to neuropathological mechanisms of PD: Previous research has shown that DC is particularly relevant to understanding the neuropathological mechanisms of psychiatric disorders, including PD (Liu and Lai, 2022; Shi et al., 2024; Wu et al., 2022), making it a pertinent measure for our study. (3) DC sensitivity to changes after treatment: Although no longitudinal study has yet applied DC to measure the brain function of patients with PD, DC has shown sensitivity to changes in brain function after treatment in patients with schizophrenia (Feng et al., 2024; Liu et al., 2022a), depression (Li et al., 2021; Shen et al., 2015), epilepsy (Wang et al., 2021b), and Parkinson’s disease (Luo et al., 2023). Furthermore, changes in DC have been associated with symptomatic improvements after treatment in patients with schizophrenia (Feng et al., 2024; Liu et al., 2022a) and depression (Shen et al., 2015). Additionally, DC combined with machine learning algorithms can predict treatment response (TR) to antiepileptic medications in patients with epilepsy (Wang et al., 2021b). Focusing on DC allows our study to be consistent with the existing literature that has utilized this metric, facilitating comparison and validation of our findings. Moreover, by applying DC, this longitudinal study aims to measure changes in brain function in patients with PD after treatment and explore biomarkers for TR.
For decades, various studies have focused on predictive biomarkers for the efficacy of PD treatment. A study discovered changed T1/T2 values in the left amygdala, insula, bilateral AC, and orbitofrontal cortex (OFC) after medical treatment in patients with PD (Plag et al., 2018). Meanwhile, several studies focused on the alteration of white matter connectivity in PD after medical treatment, including the posterior corona radiata, posterior limb of the internal capsule, superior longitudinal fasciculus, sagittal stratum, and fornix/stria terminalis (Pae et al., 2022; Song et al., 2021). Moreover, a study suggested that patients with PD with high fractional anisotropy in the precentral gyrus, parahippocampal gyrus (PHG), posterior corpus callosum, and precuneus are likely to show nonresponse to medication (Kim et al., 2020). However, these studies often included at least two types of drugs, such as serotonin-norepinephrine reuptake inhibitors (SNRIs), SSRIs, and benzodiazepines, rather than limiting the variety of drugs used.
Given that no study has applied DC analysis to explore the diagnosis and treatment efficacy prediction biomarkers in patients with PD, we conducted this study (1) to investigate the characteristic brain regions with abnormal DC values in patients with PD, (2) to measure the connectivity levels of specific brain regions and its trajectory before and after medical treatment (paroxetine) using rs-fMRI, and (3) to identify potential neuroimaging biomarkers for diagnosis and efficacy prediction in patients with PD through machine learning. The expected results were as follows: (1) patients with PD would show altered DC values in multiple brain regions inside and outside the fear network; (2) significantly altered FC values would be observed in patients with PD before and after treatment with paroxetine; (3) significantly different DC values at baseline would help build models for diagnosing and predicting treatment efficacy in PD.
Materials and methods
Participants
Fifty-six patients diagnosed with PD were recruited for this study from the outpatients of the Second Xiangya Hospital, Central South University. Fifty-four matched healthy controls (HCs), who passed psychiatric screening, were recruited locally. All participants were aged between 18 and 60 years, right-handed, and had an education background of at least 6 years. This fMRI study was conducted from January 2019 to September 2022.
Patients with PD met the following inclusion criteria: (1) they had a principal diagnosis of PD according to the Diagnostic and Statistical Manual of Mental Disorders-Fifth Edition; (2) they were drug naïve or free of psychiatric medication for at least 4 weeks; and (3) they had a score of less than 18 on the 17-item Hamilton Depression Rating Scale (HAMD-17). The exclusion criteria for all participants were as follows: (1) any diagnosis of psychiatric disorders apart from PD; (2) a history of severe neurological and physical diseases or cerebral structural lesions; (3) a history of substance dependence or abuse; (4) inability to cooperate data collection and the therapeutic schedule; (5) had received physiotherapy.
This fMRI study was approved by the Research Ethics Committee of the Second Xiangya Hospital of Central South University. All participants signed written informed consent after receiving a detailed description of the study. Additionally, the study was registered on ClinicalTrials.gov (registration number: NCT03894085). For detailed trial registration information, please refer to https://clinicaltrials.gov/ct2/show/NCT03894085.
Imaging acquisition and data preprocessing
A 3.0 T Philips scanner was used to obtain the imaging data from all participants at baseline and from patients with PD after treatment. During scanning, each participant was required to stay awake and their eye closed, use earplugs, and have their head stabilized with soft foam pads to minimize motion. The scanning parameters were as follows: repetition time, 2000 ms; echo time, 30 ms; matrix size, 64 × 64; flip angle, 90°; field of view, 22 cm; slice thickness, 4 mm; no gap; 33 slices; interleaved acquisition; 240 volumes; scanning time, 480 s.
Data preprocessing was conducted using the Data Processing Assistant for Resting-State fMRI (DPARSF), an assistant toolbox for MATLAB (Chao-Gan and Yu-Feng, 2010). To control for unstable signal and initial adaptation effects, the first 10 time points were discarded. The remaining volumes underwent slice timing correction (using the 33rd slice as the reference slice) and motion correction. They were then normalized to Montreal Neurological Institute space using an echo-planar imaging template, with a resampled voxel size of 3 mm × 3 mm × 3 mm. The normalized images were subjected to linear detrending and bandpass filtering (0.01–0.08 Hz). Subjects were excluded if head motion exceeded 2 mm in translation or 2° in rotation.
Measurement scales
In this study, patients with PD followed a therapeutic schedule of 4-week paroxetine treatment with a dose of 20 mg/day. Clinical characteristics of patients with PD were evaluated pre- and post-treatment using the following scales: the HAMD-17 and the Hamilton Anxiety Rating Scale (HAMA) for emotional impairment, Social Disability Screening Schedule (SDSS), Simplified Coping Style Questionnaire (CSQ) and Brief Cognitive Assessment Tool for Schizophrenia (B-CAT) for the functional level, and the Eysenck Personality Questionnaire (EPQ) for personality characteristics.
HAMD-17 was used to assess depression. HAMA is a 14-item scale, which can be used to assess the anxiety level. High scores on these two scales indicated serious symptoms (Bagby et al., 2004). SDSS measures one’s multi-functional status from the social, professional, and psychological perspectives. B-CATS evaluates cognitive function through four subscales: the Trail Making Test (TMT) Part A, TMT Part B, Digit Symbol Substitution Test (DSST), and Category Fluency. Scores on TMT A and B are negatively correlated with cognitive function, while scores on DSST and Category Fluency are positively correlated (Sun et al., 2015). CSQ estimates a person’s coping style from active (items 1–12) and passive (items 13–20) aspects based on the Ways of Coping Questionnaire (Xie, 1998). EPQ is a dichotomous scale with 88 items divided into four parts. The extraversion part exhibits the tendency of sociability, confidence, and positive emotion (Sheng et al., 2021). The neuroticism part reflects the tendency of emotional instability, such as moody and worry. The psychoticism part shows the tendency to have poor adaptation and relationship. The lie part reflects one’s camouflage and tests the authenticity of results (Smillie et al., 2009).
DC and FC analyses
The DPARSF toolbox was used to perform voxel-based whole-brain Pearson’s correlation on preprocessed images to compute DC. A correlation coefficient threshold of r > 0.25 was set to generate a whole-brain DC map. In this study, only positive correlation coefficients were considered. In calculating the DC values for each voxel, significant correlations were summed. Subsequently, Fisher-Z transformation was applied to enhance the normality of the DC values. A previous study by Zuo et al. (2012) provides a detailed explanation of the DC calculation process. The DC of node i was calculated as follows:
Statistical analysis
Statistical analysis was performed by using the Statistical Package for Social Sciences. Independent t-tests and Chi-square tests were conducted to compare the demographic characteristics between the patient and HC groups. Independent t-tests were conducted on the DC and FC maps of the patient and HC groups. Paired t-tests were performed on the DC and FC maps of the patient group before and after treatment. For the imaging data, significance levels were set at p < 0.05 and corrected for multiple comparisons using the Gaussian random field theory, with a cluster significance of p < 0.05 and a voxel significance of p < 0.001. Correlation analyses were performed to investigate the association between DC and clinical data at baseline, as well as the relationship between changes in DC and changes in clinical data following treatment. A significance level of 0.05 was utilized, and a Bonferroni correction was used to account for multiple comparisons (with p = 0.05 divided by the number of tests). Pearson’s correlation coefficient was used for normally distributed or approximately normally distributed data, while Spearman’s correlation coefficient was used for nonparametric data.
Machine learning
Support vector machine (SVM) and SVR analyses were conducted using LIBSVM (http://www.csie.ntu.edu.tw/~cjlin/libsvm/) (Chang and Lin, 2011). Voxel-wise DC values across the entire brain at baseline were utilized as potential features. Leave-One-Out Cross-Validation (LOOCV) was employed, wherein the features of one subject were designated as test data with their respective class labels, while the features of the remaining subjects served as training data with their corresponding labels. Subsequently, all features were normalized to a range between 0 and 1. Spearman correlation analysis was performed between the training data and their labels, and the top 5% of correlated features was selected for final training and testing. Following feature selection, model training and testing were executed using a linear kernel function. The classification accuracy was determined as the mean accuracy across all folds. The Area Under the Curve (AUC) was calculated to evaluate the performance of the model. Permutation tests were then conducted to evaluate the significance of this accuracy. This involved 5000 permutations, where for each permutation, labels were randomly reassigned to the features. The reshuffled data underwent classification in the same manner as the original data. The resulting 5000 accuracies were used to determine the p-value for the real accuracy by calculating the proportion of permutations yielding a higher accuracy than the real one.
We applied SVR to predict the TR of patients with PD to paroxetine. SVR is particularly well-suited for small datasets because it is robust against overfitting and effective in high-dimensional spaces even when the number of samples is limited. The regularization parameter in SVR helps manage the trade-off between the model complexity and error, making it a robust choice for our dataset size. Previous studies have demonstrated the successful application of machine learning models, including SVR, with small datasets. For instance, the study of Redlich et al. (2016) and our previous study (Li et al., 2019) have shown that SVR can perform reliably with limited sample sizes in clinical settings. For SVR analysis, we employed LOOCV and a linear kernel function. Potential features were derived from voxel-wise DC across the entire brain. Feature selection was performed based on correlations between voxel-wise DC and the observed TR (p < 0.05), measured using the reduction rate of HAMA scores (RRHAMA). HAMA was chosen because it measures anxiety symptoms, which are the primary focus of treatment with paroxetine in patients with PD. The calculation formula of RRHAMA is as follows: RRHAMA = (baseline HAMA score − post-treatment HAMA score)/baseline HAMA score. Predictive performance was quantified using both the Mean Squared Error (MSE) and Pearson’s correlation between the predicted and observed TRs. Additionally, permutation tests were conducted to assess whether the observed correlation was significantly above chance. This involved 5000 permutations, where for each permutation, observed TRs were randomly reassigned to the features (DC values), and the reshuffled data were used to predict TR. The resulting 5000 correlations and MSEs were used to determine the p-values for the real correlation and MSE, respectively, by calculating the proportion of permutations resulting in a higher correlation or lower MSE than the actual values.
Results
Demographic and clinical characteristics of participants
Fifty-six patients with PD and 54 matched HCs were recruited for this study. Two patients with PD were excluded due to excessive head motion. Due to various inconveniences during the COVID-19 pandemic,18 patients with PD were lost to follow-up. Finally, 36 (36/54) patients with PD completed the 4-week paroxetine treatment. No significant differences in age (p = 0.20), gender (p = 0.44), and years of education (p = 0.67) were observed between the patient and HC groups. Average values of illness duration and psychological scale scores in patients with PD are shown in Table 1.
Characteristics of participants.
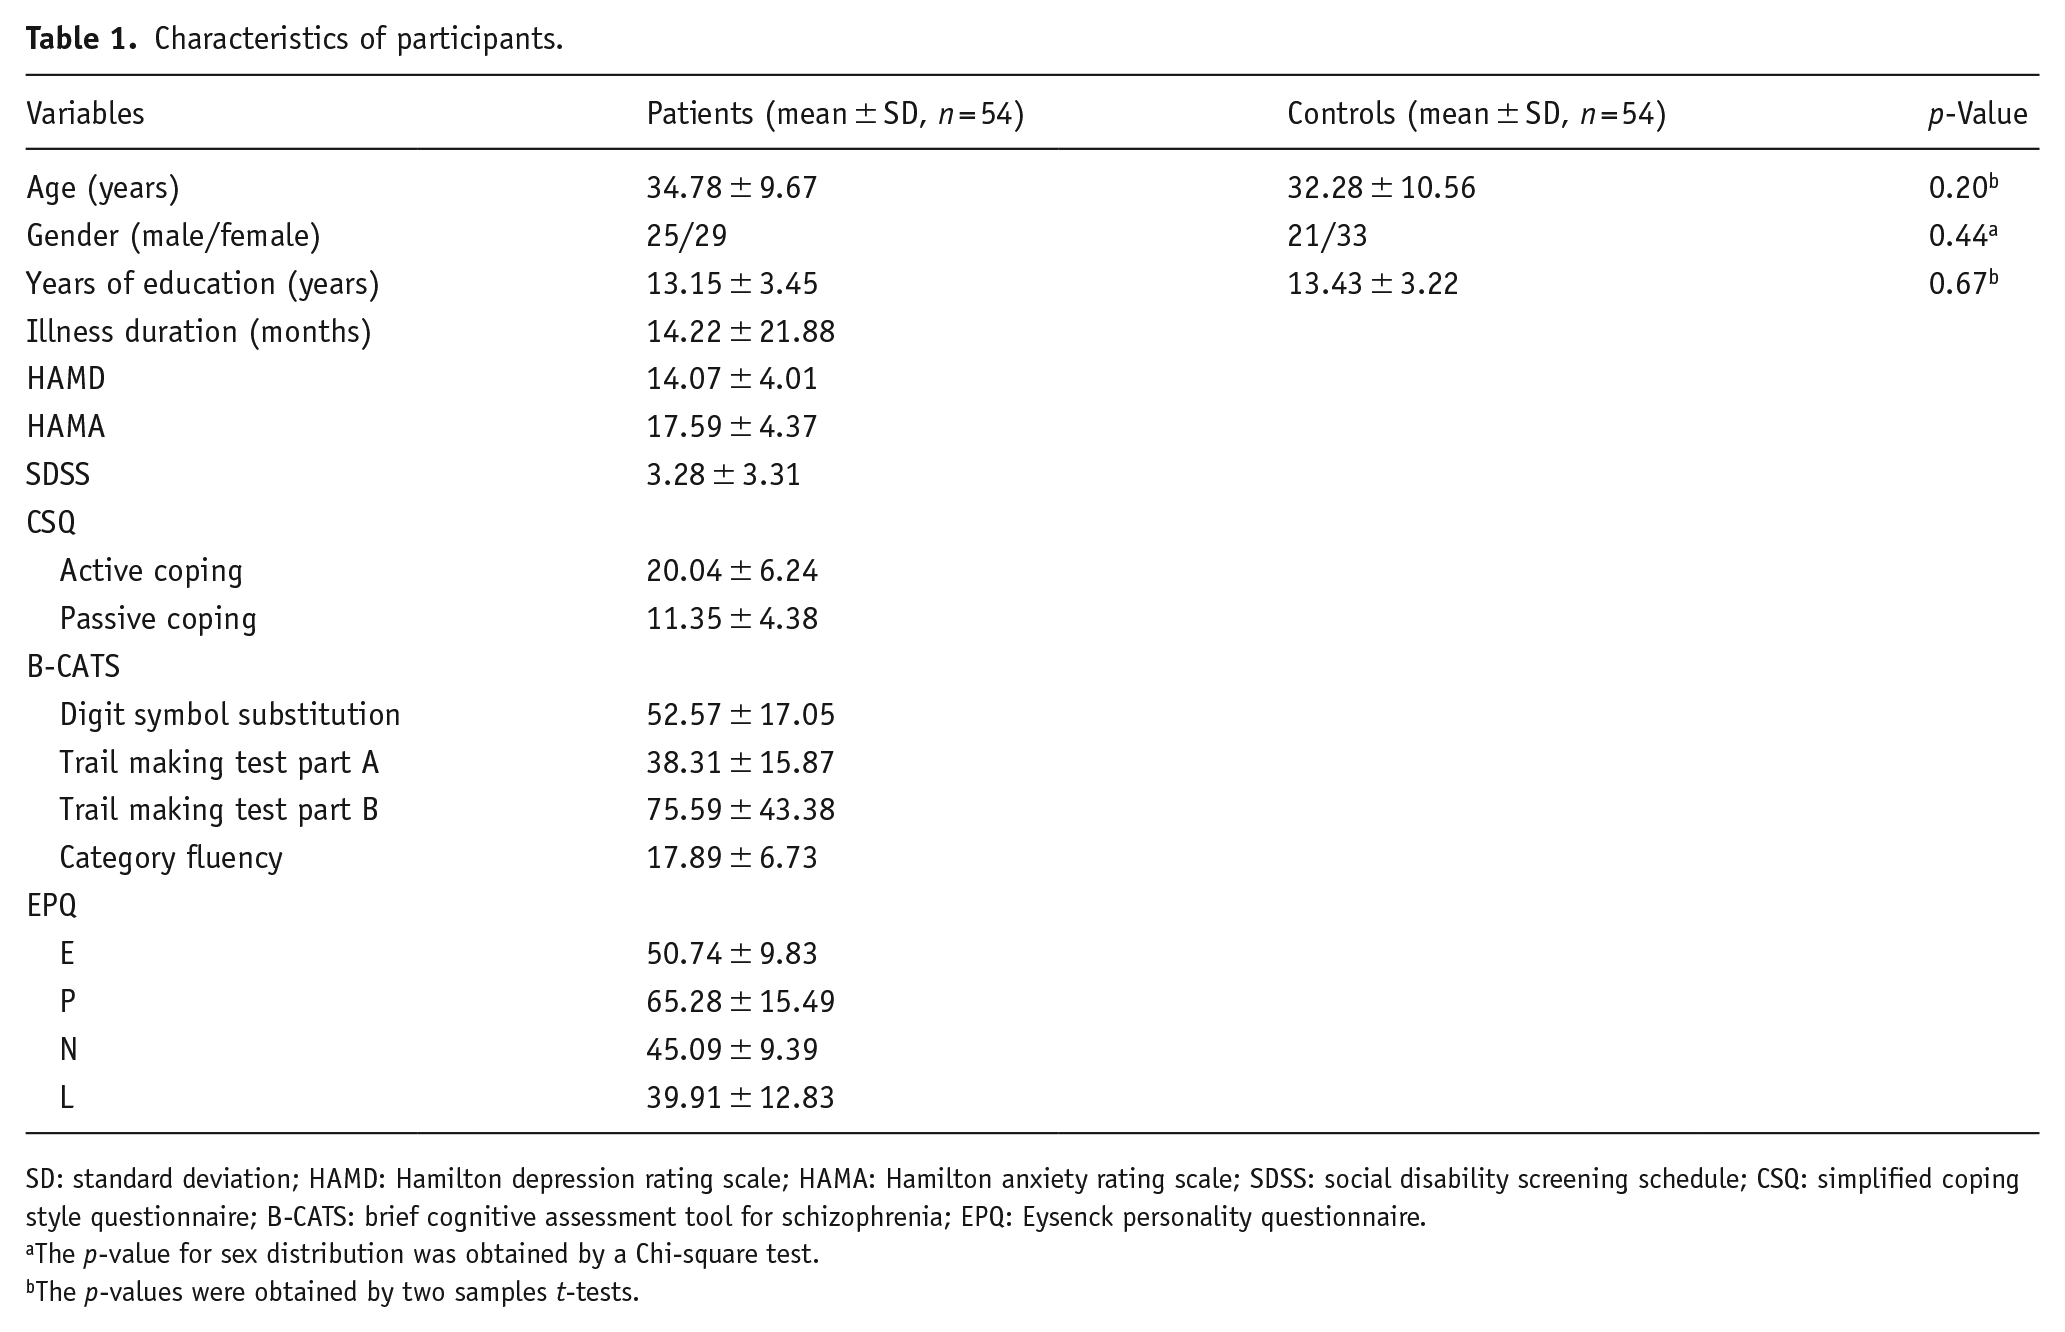
SD: standard deviation; HAMD: Hamilton depression rating scale; HAMA: Hamilton anxiety rating scale; SDSS: social disability screening schedule; CSQ: simplified coping style questionnaire; B-CATS: brief cognitive assessment tool for schizophrenia; EPQ: Eysenck personality questionnaire.
The p-value for sex distribution was obtained by a Chi-square test.
The p-values were obtained by two samples t-tests.
Brain regions with aberrant DC values at baseline and altered DC values after the 4-week treatment in patients with PD
Compared with HCs, patients with PD exhibited significantly higher DC values in the bilateral AC but significantly lower DC values in the left middle temporal gyrus (MTG), right inferior temporal gyrus (ITG), right calcarine cortex (CAL), right inferior occipital gyrus (IOG), and bilateral fusiform gyrus (FFG) at baseline (Table 2 and Figure 1). After a 4-week paroxetine treatment, patients with PD exhibited significantly higher DC values in the left CAL, left lingual gyrus (LING), and cerebellum IV/V (Table 2 and Figure 2).
Regions with abnormal DC values in patients with PD at baseline and alterations of DC values after treatment.
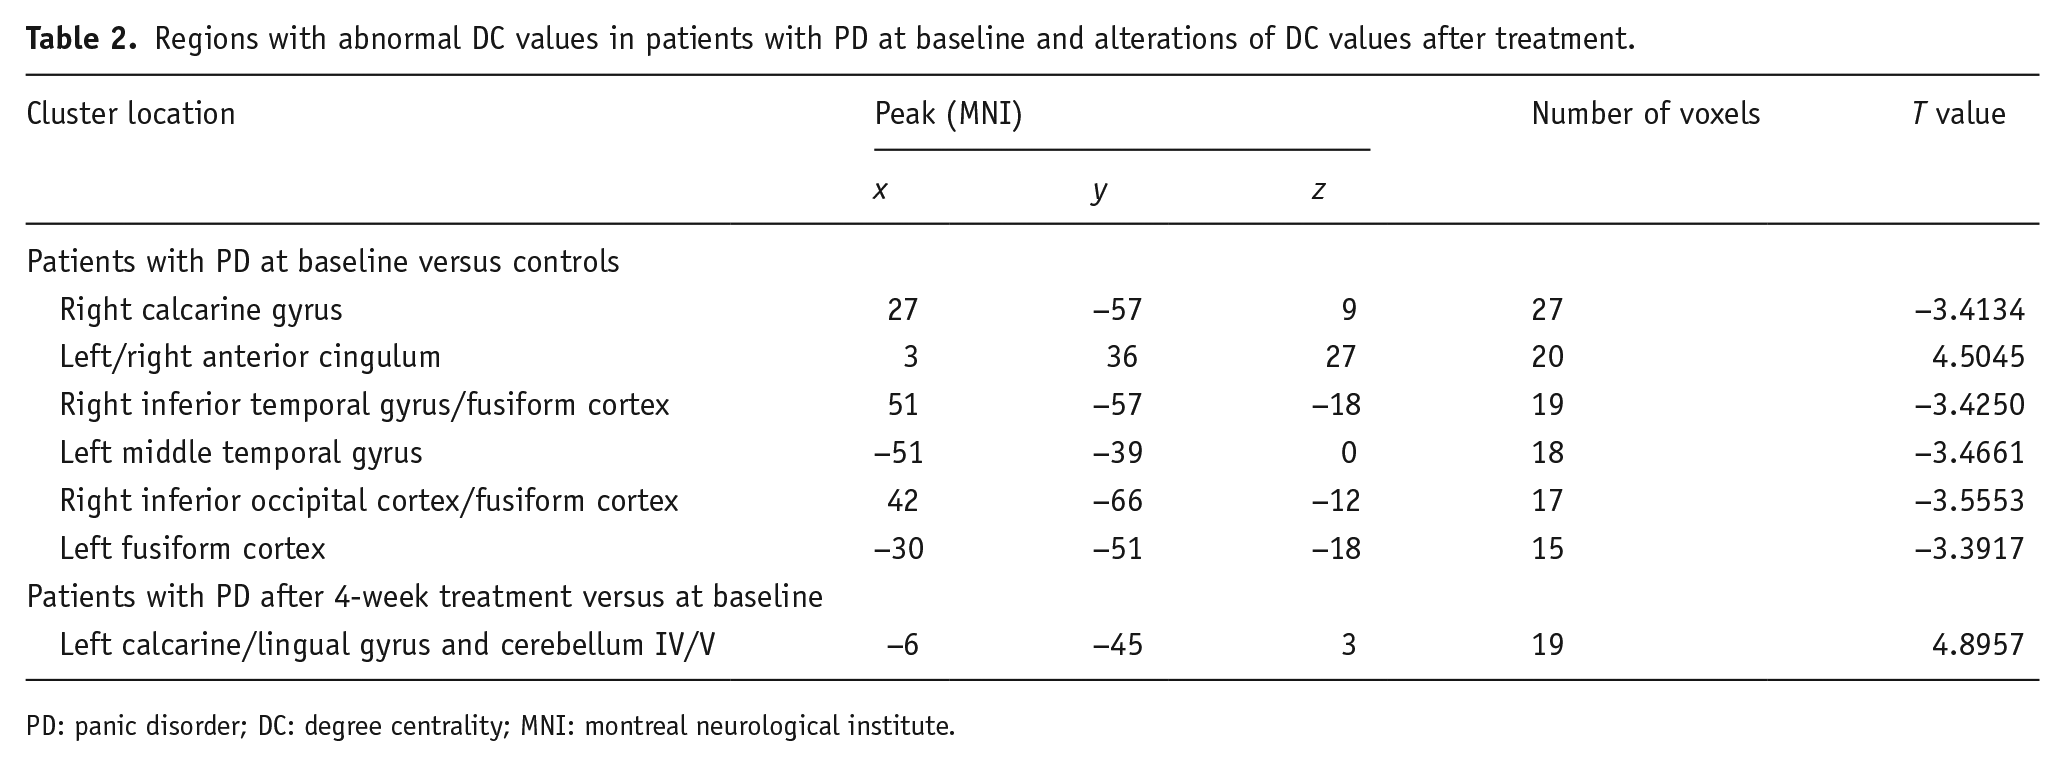
PD: panic disorder; DC: degree centrality; MNI: montreal neurological institute.
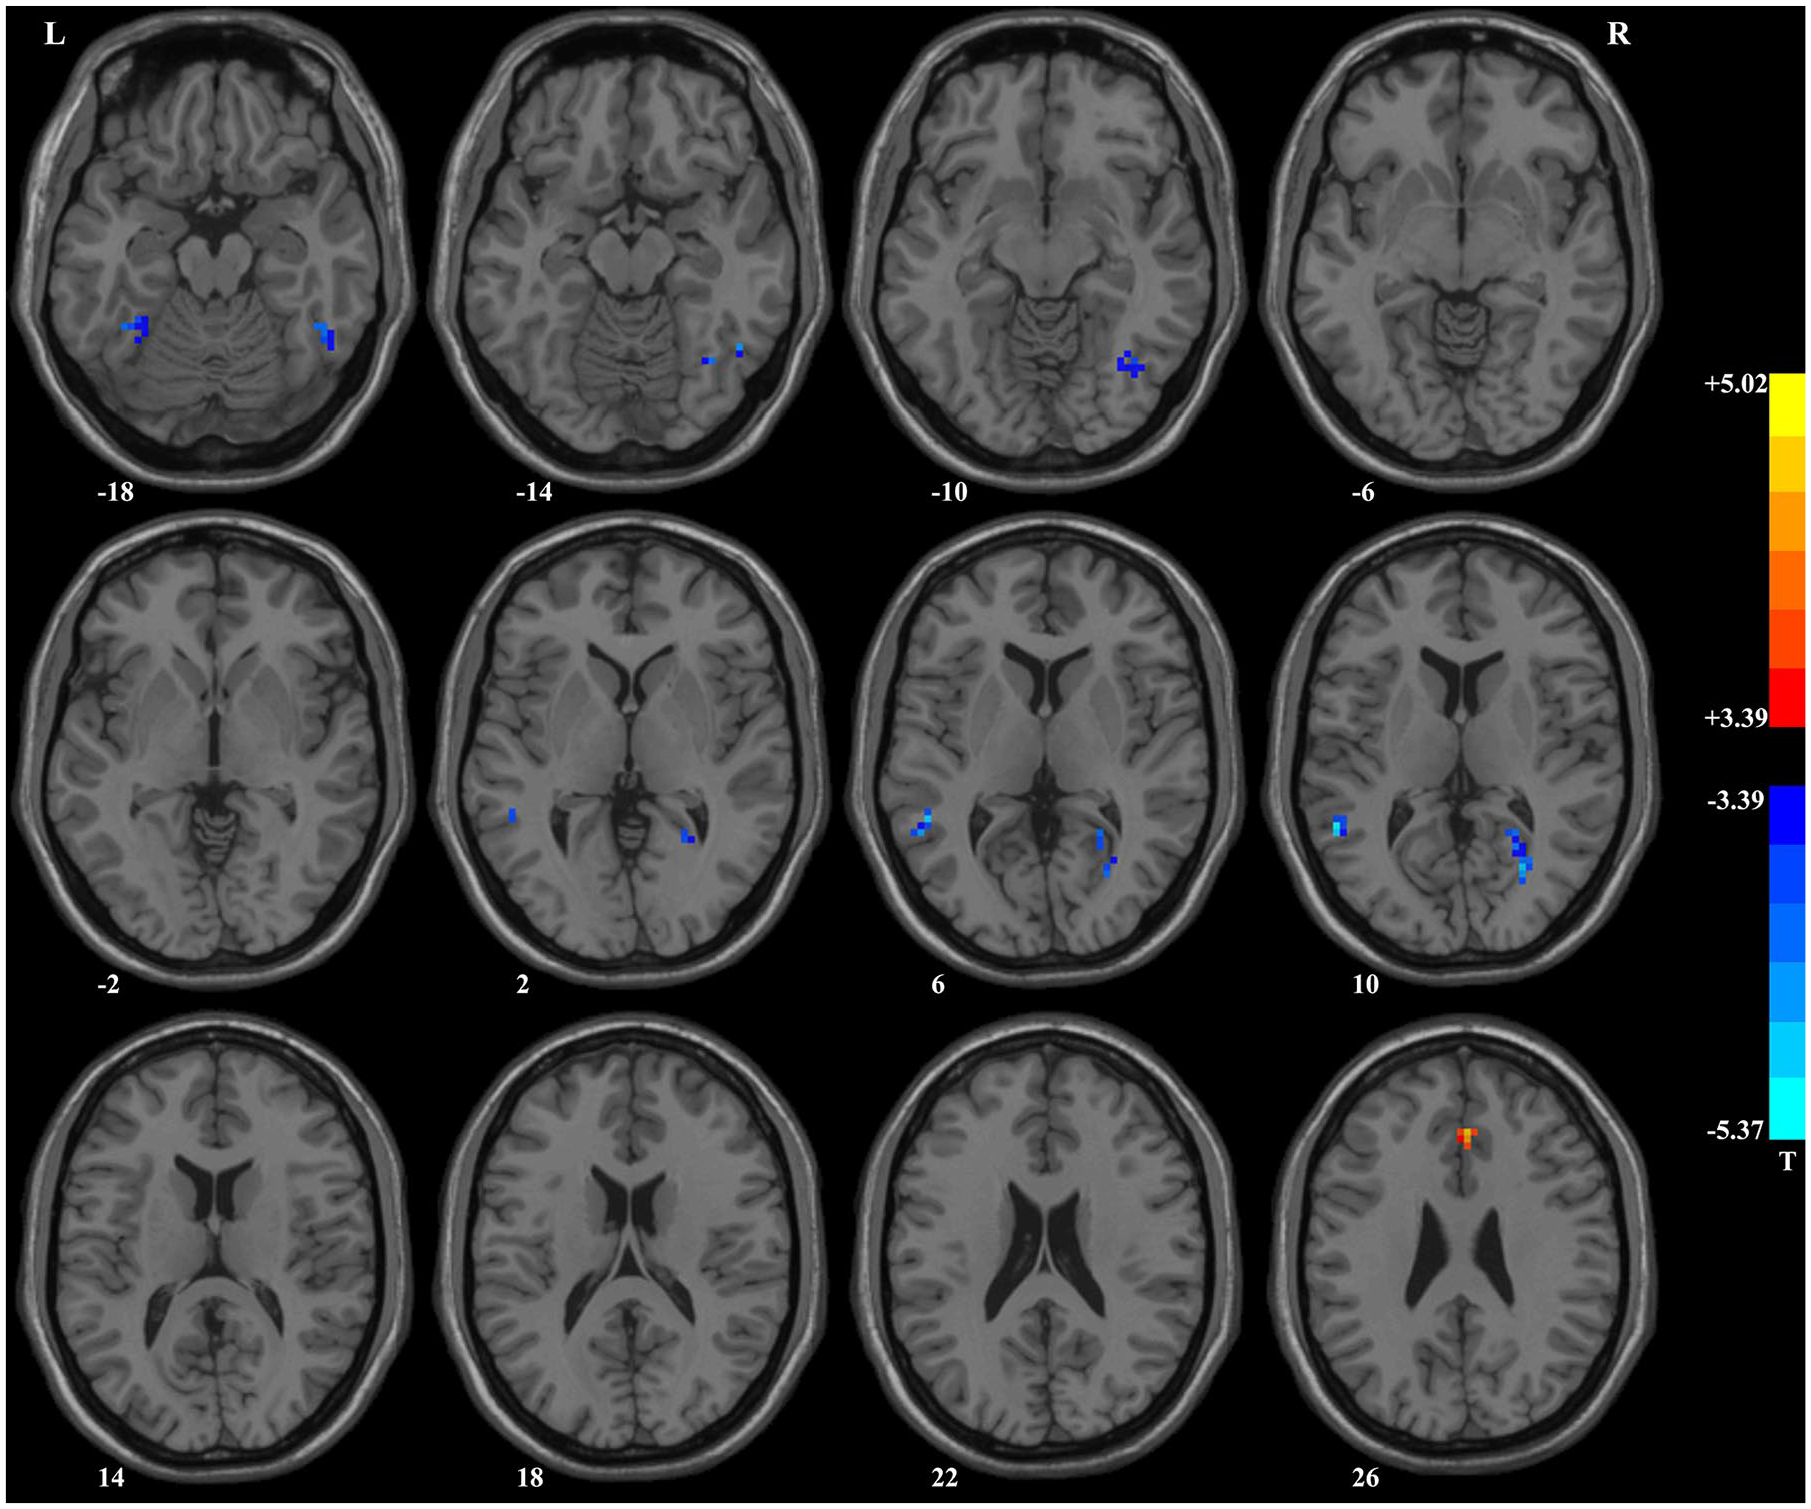
Brain regions with significant differences in DC values between patients with PD and healthy controls. Compared with healthy controls, patients with PD had higher DC values in the left/right anterior cingulum and lower DC values in the right calcarine gyrus, right inferior temporal gyrus/fusiform cortex, left middle temporal gyrus, right inferior occipital cortex/ fusiform cortex, and left fusiform cortex.
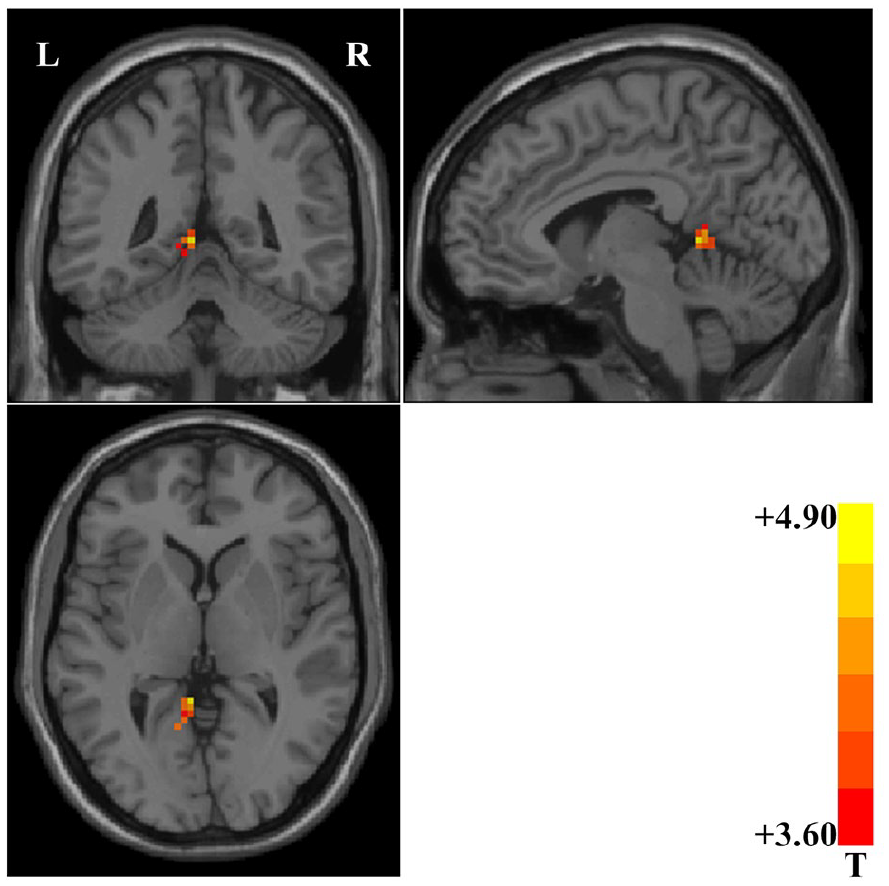
Brain region showing significant changes in DC values after treatment. Compared with baseline data, patients with PD showed significantly increased DC values in the left calcarine/lingual gyrus and cerebellum IV/V after 4 weeks of paroxetine treatment.
Clinical characteristics of patients with PD at baseline and after 4-week treatment
Thirty-six patients with PD finally finished the follow-up, and their clinical characteristics are shown in Supplemental Material, Table S1. Patients with PD showed a significant improvement in clinical symptoms, as indicated by decreased scores on the HAMD (p < 0.001), HAMA (p < 0.001), SDSS (p < 0.001), active coping of CSQ (p = 0.017), DSST (p = 0.002), TMT part A (p = 0.006), and TMT part B (p = 0.002) of B-CATS. However, no significant changes in the passive coping of CSQ (p = 0.611) and category fluency of B-CATS were observed (p = 0.802).
Seed-based FC analysis between patients with PD and HCs
ROIs for the FC analysis were determined based on the clusters showing significant group differences in DC. Brain regions with significantly aberrant FC values in patients with PD are shown in Table S2 and Figure 3. Clusters with high DC, such as the bilateral AC, exhibited notable increases in FC, while clusters with reduced DC, such as the right CAL, right ITG/FFG, left MTG, and left FFG, displayed significant decreases in FC.
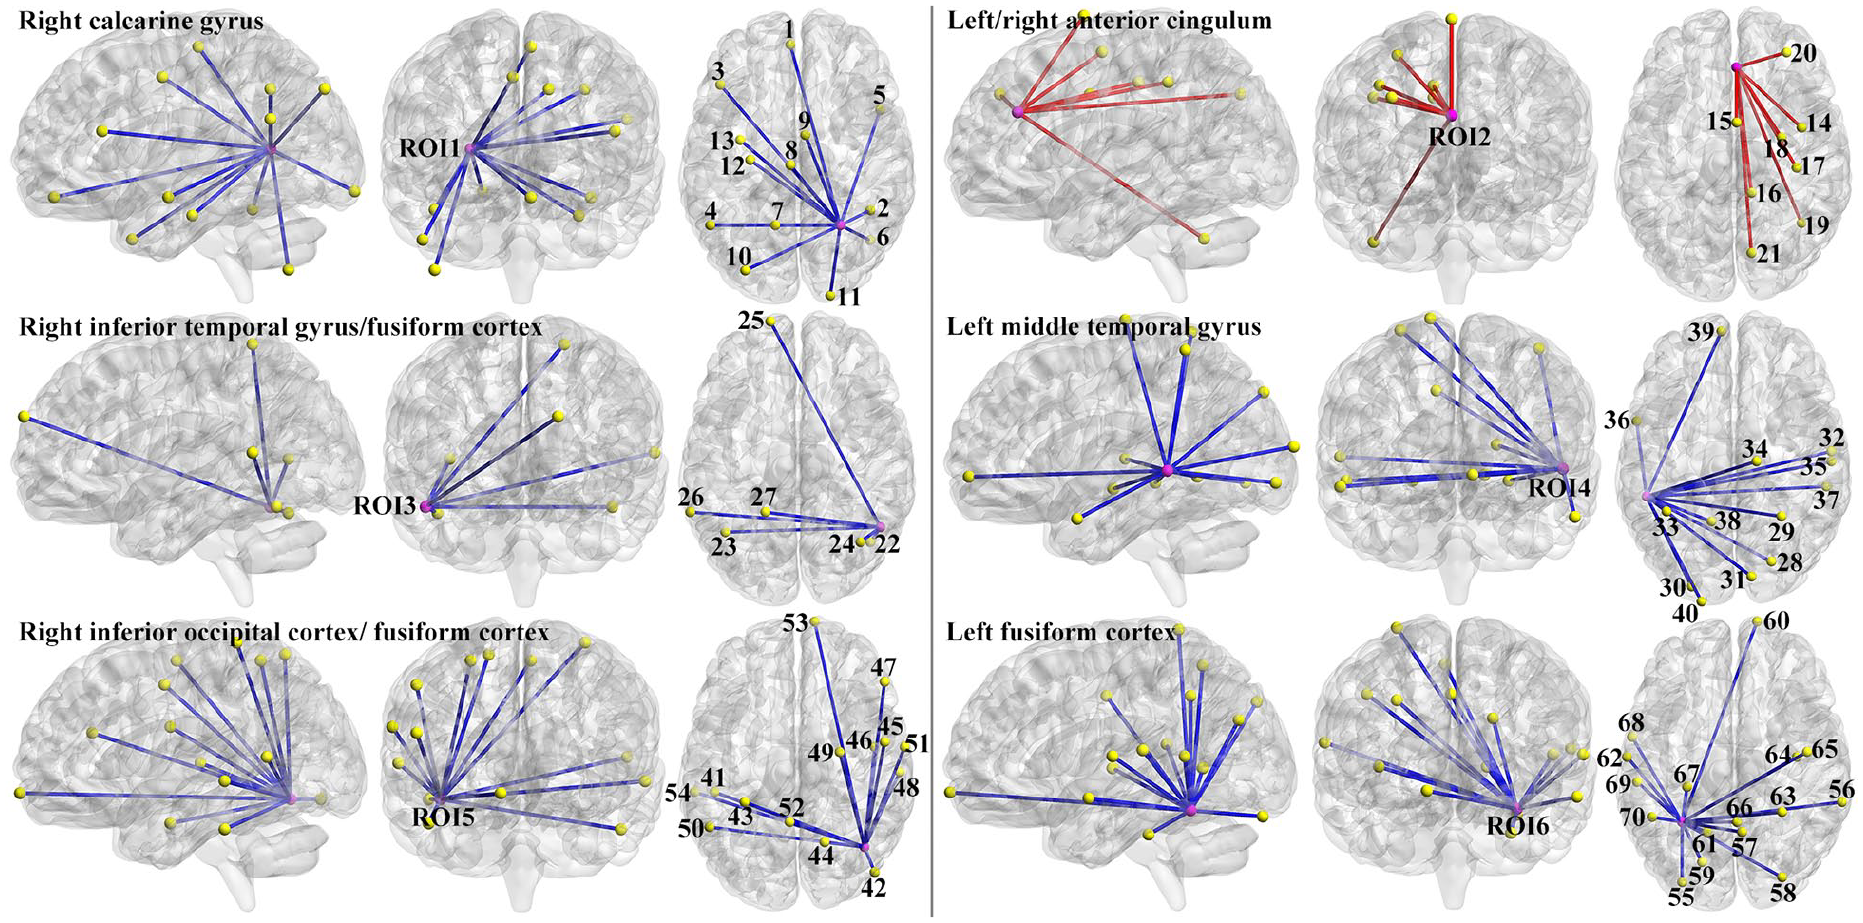
******Abnormal functional connectivity in patients with PD relative to healthy controls. The six ROIs were brain regions with aberrant DC values at baseline. The numbers “1” to “70” represent the sequential brain regions in Table S2, which are linked to the six ROIs. The blue line represents decreased functional connectivity, and the red line represents increased functional connectivity.
Seed-based FC analysis before and after treatment
After a 4-week paroxetine treatment, patients with PD showed significantly increased FC values between the bilateral AC and left medial OFC/gyrus rectus (Figure 4).
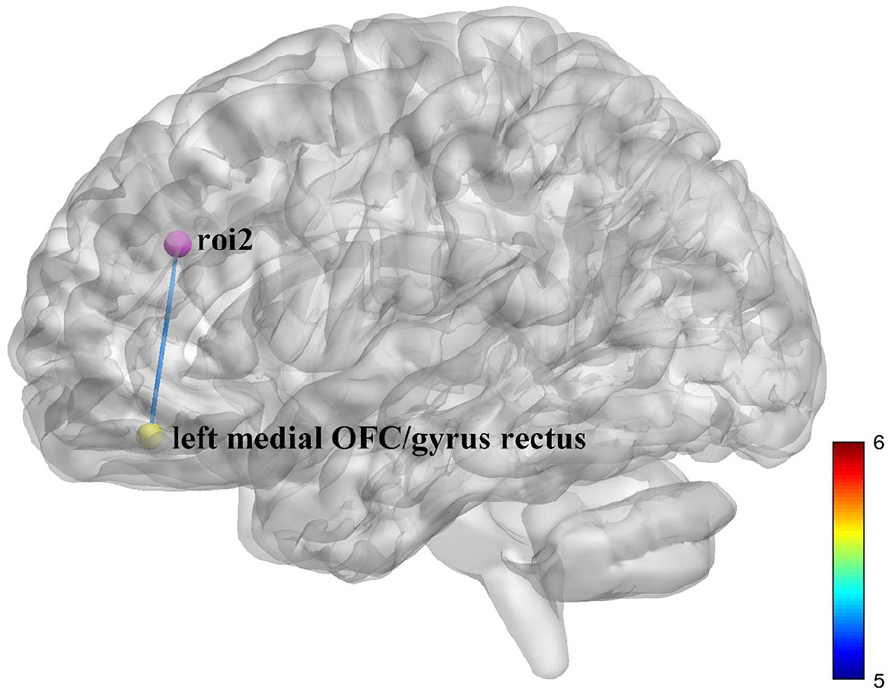
Brain region showing significant changes in functional connectivity values after treatment. Compared with baseline data, patients with PD showed significantly increased functional connectivity values between the left/right anterior cingulum and the left medial orbitofrontal cortex/gyrus rectus after 4 weeks of paroxetine treatment.
SVM analysis
The SVM, utilizing voxel-wise DC values across the entire brain at baseline, achieved an accuracy of 83.33%, a sensitivity of 81.48%, and a specificity of 85.19% in distinguishing patients with PD from HCs (Figure 5(a)). The AUC for the SVM model was 0.914 (Figure 5(b)). The features ultimately selected in the SVM model are shown in Figure 5(c). The p-value obtained from permutation tests was less than 0.001.
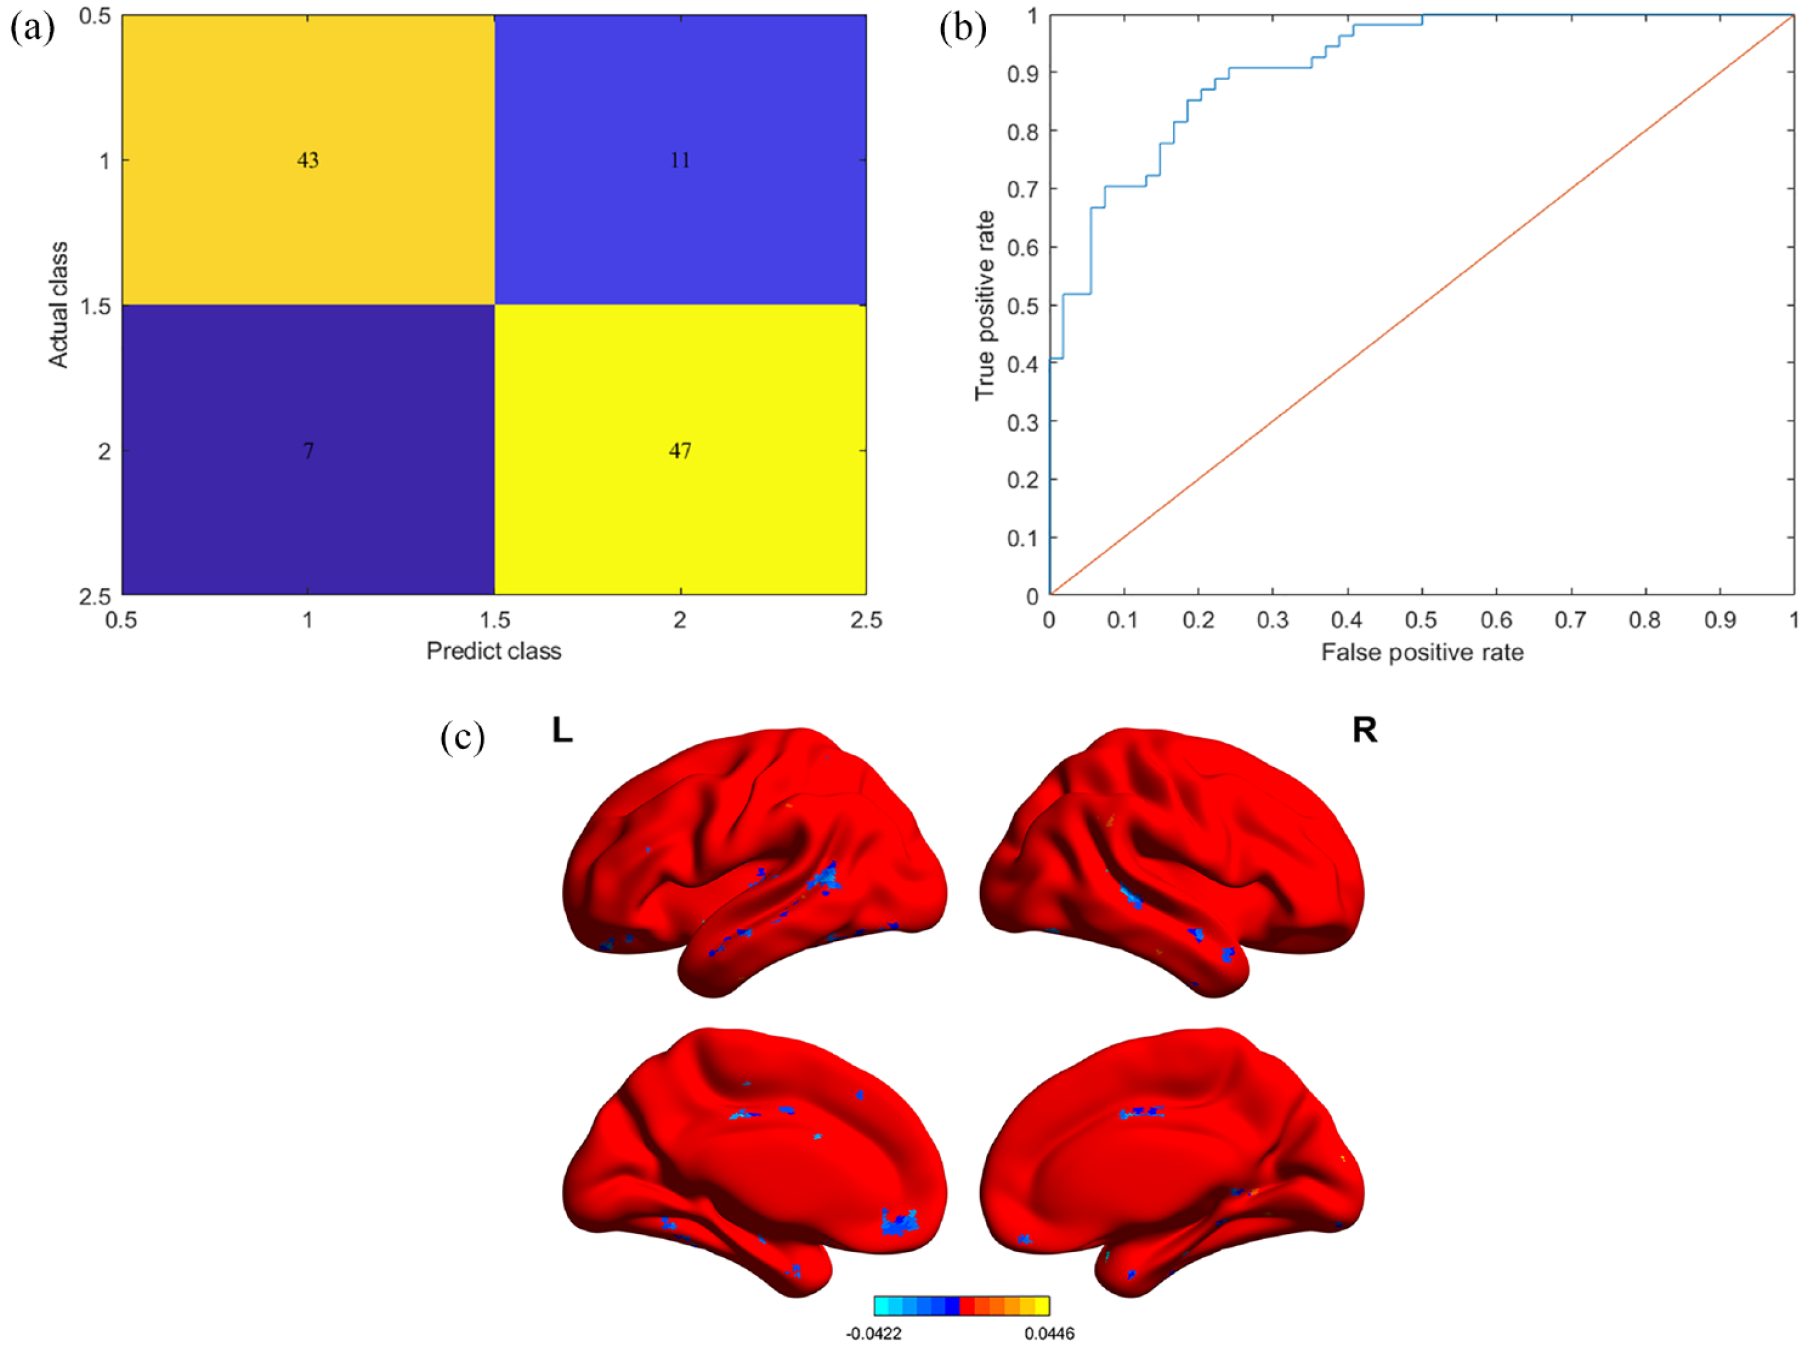
(a) Confusion matrix illustrating the classification between patients with PD and healthy controls, utilizing SVM analysis based on voxel-wise DC values at baseline. (b) The area under the curve was calculated to assess the performance of the SVM model. (c) The features ultimately selected in the SVM model. The color bar shows the weights of each selected feature.
SVR analysis
The predicted RRHAMA was significantly correlated with the observed RRHAMA (correlation coefficient (r) = 0.893, MSE = 0.009, Figure 6). The p-values for the correlation coefficient and MSE obtained from permutation tests were both less than 0.001. The features ultimately selected in the SVR model are shown in Figure 6(d). The differences between the observed RRHAMA and the predicted RRHAMA for each subject are shown in Figure 6(e).
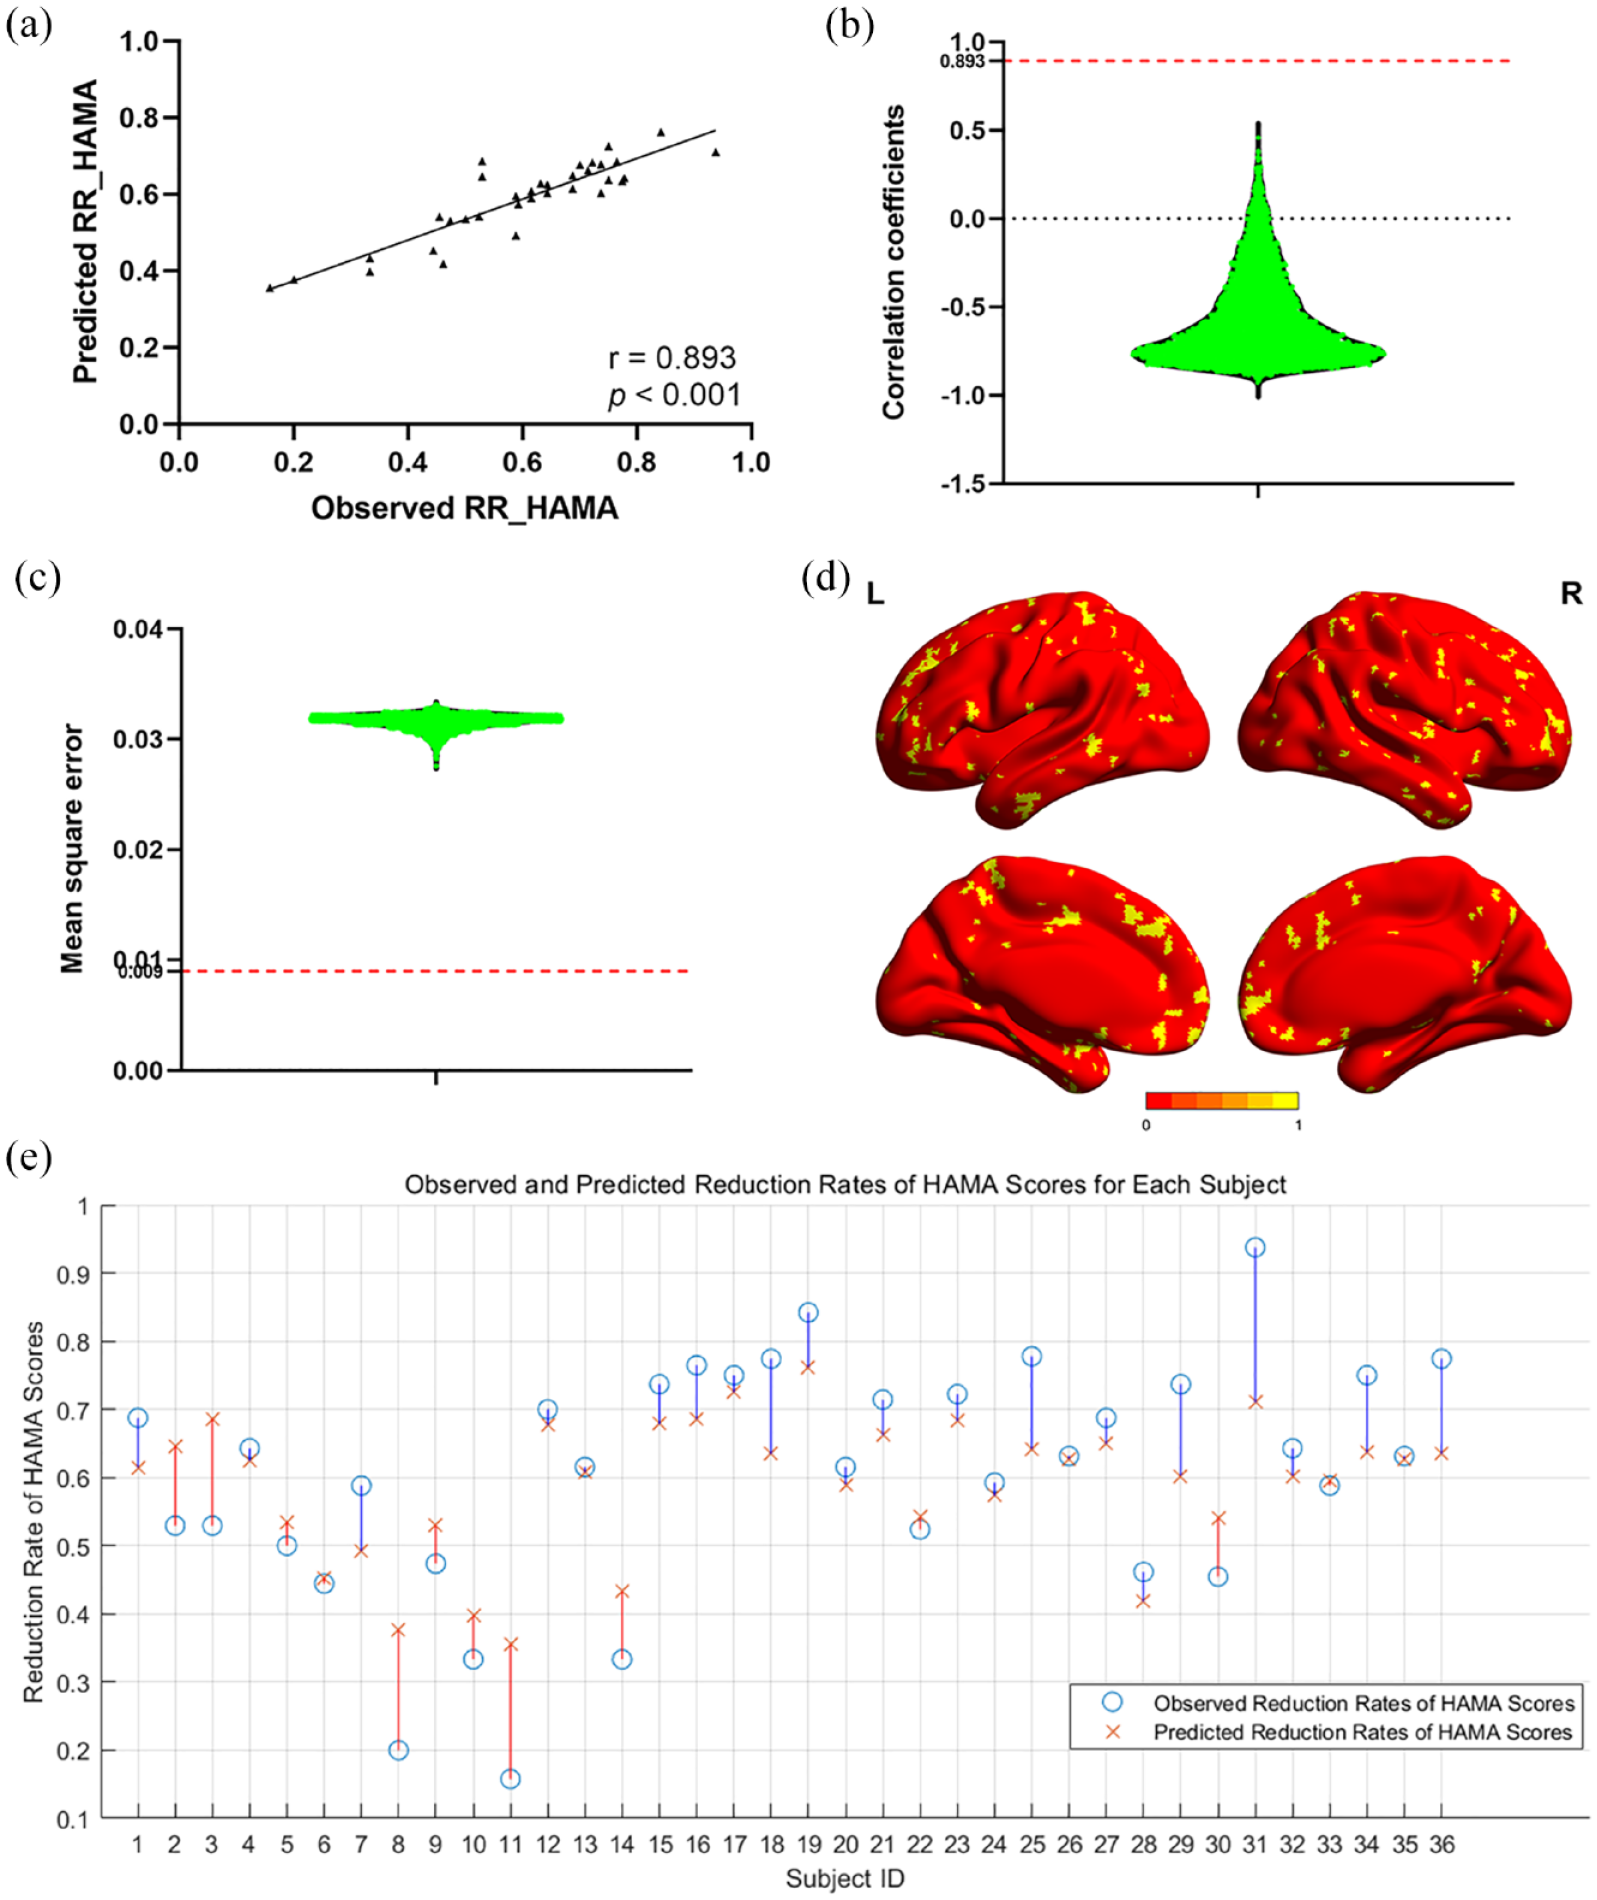
(a) Correlation between predicted treatment response and observed treatment response in patients with panic disorder. (b) Correlation coefficients between predicted and observed treatment responses in permutation tests. (c) Mean squared error between predicted and observed treatment responses in permutation tests. (d) The yellow brain regions represent the features ultimately selected in the support vector regression model. (e) The differences between the observed treatment response and the predicted treatment response for each subject. The blue lines represent cases where the observed treatment response is higher than the predicted treatment response, while the red lines represent cases where the observed treatment response is lower than the predicted treatment response.
Discussion
Compared with HCs, patients with PD showed higher DC values in the bilateral AC and lower DC values in the temporal and occipital areas, including the left MTG, right ITG, right CAL, right IOG, and bilateral FFG. After treatment with paroxetine, patients with PD showed increased DC values in the left CAL, left LING, and cerebellum IV/V, alongside improved clinical symptoms. Clusters with higher DC demonstrated a notable increase in FC, including the bilateral AC. Conversely, clusters with reduced DC displayed significant decreases in FC, such as the right CAL, right ITG/FFG, left MTG, and left FFG. After a 4-week paroxetine treatment, patients with PD showed significantly increased FC between the bilateral AC and left medial OFC/gyrus rectus. The SVM and SVR, leveraging voxel-wise DC values at baseline, effectively differentiate between patients with PD and HCs and accurately forecast the TR.
The AC, a crucial part of the limbic network involved in processing reward and punishment information from the OFC and amygdala, plays a significant role in triggering emotional responses (Rolls, 2019). Asami et al. observed reduced volume in the right AC associated with attention regulation and anticipation in PD (Asami et al., 2008). Based on previous studies, the dysfunction of the AC has been closely linked to PD symptoms and fearful emotional reactions (Greco and Liberzon, 2016; Korgaonkar et al., 2021). Some studies reported hypoactivation and decreased FC within the AC (Fischer et al., 1998; Ni et al., 2021), while others observed hyperactivation (Brinkmann et al., 2017; Feldker et al., 2016). Patients with PD exhibited altered FC of the AC with various brain regions, such as increased FC with the precuneus (Shin et al., 2013) and decreased FC with the right amygdala (Korgaonkar et al., 2021), contributing to the pathophysiology of PD. In addition, Pannekoek et al. (2013) noted altered FC between the AC and frontal, parietal, and occipital areas, which is related to external monitoring and evaluation, as well as hypersensitivity to somatic symptoms. Therefore, patients with PD showed higher DC values in the bilateral AC and increased FC in AC than HCs, illuminating the important role of AC in generating fearful emotions and somatic discomfort, and PD tended to express high sensitivity to the external environment.
Our results also showed lower DC values in the left MTG and right ITG within the temporal lobe, as well as in the bilateral FFG, right CAL, and IOG within the occipital lobe. The temporal lobe plays a crucial role in the cognitive processing of learning and memory (Chauviere, 2020), and its structural abnormality can trigger ictal panic (Kanner, 2011). Current studies (Besteher et al., 2018; Besteher et al., 2017) have linked altered GMV in MTG and ITG with the severity of depressive and anxiety symptoms. However, trends in temporal GMV alterations in patients with PD remained inconsistent. A meta-analysis study (Wang et al., 2021a) reported increased GMVs in the left STG and right MTG, whereas other studies indicated decreased GMVs predominantly in the right STG and MTG (Liu et al., 2022b; Sobanski et al., 2010; Wu et al., 2018). Additionally, Wu et al. (2022) found reduced nodal efficiency in the left MTG of patients with PD and reduced FC between the right MTG and other temporal areas. Patients with PD and childhood trauma showed high FC between the right MTG and thalamus (Hong et al., 2023). Decreased DC and FC values in the temporal lobe of patients with PD underscore the critical role of the temporal lobe in the mechanism of PD. Temporal alterations might trigger panic attacks in patients with PD, aiding in the estimation of clinical severity or diagnosis of PD.
The occipital lobe primarily functions in visual and conscious processing (Schwarzkopf et al., 2011), and the occipital pole, divided by CAL into the LING and FFG, constitutes the visual cortex (Szeszko et al., 2005). Patients with PD exhibit high sensitivity to peripheral visual stimulation, particularly those with agoraphobia (Caldirola et al., 2011). Previous studies (Frick et al., 2014; Magnotta et al., 2014; Wang et al., 2021a) have reported reduced GMVs in the visual cortex associated with trait anxiety. Besteher et al. indicated positive correlations between the GVMs of the right LING and CAL and panic severity (Besteher et al., 2018). Frick et al. (2014) suggested positive correlations between GMVs of LING and fearful level, whereas several studies (Besteher et al., 2017; Yin et al., 2016) illustrated negative correlations between the GMVs of bilateral CAL and anxiety level. With regard to functional alteration, patients with PD exhibited hypoactivation in the FFG, CAL, and LING (Demenescu et al., 2013; Petrowski et al., 2014). Brain activation in the left IOG was significantly correlated with the anxiety state (Li et al., 2020), and so was FC between the left IOG and superior frontal gyrus. Additionally, Cui et al. (2016) found increased FC between the FFG and hippocampus/PHG in patients with PD. Our study showed lower DC and FC in occipital regions, indicating potential dysfunction in visual processing in patients with PD. Visual information involvement in emotional processing might contribute to mood dysregulation.
After 4 weeks of paroxetine treatment, clinical symptoms in patients with PD were relieved at a certain extent, as evidenced by the significantly decreased scores of HAMA, HAMD, SDSS, active coping subscales, and B-CATS. Compared with baseline, patients exhibited significantly higher DC values in the left CAL/LING and cerebellum IV/V and significantly increased FC values between the bilateral AC and left OFC/gyrus rectus.
Besides its common functions in visual processing, CAL is involved in attention shifting and working memory (van Kerkoerle et al., 2017), and LING is involved in emotional processing (Frick et al., 2014). Lai and Wu (2016) showed decreased FC in the left PHG, bilateral CAL, and right LING, contributing to fear generalization. The cerebellum, involved in emotion, cognition, sensation, and motion, is divided into 10 lobules with specific functional roles. Lobules I and II participate in language tasks, lobules III–VI and VIII in sensorimotor tasks, and lobules VI and VII in cognitive tasks (Stoodley et al., 2012). Recent studies indicated decreased neural activity (Petrowski et al., 2014) and white matter volumes (WMVs) (Konishi et al., 2014) in the cerebellum of patients with PD. Ni et al. (2021) found decreased FC within the right cerebellum V/VI, left cerebellum VI, and cerebellum vermis. As for regional FC in patients with PD, Chang et al. (2022) observed abnormal FC between the left MTG and cerebellum, and Li et al. (2020) observed abnormal FC between the left IOG and the right cerebellum VIII, which was further found to be positively correlated with anxiety state. Moreover, Besteher et al. (2017) noted a negative correlation between GMVs of the cerebellar vermis and somatic symptoms, and Yin et al. (2016) suggested a negative correlation between the amplitude of low-frequency fluctuations in the cerebellum and anxiety level. Combined with the altered DC values in line with symptom relief, our results demonstrated the function of paroxetine in the improvement of sensorimotor and emotional modulation in patients with PD.
The connection is an important part of the fear network, involved in emotion modulation (Ilomaki et al., 2022; Lai, 2020), panic inhibition (Liu and Lai, 2022), attentional regulation, and execution decision (Schoenberg, 2020). The OFC, integral to the default mode network and PFC, engages in sensory integration, anxiety regulation, and societal function (Kringelbach, 2005; Lai and Wu, 2012). Volumes of the OFC were significantly reduced in patients with PD (Roppongi et al., 2010; Wu et al., 2018), and WMVs of the right OFC correlated with symptom severity (Konishi et al., 2014). Given the crucial role of the amygdala in the fear network, dysfunctional connectivity between the OFC and amygdala (Croxson et al., 2005; Kringelbach, 2005) is related to somatic anxiety and fearful mood (Konishi et al., 2014), conducing to the pathological mechanism of PD. Brinkmann et al. (2017) found increased phasic activation in the AC and PFC of patients with PD, and Demenescu et al. (2013) illustrated the positive correlation of FC with anxiety severity, including FC between the amygdala-dorsal AC and PFC. Based on the above-mentioned findings, increased FC in the fronto-limbic network might be an index for panic relief.
To the best of our knowledge, this study was the first to utilize DC analysis and machine learning technology based on DC values to explore the neuropathological mechanisms and biomarkers for PD. However, this study had several limitations. First, the paroxetine treatment duration was only 4 weeks, which may have increased the risk of false negativity regarding changes in the brain post-treatment. Second, as a single-center study, it had a relatively small sample size. Moreover, the LOOCV accuracies do not represent generalization, which would require a fully independent data set. Therefore, although the SVM and SVR models demonstrated excellent performance in classification and predicting TR, their performance on other independent datasets of patients with PD remains unclear. Third, in the SVR model, the model tends to underestimate the treatment response (RRHAMA) when the observed values are greater than 0.5 and overestimate when the observed values are less than 0.5. For the underestimation, the differences between the observed and predicted TRs were not large, and all the predicted RRHAMA values were greater than 0.5. Therefore, this would not significantly impact the clinical significance of the model as it would not lead clinicians to consider additional or alternative interventions unnecessarily, which could potentially increase the risk of overtreatment. However, the overestimation might delay necessary treatment adjustments, potentially compromising patient outcomes. Although the small difference between the observed and predicted TRs would somewhat mitigate this risk, the potential bias might weaken the clinical significance of the model to some extent. Future multicenter studies with larger sample sizes and longer examination durations are warranted. Additionally, it is essential to validate the performance of SVM and SVR models on other datasets.
Conclusion
In this study, alterations in DC values were observed in the limbic network, temporal and occipital regions, including increased DC values in the bilateral AC and decreased DC values in the left MTG, right ITG, right CAL, right IOG, and bilateral FFG. Clusters exhibiting higher DC demonstrated a notable increase in FC. Consistently, clusters with reduced DC displayed a significant decrease in FC. These abnormal DC and FC indicated disrupted brain function in PD and served as its neural substrate. After a 4-week paroxetine treatment, patients with PD showed significantly increased FC values between the bilateral AC and left medial OFC/gyrus rectus, increased DC in the left CAL, left LING, and cerebellum IV/V, as well as improved clinical symptoms. These changes in brain function after treatment might be the neural represents of paroxetine treatment. The SVM and SVR, utilizing voxel-wise DC values at baseline, effectively distinguish between patients with PD and HCs and accurately predict the TR in patients.
Supplemental Material
sj-docx-1-jop-10.1177_02698811241278780 – Supplemental material for Influence of panic disorder and paroxetine on brain functional hubs in drug-free patients
Supplemental material, sj-docx-1-jop-10.1177_02698811241278780 for Influence of panic disorder and paroxetine on brain functional hubs in drug-free patients by Yingying Zhang, Haohao Yan, Yiding Han, Xiaoxiao Shan, Huabing Li, Feng Liu, Ping Li, Jingping Zhao and Wenbin Guo in Journal of Psychopharmacology
Footnotes
CRediT authorship contribution statement
Yingying Zhang: Writing – original draft, Data curation. Haohao Yan: Formal analysis, Writing – review and editing, Data curation. Yiding Han: Data curation. Xiaoxiao Shan: Data curation. Huabing Li: Data curation. Feng Liu: Methodology. Ping Li: Methodology. Jingping Zhao: Conceptualization. Wenbin Guo: Conceptualization, Funding acquisition, Writing – review and editing.
Declaration of conflicting interests
The author(s) declared no potential conflicts of interest with respect to the research, authorship, and/or publication of this article.
Funding
The author(s) disclosed receipt of the following financial support for the research, authorship, and/or publication of this article: This study was supported by grants from the National Natural Science Foundation of China (Grant No. 82171508) and the Fundamental Research Funds for the Central Universities of Central South University (Grant No. 2024ZZTS0304).
Supplemental material
Supplemental material for this article is available online.
References
Supplementary Material
Please find the following supplemental material available below.
For Open Access articles published under a Creative Commons License, all supplemental material carries the same license as the article it is associated with.
For non-Open Access articles published, all supplemental material carries a non-exclusive license, and permission requests for re-use of supplemental material or any part of supplemental material shall be sent directly to the copyright owner as specified in the copyright notice associated with the article.