
Abstract
Objectives:
Electroconvulsive shock (ES) can ameliorate psychotic symptoms and certain adverse effects of antipsychotics by inducing seizure activity via electrical brain stimulation. Although the relationship between ES and glial cells has been the focus of attention, the precise mechanisms underlying its effects remain unclear. This study aimed to investigate the effects of ES on astroglia in the drug-induced neurotoxicity rat model.
Methods:
Haloperidol (HAL; 0.75 mg/kg/day for 28 days) or vehicle was administered to rats via an osmotic mini-pump, then received repeated seizure-inducing electrical stimulus (80 mA, 100 Hz, for 1 seconds with a pulse width of 0.5 mseconds) or sham operation twice daily for five consecutive days. The levels of glial fibrillary acidic protein (GFAP), glutamate transporter-1, and glutamine synthetase were determined in the brain regions.
Results:
ES treatment led to GFAP expression, which is indicative of astrocyte activation. In the CA1 region, astrocytic changes associated with neurotoxicity were observed in the HAL-treated group. Furthermore, astroglial reactivity in this region was ameliorated following ES.
Conclusions:
The present study suggests that ES could activate the astrocytic system. Furthermore, our results also showed that ES may mitigate neurotoxic damage induced by antipsychotics. In view of the need for therapeutic strategies for treatment-resistant psychiatric disorders, further investigations of our findings are warranted.
Introduction
Electroconvulsive therapy (ECT), also known as electroconvulsive shock (ES), is one of the oldest forms of psychiatric somatic therapies (UK ECT Review Group, 2003), and it continues to be widely used in contemporary clinical practice (Leiknes et al., 2012). Although schizophrenia is one of the primary indications for ES, it is particularly effective in cases of rapidly worsening psychotic symptoms, especially positive symptoms. ES is also utilized for patients with other various psychiatric disorders and certain neurodegenerative diseases, including major depressive disorder (MDD), bipolar disorder, catatonia, neuroleptic malignant syndrome, and Parkinson’s disease (Mukhtar et al., 2023). Despite numerous studies investigating the mechanisms underlying ES, the precise biological processes remain unclear.
Several studies have focused on the relationship between ES and astrocytes—the most abundant and versatile type of glial cells in the central nervous system. A number of reports have demonstrated reductions in the number of astrocytes in human postmortem samples and animal models of schizophrenia and MDD (Dossi et al., 2018; Rajkowska and Stockmeier, 2013). Additionally, hippocampus volume loss has been consistently observed in patients with these disorders (MacQueen and Frodl, 2011; Nelson et al., 1998). These findings suggest that astrocyte loss may contribute to the observed hippocampal atrophy. Given the relationship between ES and brain volume, multiple studies have reported that ES can restore regional brain volume in humans (Oltedal et al., 2018; Takamiya et al., 2018). Cobb et al. (2013) proposed a link between the number of astroglial cells and brain volume, and other research has shown that ES-induced astrocyte activation may promote synaptogenesis (Dwork et al., 2004). These findings raise the possibility that the therapeutic effects of ES may be mediated, at least in part, through astrocytic mechanisms.
Haloperidol (HAL), a dopamine D2 receptor antagonist, is one of the oldest typical antipsychotics. Although it has largely been replaced by atypical antipsychotics in clinical practice, it is still used globally. While HAL has robust evidence for improving positive symptoms of schizophrenia, it is also associated with a range of adverse effects, including extrapyramidal symptoms, tardive dyskinesia (TD), and neuroleptic malignant syndrome. Notably, ES has been used to treat neuroleptic malignant syndrome, and previous studies have suggested that ES may also alleviate TD (Irinaka et al., 2024; Yasui-Furukori et al., 2014). The mechanisms underlying TD are thought to involve not only dopaminergic pathways but also other mechanisms, including those related to astrocyte function (Loonen, 2023). In light of these findings, investigating the relationship between ES and the adverse effects of antipsychotics, with a specific focus on astrocytes, is of considerable importance.
The aim of this study was to elucidate the potential mechanisms by which ES mitigates drug-induced neurotoxicity, with an emphasis on its effects on astroglia. We administered high-dose HAL or vehicle (VEH) to rats, performed ES, sacrificed them, collected brain tissues, and conducted Western blot analyses of astrocyte-specific proteins in the rats’ brain regions.
Materials and methods
Animals
Eleven-week-old male Wistar rats (Japan SLC, Hamamatsu, Japan) weighing 230–250 g were used. The animals were housed 2 per cage and were maintained under standard conditions (12–12 hours light-dark cycle: lights on from 0700 to 1900 hour; room temperature, 22°C ± 2°C; humidity, 55% ± 5%) with free access to food and water. Experiments were performed in accordance with the Chiba University Graduate School of Medicine Guide for the Care and Use of Laboratory Animals and were approved by the Chiba University Graduate School of Medicine Animal Care and Use Committee.
Drugs
HAL (0.75 mg/kg/day; Toronto Research Chemicals, North York, ON, Canada) was dissolved in a 2% glacial acetic acid/H2O solution (pH adjusted to 3.8 with NaOH) and administered with an Alzet osmotic mini-pump (model 2ML4; 28 day delivery; Durect, Cupertino, CA, USA). The dose of HAL was set at 0.75 mg/kg/day, which is high but clinically relevant (i.e., half as much again as the optimal dose), as determined from the data of animal studies (Amato et al., 2020; Kapur et al., 2003; Kimura et al., 2021; Oda et al., 2015).
Mini-pump implantation
An Alzet osmotic mini-pump containing either VEH (2% glacial acetic acid/H2O solution, pH adjusted to 3.8 with NaOH) or HAL was implanted in each rat under triple anesthesia (midazolam 3 mg/kg + medetomidine 0.23 mg/kg + butorphanol 0.38 mg/kg). The mini-pump was inserted to lie on the right side of the scapulae. The incision was closed using 9 mm surgical staples and then cleaned with 70% ethanol.
Treatment protocol
We allocated each rat to one of the following four groups: (1) the group treated with VEH for 28 days, followed by repeated ES sham operations from the 30th day to the 34th day twice daily (VEH-sham group; n = 8); (2) the group treated with VEH for 28 days, followed by repeated ES from the 30th day to the 34th day twice daily (VEH-ES group; n = 7); (3) the group treated with HAL for 28 days, followed by repeated ES sham operations from the 30th day to the 34th day twice daily (HAL-sham group; n = 8); (4) the group treated with HAL for 28 days, followed by repeated ES from the 30th day to the 34th day twice daily (HAL-ES group; n = 7). Initially, eight rats were allocated to each group. However, one rat in each ES group died during the ES procedure, resulting in a final sample size of seven for these groups. The drug or VEH administration was started on the first day after the pump implantation. The mini-pumps were removed on the 29th day.
ES procedure
ES-treated rats received a seizure-inducing electrical stimulus (80 mA, 100 Hz, for 1 second with a pulse width of 0.5 mseconds) via earclip electronodes under triple anesthesia (midazoram 0.75 mg/kg + medetomidine 0.06 mg/kg + butorphanol 0.1 mg/kg) twice daily for five consecutive days, from the 30th day to the 34th day. Stimulations were generated by an electroconvulsive device (Ugo Basile, Varese, Italy) and were administered bilaterally. All rats were monitored after ES to confirm that ES-induced tonic-chronic systemic seizures lasted for a minimum of 20 seconds. The rats received ES once again in the event of seizures lasting for less than 20 seconds. Sham-operated rats were anesthetized and pinched with earclips in the same manner as ES-treated rats, but no current was passed.
Western blot analysis
On the 36th day, rats were sacrificed by decapitation, and the left side of the medial prefrontal cortex (mPF), striatum, and hippocampus were rapidly dissected on ice. The hippocampus was further dissected into CA1, CA3, and the dentate gyrus (DG). Tissues were frozen on dry ice and stored at −80°C until use. The brain tissues were homogenized in Laemmli lysis buffer. The homogenized tissues were sonicated for 15 seconds. Aliquots (20 μg) were measured using the DC protein assay kit (Bio-Rad, Hercules, CA, USA) and incubated for 5 minutes at 95°C, with 4× loading buffer (125 mM tris/HCl, pH 6.8, 20% glycerol, 0.1% bromophenol blue, 20% β-mercaptoethanol, 4% sodium dodecyl sulfate) and then subjected to sodium dodecyl sulfate polyacrylamide gel electrophoresis (SDS-PAGE) using mini gels (Mini-Protean TGX™ Precast Gel; Bio-Rad). The proteins were transferred onto polyvinylidene difluoride (PVDF) membranes using a Trans Blot Mini Cell (Bio-Rad).
For immunodetection, the blots were blocked for 1 hour in Tris-buffered saline with 0.1% Tween 20 detergent (TBST) TBST (50 mM tris/HCl, pH 7.8, 133 mM NaCl, 0.1% Tween 20) containing 5% nonfat dry milk, followed by incubation with mouse monoclonal antibodies raised against glutamate transporter-1 (GLT-1; 1:100, #sc-365634; Santa Cruz Biotechnology, Santa Cruz, CA, USA) and rabbit monoclonal antibodies raised against glutamine synthetase (GS; 1:1,000, #ab176562; Abcam, Cambridge, UK) and glial fibrillary acidic protein (GFAP; 1:50,000, 7260; Abcam), overnight at 4°C in TBST containing 5% bovine serum albumin (BSA). The blots were washed five times with TBST.
Then, incubation with the secondary antibody (GE Healthcare Life Sciences, Buckinghamshire, UK) was performed for 1 hour at room temperature. After extensive washing, immunoreactivity was detected by ECL Prime Western Blotting Detection reagent (GE Healthcare Life Sciences). The images were captured and immunoreactive bands were quantified using a Fuji LAS3000-mini imaging system (Fujifilm, Tokyo, Japan) with Multi Gauge software ver. 3.0 (Fujifilm). β-actin immunoreactivity was used to monitor equal sample loading.
Statistical analysis
The data are expressed as the mean ± standard error of the mean. The statistical analysis of the Western blot results was done by analysis of variance (ANOVA) followed by a posthoc Tukey’s honestly significant difference test. Values of p < 0.05 were considered significant. All statistical calculations were carried out with IBM SPSS 19 (IBM Inc., Armonk, NY, USA) software for Windows.
Results
The expressions of GFAP
The one-way ANOVA of the GFAP data produced the following results based on the four groups of rats (VEH-sham, VEH-ES, HAL-sham, and HAL-ES). CA-1: F3,26 = 9.732, p < 0.001; CA-3: F3,26 = 8.178, p = 0.001; DG: F3,26 = 24.847, p < 0.001; St: F3,26 = 21.945, p < 0.001; and mPF: F3,26 = 10.358, p < 0.001. The posthoc (Tukey) analyses demonstrated that the levels of GFAP were significantly higher in the ES groups than those in the sham groups in the DG and St regions. In CA3 and mPF, GFAP levels were significantly higher in VEH-ES groups than in the VEH-sham groups. Although no significant difference was observed between HAL-sham groups and HAL-ES groups in CA3 and mPF, a similar tendency was noted. In CA1, VEH-ES groups also showed a tendency toward increased GFAP compared with VEH-sham groups, whereas HAL-ES groups showed significantly lower GFAP levels than HAL-sham rats (Figure 1).
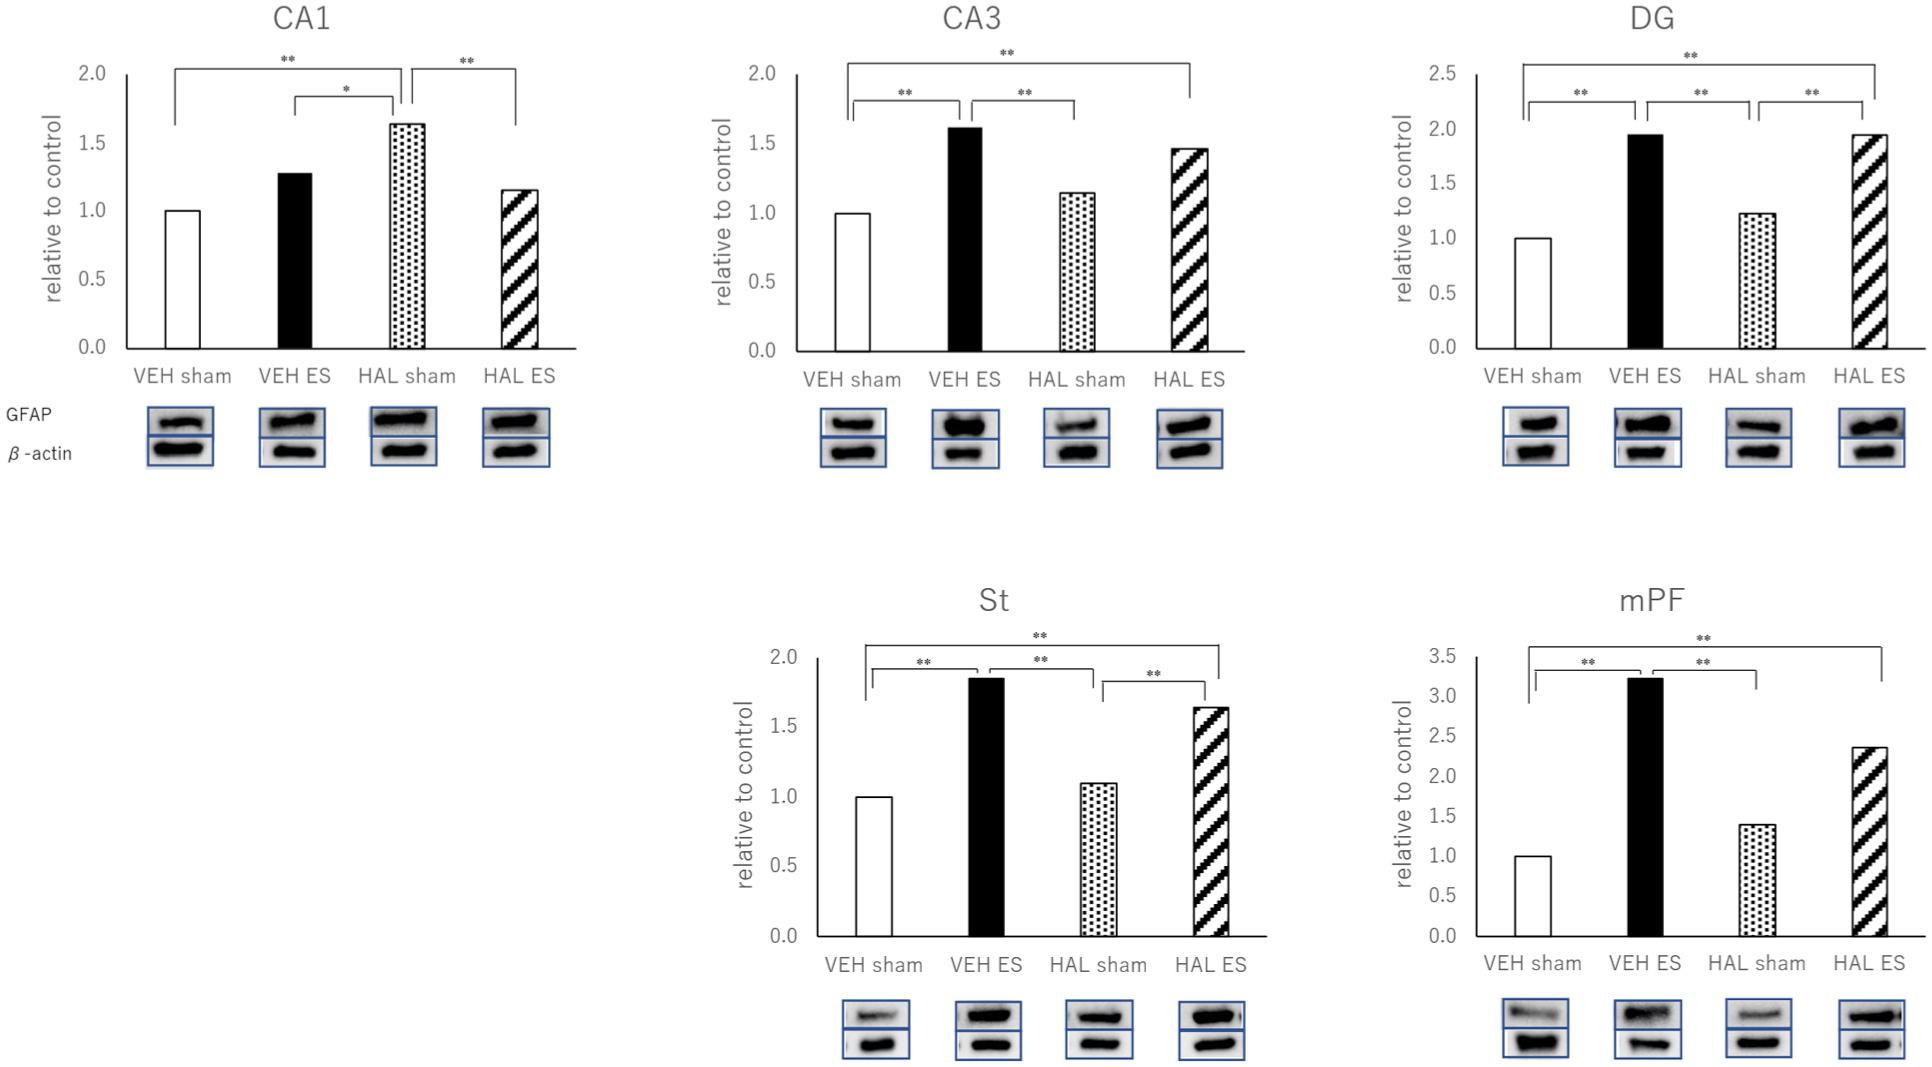
The expressions of GFAP in the CA-1, CA-3, DG, St, and mPF measured by Western blot.
The expressions of GS
The one-way ANOVA of the GS data produced the following results based on the four groups of rats (VEH-sham, VEH-ES, HAL-sham, and HAL-ES). CA-1: F3,26 = 0.874, p = 0.467; CA-3: F3,26 = 0.912, p = 0.449; DG: F3,26 = 5.632, p = 0.004; St: F3,26 = 6.231, p = 0.002; and mPF: F3,26 = 2.666, p = 0.069. The posthoc (Tukey) analyses demonstrated that, in the DG region, GS levels were significantly higher in the HAL-sham group compared with the VEH-sham group. Additionally, in the St region, GS levels were significantly higher in the HAL-sham and HAL-ES groups compared with the VEH-sham group. No significant differences were observed among groups in CA1, CA3, or mPF (Figure 2).
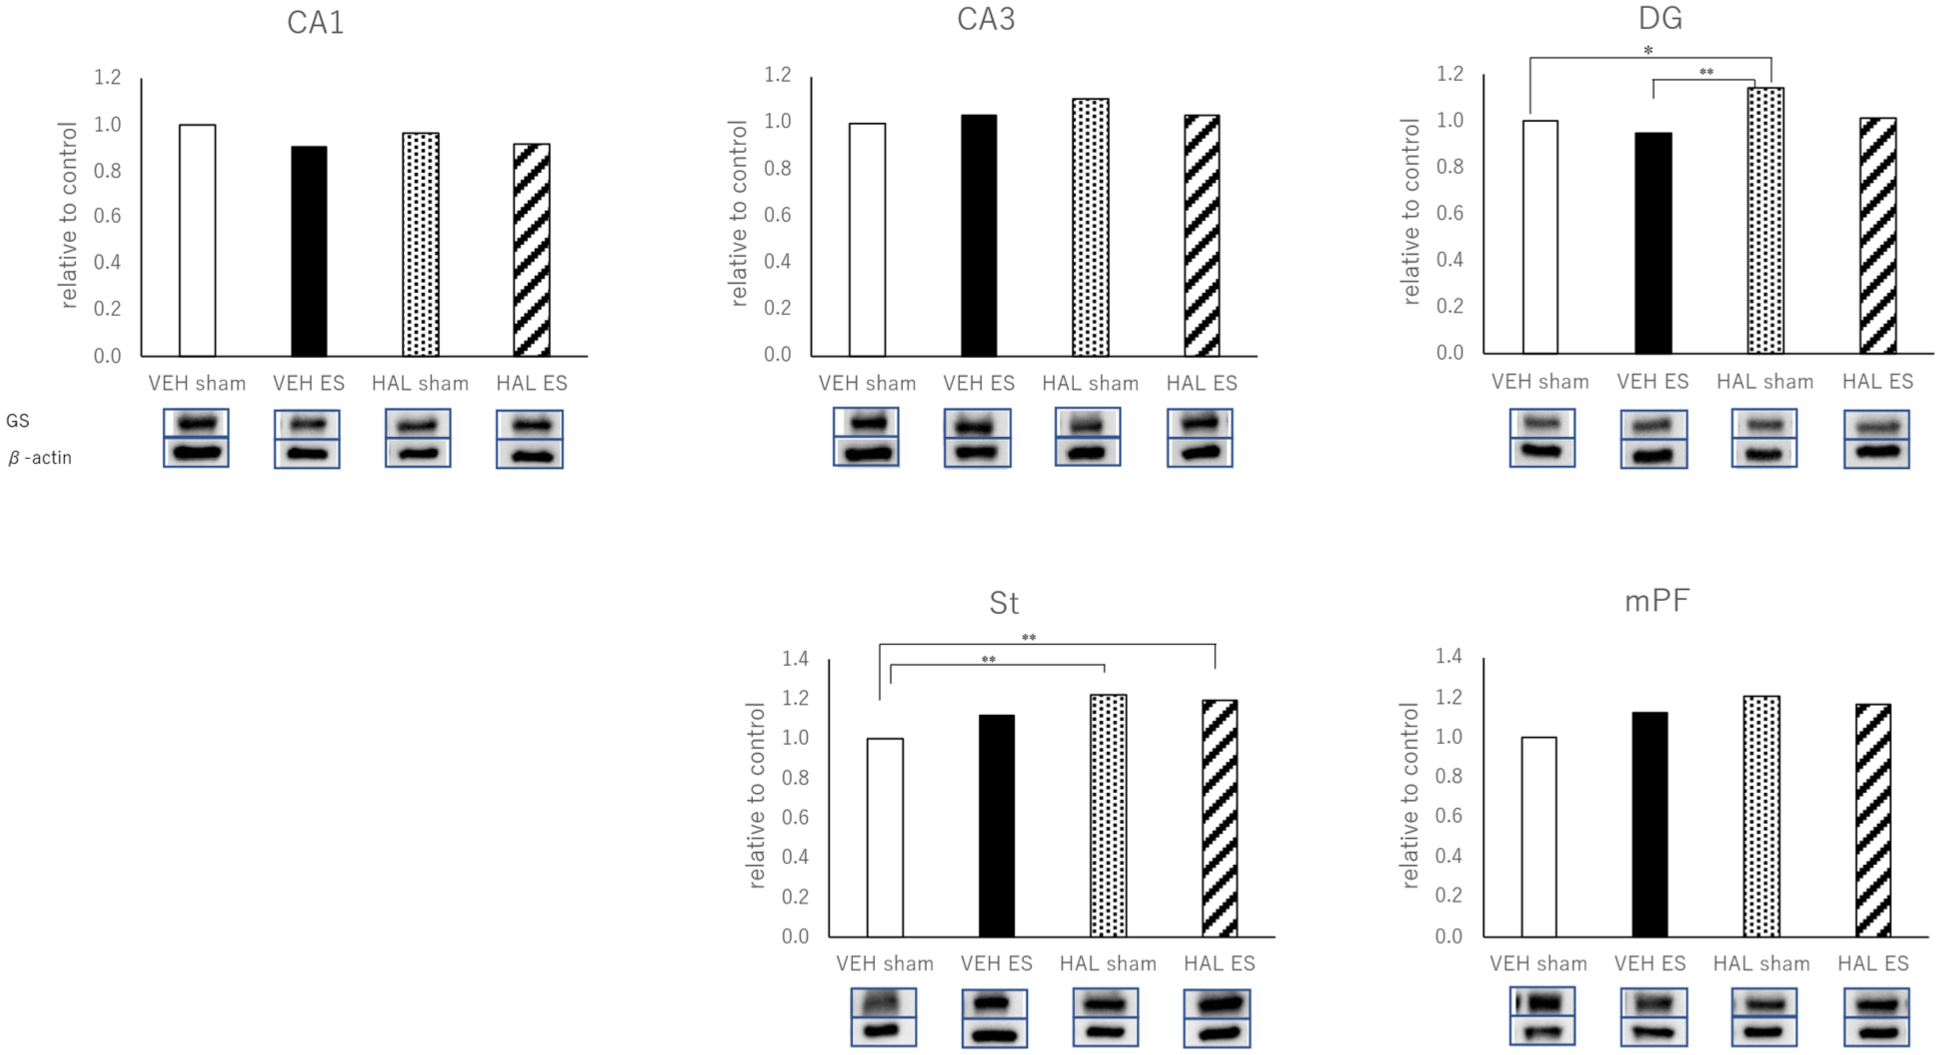
The expressions of GS in the CA-1, CA-3, DG, St, and mPF measured by Western blot.
The expressions of GLT-1
The one-way ANOVA of the GLT-1 data produced the following results based on the four groups of rats (VEH-sham, VEH-ES, HAL-sham, and HAL-ES). CA-1: F3,26 = 2.341, p = 0.097; CA-3: F3,26 = 0.689, p = 0.567; DG: F3,26 = 1.242, p = 0.315; St: F3,26 = 0.943, p = 0.434; and mPF: F3,26 = 7.187, p = 0.001. The posthoc (Tukey) analyses demonstrated that, in the mPF region, the levels of GLT-1 were significantly higher in the HAL-sham group compared with the VEH-sham group. No significant differences were observed among groups in CA1, CA3, DG, or St (Figure 3).
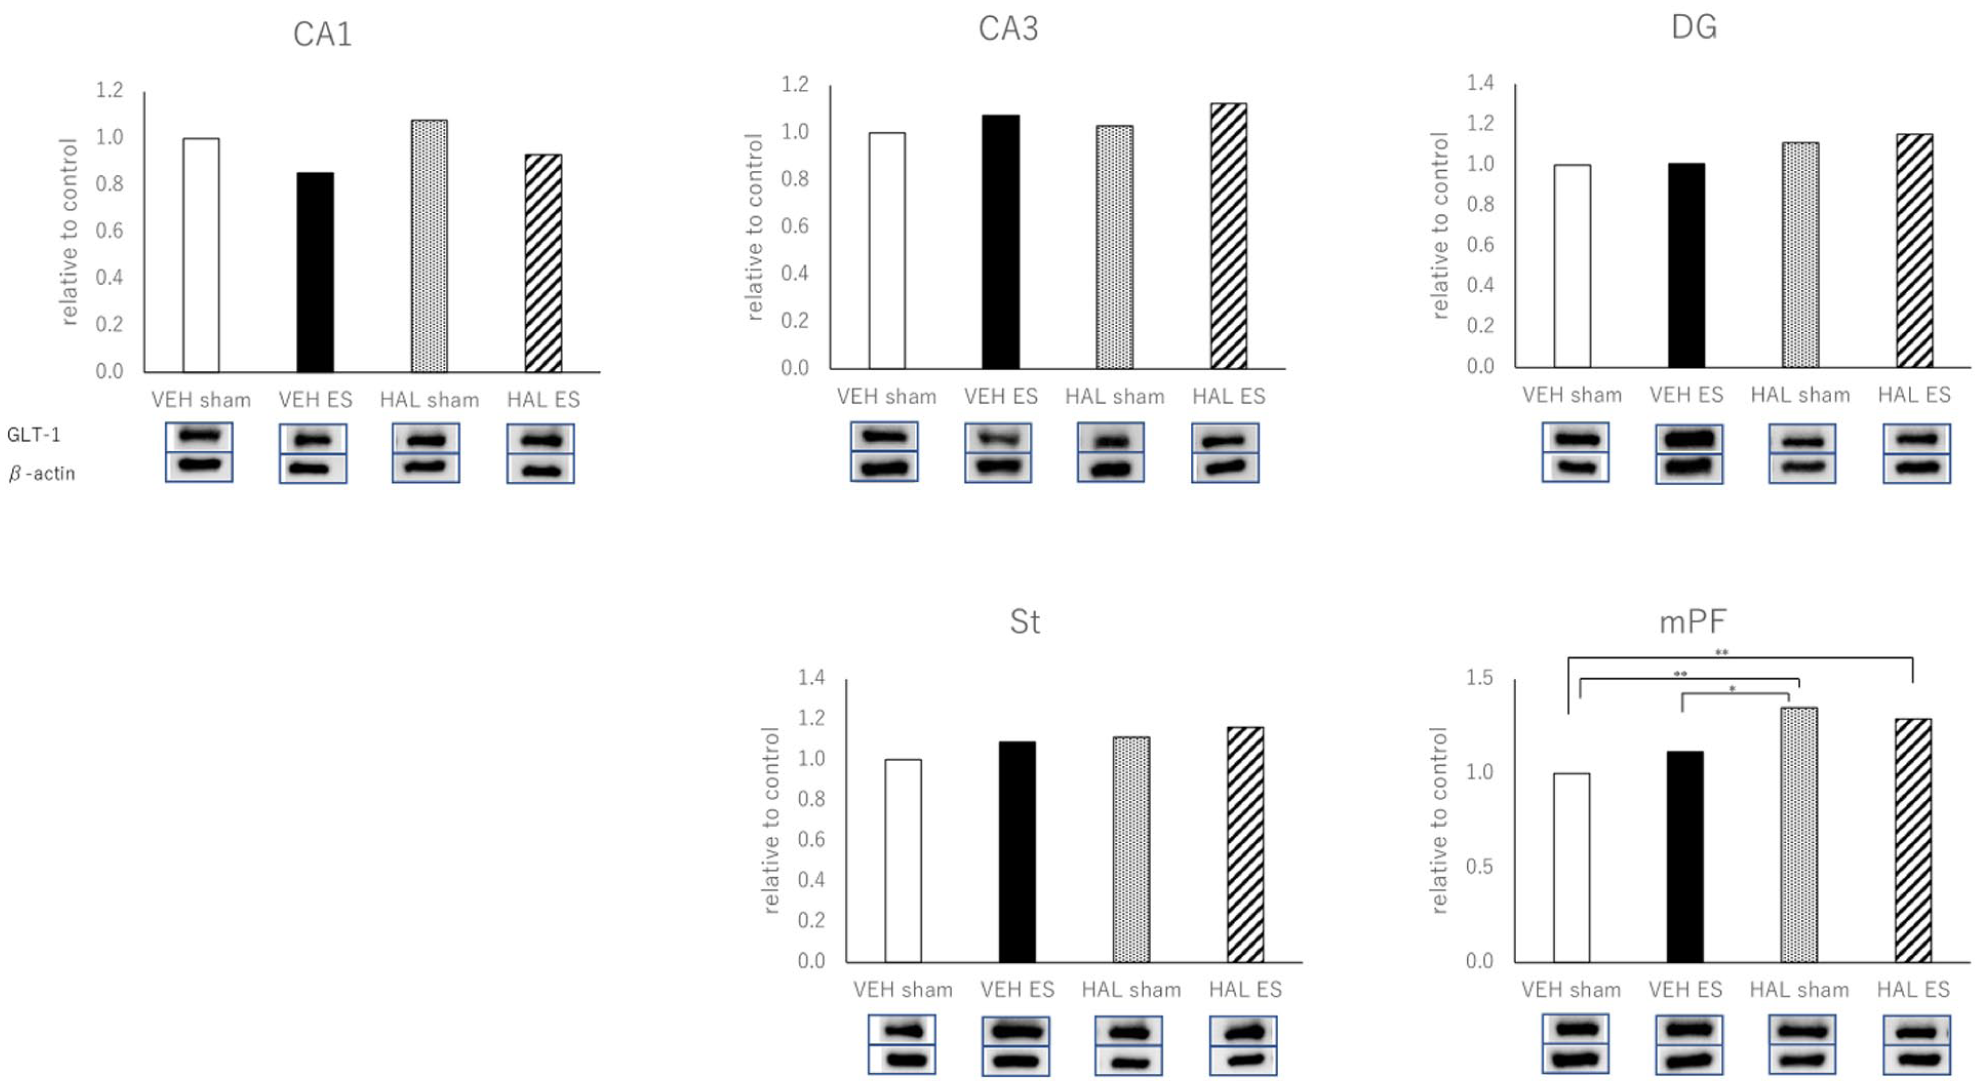
The expressions of GLT-1 in the CA-1, CA-3, DG, St, and mPF measured by Western blot.
The ratio of GS to GFAP
The one-way ANOVA of the ratio of GS to GFAP data produced the following results based on the four groups of rats (VEH-sham, VEH-ES, HAL-sham, and HAL-ES). CA-1: F3,26 = 6.028, p = 0.003; CA-3: F3,26 = 5.472, p = 0.005; DG: F3,26 = 32.789, p < 0.001; St: F3,26 = 7.286, p = 0.001; and mPF: F3,26 = 10.088, p < 0.001. The posthoc (Tukey) analyses demonstrated that the GS to GFAP ratio was significantly lower in the VEH-ES groups than in the VEH-sham groups across all regions. In DG, St, and mPF, the ratio was also significantly lower in the HAL-ES group compared with the HAL-sham group, while no significant differences were observed between the HAL-ES group and the HAL-sham group in CA1 or CA3 (Figure 4).
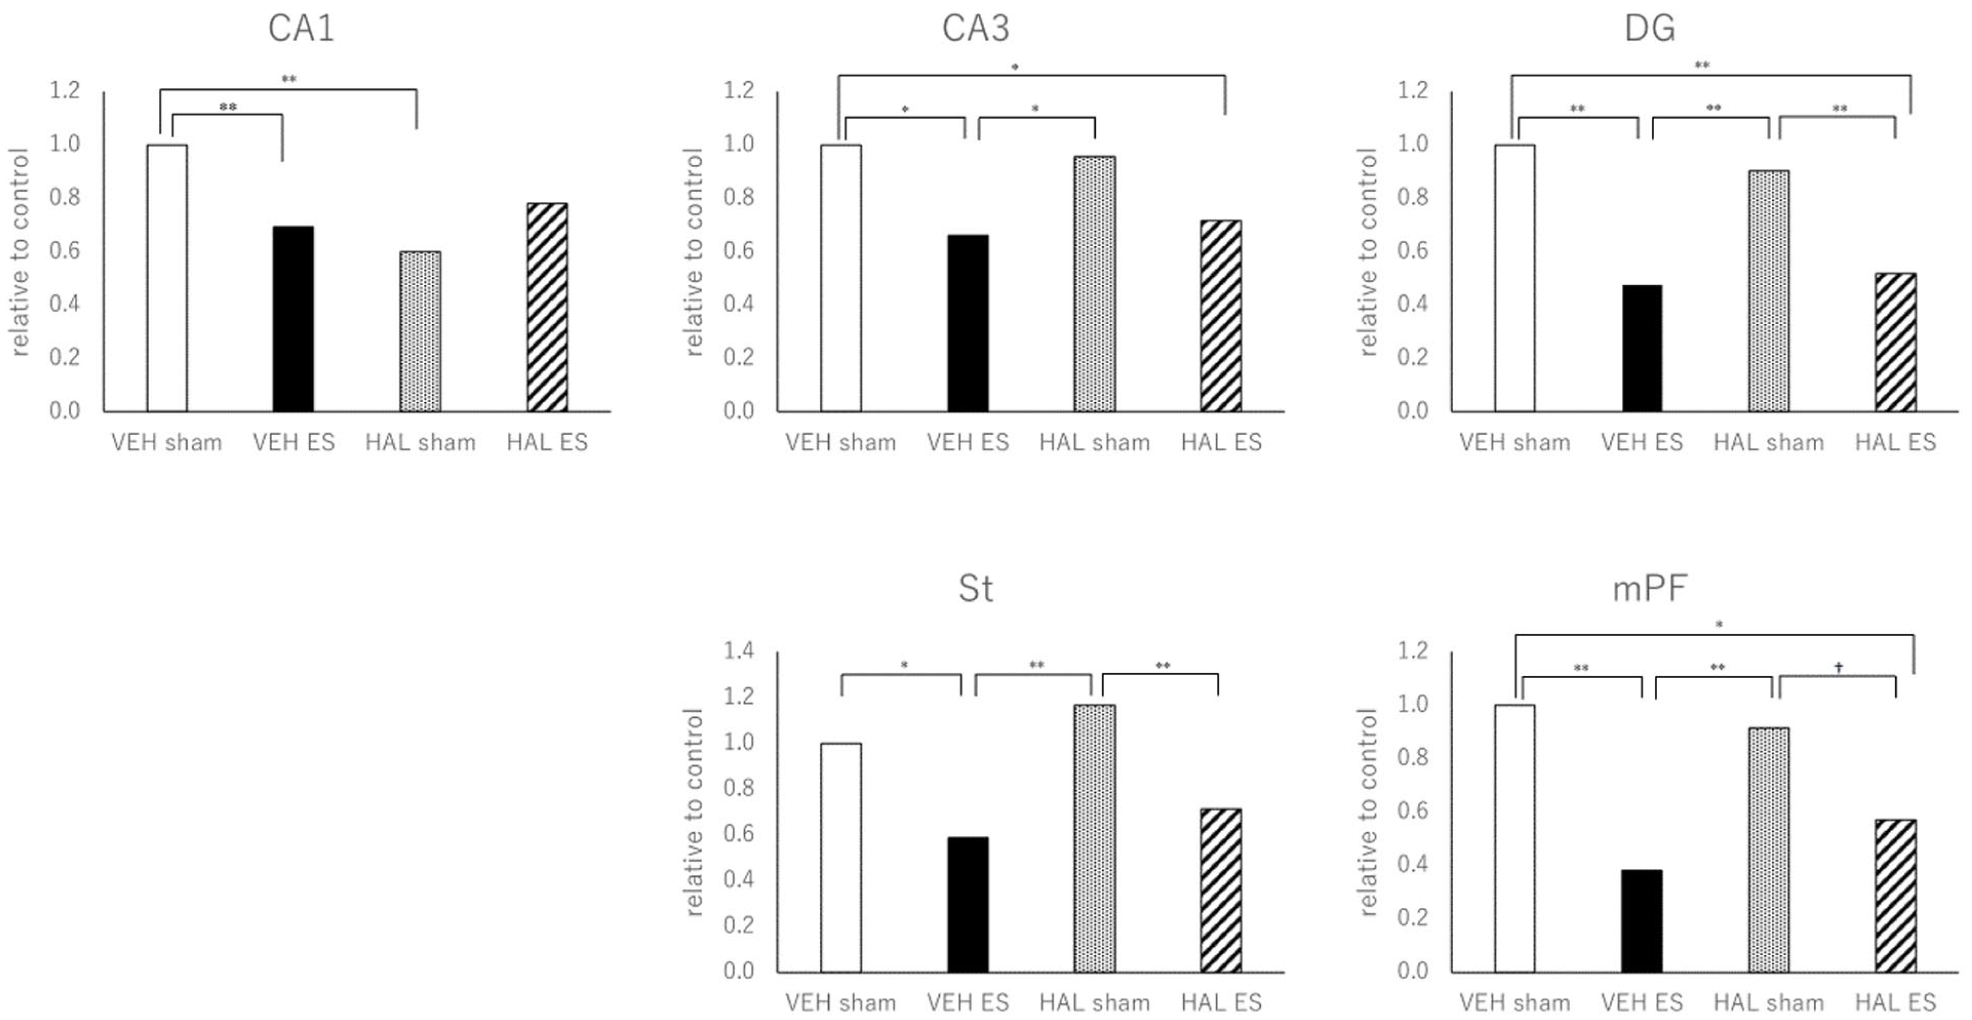
The ratio of GS to GFAP in the CA-1, CA-3, DG, St, and mPF measured by Western blot.
Discussion
One of the main findings of this study is that GFAP levels were significantly increased after ES in all brain regions except for the CA1 region in the HAL group, whereas the levels of GLT-1 and GS remained unchanged. Several previous studies have reported an increase in GFAP following ES (Dwork et al., 2004; Okada-Tsuchioka et al., 2014; Steward, 1994), and others have indicated that astrocytes become activated in response to ES (Jansson et al., 2009). Our current results regarding GFAP are consistent with these reports. Given that elevated GFAP levels are generally considered indicative of astroglial activation (Gottipati et al., 2014), we interpret the GFAP increase observed in this study as a marker of astroglial activation.
Astroglial activation is commonly observed following brain stimulation or injury, including ES, and severe neuronal insults such as ischemia or hypoxia (Jansson et al., 2009; Kang et al., 2014). In the context of astroglial activation, changes in the expression of GS or GLT-1 have not been consistently reported. However, some studies have shown that severe neuronal damage leads to both increased GS expression (Benton et al., 2000; Dao et al., 1991; Tanaka et al., 1992) and decreased GLT-1 levels (Sheldon and Robinson, 2007). Severe neuronal damage typically results in neuronal dysfunction, whereas astrogrial activation is known to exert neuroprotective effects. These include clearing glutamate from synaptic regions, secretion of neurotrophic factors, and promotion of angiogenesis, neurogenesis, synaptogenesis, and axonal remodeling (Patabendige et al., 2021), all of which are associated with increased GFAP expression and astrocyte hypertrophy (Brahmachari et al., 2006; Sofroniew and Vinters, 2010). Therefore, in considering the therapeutic effect of ES, it may be important to determine whether astroglial activation occurs in the presence or absence of severe neuronal damage. To address this, we calculated the GS to GFAP ratio. We consider that the GS to GFAP ratio indirectly reflects astroglial activation occurring in the absence of severe neuronal damage. Since we observed a decreased GS to GFAP ratio across all brain regions in our present study, this finding may suggest that ES induces astroglial activation without causing substantial neuronal injury, thereby exerting a neuroprotective and potentially therapeutic effect. Several studies have also documented the neuroprotective effects of ES, and our present results are consistent with those reports, which describe increased neurogenesis associated with ES (Cao et al., 2018; Oltedal et al., 2018; Rojas et al., 2022). Moreover, while brain tissue volume reduction has been reported in many disorders for which ES is effective, including MDD and schizophrenia (Brosch et al., 2022), other studies have documented increased hippocampal volume following ES in humans (Qiu et al., 2016). Our present findings thus support the hypothesis that astroglial activation may contribute to both the restoration of brain volume and the neuroprotective effects of ES. Although there has been the outdated notion that ECT damages the brain in humans, our findings contradict this view (Swartz, 2024).
The second major finding of this study is that GFAP levels in the HAL-sham group were significantly higher compared to VEH-sham group, but only in the CA1 region. It is well known that antipsychotics, particularly typical antipsychotics including HAL, exert cytotoxic effects (Gasso et al., 2012; Ukai et al., 2004). HAL, a widely used neuroleptic, acts through blockade of dopamine receptors, leading to increased turnover of dopamine (Scatton, 1977). This increased turnover can result in oxidative stress due to excessive production of hydrogen peroxide, ultimately contributing to cytotoxicity (Cohen and Spina, 1989; Galili et al., 2000; Shivakumar and Ravindranath, 1993; Spina and Cohen, 1988). Raudenska et al. (2013) reported oxidative stress can also induce astrocyte activation. We therefore suggest that the elevated GFAP levels observed in the HAL-sham group reflect astrocyte activation in response to oxidative stress induced by HAL. Previous research has shown that HAL is cytotoxic to primary hippocampal neurons (Behl et al., 1995). Among hippocampal subregions, CA1 is recognized as particularly vulnerable to cytotoxic insults, including oxidative stress (Bartsch et al., 2015). Thus, our finding that only CA1 showed increased GFAP expression in response to HAL is consistent with the known vulnerability of this region.
Our third finding is that GFAP expression in the HAL-ES group was significantly lower than in the HAL-sham group in CA1, unlike in other groups or brain regions. As noted earlier, HAL induces cytotoxicity via oxidative stress related to increased dopamine turnover. Yoshida et al. (1997) reported that while the extracellular dopamine levels are elevated after a single session of ES, they return to baseline with repeated ES. This suggests that the dopamine-releasing effect of ES gradually diminishes with repeated sessions. Given that our ES protocol involved twice-daily treatments, more frequent than in the Yoshida et al. study, we hypothesize that repeated ES in our model led to dopamine depletion, thereby reducing oxidative stress. This reduction may explain the observed decrease in GFAP expression in the HAL-ES group in CA1. Although ES is generally associated with oxidative stress (Ilhan Atagun and Atay Canbek, 2022), our current findings suggest that ES may actually reduce oxidative stress when they have already been elevated by high-dose antipsychotic administration. As described earlier, previous studies have suggested that CA1 is particularly vulnerable to oxidative stress. In light of this reported vulnerability, the finding that only this region showed decreased GFAP expression in the HAL-ES group appears reasonable.
There are several limitations to this study that should be noted. First, we used naïve rats to specifically investigate the mechanisms of HAL-induced neurotoxicity and the effects of ES. However, from the perspective of clinical relevance, the use of a schizophrenia model would be more appropriate. Second, while we referred to region-specific vulnerability within the hippocampus, we did not conduct behavioral experiments related to these regions. Thus, it remains unclear whether the neural changes we observed translate into any functional outcomes. Future studies should adopt a schizophrenia model and incorporate behavioral assessments to address this issue. Third, to validate our dopaminergic hypothesis, future studies should include direct measurements of extracellular dopamine levels. Additionally, beyond dopaminergic metabolism, other pathways, such as those involving microglial activation and neuroinflammatory mediators, may also play important roles in astrocyte activation. While our current discussion focuses primarily on the dopaminergic aspects of ES and HAL interaction, further studies are warranted to fully elucidate the underlying mechanisms of ES.
The drug dose used in this study is based on the clinically comparable dopamine D2 receptor occupancy, and we thus believe that the doses are clinically relevant. However, we do not claim that antipsychotics are toxic to the human brain. For example, Chen and Nasrallah (2019) reported neuroprotective effects rather than neurotoxicity of ‘atypical’ antipsychotics in their meta-analysis. Although the same study also referred to the presence of reports that indicate neurotoxicity of ‘typical’ antipsychotics, all evidence was derived from animal studies, with no direct evidence in humans. Consistent with this, our current findings do not provide evidence of HAL neurotoxicity in humans.
In summary, GFAP expression was increased following ES across all brain regions, except for the CA1 region in the HAL group. The GS to GFAP ratio was decreased, which possibly reflects astrocyte activation without accompanying neuronal damage, suggesting a neuroprotective role that may underlie the therapeutic effects of ES. In contrast, GFAP levels were increased only in CA1 following HAL administration and were decreased in the HAL-ES group compared to HAL-sham group, indicating that high-dose HAL induces cytotoxicity, and that ES may exert therapeutic effects by mitigating this oxidative stress.
Footnotes
Author contributions
Conceived and designed the experiments: Y.H., Y.O., F.Y., F.Y., Y.N., Y.S., and T.N. Performed the experiments: Y.H. and Y.O. Analyzed the data: Y.H. and Y.O. Wrote the paper: Y.H. and Y.O. Supervised the research: N.T.
Funding
The authors disclosed receipt of the following financial support for the research, authorship, and/or publication of this article: This study was supported by a Grant-in-Aid for Young Scientists (to Y.O., No. 20K16664) from the Japan Society for the Promotion of Science (JSPS).
Declaration of conflicting interests
The authors declared no potential conflicts of interest with respect to the research, authorship, and/or publication of this article.