
Abstract
Background
The medial amygdala nucleus (MeA) has been implicated in stress responses. However, the local neurochemical mechanisms involved are not completely understood.
Aims
This study examined how angiotensin II and angiotensin-(1–7) neurotransmissions within the MeA contribute to cardiovascular, autonomic, and anxiogenic-like responses to acute restraint stress (ARS) and repeated restraint stress (RRS) in rats.
Methods
Selective angiotensinergic receptor antagonists and agonists were microinjected into the MeA, and physiological and behavioral responses were evaluated during ARS and the 10th restraint session (i.e., RRS).
Results
During ARS, tachycardia was potentiated by angiotensin II, the AT1 receptor antagonist losartan, and angiotensin-(1–7), whereas antagonism of AT2 receptors with PD123319 or Mas receptors with A-779 attenuated this effect. AT2 receptor antagonism also reduced the pressor response and sympathetically mediated cutaneous vasoconstriction. In addition, angiotensin II, losartan, and angiotensin-(1–7) reduced the anxiogenic-like behavior in the elevated plus maze following ARS. RRS did not affect gene expression of angiotensinergic receptors in the MeA. Consistently, angiotensin-(1–7) produced similar effects during ARS and the 10th restraint session. However, contrary to findings obtained in acutely stressed animals, angiotensin II and losartan failed to influence responses during the 10th restraint session. Interestingly, AT2 receptor antagonism, which reduced tachycardia in ARS, enhanced it under chronic stress.
Conclusions
These findings indicate that angiotensin II/AT1-AT2 receptors and angiotensin-(1–7)/Mas receptor axes within the MeA regulate cardiovascular and anxiety-related responses to acute stress, and their roles are influenced by repeated stress exposure.
Introduction
Stress is described as a risk factor for the development of a variety of diseases, including cardiovascular and anxiety disorders (Kivimäki and Steptoe, 2018; Struijs et al., 2021; Szuhany and Simon, 2022; Vaccarino and Bremner, 2024). In addition, affective and anxiety disorders are risk factors for cardiovascular morbidity and mortality, while cardiovascular diseases can increase the incidence of depression and anxiety (Cohen et al., 2015; Emdin et al., 2016; Jackson et al., 2018; Rozanski et al., 1999). This evidence suggests a potential bidirectional relationship between stress-evoked behavioral changes and cardiovascular dysfunctions.
The amygdaloid complex, particularly the medial amygdala nucleus (MeA), has been described to play a critical role in mediating behavioral and physiological responses during threat situations (Melleu and Canteras, 2025; Myers, 2017; Prakash et al., 2025). Indeed, the MeA is activated in response to stressful stimuli (Cooper et al., 2023; Crane et al., 2005; Cullinan et al., 1995; Furlong et al., 2014; Kubo et al., 2004), and it seems to be the amygdaloid region more intensely recruited (Davern and Head, 2011). Accordingly, MeA has been described as part of the brain circuits involved in cardiovascular (Fortaleza et al., 2009; Kubo et al., 2004; Myers, 2017) and anxiogenic-like (Ebner et al., 2004; Liu et al., 2013) effects evoked by restraint stress. Despite these pieces of evidence, the neurochemical mechanism related to MeA control of stress responses is not completely understood. Moreover, repeated exposure to stress events has been shown to induce functional, morphological, and neurochemical alterations in the MeA (Bennur et al., 2007; Gray et al., 2010, 2014; Mozhui et al., 2010). This latter evidence indicates that prior exposure to chronic stress can alter the control of stress responses by MeA, which could be related to chronic stress-evoked dysfunctions. However, control by the MeA of behavioral and physiological responses to stress in chronically stressed animals is not completely understood.
The renin-angiotensin system (RAS) is involved in expression and modulation of stress responses (Correa et al., 2022; Saavedra, 2017; Saavedra and Armando, 2018). The canonical pathway of synthesis of RAS components begins with the cleavage of angiotensinogen into the decapeptide angiotensin I (Ang I), followed by hydrolyzes of Ang I to the active octapeptide angiotensin II (Ang II) by the angiotensin-converting enzyme (ACE; Hall, 2003; Karnik et al., 2015). However, Ang II can also be formed via ACE-independent pathways from Ang I or directly from angiotensinogen (Karnik et al., 2015). Two receptors for Ang II have been identified, AT1 and AT2, being the former related to the well-known effects of Ang II, including involvement in expression of stress responses, whereas AT2 receptor seems to have a counterregulatory influence (Campagnole-Santos et al., 2025; Goulart et al., 2022; Saavedra and Armando, 2018). The RAS also includes other biologically active peptides such as angiotensin III, angiotensin IV, and angiotensin-(1–7) (Ang-(1–7); Bader, 2010; Karnik et al., 2015). Ang-(1–7) is mainly synthesized through the action of an enzyme analogous to ACE, the ACE2, via hydrolysis of Ang II (Campagnole-Santos et al., 2025). Nevertheless, Ang-(1–7) can also be generated from Ang I and Ang II through alternative peptidases (Bader, 2010; Karnik et al., 2015; Santos et al., 2013). The effects of Ang-(1–7) are mainly mediated by the Mas receptor (Santos et al., 2003), whose activation has been reported to inhibit stress-evoked responses (Campagnole-Santos et al., 2025; Correa et al., 2022; Goulart et al., 2022).
Angiotensinergic terminals and components of the RAS including angiotensinogen, ACE, and Ang II (AT1 and AT2) and Ang-(1–7) (Mas) receptors were identified within the MeA (Chai et al., 1987; de Kloet et al., 2016; Freund et al., 2012; Lenkei et al., 1997; Lynch et al., 1987; von Bohlen und Halbach, 2005; Yu et al., 2019b). ACE2 was also identified in whole-amygdala samples (de Kloet et al., 2020; Tikhonova et al., 2018; Wang et al., 2016). However, a role of angiotensinergic neurotransmissions present within the MeA on blood pressure and heart rate (HR) changes and anxiogenic-like effect evoked by stress has never been described, especially considering comparison of acutely × chronically stressed animals and a joint analysis of physiological and behavioral responses. Therefore, the present study aimed to investigate the Ang II- and Ang-(1–7)-mediated neurotransmissions within the MeA, focusing on the role of AT1, AT2, and Mas receptors on the expression of cardiovascular responses and anxiogenic-like effects evoked by both an acute restraint stress (ARS) and repeated restraint stress (RRS) sessions.
Experimental procedures
Animals
Male Wistar rats with body weights ranging from 240 to 260 g (8-weeks-old) were used. All rats were obtained from the animal breeding facility of the São Paulo State University-Unesp (Botucatu, SP, Brazil). The rats were housed in collective plastic cages (four animals/cage) in temperature-controlled rooms at 24°C with 12 hours light-dark cycle (light 7 a.m. to 7 p.m.) and free access to water and food. All procedures were approved by the Local Ethical Committee for Use of Animals (approval #62/2015).
Stereotaxic surgery
Rats were subjected to inhalation anesthesia with isoflurane (2%) using a low-flow anesthesia system (Bonther, Ribeirão Preto, SP, Brazil). After scalp anesthesia with 2% lidocaine, the skull was exposed and stainless-steel guide cannulas (26-G, 12-mm-long) were bilaterally implanted using a stereotaxic apparatus (Stoelting, Wood Dale, IL, USA) into the anterior portion of the MeA at a position 1 mm above the site of injection. The procedure was as previously described by our laboratory (Costa-Ferreira et al., 2019, 2021; Marchi-Coelho et al., 2021; Moreno-Santos et al., 2021). As prophylactic measurement, after surgery the rats were treated with a poly-antibiotic formulation (560 mg/mL/kg, i.m., Pentabiotico®; Fort Dodge, Campinas, SP, Brazil) and the non-steroidal anti-inflammatory drug flunixin meglumine (0.5 mg/mL/kg, s.c., Banamine®; Schering-Plough, Cotia, SP, Brazil).
Stress protocols
Restraint stress consisted of introducing the animals into plastic cylindrical tubes (diameter = 6.5 cm, length = 15 cm, ventilated by ½ inch holes that comprised approximately 20% of the tube). The animals were maintained in the restraint tube for 60 minutes (Barretto-de-Souza et al., 2022; Crestani et al., 2009; Fortaleza et al., 2009), being returned to the home-cage after the end of the stress session.
Independent groups of animals were subjected to either an acute session of restraint stress or repeated exposure to this stressor. The protocol of RRS was performed as previously described by our group (Benini et al., 2019, 2025; Costa-Ferreira et al., 2016, 2021; Santos et al., 2020; Vieira et al., 2018). Briefly, the animals were subjected to restraint stress 1 hour daily (always starting at 9:00 a.m.) for 10 consecutive days.
Femoral artery catheter implant
Animals were subjected to inhalation anesthesia with isoflurane (2%) using a low-flow anesthesia system (Bonther) and underwent surgery to implant a polyethylene cannula into the femoral artery for cardiovascular recording (Costa-Ferreira et al., 2019, 2021). After surgery, the rats were subjected to prophylactic treatments with antibiotic and anti-inflammatory drugs as described above (see section “Stereotaxic surgery”). The rats were single-housed throughout the period after this procedure.
Arterial pressure and HR recording
Mean arterial pressure (MAP) and HR values were obtained from pulsatile arterial pressure, which was recorded as previously described by our laboratory (Costa-Ferreira et al., 2019, 2021; Vieira et al., 2018).
Tail skin temperature recording
Decrease in tail skin temperature (TST) was assessed as an indirect measurement of vasomotor sympathetic response in cutaneous beds during restraint stress (Barretto-de-Souza et al., 2022; Busnardo et al., 2026; Vianna and Carrive, 2005). TST recordings were performed using a thermal imaging camera (IRI4010; InfraRed Integrated Systems Ltd., Northampton, UK). Image analysis was conducted with thermographic analysis software, and TST data were represented as variations in color intensity. For image analysis, temperature measurements were taken at five points along the animal’s tail, and the average value was calculated for each recording (Barretto-de-Souza et al., 2022; Oliveira et al., 2015).
Behavioral analysis in the elevated plus maze
The elevated plus maze (EPM) test was employed to evaluate the anxiogenic-like effect of restraint stress. The apparatus consisted of two open arms and two closed arms, each measuring 50 cm in length and 10 cm in width, arranged perpendicularly and elevated 50 cm above the floor. The closed arms were surrounded by 40-cm-high wooden walls, while the open arms had a 1-cm lateral acrylic edge to prevent animals from falling. Rodents typically avoid the open arms, and anxiolytic drugs generally increase exploration of the open arms without affecting the number of entries into the closed arms (Carobrez and Bertoglio, 2005; Pellow et al., 1985). The maze was cleaned with a 20% alcohol solution in the interval between each animal. Behavior was recorded using a video camera (Microsoft Lifecam Cinema HD; Microsoft, Redmond, Washington, USA) for a 5-minute period. Videos were analyzed using the ANY-Maze behavioral tracking software (Stoelting). Behavioral measures included the number of entries and the time spent into the open arms and entries into the closed arms.
Drugs and solutions
Ang-(1–7) (Sigma–Aldrich, St. Louis, MO, USA), the selective Mas receptor antagonist A-779 (Sigma–Aldrich), Ang II (Tocris, Westwoods Business, Park Ellisville, MO, USA), the selective AT1 receptor antagonist losartan (Sigma–Aldrich), the selective AT2 receptor antagonist PD123319 (Tocris), tribromoethanol (Sigma–Aldrich), and urethane (Sigma–Aldrich) were dissolved in saline solution (0.9% NaCl). The polyantibiotic drug (Pentabiotico; Fort Dodge), the anesthetic agent isoflurane (Isoforine®; Cristrália, Itapira, SP, Brazil), and the anti-inflammatory drug flunixin meglumine (Banamine; Schering-Plough, Cotia, SP, Brazil) were used as supplied by the manufacturers.
Drug microinjection into the MeA
Microinjections into the brain were performed as previously described by our laboratory (Costa-Ferreira et al., 2019, 2021; Marchi-Coelho et al., 2021), being 100-nL microinjected in each brain hemisphere.
Anatomical determination of intra-brain injection sites
At the end of each experiment, animals were anesthetized with urethane (1.2 g/kg, i.p.) and 100 nL of 10% Evan’s blue dye was bilaterally microinjected to verify the intra-brain injection sites. Subsequently, the brains were removed, post-fixed, and sectioned into 40-μm-thick coronal slices for analysis of the injection sites. The microinjection sites were identified according to the atlas of Paxinos and Watson (1997).
Quantitative polymerase chain reaction
Using reverse transcription-quantitative polymerase chain reaction (RT-qPCR), the gene expression of the angiotensinergic receptors (AT1a, AT1b, AT2, and MAS) was assessed in samples of the MeA. For this purpose, male Wistar rats were decapitated, and the brains were rapidly removed and frozen in −50°C isopentane solution. The brains were stored in a freezer at −80°C until processing. Bilateral punches (using 12-G needles) from MeA were taken from 1-mm coronal sections that were obtained using a cryostat at -20°C. RNA was isolated using the PicoPure RNA isolation kit (ThermoFisher Scientific; Waltham, MA, USA), according to the manufacturer’s protocol. Furthermore, RNA concentration and purity (ratio of absorbance at 260 and 280 nm) were measured using the SPECTROstar® Nano (BMG LabTech; Ortenberg, Germany).
The complementary DNA (cDNA) was synthesized from 0.5 μg of total RNA using the Superscript III First-Strand cDNA Synthesis System (Invitrogen, Thermo Fisher Scientific; Waltham, MA, USA). Each 15 μL of qPCR reaction was performed with 2.0-μL cDNA as a template, using the TaqMan® Fast Advanced Master Mix (Applied Biosystems, Thermo Fisher Scientific). The qPCR assays were performed in duplicates on the Applied Biosystem 7500 Real-Time PCR System using TaqMan probes for AT1a receptor (Agtr1a; Rn02758772_s1), AT1b receptor (Agtr1b; Rn02132799_s1), AT2 receptor (Agtr2; Rn00560677_s1), Mas receptor (Mas R, Mas1; Rn00562673_s1), and glyceraldehyde-3-phosphate dehydrogenase (GAPDH-Rn01775763_g1), the latter used as the endogenous control gene. The samples were subjected to the following qPCR protocol template: 50°C for 2 minutes, 95°C for 10 minutes, then 40 cycles with denaturation at 95°C for 15 seconds, and annealing and extension at 60°C for 1 minute. Data were collected using 7500 Fast SDS Software version 1.5.1 (Applied Biosystems). All samples generated cycles to threshold (Ct) values within an acceptable linear range (between 15 and 30 cycles). GAPDH was highly stable between all samples with variance less than 1 Ct. Calculations of relative expression from Ct data (exponential value) were performed using the formula ΔCt = Ct (target gene) − Ct (GAPDH).
Experimental design
Involvement of angiotensinergic neurotransmissions within the MeA in cardiovascular responses during the 1st (ARS) and 10th (RRS) restraint stress session
This protocol aimed to investigate the involvement of Ang II/AT1-AT2 receptors and Ang-(1–7)/Mas receptor neurotransmissions present within the MeA in cardiovascular and TST responses during ARS and to evaluate whether prior exposure to restraint changes this control in animals subjected to RRS protocol. For this, all animals were submitted to stereotaxic surgery for implant of bilateral guide cannulas directed to the MeA, being kept in recovery for at least 4 days after the procedure. After this period, animals in the RRS groups were subjected to daily 60-minute restraint sessions for 9 consecutive days (RRS group), while ARS animals remained undisturbed at the animal facility. After the ninth stress session in the RRS, animals of both ARS and RRS groups were subjected to surgical procedure for the implant of catheter into the femoral artery for cardiovascular recording, and experiments were conducted 24 hours after surgery.
On the trial day, animals were taken to the experimental room and kept at rest for at least 60 minutes before starting the experiment for habituation to the room conditions. After this period, cardiovascular parameter recording was initiated and a 30-minute baseline recording of MAP and HR was performed. Subsequently, independent groups of animals of the ARS and RRS groups received bilateral microinjections into the MeA of Ang II (0.05 nmol/100 nL), the selective AT1 receptor antagonist losartan (1 nmol/100 nL), the selective AT2 receptor antagonist PD123319 (5 nmol/100 nL), Ang-(1–7) (0.05 nmol/100 nL), the selective Mas receptor antagonist A-779 (0.1 nmol/100 nL), or vehicle (saline; 100 nL; Costa-Ferreira et al., 2021; Marchi-Coelho et al., 2021). Ten minutes after MeA pharmacological treatment, animals of the ARS (1st session) and RRS (10th session) groups were subjected to a 60-minute restraint session. MAP and HR recordings started at least 30 minutes before the onset of stress and were maintained throughout the restraint period. TST was measured at −10, −5, and 0 minutes before restraint stress and at 10, 20, 30, 40, 50, and 60 minutes during restraint (Benini et al., 2025; Oliveira et al., 2015). After the stress session, the animals were returned to their home-cages, and MAP, HR, and TST recordings were continued for an additional 60- minute period. Figure 1(a) illustrates the complete experimental protocol.
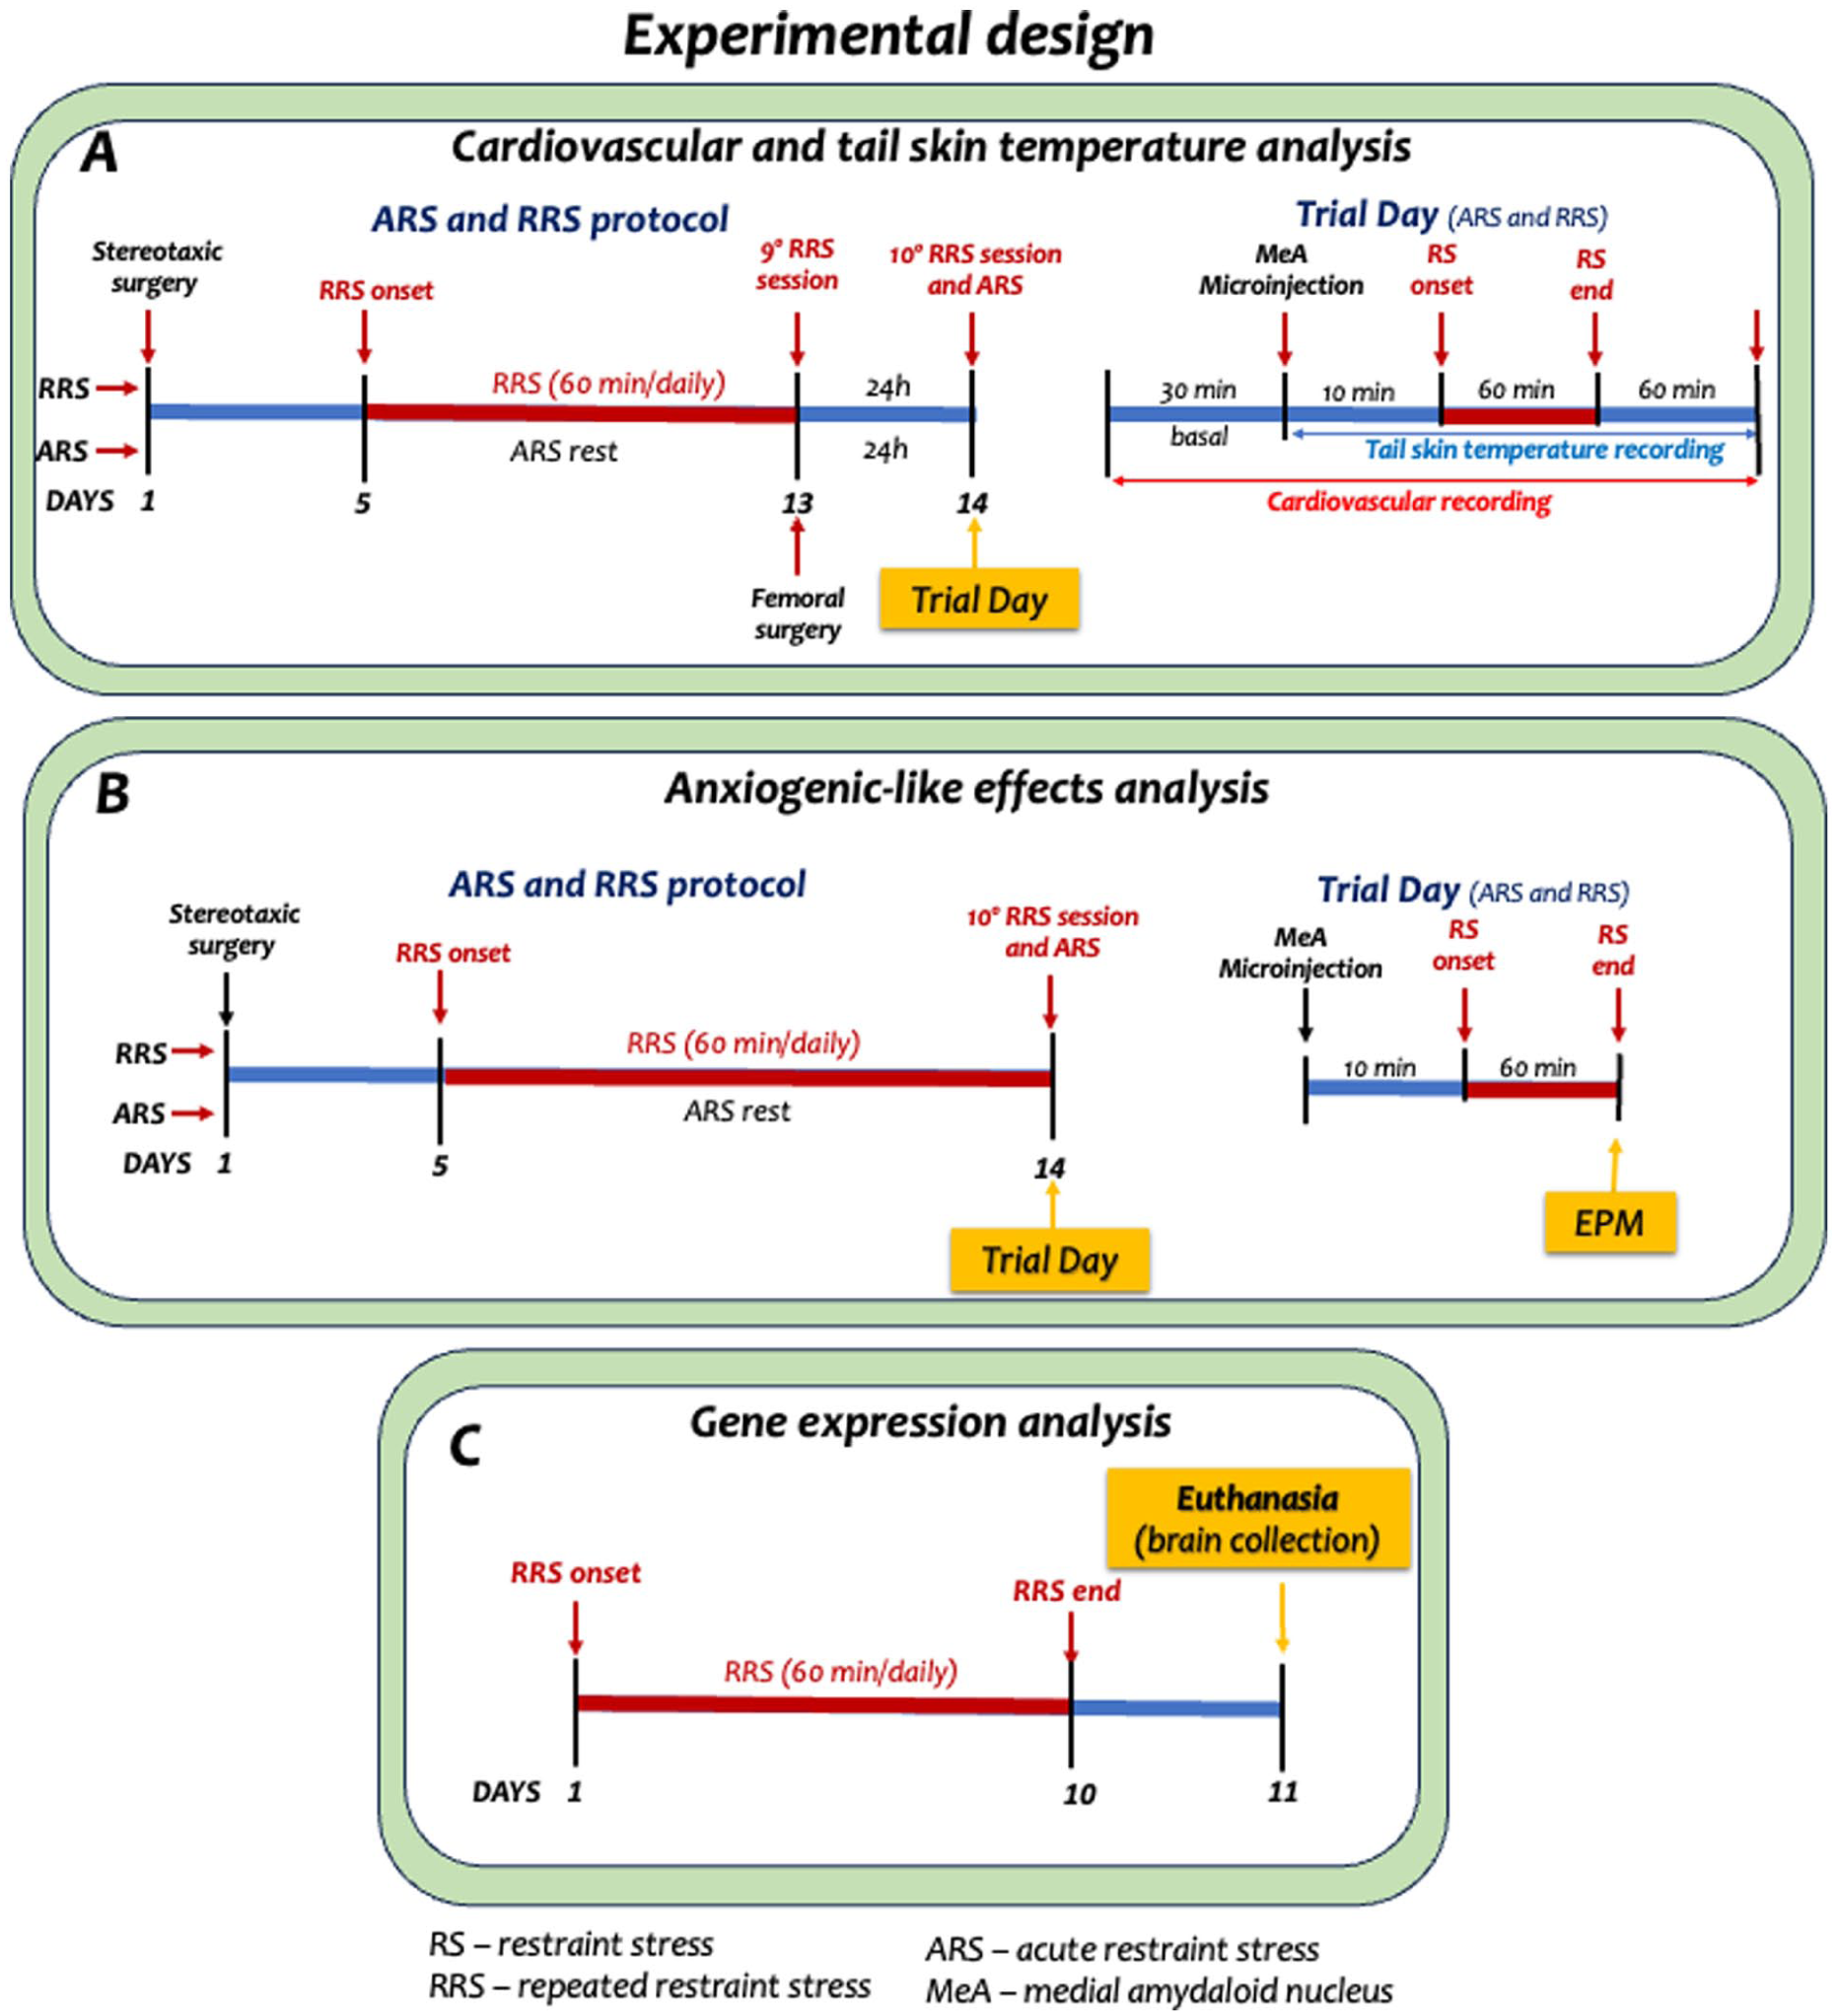
Experimental protocols for evaluation of the effects of MeA treatment with agonists and antagonists of angiotensinergic receptors on cardiovascular responses (a) and anxiogenic-like effect (b) in animals subjected to ARS (1st restraint session) or RRS (10th restraint session). Figure also shows protocol for analysis of the effect of RRS on gene expression of angiotensinergic receptors (c).
Involvement of angiotensinergic neurotransmissions within the MeA in the anxiogenic-like effect after the 1st (ARS) and 10th (RRS) restraint stress session
This study aimed to investigate the involvement of Ang II/AT1-AT2 receptors and Ang-(1–7)/Mas receptor neurotransmissions present within the MeA in anxiogenic-like effect assessed in the EPM after the 1st (ARS) and 10th (RRS) sessions of restraint stress. For this, all animals were submitted to stereotaxic surgery for implant of bilateral guide cannulas directed to the MeA and were kept in recovery for at least 4 days after the procedure. After this period, RRS animals were subjected to daily 60-minute restraint sessions for nine consecutive days, while animals in the ARS group remained undisturbed at the animal facility. On the trial day, animals were taken to the experimental room and kept at rest for at least 60 minutes before starting the experiment for habituation to the room conditions. Subsequently, independent groups of animals of the ARS and RRS groups received bilateral microinjections into the MeA of Ang II (0.05 nmol/100 nL), the selective AT1 receptor antagonist losartan (1 nmol/100 nL), the selective AT2 receptor antagonist PD123319 (5 nmol/100 nL), Ang-(1–7) (0.05 nmol/100 nL), the selective Mas receptor antagonist A-779 (0.1 nmol/100 nL), or vehicle (saline; 100 nL; Costa-Ferreira et al., 2021; Marchi-Coelho et al., 2021). Ten minutes after MeA pharmacological treatment, animals of the ARS (1st session) and RRS (10th session) groups were subjected to a 60-minute restraint session. After the end of the restraint session (Barretto-de-Souza et al., 2022; Mechiel Korte and De Boer, 2003), each animal was individually placed into the EPM for 5 minutes for assessing anxiety-like behaviors. The anxiogenic-like effect evoked by ARS was evaluated by comparing the behavior of the stressed animals with those of naïve rats (i.e., non-stressed; Barretto-de-Souza et al., 2022; Gomes-de-Souza et al., 2021). In addition, a group subjected to nine restraint session (9-RRS group), but not submitted to restraint stress on the trial day was used as a control for the behavioral changes in the EPM evoked by the RRS protocol (Barretto-de-Souza et al., 2022). Figure 1(b) illustrates the complete experimental protocol.
Effect of RRS on gene expression of AT1a, AT1b, AT2, and Mas receptors
This protocol aimed to investigate the effect of RRS on the gene expression of AT1a, AT1b, AT2, and Mas receptors within the MeA. For this, animals were subjected to daily 60-minute restraint sessions for 10 consecutive days. Twenty-four hours after the last stress session, the animals were euthanized by decapitation, and their brains were removed and stored in a −80°C freezer for later processing. Control animals were kept undisturbed at the animal facility for the same period as the animals subjected to RRS protocol and were euthanized along with the RRS animals. The MeA of all animals was collected by microdissection for quantification of the gene expression of angiotensinergic receptors by RT-qPCR. Figure 1(c) illustrates the complete experimental protocol.
Statistical analysis
Analyses were performed using Statistica 7.1 (StatSoft, Inc., Tulsa, OK, USA) and GraphPad Prism 7 (GraphPad Software, Inc., La Jolla, CA, USA) software. All values were expressed as mean ± standard error of the mean (SEM), and differences were considered significant when p < 0.05. All datasets were first assessed for normality before performing ANOVA.
Time-course curves of changes in MAP, HR, and TST of ARS and RRS animals were compared using three-way ANOVA, with treatment and stress as main factors and time as a repeated measurement. The area under the curve (AUC) of changes on MAP, HR, and TST was calculated as the sums of all areas, regardless of whether the values were positive or negative (i.e., total area). Analysis of AUC, basal values of cardiovascular parameters, and TST and anxiety-like behaviors were performed using two-way ANOVA, with treatment and stress as main factors. When a significant effect was indicated by ANOVA, Bonferroni’s post hoc test was used to identify specific differences between the experimental groups. Comparison of the angiotensinergic receptor gene expression was performed using unpaired Student’s t-test.
Results
Figure 2 shows diagrammatic representations based on the atlas of Paxinos and Watson (1997) indicating the microinjection sites into the MeA of all rats used in this study. Figure 2 also shows photomicrograph of a coronal histological section indicating bilateral microinjection sites into the MeA of a representative animal.
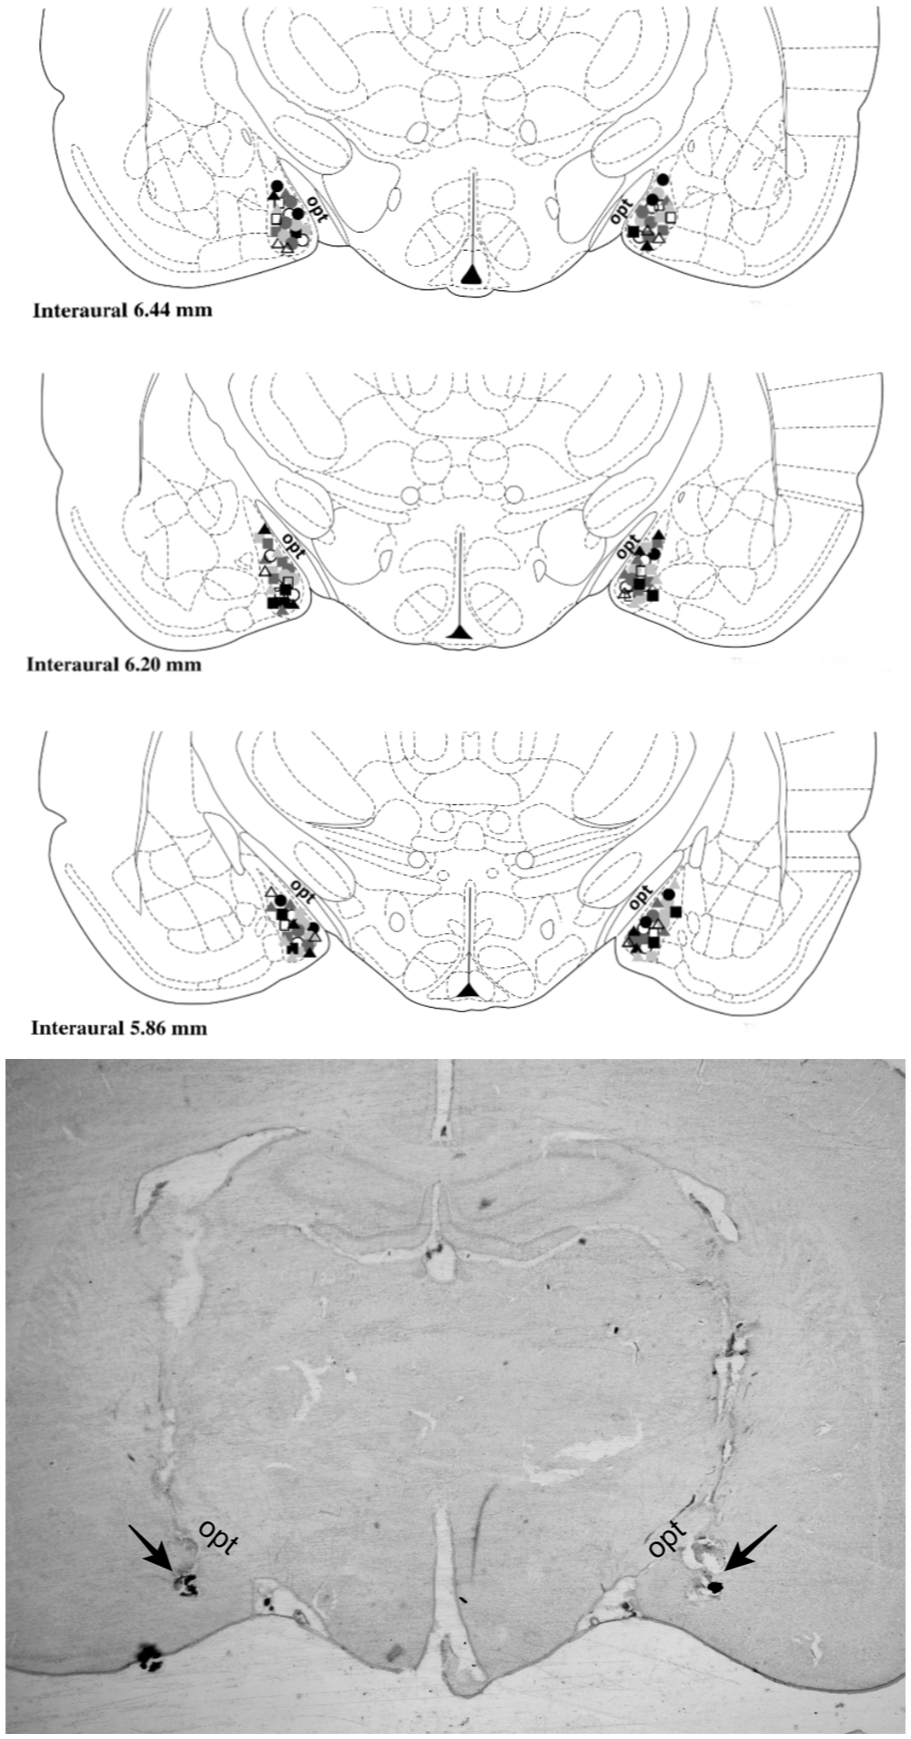
(Top) Diagrammatic representation based on Paxinos and Watson’s (1997) atlas indicating the microinjection sites into the MeA (top 3 panels) of ARS and RRS animals. Symbols indicate the microinjection sites of ARS vehicle animals (white circles), ARS Ang II (light gray circles), ARS losartan (dark gray circles), ARS PD123319 (black circles), ARS Ang 1–7 (white squares), ARS A-779 (light gray squares), RRS vehicle (white triangles), RRS Ang II (light gray triangles), RRS losartan (dark gray triangles), RRS PD123319 (black triangles), RRS Ang-(1–7) (dark gray squares), and RRS A-779 (black squares). (Bottom) Photomicrograph of a coronal histological section showing the bilateral injection sites into the MeA of a representative animal. Arrows indicate the microinjection site into the MeA.
Effect of MeA pharmacological treatment with angiotensinergic receptors agonists and antagonists on baseline cardiovascular parameters and TST in ARS and RRS animals
Table 1 shows the baseline values of MAP, HR, and TST following treatment of the MeA with vehicle, Ang II, the selective AT1 receptor antagonist losartan, the selective AT2 receptor antagonist PD123319, Ang-(1–7), or the selective Mas receptor antagonist A-779 in animals of ARS and RRS groups. Analysis of MAP values indicated a stress effect (F(1,67) = 11.74, p < 0.05), but without either treatment effect (F(5,67) = 2.04, p > 0.05) or stress × treatment interaction (F(5,67) = 0.71, p > 0.05). Conversely, analysis of HR and TST did not indicate main effects of either stress (HR: F(1,67) = 0.82, p > 0.05; TST: F(1,67) = 0.97, p > 0.05) or treatment (HR: F(5,67) = 1.36, p > 0.05; TST: F(5,67) = 1.82, p > 0.05), or stress × treatment interaction (HR: F(5,67) = 1.31; p > 0.05; TST: F(5,67) = 0.57, p > 0.05).
Baseline parameters (i.e., pre-stress parameters) of mean arterial pressure (MAP), heart rate (HR), and tail skin temperature (TST) following treatment of the MeA with vehicle, angiotensin II (Ang II), the selective AT1 receptor antagonist losartan, the selective AT2 receptor antagonist PD123319, Ang-(1–7), or the selective Mas receptor antagonist A-779 in animals subjected to acute restraint stress or repeated restraint stress.
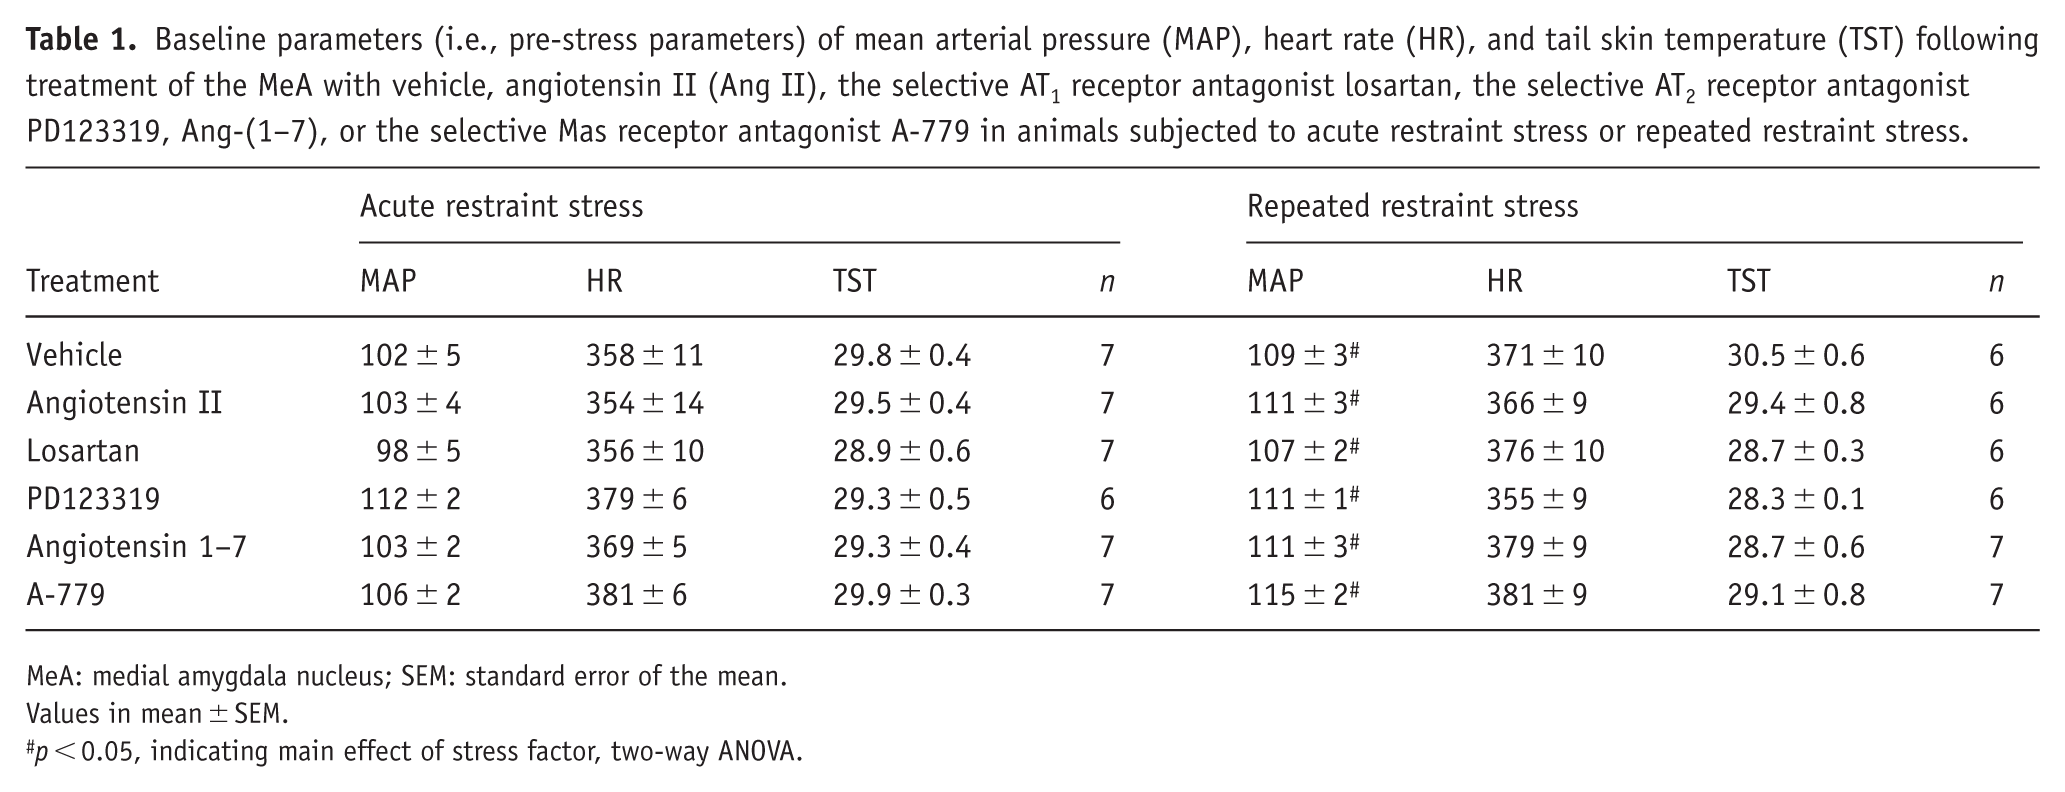
MeA: medial amygdala nucleus; SEM: standard error of the mean.
Values in mean ± SEM.
p < 0.05, indicating main effect of stress factor, two-way ANOVA.
Involvement of angiotensinergic neurotransmissions within the MeA in cardiovascular responses during the 1st (ARS) and 10th (RRS) restraint stress session
Role of Ang II/AT1-AT2 receptors
Figure 3 presents the cardiovascular and TST changes in ARS and RRS animals subjected to MeA treatment with Ang II (0.05 nmol/100 nL), the selective AT1 receptor antagonist losartan (1 nmol/100 nL) or the selective AT2 receptor antagonist PD123319 (5 nmol/100 nL). Figure 4 shows the AUC for MAP, HR, and TST changes evoked by ARS and RRS.
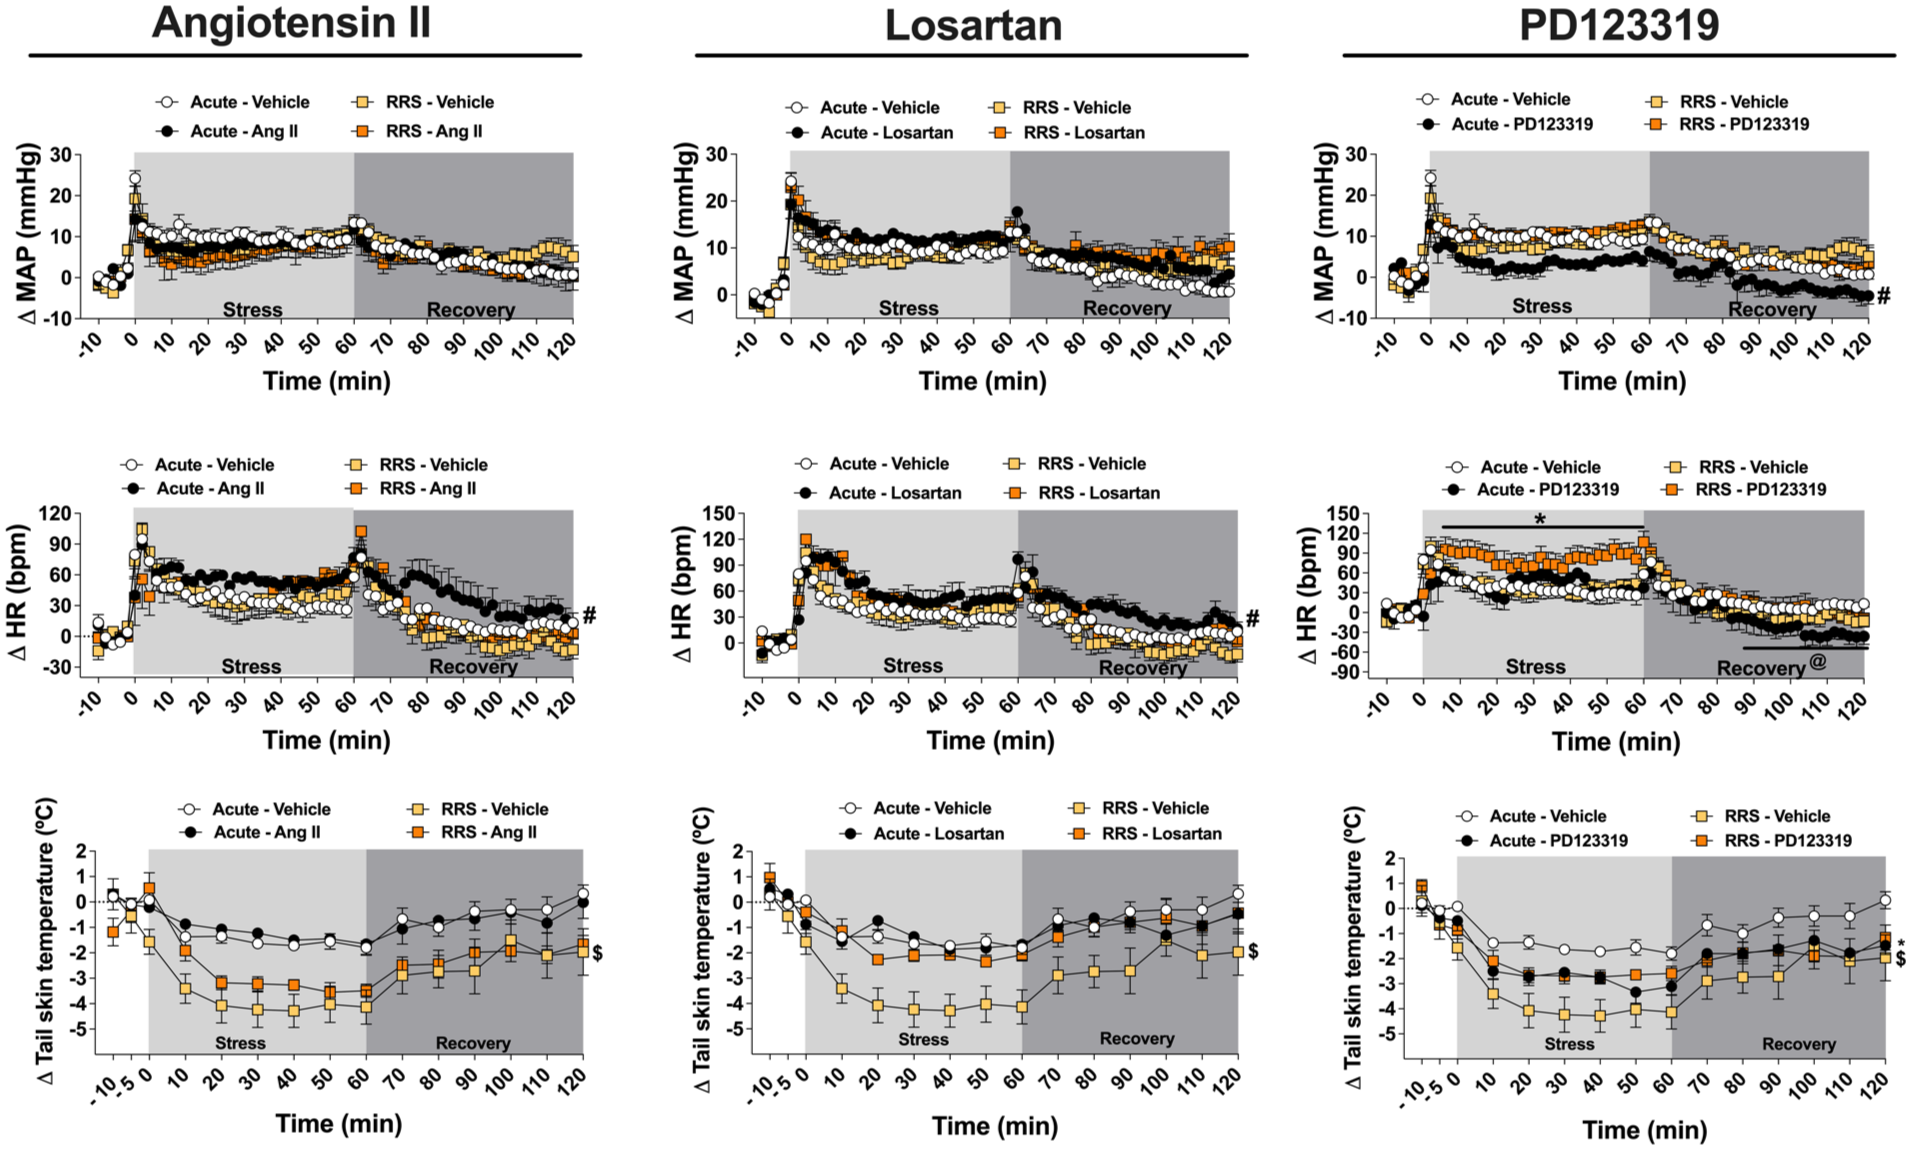
Evaluation of the involvement of angiotensin II neurotransmission within the MeA in cardiovascular and TST responses during the 1st (ARS) and 10th (RRS) restraint stress session. Time-course curves of MAP, HR, and TST changes in ARS and RRS animals treated into the MeA with Ang II (0.05 nmol/100 nL; ARS: n = 7, RRS: n = 6), the selective AT1 receptor antagonist losartan (1 nmol/100 nL; ARS: n = 7, RRS: n = 6), the selective AT2 receptor antagonist PD123319 (5 nmol/100 nL; ARS: n = 6, RRS: n = 6), or vehicle (100 nL; ARS: n = 7, RRS: n = 6). #p < 0.05 ARS drug versus ARS vehicle, indicating an effect during stress and recovery periods; *p < 0.05 RRS drug versus RRS vehicle; @p < 0.05 ARS drug versus ARS vehicle, indicating an effect in the specific period; $p < 0.05 ARS vehicle versus RRS vehicle. Three-way ANOVA followed by Bonferroni post hoc test.
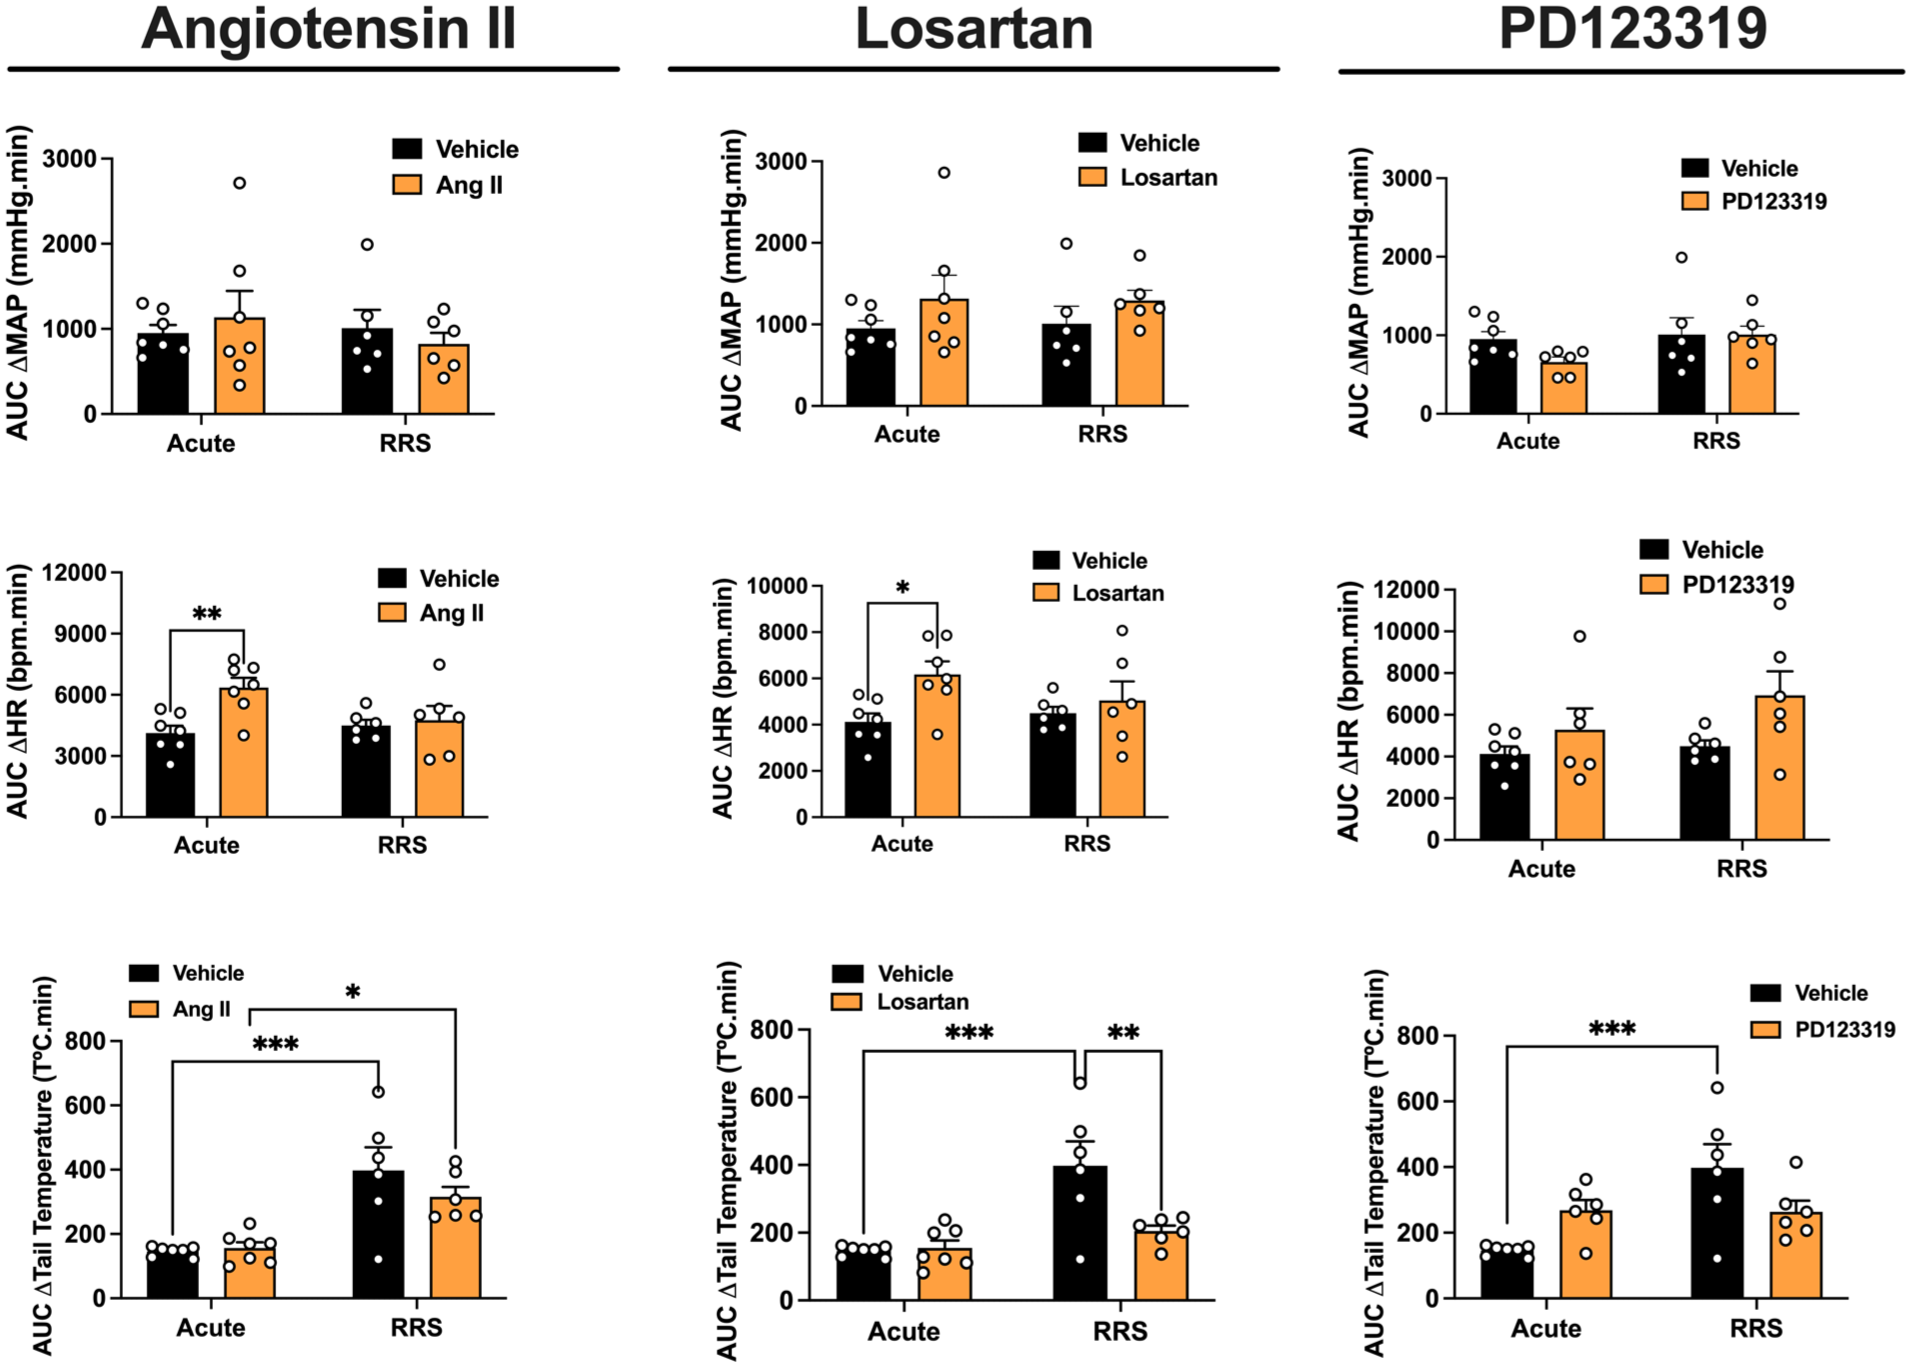
Evaluation of the involvement of angiotensin II neurotransmission within the MeA in cardiovascular and TST responses during the 1st (ARS) and 10th (RRS) restraint stress session. AUC of the time-course curves of changes on MAP, HR, and TST in ARS and RRS animals treated into the MeA with Ang II (ARS: n = 7, RRS: n = 6), the selective AT1 receptor antagonist losartan (ARS: n = 7, RRS: n = 6), the selective AT2 receptor antagonist PD123319 (ARS: n = 6, RRS: n = 6), or vehicle (ARS: n = 7, RRS: n = 6). *p < 0.05, **p < 0.005, ***p < 0.0005. Two-way ANOVA followed by Bonferroni post hoc test.
Angiotensin II
Analysis of the time-course curves of HR change in animals treated with Ang II into the MeA did not indicate main effects of either stress (F(1,23) = 2.03, p > 0.05) or treatment (F(1,23) = 3.02, p > 0.05); or stress × treatment (F(1,23) = 1.05, p > 0.05) and time × stress × treatment (F(65,1495) = 0.50, p > 0.05) interactions. However, analysis indicated a time effect (F(65,1495) = 20.35, p < 0.05), along with time × stress (F(65,1495) = 1.55, p < 0.05) and time × treatment (F(65,1495) = 1.36, p < 0.05) interactions. Analysis of the time-course curves of MAP change also did not indicate main effects of stress (F(1,23) = 0.05, p > 0.05) or treatment (F(1,23) = 0.63, p > 0.05); or stress × treatment (F(1,23) = 0.15; p > 0.05), time × treatment (F(65,1495) = 1.19, p > 0.05) and time × stress × treatment (F(65,1495) = 0.73, p > 0.05) interactions. However, analysis indicated a time effect (F(65,1495) = 22.05, p < 0.05) and time × stress interaction (F(65,1495) = 1.46, p < 0.05). Analysis of the time-course curves of TST change indicated main effects of stress (F(1,23) = 19.13, p < 0.05) and time (F(14,322) = 31.67, p < 0.05), along with time × stress (F(14,322) = 3.60, p < 0.05) and time × treatment (F(14,322) = 1.88, p < 0.05) interactions. However, analysis did not indicate an influence of treatment (F(1,23) = 0.15, p > 0.05) or stress × treatment (F(1,23) = 0.15, p > 0.05) and time × stress × treatment (F(14,322) = 1.59, p > 0.05) interactions.
Post hoc analyses revealed that MeA treatment with Ang II enhanced the tachycardia response in ARS rats in relation to the ARS vehicle group (p < 0.05). Moreover, animals subjected to RRS and receiving vehicle into the MeA showed greater reduction in TST when compared to the respective ARS group (p < 0.05).
Analysis of the AUC for MAP change showed no significant effects of stress (F(1,23) = 0.38, p = 0.5462), treatment (F(1,23) = 0.02, p = 0.9992), or stress × treatment interaction (F(1,23) = 0.78, p = 0.3888). However, analysis of the AUC for HR change indicated main effect of treatment (F(1,23) = 6.85, p = 0.0158) and stress × treatment interaction (F(1,23) = 4.30, p = 0.0498), but without effect of stress (F(1,23) = 1.66, p = 0.2119). Post hoc analysis revealed enhanced values in Ang II-treated animals subjected to ARS in relation to the respective vehicle group (p = 0.0045). Analysis of the AUC for the drop in skin temperature showed a main effect of stress (F(1,23) = 29.97, p < 0.0001), but without influence of treatment (F(1,23) = 0.92, p = 0.3490) and stress × treatment interaction (F(1,23) = 1.51, p = 0.2310). Post hoc analysis revealed that RRS animals treated with either vehicle (p = 0.0006) or Ang II (p = 0.0389) presented enhanced values in relation to the respective ARS rats.
Losartan
Analysis of the time-course curves of HR changes in animals treated with losartan in the MeA did not indicate stress effect (F(1,23) = 1.13, p > 0.05), or stress × treatment (F(1,23) = 0.44, p > 0.05) and time × stress × losartan (F(65,1495) = 0.88, p > 0.05) interactions. However, there was treatment (F(1,23) = 4.84, p < 0.05) and time (F(65,1495) = 28.25, p < 0.05) effects, as well as time × stress (F(65,1495) = 1.32, p < 0.05) and time × treatment (F(65,1495) = 1.62, p < 0.05) interactions. Analysis of the time-course curves of MAP changes did not indicate main effects of either stress (F(1,23) = 0.03, p > 0.05) or treatment (F(1,23) = 2.43, p > 0.05); or stress × treatment (F(1,23) = 0.01, p > 0.05), time × treatment (F(65,1495) = 1.18, p > 0.05) and time × stress × treatment (F(65,1495) = 0.72, p > 0.05) interactions. However, analysis indicated a time effect (F(65,1495) = 28.88, p < 0.05) and time × stress interaction (F(65,1495) = 2.45, p < 0.05). Analysis of the time-course curves of TST changes indicated stress (F(1,23) = 8.05, p < 0.05) and time (F(14,322) = 26.44, p < 0.05) effects, along with stress × treatment (F(1,23) = 5.32, p < 0.05) and time × stress (F(14,322) = 2.59, p < 0.05) interactions. However, there was no treatment effect (F(1,23) = 3.17, p > 0.05), or time × treatment (F(14,322) = 1.12, p > 0.05) and time × stress × treatment (F(14,322) = 0.84, p > 0.05) interactions.
Post hoc comparison analyses revealed that treatment of the MeA with losartan enhanced the tachycardia in ARS animal in relation to the ARS vehicle group (p < 0.05). Animals subjected to RRS and receiving vehicle into the MeA showed greater reduction in TST when compared to the respective ARS group (p < 0.05).
Analysis of the AUC for MAP change showed no significant effects of stress (F(1,23) = 0.001, p = 0.9318), treatment (F(1,23) = 2.6, p = 0.1200), or stress × treatment interaction (F(1,23) = 0.01, p = 0.8482). However, analysis of the AUC for HR indicated main effect of treatment (F(1,23) = 5.79, p = 0.0249), but without effect of stress (F(1,23) = 0.48, p = 0.0495) or stress × treatment interaction (F(1,23) = 1.93, p = 0.1790). Post hoc analysis revealed enhanced values in losartan-treated animals subjected to ARS in relation to the respective vehicle group (p = 0.0211). Analysis of the AUC for the drop in skin temperature showed a main effects of stress (F(1,23) = 17.31, p = 0.0004) and treatment (F(1,23) = 6.44, p = 0.0187), along with stress × treatment interaction (F(1,23) = 7.78, p = 0.0107). Post hoc analysis revealed that RRS animals treated with vehicle (p = 0.0004) presented enhanced values in relation to the respective ARS rats, whereas RRS animals treated with losartan had reduced values in relation to the respective vehicle group (p = 0.0088).
PD123319
Analysis of the time-course curves of HR changes in animals treated with PD123319 into the MeA did not indicate main effects of either stress (F(1,22) = 3.84, p > 0.05) or treatment (F(1,22) = 0.02, p > 0.05). However, analysis indicated a time effect (F(65,1430) = 23.14, p < 0.05), along with time × stress (F(65,1430) = 1.53, p < 0.05), time × treatment (F(65,1430) = 2.70, p < 0.05), and stress × treatment (F(1,22) = 5.06, p < 0.05) interactions. Analysis of the time-course curves of MAP indicated stress (F(1,22) = 6.09, p < 0.05) and time (F(65,1430) = 30.44, p < 0.05) effects, along with stress × treatment (F(1,22) = 4.87, p < 0.05), time × stress (F(65,1430) = 1.94, p < 0.05), time × treatment (F(65,1430) = 1.89, p < 0.05), and time × stress × treatment (F(65,1430) = 1.90, p < 0.05) interactions. However, analysis did not indicate a treatment effect (F(1,22) = 4.27, p > 0.05). Analysis of the time-course curves of TST indicated stress (F(1,22) = 5.50, p < 0.05) and time (F(14,308) = 41.30, p < 0.05) main effects, along with stress × treatment (F(1,22) = 6.40, p < 0.05) and time × stress (F(14,308) = 1.82, p < 0.05) interactions. However, analysis did not indicate treatment effect (F(1,22) = 0.36, p > 0.05), or time × treatment (F(14,308) = 0.90, p > 0.05) and time × stress × treatment (F(14,308) = 1.69; p > 0.05) interactions.
Post hoc analyses revealed that PD123319 microinjection in the MeA reduced the MAP increase in ARS animals in relation to the ARS vehicle group (p < 0.05). PD123319 also enhanced tachycardia response during the 10th restraint session in RRS rats when compared to the RRS vehicle group (p < 0.05). Additionally, ARS rats treated with PD123319 showed faster return of HR to baseline during recovery period (p < 0.05) and enhanced TST drop (p < 0.05), when compared to the ARS vehicle group. Animals subjected to RRS and receiving vehicle into the MeA showed greater reduction in TST compared to the respective ARS group (p < 0.05).
Analysis of the AUC for MAP change showed no significant effects of stress (F(1,22) = 2.41, p = 0.1359), treatment (F(1,22) = 1.26, p = 0.2742), or stress × treatment interaction (F(1,22) = 1.25, p = 0.2750). However, analysis of the AUC for HR change indicated main effect of treatment (F(1,22) = 5.32, p = 0.0315), but without effect of stress (F(1,22) = 1.69, p = 0.2079) or stress × treatment interaction (F(1,22) = 0.66, p = 0.4229). Analysis of the AUC for the drop in skin temperature showed main effects of stress (F(1,22) = 8.95, p = 0.0069) and stress × treatment interaction (F(1,22) = 9.69, p = 0.0053), but without effect of treatment (F(1,22) = 0.02, p = 0.8872). Post hoc analysis revealed that RRS animals treated with vehicle presented enhanced values in relation to the respective ARS rats (p = 0.0015).
Role of Ang-(1–7)/Mas receptor
Figure 5 presents the cardiovascular and TST changes in ARS and RRS animals subjected to MeA treatment with Ang-(1–7) (0.05 nmol/100 nL) or the selective Mas receptor antagonist A-779 (0.1 nmol/100 nL). Figure 6 shows the AUC for MAP, HR, and TST changes evoked by ARS and RRS.
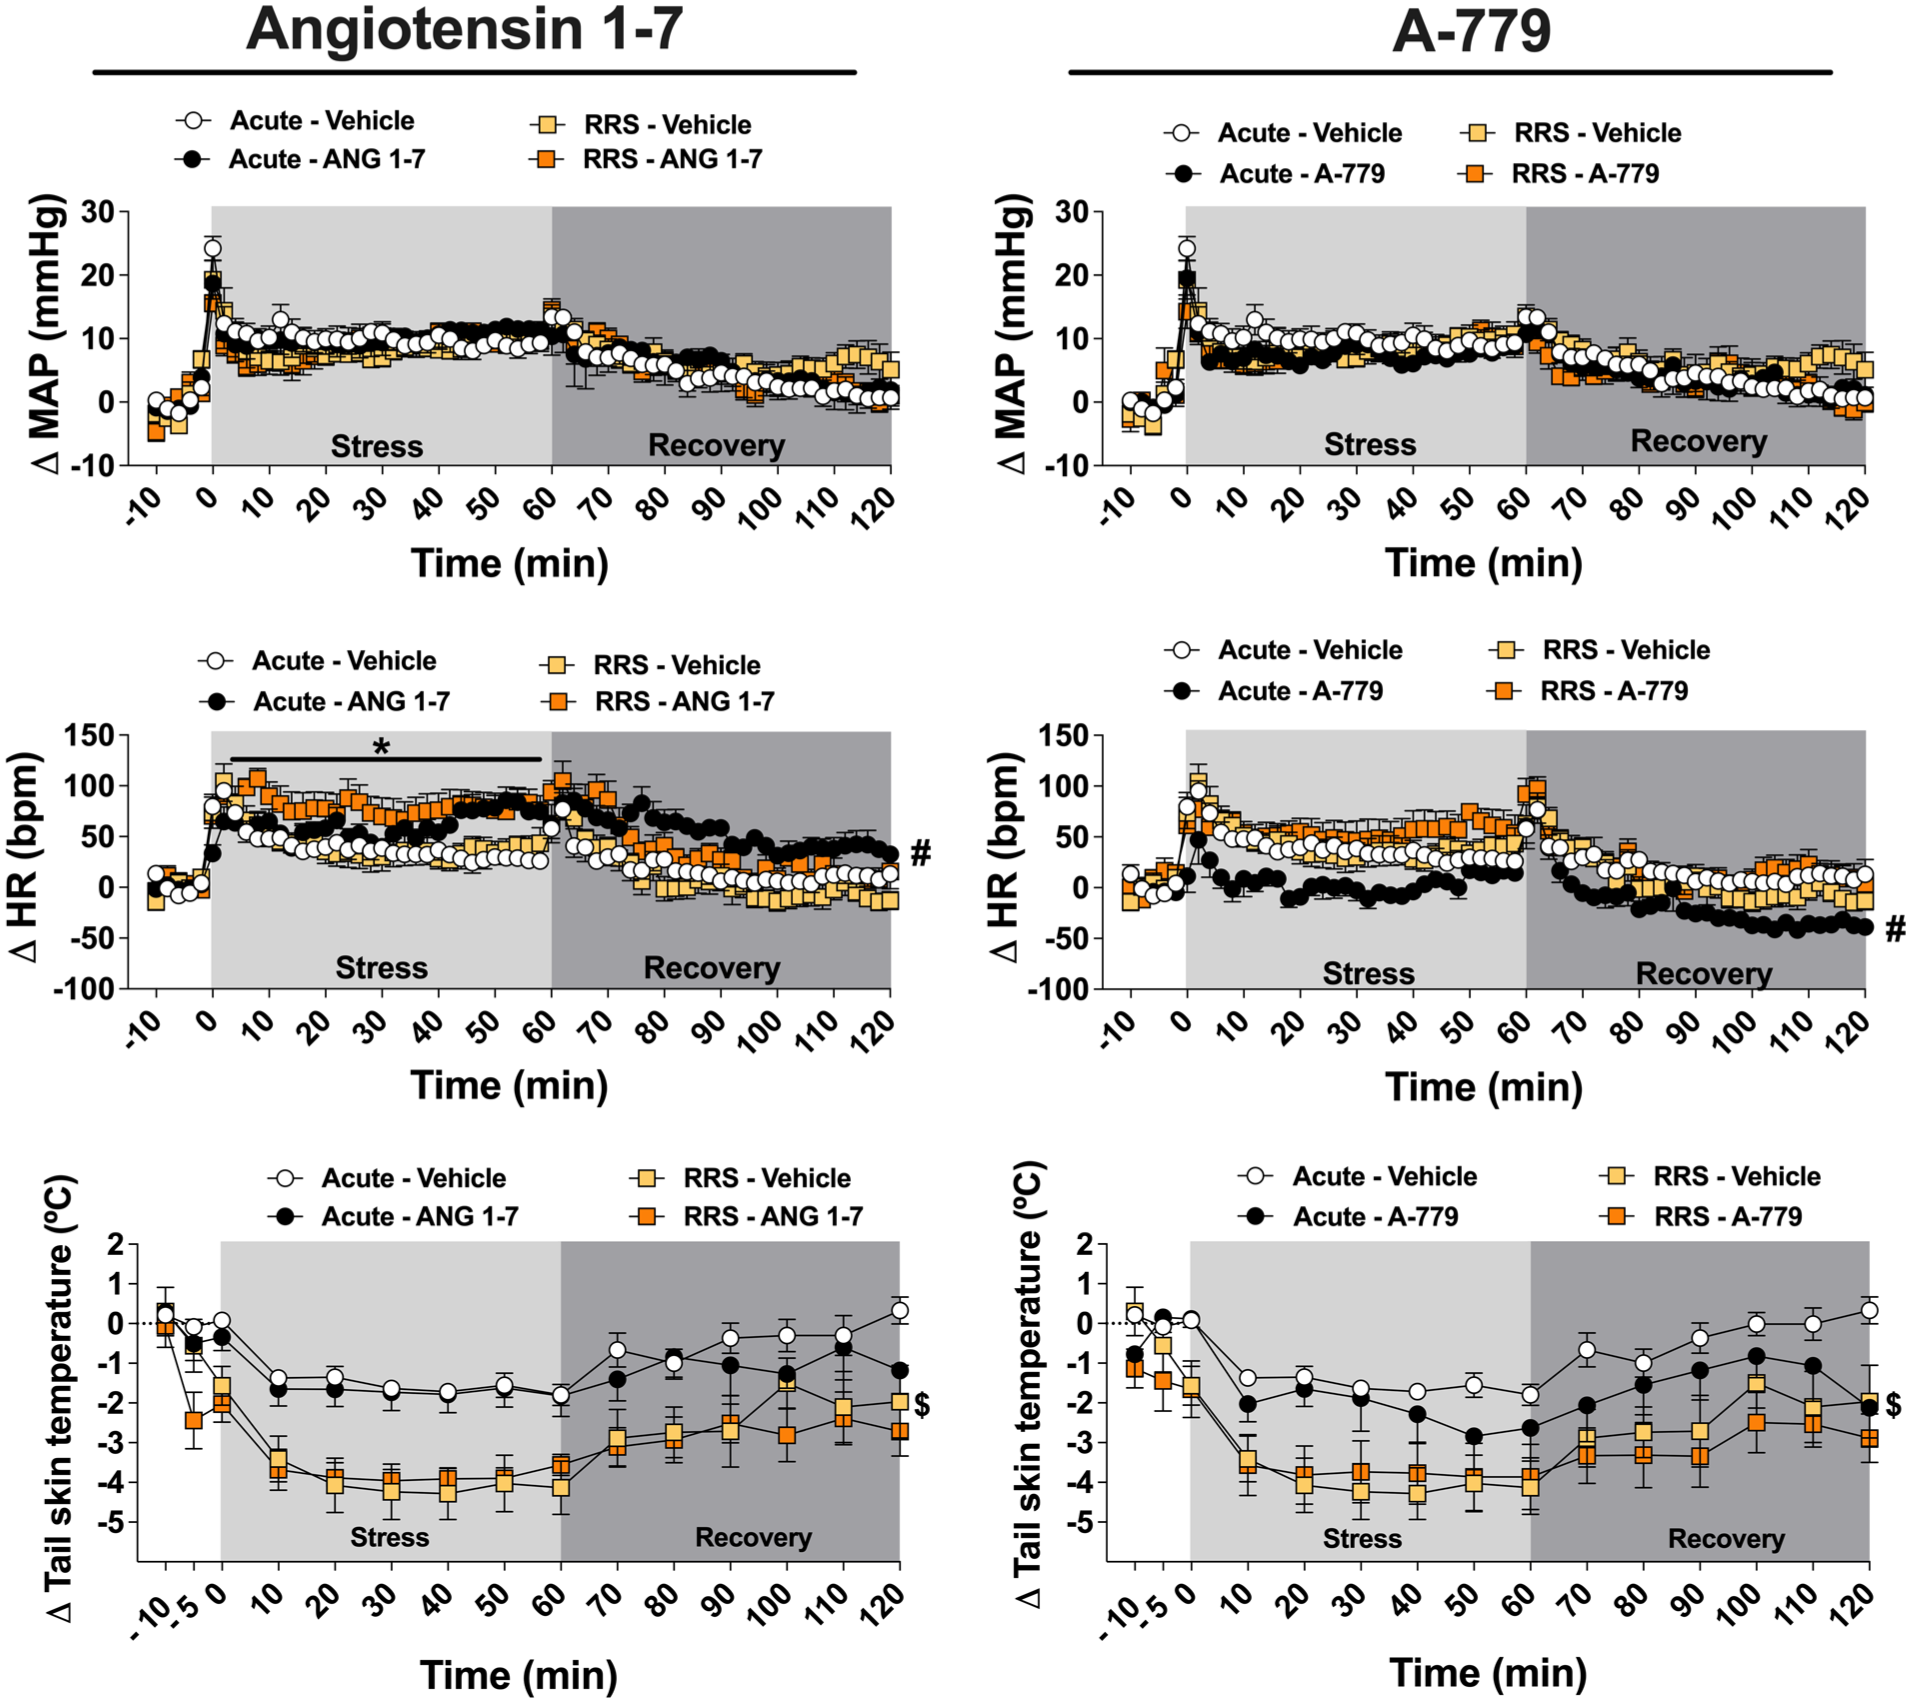
Evaluation of the involvement of angiotensin-(1–7)/Mas receptor neurotransmission into the MeA in cardiovascular responses and TST responses during the 1st (ARS) and 10th (RRS) restraint stress session. Time-course curves of MAP, HR, and TST changes in ARS and RRS animals treated into the MeA with Ang-(1–7) (0.05 nmol/100 nL; ARS: n = 7, RRS: n = 7), the selective Mas receptor antagonist A-779 (0.1 nmol/100 nL; ARS: n = 7, RRS: n = 7), or vehicle (100 nL; ARS: n = 7, RRS: n = 6) into the MeA. #p < 0.05 ARS drug versus ARS vehicle, indicating an effect during stress and recovery periods; *p < 0.05 RRS drug versus RRS vehicle; $p < 0.05 ARS vehicle versus RRS vehicle. Three-way ANOVA followed by Bonferroni post hoc test.
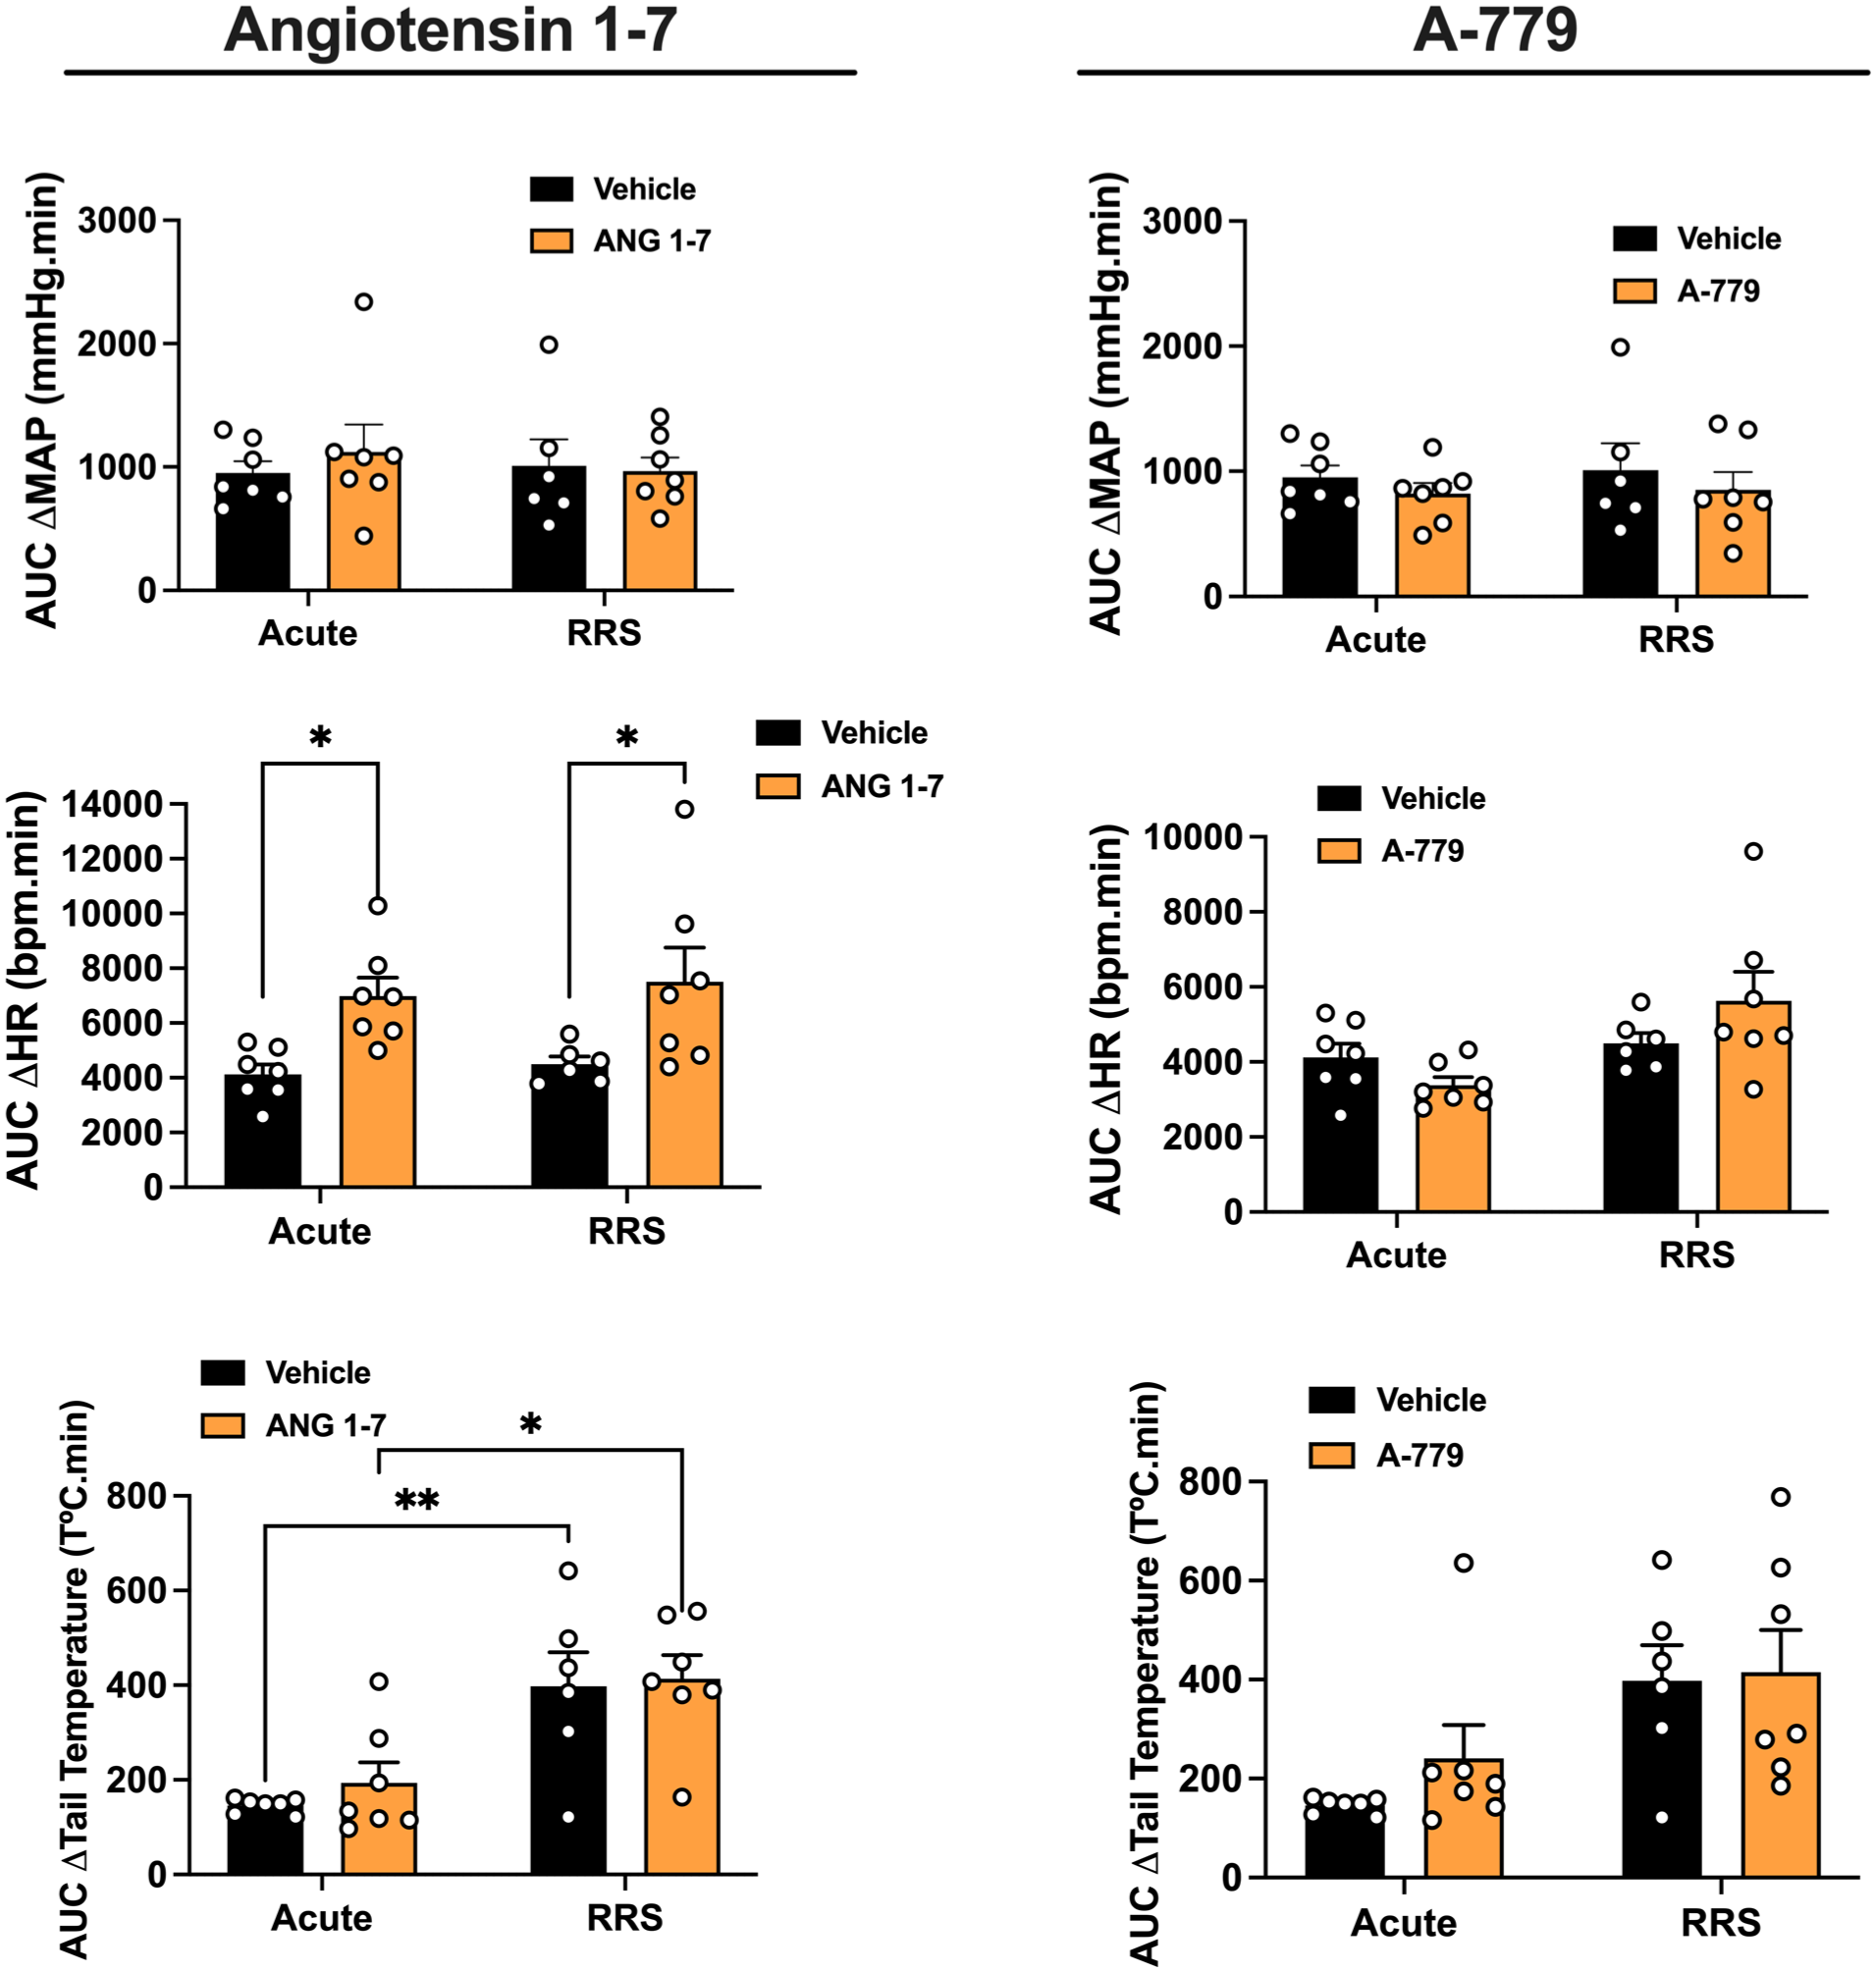
Evaluation of the involvement of angiotensin-(1–7)/Mas receptor neurotransmission into the MeA in cardiovascular responses and TST responses during the 1st (ARS) and 10th (RRS) restraint stress session. AUC of the time-course curves of changes on MAP, HR, and TST in ARS and RRS animals treated into the MeA with Ang-(1–7) (ARS: n = 7, RRS: n = 7), the selective Mas receptor antagonist A-779 (ARS: n = 7, RRS: n = 7), or vehicle (ARS: n = 7, RRS: n = 6) into the MeA. *p < 0.05, **p < 0.005. Two-way ANOVA followed by Bonferroni post hoc test.
Angiotensin-(1–7)
Analysis of the time-course curves of HR changes in animals treated with Ang-(1–7) into the MeA did not indicate a stress effect (F(1,24) = 0.02, p > 0.05) or stress × treatment interaction (F(1,24) = 0.04, p > 0.05). However, analysis indicated treatment (F(1,24) = 12.84, p < 0.05) and time (F(65,1560) = 28.84, p < 0.05) effects, along with time × stress (F(65,1560) = 3.64; p < 0.05), time × treatment (F(65,1560) = 3.30, p < 0.05), and time × stress × treatment (F(65,1560) = 1.54, p < 0.05) interactions. Analysis of time-course curves of MAP change did not indicate main effects of either stress (F(1,24) = 0.01, p > 0.05) or treatment (F(1,24) = 0.01, p > 0.05), or stress × treatment (F(1,24) = 0.09, p > 0.05) and time × stress × treatment (F(65,1560) = 1.24, p > 0.05) interactions. However, results indicated a time effect (F(65,1560) = 32.36, p < 0.05), along with time × stress (F(65,1560) = 2.06, p < 0.05) and time × treatment (F(65,1560) = 1.45, p < 0.05) interactions. Analysis of the time-course curves of TST indicated stress (F(1,24) = 17.94, p < 0.05) and time (F(14,336) = 32.30, p < 0.05) effects, along with time × stress (F(14,336) = 3.08, p < 0.05) and time × treatment (F(14,336) = 1.84, p < 0.05) interactions. However, analysis did not indicate treatment effect (F(1,24) = 1.20, p > 0.05) or stress and treatment (F(1,24) = 0.03, p > 0.05) and time × stress × treatment (F(14,336) = 0.63, p > 0.05) interactions.
Post hoc test comparisons revealed that microinjection of Ang-(1–7) into the MeA enhanced the tachycardia during the ARS session in relation to the ARS vehicle group (p < 0.05), as well as in RRS animals when compared to the RRS vehicle group (p < 0.05). Animals subjected to RRS and receiving vehicle into the MeA had a greater TST drop during the 10th restraint session compared to the ARS vehicle group (p < 0.05).
Analysis of the AUC for MAP change showed no significant effects of stress (F(1,24) = 0.08, p = 0.7676), treatment (F(1,24) = 0.15, p = 0.7061), or stress × treatment interaction (F(1,24) = 0.41, p = 0.5314). However, analysis of the AUC for HR response indicated main effect of treatment (F(1,24) = 14.32, p = 0.0010), but without effect of stress (F(1,24) = 0.33, p = 0.5705) or stress × treatment interaction (F(1,24) = 0.008, p = 0.9282). Post hoc analysis revealed that ARS (p = 0.0274) and RRS (p = 0.0261) animals treated with Ang-(1–7) presented enhanced values in relation to the respective vehicle groups. Analysis of the AUC for the drop in skin temperature showed a main effect of stress (F(1,24) = 25.21, p < 0.0001), but without effect of treatment (F(1,24) = 0.45, p = 0.5063) and stress × treatment interaction (F(1,24) = 0.12, p = 0.7399). Post hoc analysis revealed that RRS animals treated with either vehicle (p = 0.0058) or Ang-(1–7) (p = 0.0128) presented enhanced values in relation to the respective ARS rats.
A-779
Analysis of the time-course curves of HR in animals treated with A-779 indicated stress (F(1,24) = 8.89, p < 0.05) and time (F(65,1560) = 25.71, p < 0.05) effects, along with stress × treatment (F(1,24) = 11.37, p < 0.05), time and stress (F(65,1560) = 1.43, p < 0.05), time × treatment (F(65,1560) = 1.43, p < 0.05), and time × stress × treatment (F(65,1560) = 1.31, p < 0.05) interactions. Nevertheless, analysis did not indicate a treatment effect (F(1,24) = 2.77, p > 0.05). Analysis of the time-course curves of MAP did not indicate effect of either stress (F(1,24) = 0.03, p > 0.05) or treatment (F(1,24) = 1.59, p > 0.05); or stress × treatment (F(1,24) = 0.01, p > 0.05) and time and treatment (F(65,1560) = 1.05, p > 0.05) interactions. However, analysis indicated a time effect (F(65,1560) = 32.35, p < 0.05), along with time × stress (F(65,1560) = 1.98, p < 0.05) and time × stress × treatment (F(65,1560) = 1.64, p < 0.05) interactions. Analysis of the time-course curves of TST indicated stress (F(1,24) = 9.84, p < 0.05) and time (F(14,336) = 24.87, p < 0.05) effects, along with time × stress interaction (F(14,336) = 1.85, p < 0.05). However, analysis did not indicate a treatment effect (F(1,24) = 1.77, p > 0.05); or stress × treatment (F(1,24) = 0.04, p > 0.05), time × treatment (F(14,336) = 1.68, p > 0.05), and time × stress × treatment (F(14,336) = 0.80, p > 0.05) interactions.
Post hoc comparisons revealed that microinjection of A-779 into the MeA attenuated the tachycardia during ARS session when compared to the ARS vehicle group (p < 0.05). In addition, animals subjected to RRS and receiving vehicle had a greater TST reduction when compared to the ARS vehicle group (p < 0.05).
Analysis of the AUC for MAP showed no significant effects of stress (F(1,24) = 0.11, p = 0.7527), treatment (F(1,24) = 1.11, p = 0.3048), or stress × treatment interaction (F(1,24) = 0.009, p = 0.9291). Analysis of the AUC for HR and TST responses indicated effect of stress (HR: F(1,24) = 7.62, p = 0.0111; temperature: F(1,24) = 10.70, p = 0.0034), but without influence of treatment (HR: F(1,24) = 0.17, p = 0.6893; temperature: F(1,24) = 0.75, p = 0.3958) and stress × treatment interaction (HR: F(1,24) = 3.88, p = 0.0610; temperature: F(1,24) = 0.35, p = 0.5563).
Involvement of angiotensinergic neurotransmissions within the MeA in anxiogenic-like effect following the 1st (ARS) and 10th (RRS) restraint stress session
Figure 7 presents the behavioral analysis in the EPM in ARS and RRS animals subjected to MeA treatment with Ang II, the selective AT1 receptor antagonist losartan, the selective AT2 receptor antagonist PD123319, Ang-(1–7), or the selective Mas receptor antagonist A-779.
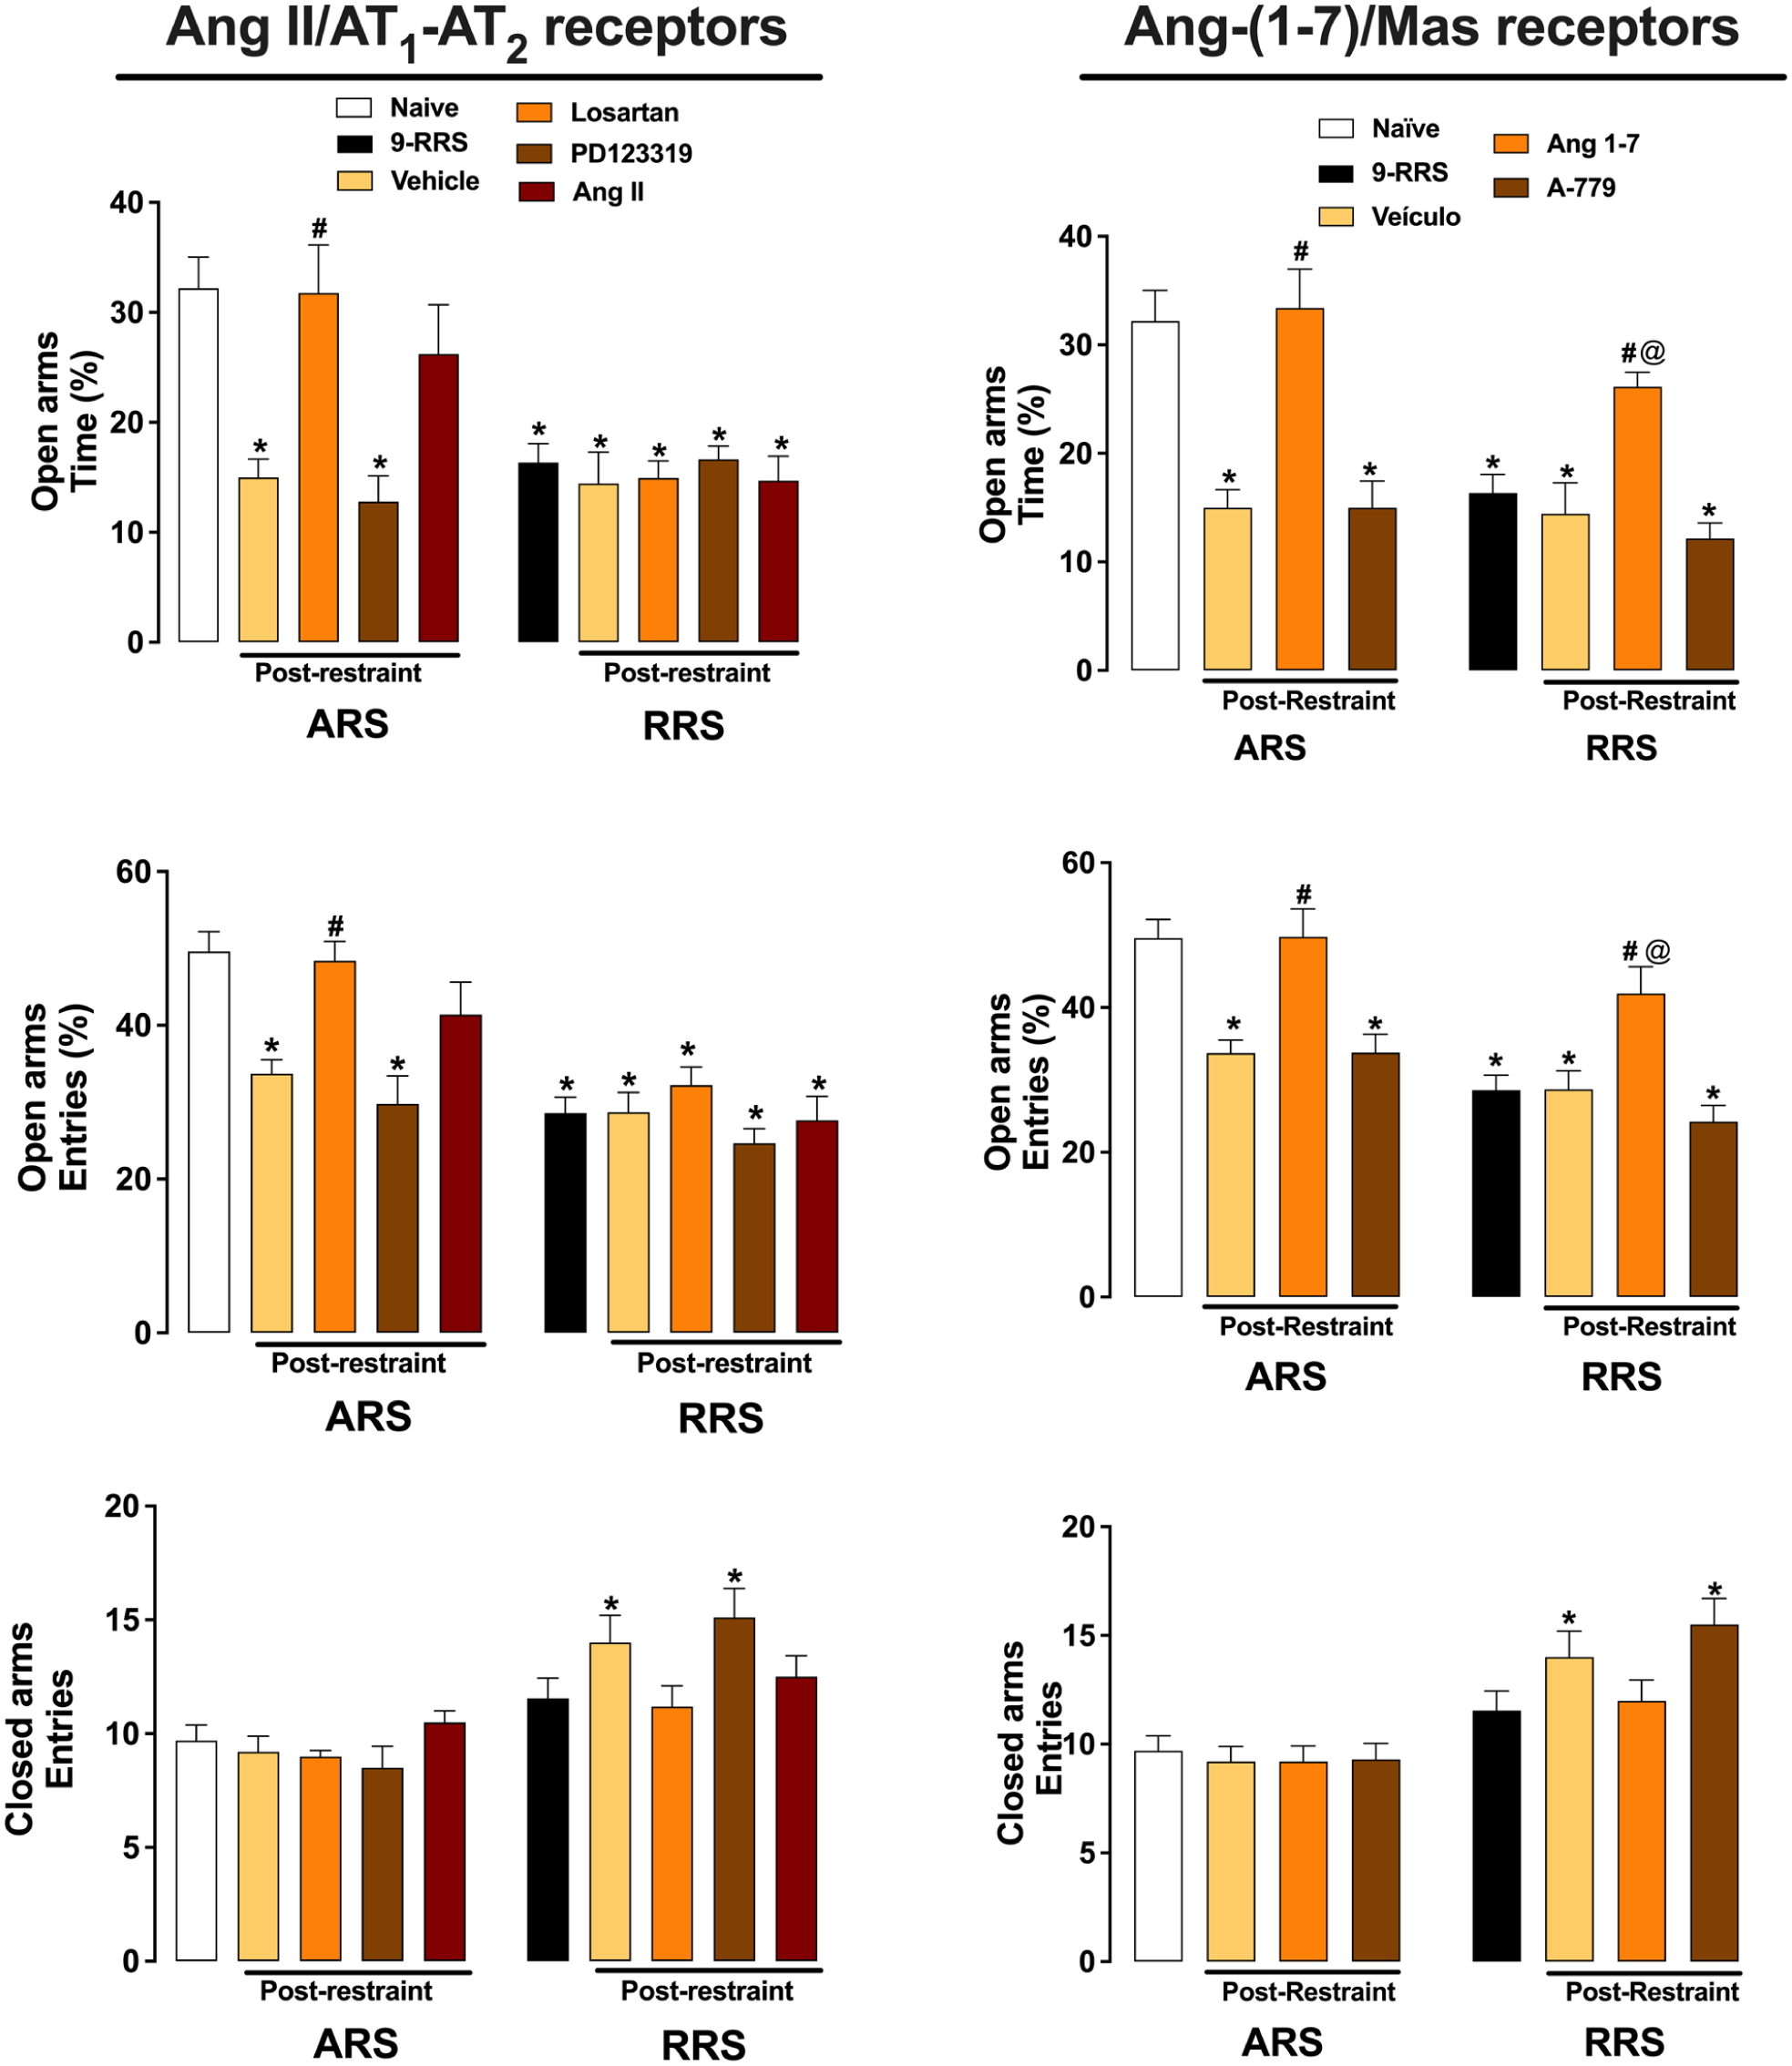
Evaluation of the involvement of Ang II/AT1-AT2 receptors (Left graphs) and Ang-(1–7)/Mas receptor (Right graphs) neurotransmissions in the MeA in behavioral changes in the EPM following the 1st (ARS) and 10th (RRS) restraint stress session. Percentage of open arms time and entries and closed arms entries were assessed during exploration of the EPM following the 1st and 10th restraint session in animals treated with Ang II (0.05 nmol/100 nL; ARS: n = 10, RRS: n = 10), the selective AT1 receptor antagonist losartan (1 nmol/100 nL; ARS: n = 10, RRS: n = 11), the selective AT2 receptor antagonist PD123319 (5 nmol/100 nL; ARS: n = 10, RRS: n = 10), Ang-(1–7) (0.05 nmol/100 nL; ARS: n = 10, RRS: n = 10), the selective Mas receptor antagonist A-779 (0.1 nmol/100 nL; ARS: n = 10, RRS: n = 10), or vehicle (100 nL; ARS: n = 10, RRS: n = 11) in the MeA. Animals not subjected to restraint stress (naїve, n = 10) or exposed to nine restraint sessions (9-RRS, n = 11) and not stressed on the trial day were used as control for ARS and RRS, respectively. *p<0.05 versus Naïve group; #p < 0.05 versus Respective vehicle group; @p<0.05 versus 9-RRS group. Two-way ANOVA followed by Bonferroni post hoc test.
Role of Ang II/AT1-AT2 receptors
Analysis of the percentage of time spent and number of entries in the EPM open arms indicated main effects of stress (time: F(1,93) = 22.74, p < 0.05; entries: F(1,93) = 48.90, p < 0.05) and treatment (time: F(4,93) = 5.76, p < 0.05; entries: F(4,93) = 7.77, p < 0.05), as well as stress × treatment interaction (time: F(4,93) = 5.88, p < 0.05; entries: F(4,93) = 3.27, p < 0.05). Analysis of the entries into the closed arms of the EPM also indicated a stress effect (F(1,93) = 38.28, p < 0.05) and stress × treatment interaction (F(4,93) = 2.81, p < 0.05), but without influence of treatment (F(4,93) = 1.36, p > 0.05).
Post hoc analysis revealed that ARS-vehicle, ARS-PD223319, 9-RRS, RRS-vehicle, RRS-losartan, RRS-PD123319, and RRS-Ang II presented reduced percentage of EPM open arms time (p < 0.05) and entries (p < 0.05) in relation to naïve group. Moreover, ARS-losartan had increased percentage of EPM open arms time (p < 0.05) and entries (p < 0.05) in relation to the ARS-vehicle group. RRS-vehicle and RRS-PD123319 also presented increased EPM closed arms entries in relation to naïve animals (p < 0.05).
Role of Ang-(1–7)/Mas receptor
Analysis of the percentage of time spent and number of entries in the EPM open arms indicated main effects of both stress (time: F(1,74) = 15,76, p < 0.05; entries: F(1,74) = 31.03, p < 0.05) and treatment (time: F(4,74) = 21.51, p < 0.05; entries: F(4,74) = 15.48, p < 0.05), as well as stress × treatment interaction (time: F(4,74) = 4.16, p < 0.05; entries: F(4,74) = 3.30, p < 0.05). Analysis of the entries into the EPM closed arms also indicated a stress effect (F(1,74) = 36.28, p < 0.05), but without influence of treatment (F(4,74) = 1.75, p > 0.05) and stress × treatment interaction (F(4,74) = 2.28, p < 0.05).
Post hoc analysis revealed that ARS-vehicle, ARS-A-779, 9-RRS, RRS-vehicle, and RRS-A-779 presented reduced percentage of EPM open arms time (p < 0.05) and entries (p < 0.05) in relation to the naïve group. Moreover, ARS-Ang-(1–7) and RRS-Ang-(1–7) had increased percentage of EPM open arms time (p < 0.05) and entries (p < 0.05) in relation to the respective vehicle group (i.e., ARS-vehicle and RRS-vehicle, respectively). RRS-vehicle and RRS-A-779 also presented increased EPM closed arms entries in relation to naïve animals (p < 0.05).
Effect of RRS on gene expression of AT1a, AT1b, AT2, and Mas receptors
Results of gene expression of angiotensinergic receptors in the MeA of control and RRS animals are presented in Figure 8. Analysis did not indicate significant effect of RRS for none of the genes analyzed (ΔCt-AT1a: t = 1.23, p > 0.05; ΔCt-AT1b: t = 0.51, p > 0.05; ΔCt-AT2: t = 0.26, p > 0.05; ΔCt-MAS: t = 1.18, p > 0.05; 2(−ΔΔCt)-AT1a: t = 1.19, p > 0.05; 2(−ΔΔCt)-AT1b: t = 0.09, p > 0.05; 2(−ΔΔCt)-AT2: t = 0.28, p > 0.05; 2(−ΔΔCt)-MAS: t = 1.26, p > 0.05).
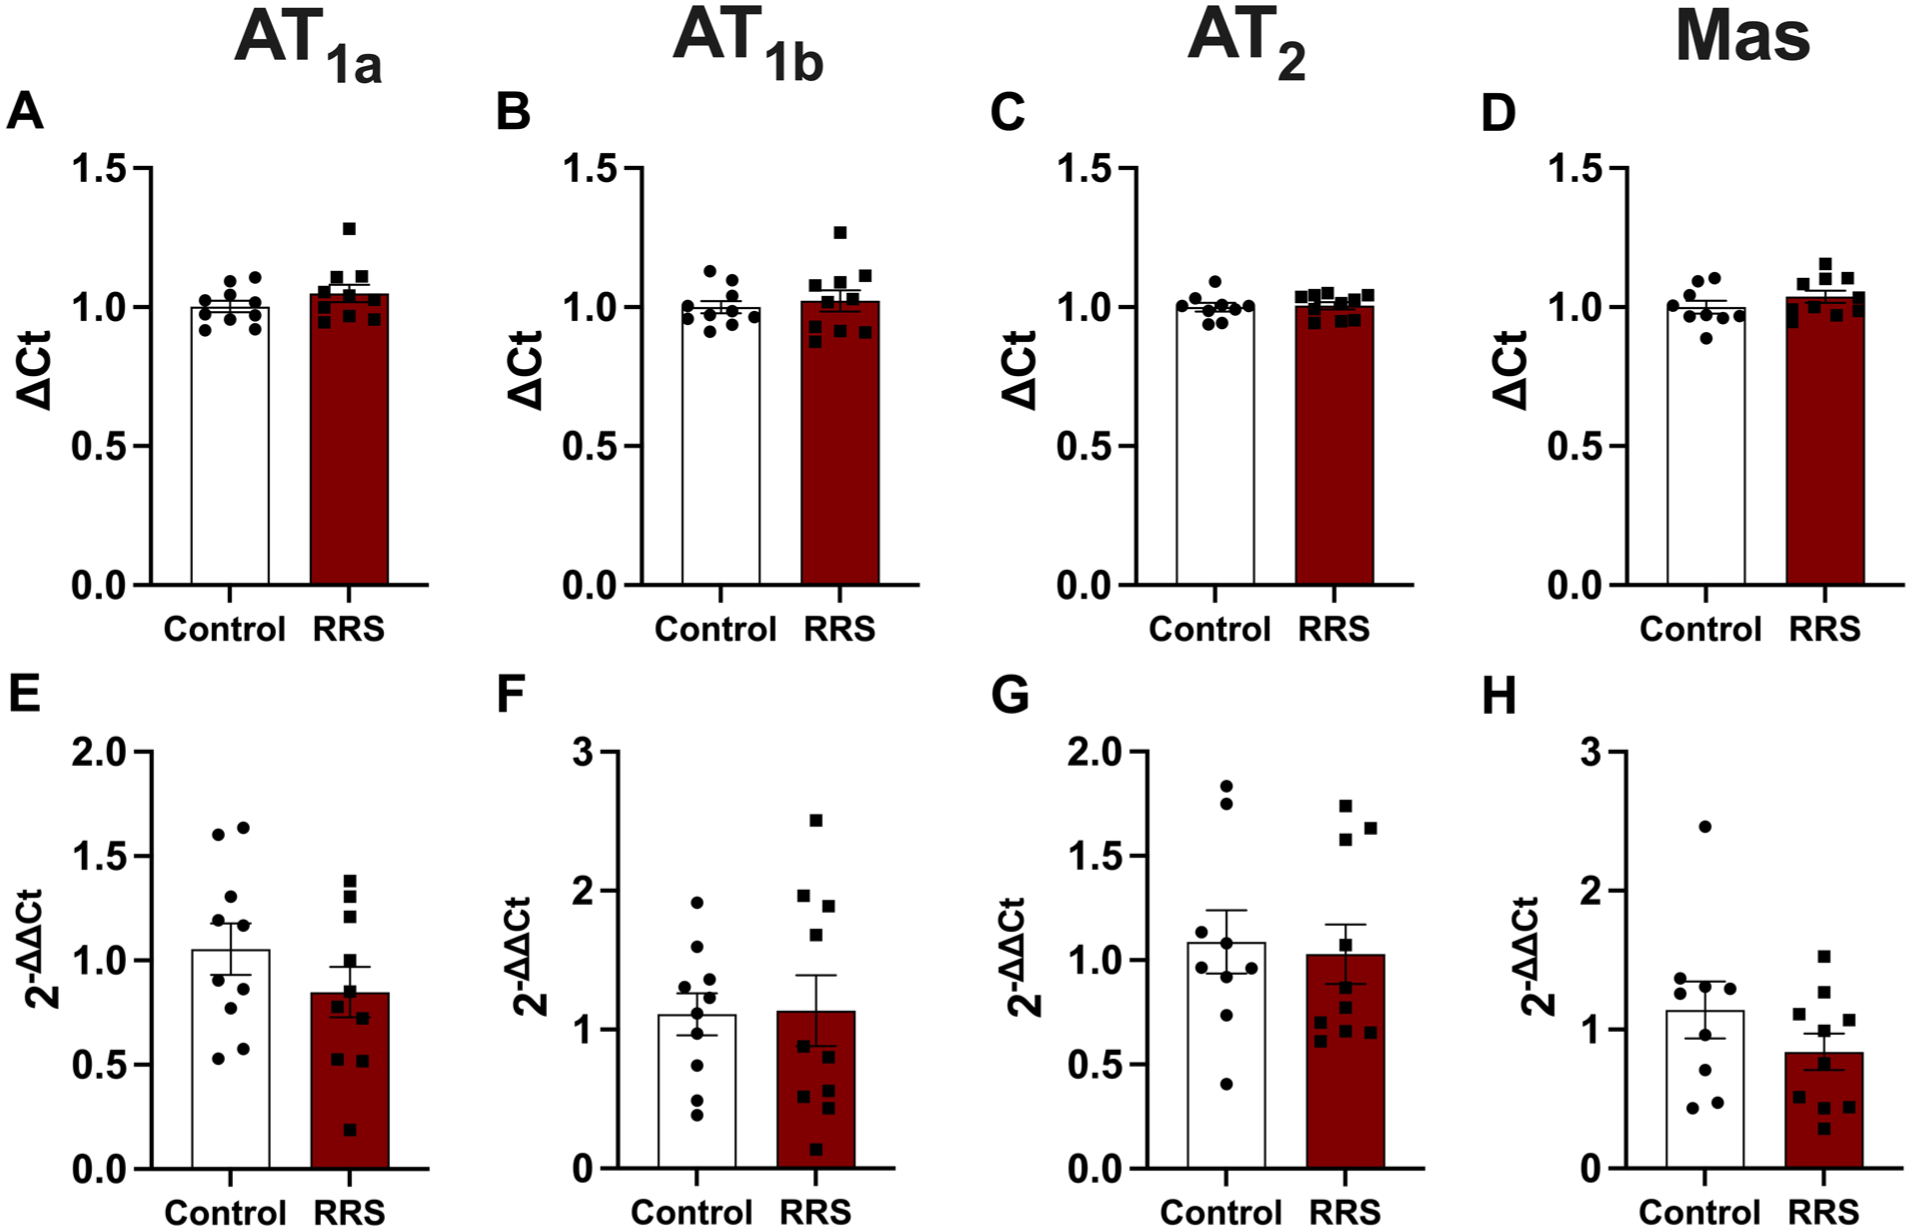
Evaluation of angiotensinergic receptors gene expression (RT-qPCR) in the MeA in response to RRS. Control group was not subjected to RRS, while the RRS group underwent daily 60-minute restraint sessions for 10 consecutive days. (a–d) ΔCt values for AT1a (a), AT1b (b), AT2 (c), and Mas (d). (e–h) Gene expression levels calculated as 2(−ΔΔCt) for AT1a (e), AT1b (f), AT2 (g), and Mas (h). Statistical analysis was performed using Student’s t-test, n = 9–10/group.
Discussion
Results of the present study provide the first evidence that angiotensinergic neurochemical mechanisms present within the MeA is involved in cardiovascular and autonomic responses and anxiogenic-like effect evoked by stress. Table 2 summarizes the effects evoked by pharmacological manipulation of either Ang II/AT1-AT2 receptors or Ang-(1–7)/Mas receptor neurotransmissions in the MeA in the pressor and tachycardiac responses, TST drop and anxiogenic-like effect evoked by ARS and RRS. Results did not indicate an effect of RRS in gene expression of angiotensinergic receptors in the MeA.
Summary of the effects of MeA treatment with angiotensinergic receptors agonists and antagonists in cardiovascular changes, tail skin temperature drop, and anxiogenic-like effect observed in acute restraint stress (ARS) and repeated restraint stress (RRS) rats.
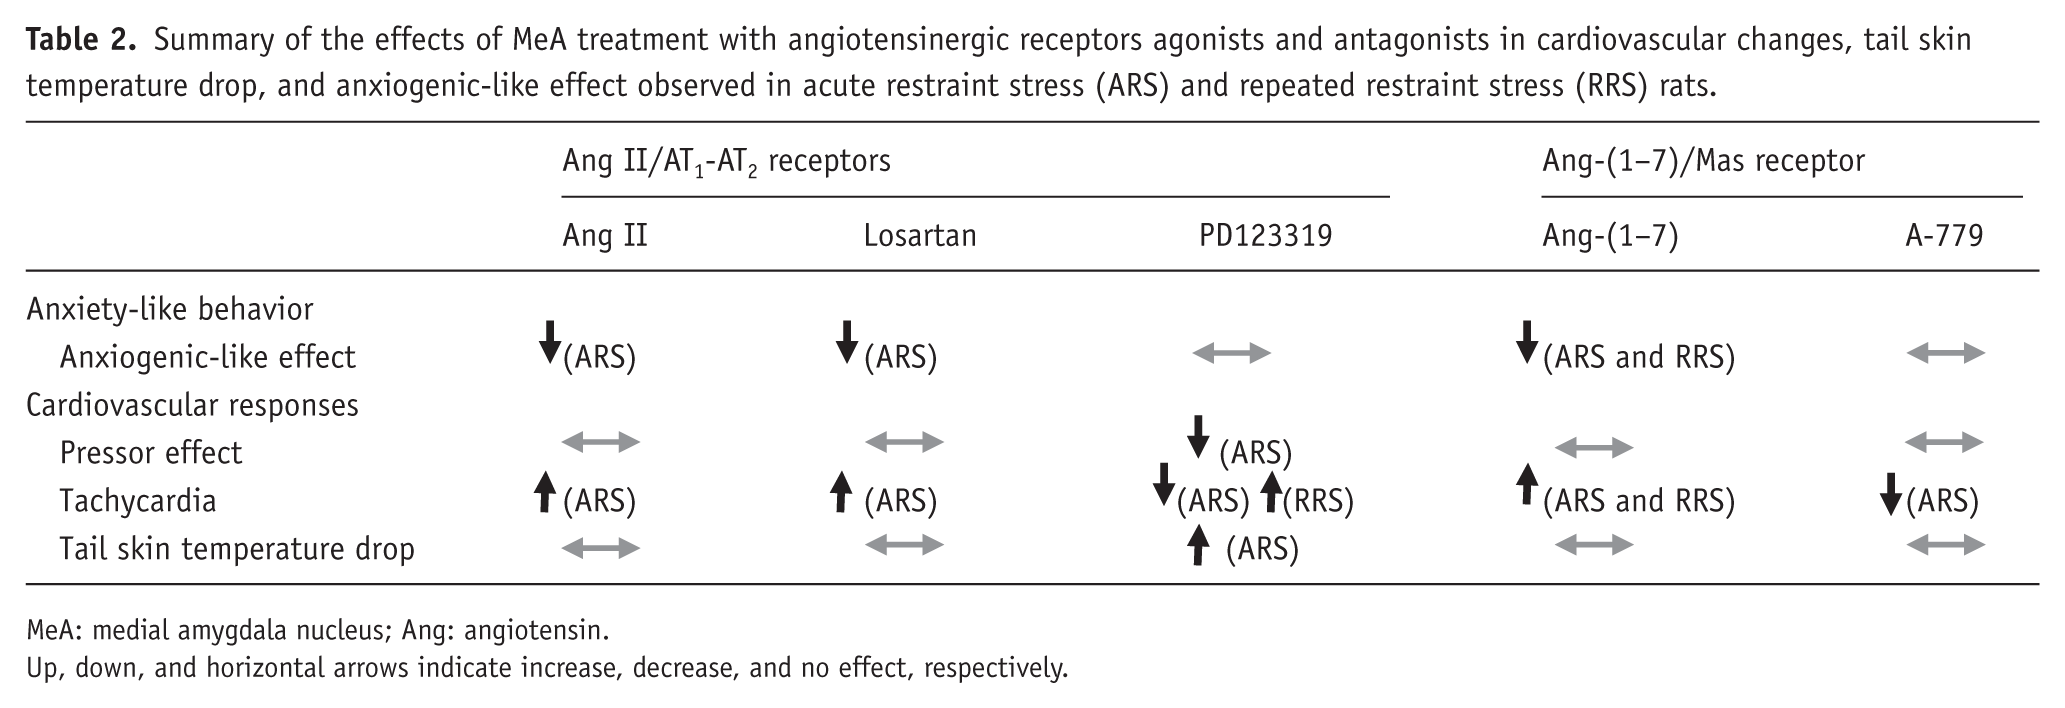
MeA: medial amygdala nucleus; Ang: angiotensin.
Up, down, and horizontal arrows indicate increase, decrease, and no effect, respectively.
A previous study documented that non-selective synaptic blockade of the MeA through local administration of CoCl2 enhanced the tachycardic response during restraint stress, but without affecting the MAP increase (Fortaleza et al., 2009). These findings highlighted an inhibitory role of the MeA in restraint-evoked HR response (Fortaleza et al., 2009). A similar facilitatory effect on the tachycardic response was also observed following local MeA treatment with cholinergic muscarinic receptor, opioid receptors or selective α₂- or β₂-adrenoceptor antagonists (Fassini et al., 2021; Fortaleza et al., 2009, 2012a, 2012b). In this sense, the increased tachycardia during ARS obtained in the present study in animals treated with losartan in the MeA provides new evidence that angiotensinergic neurotransmission, acting via AT1 receptor, is also related to the inhibitory control by MeA of HR response.
It is worth highlighting that our data contrasts the general idea that AT1 receptor is involved in expression of physiological and behavioral responses to stress (Correa et al., 2022; Saavedra, 2017). However, previous evidence indicated that role of brain Ang II-mediated neurotransmission might be site-specific. For instance, AT1A knockout mice presented attenuated neuronal activation to cage switch stress in hypothalamic paraventricular (PVN) and dorsomedial nuclei and rostral ventrolateral medulla (RVLM), whereas higher activation was observed in the MeA, nucleus of the solitary tract, and caudal ventrolateral medulla (Davern et al., 2009). Based on these findings, it was theorized that MeA AT1 receptor could play an inhibitory influence in stress responses (Correa et al., 2022). The findings of the present study in restraint-evoked tachycardia confirm this latter idea and support evidence that role of AT1 receptor in control of stress responses is brain site-specific.
We found that MeA treatment with Ang II produced similar effects on restraint-evoked tachycardia in relation to that observed following AT1 receptor antagonism. Considering that Ang II has 15- to 33-fold greater affinity for the AT2 receptor compared to the AT1 receptor (Bosnyak et al., 2011), as well as data indicating that AT2 receptor acts as a counter-regulatory mechanism to stress effects of AT1 receptor (Correa et al., 2022; Saavedra and Armando, 2018), our data suggest that effects observed in the present study by Ang II treatment were mediated by activation of the AT₂ receptor. Accordingly, we found that antagonism of AT₂ receptor in the MeA evoked opposite effects when compared to those evoked by Ang II (i.e., decreased restraint-evoked tachycardia). Therefore, our data suggest opposite role of local AT2 (facilitatory) and AT1 (inhibitory) receptors within the MeA in expression of tachycardia to restraint.
Evidence obtained following treatment with Ang-(1–7) and the selective Mas receptor antagonist indicated that Ang-(1–7)/Mas receptor neurotransmission within the MeA is involved in expression of tachycardia to restraint. This pattern of effect is consistent with findings observed following AT2 receptor antagonism and opposite in relation to AT1 receptor antagonism. Such as AT2 receptor, Ang-(1–7)/Mas receptor axis is also proposed as a counter-regulatory mechanism for the role of AT1 receptor in stress responses (Campagnole-Santos et al., 2025; Goulart et al., 2022). Therefore, our findings provide new evidence that opposite role of AT2 and Mas receptor in relation to AT1 receptor is present in MeA control of restraint-evoked cardiovascular responses. However, the present findings are somehow contradictory to general idea that Ang-(1–7)/Mas receptor pathway plays inhibitory role in stress-evoked physiological responses (Correa et al., 2022). As noted above for AT1 receptor-mediated effects, regulation by the Ang-(1–7)/Mas receptor axis is also highly dependent on brain region and experimental context. Indeed, while Ang-(1–7) microinjection into the basolateral amygdala attenuated the pressor response to cage-switch stress (Oscar et al., 2015), this peptide has been associated with sympathetic activation and increases in blood pressure and/or HR in other regions, such as the RVLM (Bilodeau and Leiter, 2018; Li et al., 2015) and PVN (Gomes Da Silva et al., 2005; Yu et al., 2019a). In this sense, the present findings identify the MeA as an additional brain region in which Ang-(1–7) modulates cardiovascular function by increasing HR.
Previous studies reported attenuation of HR response during restraint stress following treatment of the MeA with either α1- or β1-adrenoceptor antagonists (Fortaleza et al., 2012a, 2012b). This effect is opposite to the facilitation of the tachycardic response observed here following AT1 receptor antagonism as well as to those reported previously after non-selective synaptic blockade with CoCl2 or antagonism of cholinergic muscarinic receptor and α2- or β2-adrenoceptor (Fortaleza et al., 2009, 2012a, 2012b). Thus, AT2 and Mas receptors appear not only to counteract the effects of the AT1 receptor, but also their activation seems to be part of a broader counter-regulatory mechanism involved in stress response control within the MeA, in which noradrenergic neurotransmission also plays a role.
AT₂ receptor antagonism was the only pharmacological approach that affected the pressor response and TST drop to restraint. These findings are supported by previous data showing a reduction in blood pressure response after either inhibition of the MeA via local treatment with the GABAA receptor agonist muscimol (Kubo et al., 2004) or antagonism of local histaminergic receptors (de Almeida et al., 2015). Moreover, opioid receptor antagonism within the MeA enhanced pressor and TST responses (Fassini et al., 2021). The enhanced drop in TST indicated a facilitated sympathetically mediated cutaneous vasoconstriction, thus not being linked to the attenuated blood pressure response. Therefore, it is possible that effect in blood pressure is related to influence of AT2 receptor-mediated neurotransmission in vascular beds other than cutaneous. Despite of that, our data provide new evidence indicating an involvement of MeA angiotensinergic neurotransmission, acting via AT₂ receptors, in control of blood pressure and sympathetic responses during stressful events.
Anxiogenic-like effect to ARS was prevented by MeA treatment with either Ang II, losartan, or Ang-(1–7). These results indicate that AT1 receptor within the MeA is involved in expression of restraint-evoked anxiogenic-like effect in the EPM. Such as observed for the tachycardia, Ang II and losartan presented similar effects in anxiogenic-like effect. This finding reinforces the idea that in our experimental conditions Ang II is acting selectively in the AT2 receptor. In this sense, the absence of effect of PD123319 suggest that AT2 receptor is not physiologically recruited for expression of restraint-evoked behavioral changes in the EPM, but its pharmacological activation is sufficient in inhibiting this behavioral effect. This rational is similar for the effects obtained with Ang-(1–7) and A-779 treatment, which indicated that pharmacological activation of Mas receptor is also able to inhibit behavioral changes in the EPM following ARS. However, given the absence of effect of A-779, we cannot exclude the possibility that Ang-(1–7) effects on anxiogenic effects of restraint is mediated by alternative receptors. For instance, it has been described that Ang-(1–7) binds to AT1 receptor and acts as a competitive antagonist for Ang II effects (Galandrin et al., 2016). The similar effect of Ang-(1–7) and losartan treatments in restraint-evoked anxiogenic effect further support the idea of an involvement of AT1 receptors. Furthermore, Ang-(1–7) can also bind and activate the AT2 receptor, so that we cannot exclude its involvement (Bosnyak et al., 2011; Patel and Hussain, 2020).
Except for the influence of Ang-(1–7) treatment in tachycardiac and anxiogenic responses, all other effects following MeA pharmacological treatment were affected (for details, see Table 2) by previous repeated exposure to restraint stress. These findings provide initial evidence that RRS affects angiotensinergic neurotransmissions within the MeA. However, evaluation of angiotensinergic receptor gene expression in the MeA revealed no effect of RRS. This contrasts with previous findings showing alterations in the expression of angiotensinergic receptors after ARS or RRS in various brain areas, including the amygdala (Aguilera et al., 1995; Leong et al., 2002; McDougall et al., 2000; Milik et al., 2016; Zhu et al., 2014). It is worth highlighting that technical limitations related to the specificity of commercially available antibodies for angiotensinergic receptors precluded protein quantification (Burghi et al., 2017; Hafko et al., 2013; Herrera et al., 2013), so that changes on protein levels cannot be completely excluded. However, the absence of mRNA changes suggests that the effects of RRS in control of physiological and behavioral responses to stress by MeA angiotensinergic neurotransmission may instead reflect changes in angiotensinergic receptor function and/or signaling. These effects could be related to homo- and heterodimer formation, phosphorylation, desensitization, internalization, and changes in signal transduction (Higuchi et al., 2007; Karnik et al., 2015). In addition, it has been reported that several stressors affect brain angiotensin synthesis and ACE expression (Saavedra et al., 2011; Xue et al., 2019). ACE and ACE2 are rate-limiting for Ang II and Ang-(1–7) production, respectively (Karnik et al., 2017; Remodeling et al., 2006; Santos et al., 2018), and stress increases signaling of the former while impairing the latter (Correa et al., 2022; Saavedra et al., 2011). Additionally, variants of the ACE gene linked to higher enzyme activity has been associated with stress-related diseases such as post-traumatic stress disorder, depression, and cardiovascular diseases (Baghai et al., 2006; Holman, 2012; Nylocks et al., 2015). Thus, we cannot exclude the possibility that changes in MeA angiotensinergic neurotransmission control of stress responses in chronically stressed animals are mediated by changes in angiotensin synthesis. Therefore, further studies are necessary to clarify the local mechanisms related to the changes in control of stress responses by MeA angiotensinergic neurotransmission as consequence of previous repeated stress experience.
Inhibition of the Ang II/AT1 receptor pathway and facilitation of the Ang-(1–7) pathway has been proposed as potential new therapeutic strategy for the treatment of stress-related disorders (Correa et al., 2022; Saavedra, 2017, 2021; Saavedra and Armando, 2018). In this context, the data presented here suggest that central angiotensinergic signaling, particularly within the MeA, may modulate both cardiovascular and behavioral responses to stress, highlighting its potential clinical relevance. However, the partially divergent effects observed across biological domains warrant caution. For instance, MeA treatment with losartan and Ang-(1–7) produced anxiolytic-like effects that were accompanied by facilitation of restraint-evoked tachycardia. These findings indicate that modulation of the angiotensinergic system may not be uniformly beneficial across all stress-evoked responses and should therefore be carefully considered when evaluating its therapeutic potential.
In summary, the results documented here indicate an opposite role of AT2 and Mas receptors (facilitatory) in relation to AT1 receptor (inhibitory) present within the MeA on tachycardia evoked by ARS. AT1 receptor present within the MeA is also recruited for expression of anxiogenic-like effect to ARS, whereas AT2 receptor plays a facilitatory role in pressor response and inhibits the sympathetically mediated cutaneous vasoconstriction. Data also suggest that previous repeated exposure to restraint stress affects the control of cardiovascular and anxiogenic responses mediated by both Ang II/AT1-AT2 receptors and Ang-(1–7)/Mas receptor axes in the MeA. These findings contribute to the understanding of the neural mechanisms involved in consequences of chronic stress exposure, providing initial evidence of a role of MeA angiotensinergic neurotransmissions as an important modulator of cardiovascular, autonomic, and behavioral responses.
Footnotes
Author contributions
W.C.F. and C.C.C. conceived and designed this research; W.C.F., L.G.S., P.C.B., F.F.E., F.C.C., and M.V.S.F. performed the experiments and analyzed the data; W.C.F., L.G.S., P.C.B., F.F.E., F.C.C., M.V.S.F., and C.C.C. interpreted the data; W.C.F and C.C.C. prepared the figures and drafted the manuscript; L.G.S., P.C.B., F.F.E., F.C.C., and M.F.S. edited and revised the manuscript; C.C.C. approved the final version of the manuscript.
Funding
The authors disclosed receipt of the following financial support for the research, authorship, and/or publication of this article: This work was supported by grant from FAPESP (Grants # 2015/05922-9, 2017/19249-0, and 2022/06260-3), CNPq (Grant # 431339/2018-0), and CAPES (Finance Code 001). CCC is a CNPq research fellow (process # 304484/2022-9), WCF had an FAPESP PhD fellowship (process # 2016/05218-2), and LGS is a CAPES post-doc fellow.
Declaration of conflicting interests
The authors declared no potential conflicts of interest with respect to the research, authorship, and/or publication of this article.