
Abstract
Existing observation instruments for assessing special education teacher’s practices tend to emphasize broad classroom practices. Although these broad-focused tools allow observers (i.e., administrators) to measure teachers’ performance in most parts of the school day, the questions or indicators may be too broad to capture domain-specific practices. For example, teaching students with developmental disabilities within the context of play may look very different than during whole group instruction. In this study, we evaluate the technical adequacy of the Research Informed Classroom Evaluation – Play (RICE-P) instrument with four classroom interns with a multiple baseline design. Our results indicate consistency in scores when there were no changes in the environment, adequate interrater and test-retest reliability, and sensitivity to performance change (treatment utility). Lastly, interns rated the importance of selected play practices, change in their performance, and the RICE-P tool as socially valid.
Keywords
Introduction
All jobs (activities that require labor and generate income for the worker) serve a function in an organization (Daniels & Bailey, 2014); this function is most likely to create some product (e.g., a good or service). In special education, the goal is to provide individualized support to students so they can make progress on predetermined skills, standards, or cultural values (i.e., predetermined by the local community or applicable laws), with the ultimate goal of promoting independence and meaningful participation in their daily lives. Relying exclusively on measuring student performance to determine if special education teachers are doing their job well is not recommended since some students may underperform on standardized testing and assessments may not have sufficient sensitivity to detect small increases in learning (CEC, 2013; Cornelius & Nagro, 2014). In other words, relying solely on this type of outcome measure may not fully account for the efforts of the teacher. Given this limitation in measuring student behavior, teachers in special education settings may require more individualized and directly aligned assessments to evaluate progress and measurements of teacher performance.
In most jobs, quality workplace performance leads to programmed or natural consequences (e.g., for completing a report, the bare minimum natural consequence is that the report is done). However, those teaching students with low incidence developmental disability may find that the naturally occurring consequences for quality teaching (i.e., student learning) is delayed and uncertain. In this case, supervisor feedback may help maintain teacher performance (Johnson et al., 2023) in place of immediate natural consequences. Although much research is needed to determine how the features of feedback (e.g., temporal relation to the performance, specificity, modality, etc.) impact performance (Johnson et al., 2023), two findings are clear: frequent feedback improves performance better than infrequent (Kang et al., 2005; Pampino et al., 2004; So et al., 2013) and accurate feedback is better than inaccurate (Brand et al., 2020; Hirst & Digennaro Reed, 2015). In fact, using Horner et al.’s (2005) criteria for determining evidence based practice, Cornelius and Nagro (2014) reported that performance feedback was an evidence based practice for improving implementation fidelity of instructional practices and a promising practice for increasing target teacher behaviors.
Some evidence suggests that people may find delivering corrective feedback to be aversive and subsequently give inaccurate feedback (i.e., telling the employee they did the step correctly) or reduce the frequency of feedback delivery when the employee reacts negatively (Matey et al., 2021). While non-special education teachers report wanting to receive feedback monthly, they typically only receive feedback once or twice a year (Barton et al., 2011). We are unaware of any studies surveying how often special education teachers receive and prefer to receive feedback. However, if administrators lack familiarity with best practices for students with low incidence developmental disabilities, they may avoid providing feedback or provide inaccurate feedback, exacerbating an already infrequent schedule of observation.
Given the small percentage of the teaching force who are highly qualified to work with students with low incidence developmental disabilities, many administrators who transition to leadership do not have expertise teaching students with low incidence developmental disabilities. This may mean that the person providing the teacher with feedback and supervision has never had the opportunity to do the teacher’s job. Imagine, for a moment, a master electrician providing feedback to a plumber. Although they both contribute to building houses, we do not expect the electrician to know enough about plumbing to tell a plumber how to improve their job results. Yet, this expectation of supervisors and administrators is common in schools. As an empirical example, Westling et al. (2022) found that during special education teacher observations, agreement between two observers was higher when both had backgrounds in special education.
Beyond the problem with the supervisor’s expertise, few tools exist to measure the performance of special educators teaching students with low incidence developmental disabilities. With a lack of tools available, Rodl et al. (2018) found that most administrators reported using the same instruments for both general education and special education teachers. This finding should raise concerns since special education inherently differs from general education in terms of the types of classrooms, teaching arrangements, and what is considered effective instruction (Jones & Brownell, 2014; Westling et al., 2022). Recently, researchers have developed three new tools that are explicitly for use with students with low incidence developmental disabilities, but these tools still have limitations.
The first tool, the Autism and Low Incidence Classroom Observation Tool (ALCOT) is a checklist observation instrument that administrators can use to evaluate special education teachers’ use of quality teaching practices in the domains of environmental arrangements, instruction, instructional supports, behavior management, communication, and staff interactions (Pennington, 2018). Designed for special education teachers who have students with low incidence developmental disabilities, the ALCOT can be used across all ages. Similarly, Carnahan and Lowrey (2018) created a classroom observation instrument, the Classroom Observation Tool (COT) for students with autism grades K-12 that includes questions about evidence-based practice usage for teaching students with autism spectrum disorder in the domains of environment, instruction, and communication. Unfortunately, no one has evaluated the technical adequacy of either of these tools (e.g., content validity, interrater reliability).
One other tool, the Teacher Rating and Assessment Instrument for Teachers of Students with Significant Disabilities (TRAIT-SD; Westling et al., 2022), contains indicators in the categories of general instruction and classroom climate, individual student instruction, and behavior improvement. This instrument is intended for teachers of students with low incidence developmental disabilities, but the validation studies of this instrument do not specify an age range. Surveyed teachers who work with students with low incidence developmental disabilities rated the indicators included in TRAIT-SD as important (Westling et al., 2024), demonstrating preliminary content validity. However, inter-rater reliability was lower than ideal. Only 23 of the 37 items resulted in 80% or more agreement between two trained observers familiar with special education teaching practices. Agreement between a trained observer familiar with special education and principals was lower, with item agreement ranging between 5% and 59%. Potentially, one reason for the low agreement is that the items included in the TRAIT-SD used a rating scale to quantify the presence of certain teaching constructs (e.g., parent involvement is encouraged and respected; instructional time is used flexibly). An alternative method would be to include indicators that are observable behaviors, rather than constructs, such that these behaviors could be scored as an occurrence or non-occurrence during some period of time.
There are two other limitations with existing instruments (e.g., ALCOT, TRAIT-SD, COT). First, these instruments are often a dichotomous measure of if a practice is used (i.e., yes or no) that ignores the context of the observation within and across time. That is, evaluating special educator performance over time allows the measure to be sensitive to when and how frequently a skill may be used during the observation. The second limitation is that the instrument items are broad classroom practices that may not be applicable across all instructional domains or developmental contexts, such as play. Play is developmentally critical given that it is linked to physical, intellectual, and emotional functioning (Charlop et al., 2018). In addition, play is a skill that helps children develop school readiness, literacy skills, and self-regulation skills (Lifter et al., 2011). Barton (2016) provides many benefits of play, such as promoting meaningful interactions, freeing up time for caregivers to engage in other routines, and serving as an incompatible behavior with challenging behaviors. In addition, correlational and longitudinal studies demonstrate relationships between key play milestones and milestones in other domains (e.g., language, cognition, and social/emotional development) which has led to some researchers calling play its own developmental domain (Lifter et al., 2011).
Students with disabilities usually have delays in play (Barton & Harn, 2014, Ch 15; Lifter et al., 2011). In fact, deficits in pretend play are used as a predictor in some autism screeners (e.g., Baird et al., 2000). Although many children learn to play through access to unstructured play time, students with disabilities may require systematic and explicit instruction in play skills (Barton, 2016). Although there are many play-based assessments for evaluating student play behavior (e.g., Lifter et al., 2011), there are very few assessments for evaluating teacher performance in teaching these play behaviors. For this instructional context, using a tool that is broad (such as the ALCOT or TRAIT-SD) may not capture the specific instructional practices that teachers should be using during this time.
Thus, administrators and teachers could benefit from an observation instrument that is sensitive to the research based instructional practices used in play contexts when teaching students with low incidence disabilities. Although the primary function of this tool would be to systematically measure teacher performance on research-informed play practices, if designed well, this tool could also serve other functions for the teacher. According to the human performance system (HPS; Rummler & Brache, 2012), which is a conceptual framework of staff performance used in organizational psychology, there are several key environmental variables that impact workplace performance. The HPS suggests these key environmental variables are performance specifications, task support, meaningful consequences, feedback, skills and knowledge, and staff capacity (Rummler & Brache, 2012). A tool, like the one previously described, could improve several of these domains; specifically, this tool could serve as a (a) set of performance standards to which teachers could refer, (b) a method for allowing administrators to pair positive consequences (e.g., rewards) to performance improvement (as measured by the tool) and (c) a method for allowing systematic feedback on play practices from administrators (who may not have much experience in teaching play themselves). For administrators this tool serves as a structured and scaffolded way to observe and provide feedback on the class-wide play practices that are the most likely to be effective (similar to Tier 1 practices within a multi-tiered systems of support framework). Then, if students do not show language or play progress from these class-wide strategies, the teacher could begin to individualize play procedures for that student (e.g., add in more opportunities to respond).
There are many psychometric qualities of instruments that can be evaluated, however, there is no consensus on which of these aspects indicate that the instrument is truly valid (see Hintze [2005] for proposed quality indicators of direct observation studies). Since capturing all of these psychometric qualities would require multiple studies, we believed that a preliminary evaluation of this instrument evaluating special educators’ use of play practices should prioritize four things. First, the observation instrument should obtain high levels of interrater agreement and test-retest reliability, to ensure observation scores are not dependent on some factor outside of the employee’s control (e.g., who observes). Second, this tool should contain practices that are supported by the empirical literature. Third, to benefit administrators and teachers, this tool should be sensitive enough to detect teacher changes in performance following environmental changes (treatment utility). Lastly, this tool should be deemed as acceptable by those who observe (i.e., admin) and those who receive the observation (i.e., teachers). In general, current tools for measuring special education teacher performance are limited both by their scope and their lack of psychometric validation. Thus, initial research is needed to establish a tool that measures special education teacher’s play behaviors, has adequate preliminary technical adequacy, and demonstrates strong treatment utility.
The purpose of this study was to evaluate some technical adequacy aspects of the RICE – Play teacher observation tool when used to provide feedback to four interns. For example, some practices found in the literature to increase play and language within the context of play instruction are environmental arrangement, having multiple engaging toys, modeling and expanding communication, and prompting and reinforcing the student’s communication (see Table 1 for more detailed descriptions of these practices). We developed this tool to measure special education teachers’ performance during play-based instruction with students with low incidence developmental disabilities in preschool or early elementary school (see method section for more details). There is sufficient data to suggest that providing feedback can improve performance (Cornelius & Nagro, 2014); thus, our primary research questions focused on the technical adequacy of the RICE-Play tool. In other words, the feedback simply served as a mechanism for changing behavior such that we could be sure the tool detected changes in behavior in an accurate, consistent, and valid way.
Does the RICE-Play produce valid levels of interrater reliability?
Following coaching, is the RICE-Play measure sensitive enough to detect changes in performance (treatment utility)?
Following coaching, do participants find the RICE-Play to be acceptable and/or socially valid?
Do individual RICE-Play items result in adequate test-retest reliability?
Included Play Practices and Some Supporting Evidence.
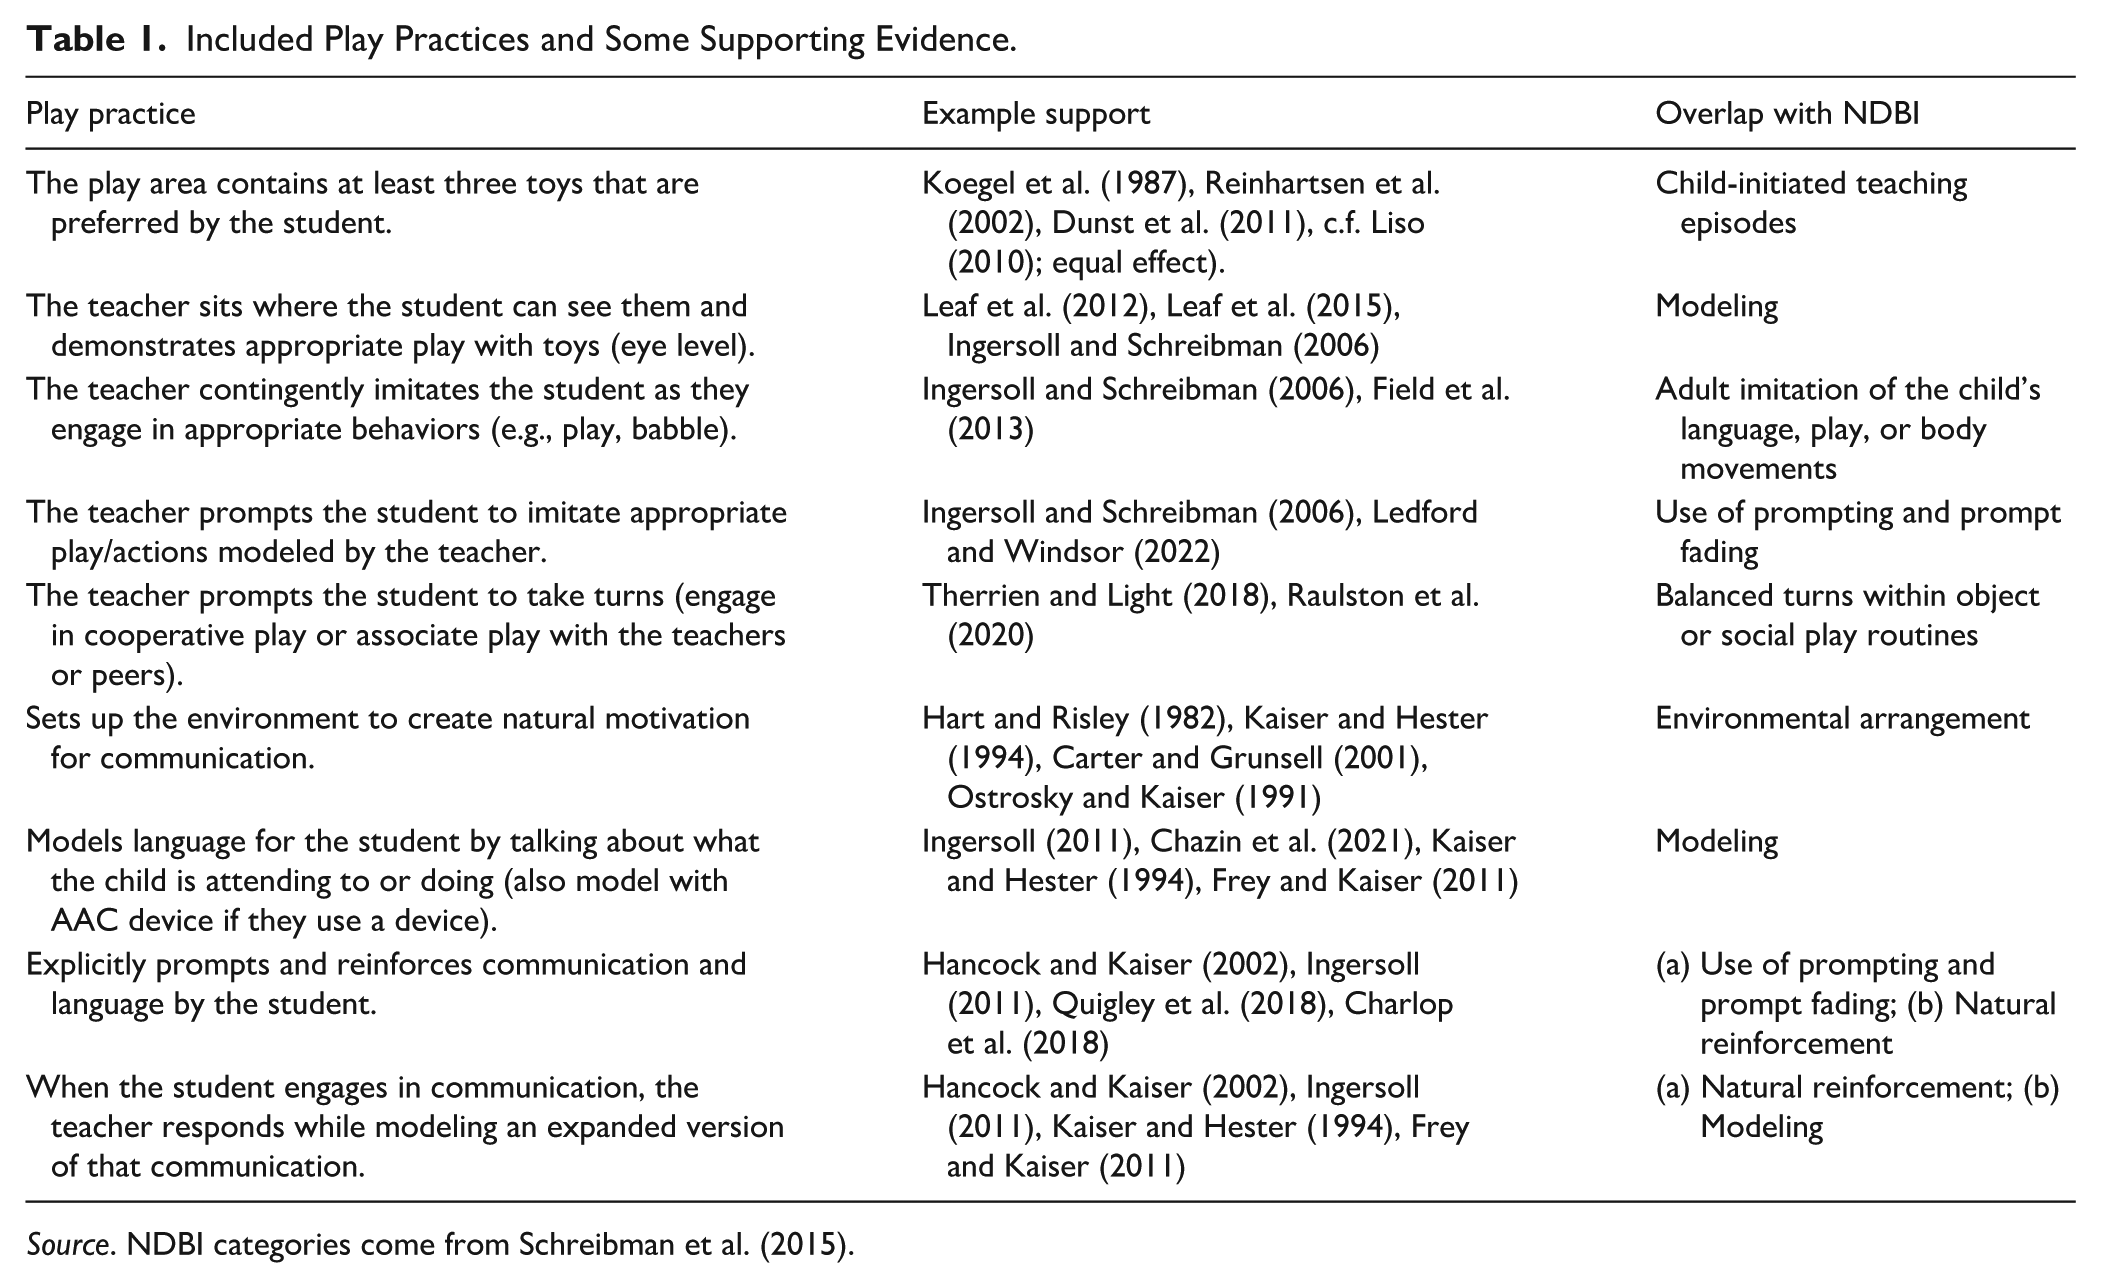
Source. NDBI categories come from Schreibman et al. (2015).
Method
Setting and Participants
This study took place in a preschool and grade K–2 self-contained classroom. These classrooms were operated by the local university as a practicum site for training future special education teachers and behavior analysts. The students in the classroom all received special education services under the eligibility categories of autism, intellectual disability, speech and communication disorder, or some combination. All students were eligible to participate in the state’s adapted alternative achievement standards. Both classrooms had two play centers, created by blocking off a section of the room with shelves. These centers were approximately 30 ft2 and the shelves contained a variety of toys. As part of this classroom’s normal school schedule, students rotated between four different 15-min activity stations (e.g., small group table for a craft; large worktable for working on IEP goals; centers for working on play). Instruction in centers focused on initiating communication, expanding language, engaging in new or expanded play, and when appropriate, student IEP goals that could be embedded into a play center (e.g., responding to name). All sessions occurred during these play instructional blocks.
Participants were practicum students working towards their certification as either a behavior analyst, special education teacher, or both. For the rest of this paper, we will refer to these practicum students as interns. As part of their practicum placement, the interns worked in the classroom providing special education services, serving in a role identical to a special education teacher or educational technician. These services included planning lessons aligned with the general education curriculum, teaching and collecting data on IEP goals, and serving as the supporting personnel during all parts of the school day (e.g., recess, art, music). Since the authors in the study were the intern’s supervisors, during the consent process, we informed the interns that their consent (or dissent) to participate in the study would not affect their relationship with their supervisors, their treatment at practicum, or their practicum requirements, and that they could withdraw their consent at any point.
All interns had received training and coaching on how to play with students at the beginning of the school year. This training was a part of a 3-day classroom orientation training, led by the lead teacher, a doctoral student in special education. The play portion of the classroom orientation training was developed by a doctoral researcher in special education who had extensive expertise in naturalistic developmental behavioral interventions. The training focused on nine play practices: watching and noticing how the student plays, staging yourself where you can see the student, intentionally arranging toys and bins, identifying and respecting the child’s comfort zone, following the student’s lead, active listening, narrating play, offering help, and imitating student actions. During this training, the lead teacher noted specific considerations for each play practice (e.g., how many words to use when narrating play) and demonstrated each practice with a staff confederate. By the time of the study, approximately 1 month after the initial training, the lead teacher reported that the interns were struggling with maintaining play fidelity, even though she had presented informal written and vocal feedback. She also reported that she did not have a way to quantify the play practices.
Sienna was a 25-year-old, White, cisgender female. She had a bachelor’s of science in psychology and was in the third semester of her master’s in applied behavior analysis. Marshall was a 36-year-old, Black and Latino cisgender male. He had a bachelor’s of science in special education, was a certified teacher, and was in his third semester of his master’s in applied behavior analysis program. Both Sienna and Marshall worked in the K–2 classroom during this study. Connor was a 22-year-old, White, cisgender male who was in a dual program that allowed Connor to finish his undergraduate in psychology and master’s in behavior analysis in a year. He had 1 year left in this program at the time of the study. He had been an RBT for approximately 2 months prior to the start of the study. Bella was a 23-year-old, White, cisgender female who was in her last semester of a master’s in special education program. Both Connor and Bella participated in sessions in the pre-kindergarten classroom. Raegan served as the participant for the test-retest reliability. She was a 22-year-old, White, cisgender female. She had a bachelor’s of science in psychology and was in her second semester of her master’s in applied behavior analysis.
Materials
For both data collection and providing feedback, we used the Research Informed Classroom Evaluation – Play (RICE-P 1 ) tool. This tool was developed by the first author, who had extensive experience and coursework teaching play and other developmental domains embedded into play, such as communication. Some of this coursework focused on systematic instructional strategies for acquisition, maintenance, and generalization of skills, including play skills. These instructional methods included prompting, video modeling, chaining strategies, error correction, etc. In addition, this author completed coursework on language development for infants, toddlers, and preschoolers, which included focus on the development of play within these ages. Their coursework also included training on assessment and intervention of play and communication in early intervention settings (e.g., enhance milieu teaching). During their supervised practicum experiences, they received frequent and consistent training and feedback from a variety of faculty and doctoral students, some of whom had practical and research expertise in play-based interventions for students with developmental disabilities. The other senior authors had a combined 27 years of experience conducting field supervision. Because of this, all authors were familiar with key practices and supporting research and created the first draft of the RICE-P. We (all of the authors) then piloted the tool. Specifically, the authors conducted an observation of a supervisee using the tool to identify any parts of the tool that were ambiguous (e.g., unclear definition) and made major revisions based on this pilot. Finally, we requested feedback from a doctoral level behavior analyst unassociated with the project who taught courses and conducted research on play based interventions. We then finalized the RICE-P and conducted this study to evaluate its technical adequacy.
As intended, the RICE-P should be used for measuring and changing teacher “Tier 1” play behavior, or general play behaviors that the research suggests are likely to be effective for most students. In other words, the tool should be used during 15-min observation sessions by a teaching coach (e.g., outside consultant, school administrator, mentor teacher, or other supervisor) to quantify special educators’ use of play instructional practices set against the extent of research. These coaches should then use the information provided by the RICE-P to shape the special education teacher’s behavior through feedback, behavior skills training, or coaching. Lastly, these coaches should continue to formatively use the tool to ensure teacher performance changes. Our goal is that observers require no formal training outside of familiarity with the highlighted play practices and a general review of the tool to use it successfully. Though, observers may find it helpful to calibrate their scoring by practicing with videos before conducting the true teacher observation. Importantly, this tool should not be used punitively nor as a method for summatively scaling performance, such as giving a teacher a score for their play performance without any real opportunities to improve those practices. In addition, since this tool contains Tier 1 practices (i.e., general play behaviors likely to be effective for most students), data on student learning may indicate lack of progress and signal that these practices be adjusted for specific students.
The finalized version of RICE-P includes two components, a scoring sheet and an observation summary. The scoring sheet lists all nine target special education teacher behaviors (e.g., “the teacher contingently imitates the student as they engage in appropriate behaviors”), which is the criteria for scoring “yes.” In addition, each item includes a criteria for “no” (e.g., “the teacher does not imitate the child’s appropriate behaviors”) and “n/a” (e.g., “the student engages in no appropriate behaviors for the teacher to imitate”). This partial interval recording system includes five 3-min intervals to assess these nine research-informed practices that support play and communication during structured play sessions. Expanded definitions and supporting research for each play and communication practice can be found in Table 1.
The second component of RICE-P is the observation summary form. On this form, the observer uses a rating scale to evaluate the consistency with which the trainee uses each practice by scoring each practice as 0 (i.e., the trainee never used the practice in the observation) through 5 (i.e., the trainee often used the practice in the observation). This form also includes a section for written feedback, split into the sections “things to continue doing” and “ways to improve” corresponding to affirmative and constructive feedback. See Supplemental Appendix A for the complete RICE-P evaluation form.
Dependent Measures and Reliability
The primary dependent variable in this study was the intern’s RICE-P score, measured using partial interval recording of each target behavior at each interval. Specifically, the RICE-P score was calculated by observing nine play behaviors for five 3-min intervals (15 min sessions). We used the behavior definitions on the RICE-P to score an occurrence (i.e., “yes”), a non-occurrence (i.e., “no”) or no opportunity for the intern to engage in the behavior (i.e., “N/A”). We then derived a percentage by taking the number of intervals with an occurrence of each behavior and dividing it by the total number of opportunities across nine behaviors for five intervals. In the case in which the intern had the opportunity to engage in all the behaviors, this denominator would be 45. In most instances, the intern did not have the opportunity to demonstrate a performance (e.g., the intern could not expand communication if the student did not engage in any communication), making the denominator less than 45.
Design
Historically, researchers evaluating the psychometric qualities of an instrument or tool aim for large samples and minimal time points. For example, Westling et al. (2022) first established reliability for the TRAIT-SD using two observations and 30 special education teachers. However, this research arrangement did not align with our intended use for the RICE-P. Specifically, our goal for this instrument was that schools use it formatively (multiple observations of performance across time) to both evaluate and change performance for the better. Prior to this study, feedback had already been established as an evidence based practice (Cornelius & Nagro, 2014). Thus, the purpose of this study was not to evaluate the effectiveness of feedback, but rather to make sure that when feedback changes performance, the tool is sensitive enough to these changes in performance to detect changes in level, trend, or variability. To accomplish this goal, we used a multiple probe across participants’ design (Ledford & Tuck, 2024) to systematically evaluate the effects of the feedback package when measured by the RICE-P.
We conducted this multiple baseline design concurrently. That is, session 1 was the same start time for all participants (i.e., all participants completed session 1 before any participant started session 2) and sessions remained temporally aligned throughout the study. We moved participants from baseline to intervention when we had (a) at least three data points (b) stability in data (i.e., no trend or unpredictable variability), and (c) the previous tier met mastery criteria for intervention. Mastery criteria was set at 80% or higher RICE-P score for three sessions.
Procedures
General Procedures
Researchers started sessions by telling the intern they are being observed (e.g., “I am going to be watching you play with James just do what you would normally do”). During this time, other adults in the room continued with the regular class schedule (e.g., taking students to the restroom, working in small groups for shared reading), however, the intern had at least one student in the play area at all times. The researcher stood outside the play area, where they could observe the intern play (e.g., on the other side of a short shelf). Using RICE-P, the researcher observed and evaluated the interns’ play performance for five 3-min intervals. The researcher could take a moment (1–30 s) to finish writing the final scores for the previous interval before starting the timer for the next. Thus, all sessions were approximately 15 min.
Baseline
During the observation, the researcher provided no feedback or prompts. At the end of the session, they thanked the intern for their time and left the observation area. This condition allowed researchers to measure intern performance prior to receiving feedback.
Feedback Package
During intervention, the researchers conducted sessions exactly as described in the baseline session. However, following the observation, the researcher completed a scoring form (the last sheet of the RICE-Play tool) which scored each target behavior on a scale of 1–5 (never to often). This scoring form was aligned with the measurement system used in the RICE-P. That is, for each interval in which the intern demonstrated the target behavior (i.e., “yes”) or did not have the opportunity to engage in the behavior (i.e., “n/a”), they obtained one point, for a total possible five points. Thus, the 0–5 number circled on the observation summary sheet informed interns of how many of the five intervals they successfully demonstrated (or did not have the opportunity to demonstrate) the target behavior during the observation. In addition, from the nine behaviors, the researcher wrote down at least one behavior with an observation score between 0–3 in the “ways to improve” section and wrote at least one behavior with an observation score of 4+ in the “things to continue doing” section.
The researcher then met with the intern for a brief feedback meeting. This meeting occurred when the intern could easily remove themselves from the classroom schedule (e.g., student nap time) and always occurred before the next observation. During this meeting, the researcher first informed the intern of their overall scores for each of the target nine behaviors (e.g., “you got a three out of five imitating appropriate student actions”). The researcher then discussed the intern’s performance from the “things to continue doing section,” by providing affirmative feedback for that practice (e.g., you did really well imitating students this session), provided an example of when the intern used that practice (e.g., “for example, when your student started rolling a car you grabbed a car and did the same”) and encouraged them to continue using this practice in future sessions. The researcher then discussed the performances in the “ways to improve” section by providing constructive feedback (e.g., “I would like to see you prompting the student to take turns when you see the opportunity”), describing an example of when the opportunity to use that behavior would emerge (e.g., “when you saw the other student join in on block stacking, that would have been an ideal time to. . .”) and describing or modeling how the intern would engage in that performance.
At the end of the meeting, the researcher allowed the intern to ask any questions. Most often, they asked for another example of “ways to improve.” Following feedback from the previous session, the researcher conducted an observation as previously described. After the observation, the researcher independently completed the feedback scoring sheet for that observation and used it to provide feedback prior to the next session. This cycle repeated (observation, complete feedback form, feedback meeting) until the practicum staff scored above 80% of RICE-P intervals with target behaviors for three sessions in a row.
Job Aid
After five feedback sessions, Bella did not meet the a priori 80% mastery criteria. Analysis of her data suggested that she would allocate to specific RICE-Play target behaviors (e.g., would prompt the student to imitate her actions for the majority of a session), but struggled with alternating between practices (e.g., prompting the student to imitate, then creating a communication opportunity). To supplement the feedback, we provided Bella with an 11 step task analysis of a play-chain that contained each of the RICE-Play target behaviors (i.e., job aid; See Supplemental Appendix B). The first time we provided the checklist to Bella, we provided her the opportunity to ask any questions about the chain. For all following sessions, we ensured that Bella had the job aid during the play session, but did not prompt her to reference the job aid during the session.
Covert Observation
Given that many of the interns engaged in moderate levels of the target behaviors in baseline, we believed the range of scores (e.g., approximately 50%–100%) would limit the conclusions we could draw about technical adequacy at all levels of the dependent variable. For example, without any data points below 50%, we may not know the aspects of technical adequacy (e.g., interobserver agreement) at this level. Thus, we conducted covert observations because we believed the staff would obtain lower scores when they did not know a supervisor was watching. These observations were the same as baseline probes except that we did not announce that we would observe the participants. Since the participants were unaware of the observation, they often left the play area early (e.g., to go to the bathroom or to do other tasks). Because of this, for Sienna and Marshall, we could only conduct three intervals rather than five.
Tool Analyses
Treatment Utility
Because we were interested in how data change following environmental manipulations (Hintze, 2005), we used a multiple probe across participants to evaluate the sensitivity of RICE-P to changes in staff performance. If the RICE-P is useful in practice, we expect the instrument to detect changes in performance (i.e., level, trend, variability) only following the introduction of performance feedback and expect to see stability when performance feedback has not been implemented.
Interrater Reliability
The second author, although aware of the purpose of the study, was naive to what conditions the participants were in (who had received feedback) to prevent expectancy bias. She simultaneously and independently coded sessions with the primary observer. We graphed the secondary data, calculated point-by-point agreement, and computed Cohen’s kappa statistic to evaluate the interrater reliability achieved with this tool.
Visual Analysis
Based on recommendations for identifying instrumentation threats (in this case, bias), we graphed the naive observer’s data alongside the primary data (Ledford & Wolery, 2013). By graphing both the scores of the primary and secondary observer, we could analyze the graphs to look for systematic deviations in agreement based on the condition. For example, if the observer who was aware of the conditions of the study systematically scored feedback sessions as higher than the naive observer, this could be indicative of an expectancy bias and would be revealed by visually analyzing both primary and secondary observer scores. In addition, this method would allow us to determine if errors in agreement resulted in different interpretations of the teacher’s competency.
Point-by-Point
We calculated point-by-point agreement (Ledford & Lane, 2024) for each behavior across five intervals, for a total of 40 “points” for potential agreement or disagreement. We took the total number of agreements and divided it by the agreements and disagreements (40) and multiplied it by 100 to obtain a percent. The secondary observer collected data for 50% of Sienna’s sessions, 40% of Marshall’s sessions, 36.36% of Connor’s sessions, and 47.02% of Bella’s sessions.
Kappa Coefficient
Given that point-by-point agreement may inflate agreement that occurs due to chance, we calculate Cohen’s kappa reliability coefficient for two observers using the R package “irr” (Gamer et al., 2019). This statistic produces a standardized value between −1 and 1. Cohen suggested that values less than 0 contain no agreement beyond chance, 0.01–0.20 as slight agreement, 0.21–0.40 as fair agreement, 0.41–0.60 as moderate agreement, 0.61–0.80 as substantial agreement, and 0.81–1.00 as nearly perfect agreement (Glen, 2021). We calculated this statistic for each participant in the study and did not weigh certain scores (i.e., NA, Yes, or No) as more valuable than others.
Test-Retest Reliability
To evaluate the reliability of data collection within observers, we recorded three 15 min sessions with Raegan. Both the primary and secondary observers coded these videos and then coded the same videos again 1 month later.
Point-by-Point
We calculated point-by-point agreement between the first scoring and the second scoring 1 month later. We used the same formula described in the interrater reliability section. Note that agreement for this section is agreement of the rater with themselves.
Intraclass Correlation Coefficient
Since we wanted to calculate a statistic for one rater who scored three videos at two different time points, we used the intraclass correlation coefficient (ICC) to measure the consistency of ratings over the two time points. Specifically, we set the model to be one way (one rater), absolute agreement, and to average across the three videos. We calculated this statistic twice, once for each rater.
Tool Acceptability
After completing all data collection, we asked participants to answer questions using a 1–5 rating scale that corresponded to strongly agree (5), agree (4), neutral (3), disagree (2), or strongly disagree (1). Questions asked participants to express opinions about teaching play skills, using research informed practices, how the tool helped improve their performance, and if they would use the tool for providing play feedback to others. The social validity form included an open ended question to describe any lingering comments about the tool or process.
Results
Sensitivity to Change
Figure 1 depicts the results of the multiple probe design used to measure whether RICE-P was sensitive to change after adding performance feedback. At baseline, Marshall (range: 38.71–53.66%) demonstrated moderate play performance levels with some variability, while Sienna (range: 60.00%–75.61%), Bella (range: 41.03%–48.65%), and Connor (range: 58.89%–76.74%) demonstrated moderate play performance levels and stability. Following the introduction of performance feedback, there was a slight increase in the level of performance for all participants, with some overlap for Sienna (33.33% of data points in the performance feedback condition overlap with baseline data). During covert observation, Sienna, Marshall, and Bella demonstrated an immediate decrease in play performance to low response levels. Contrarily, Connor maintained a similar level of response to the performance feedback condition. These data suggest that RICE-P was sensitive to change across participants; more specifically, RICE-P measured the increase in level of play performance for three of the four participants (i.e., Marshall, Connor, and Bella), a gradual increasing trend in play performance during the feedback condition for two of the four participants (i.e., Sienna and Marshall), and a decrease in the play performance levels of Sienna, Marshall, and Bella during the covert observations.
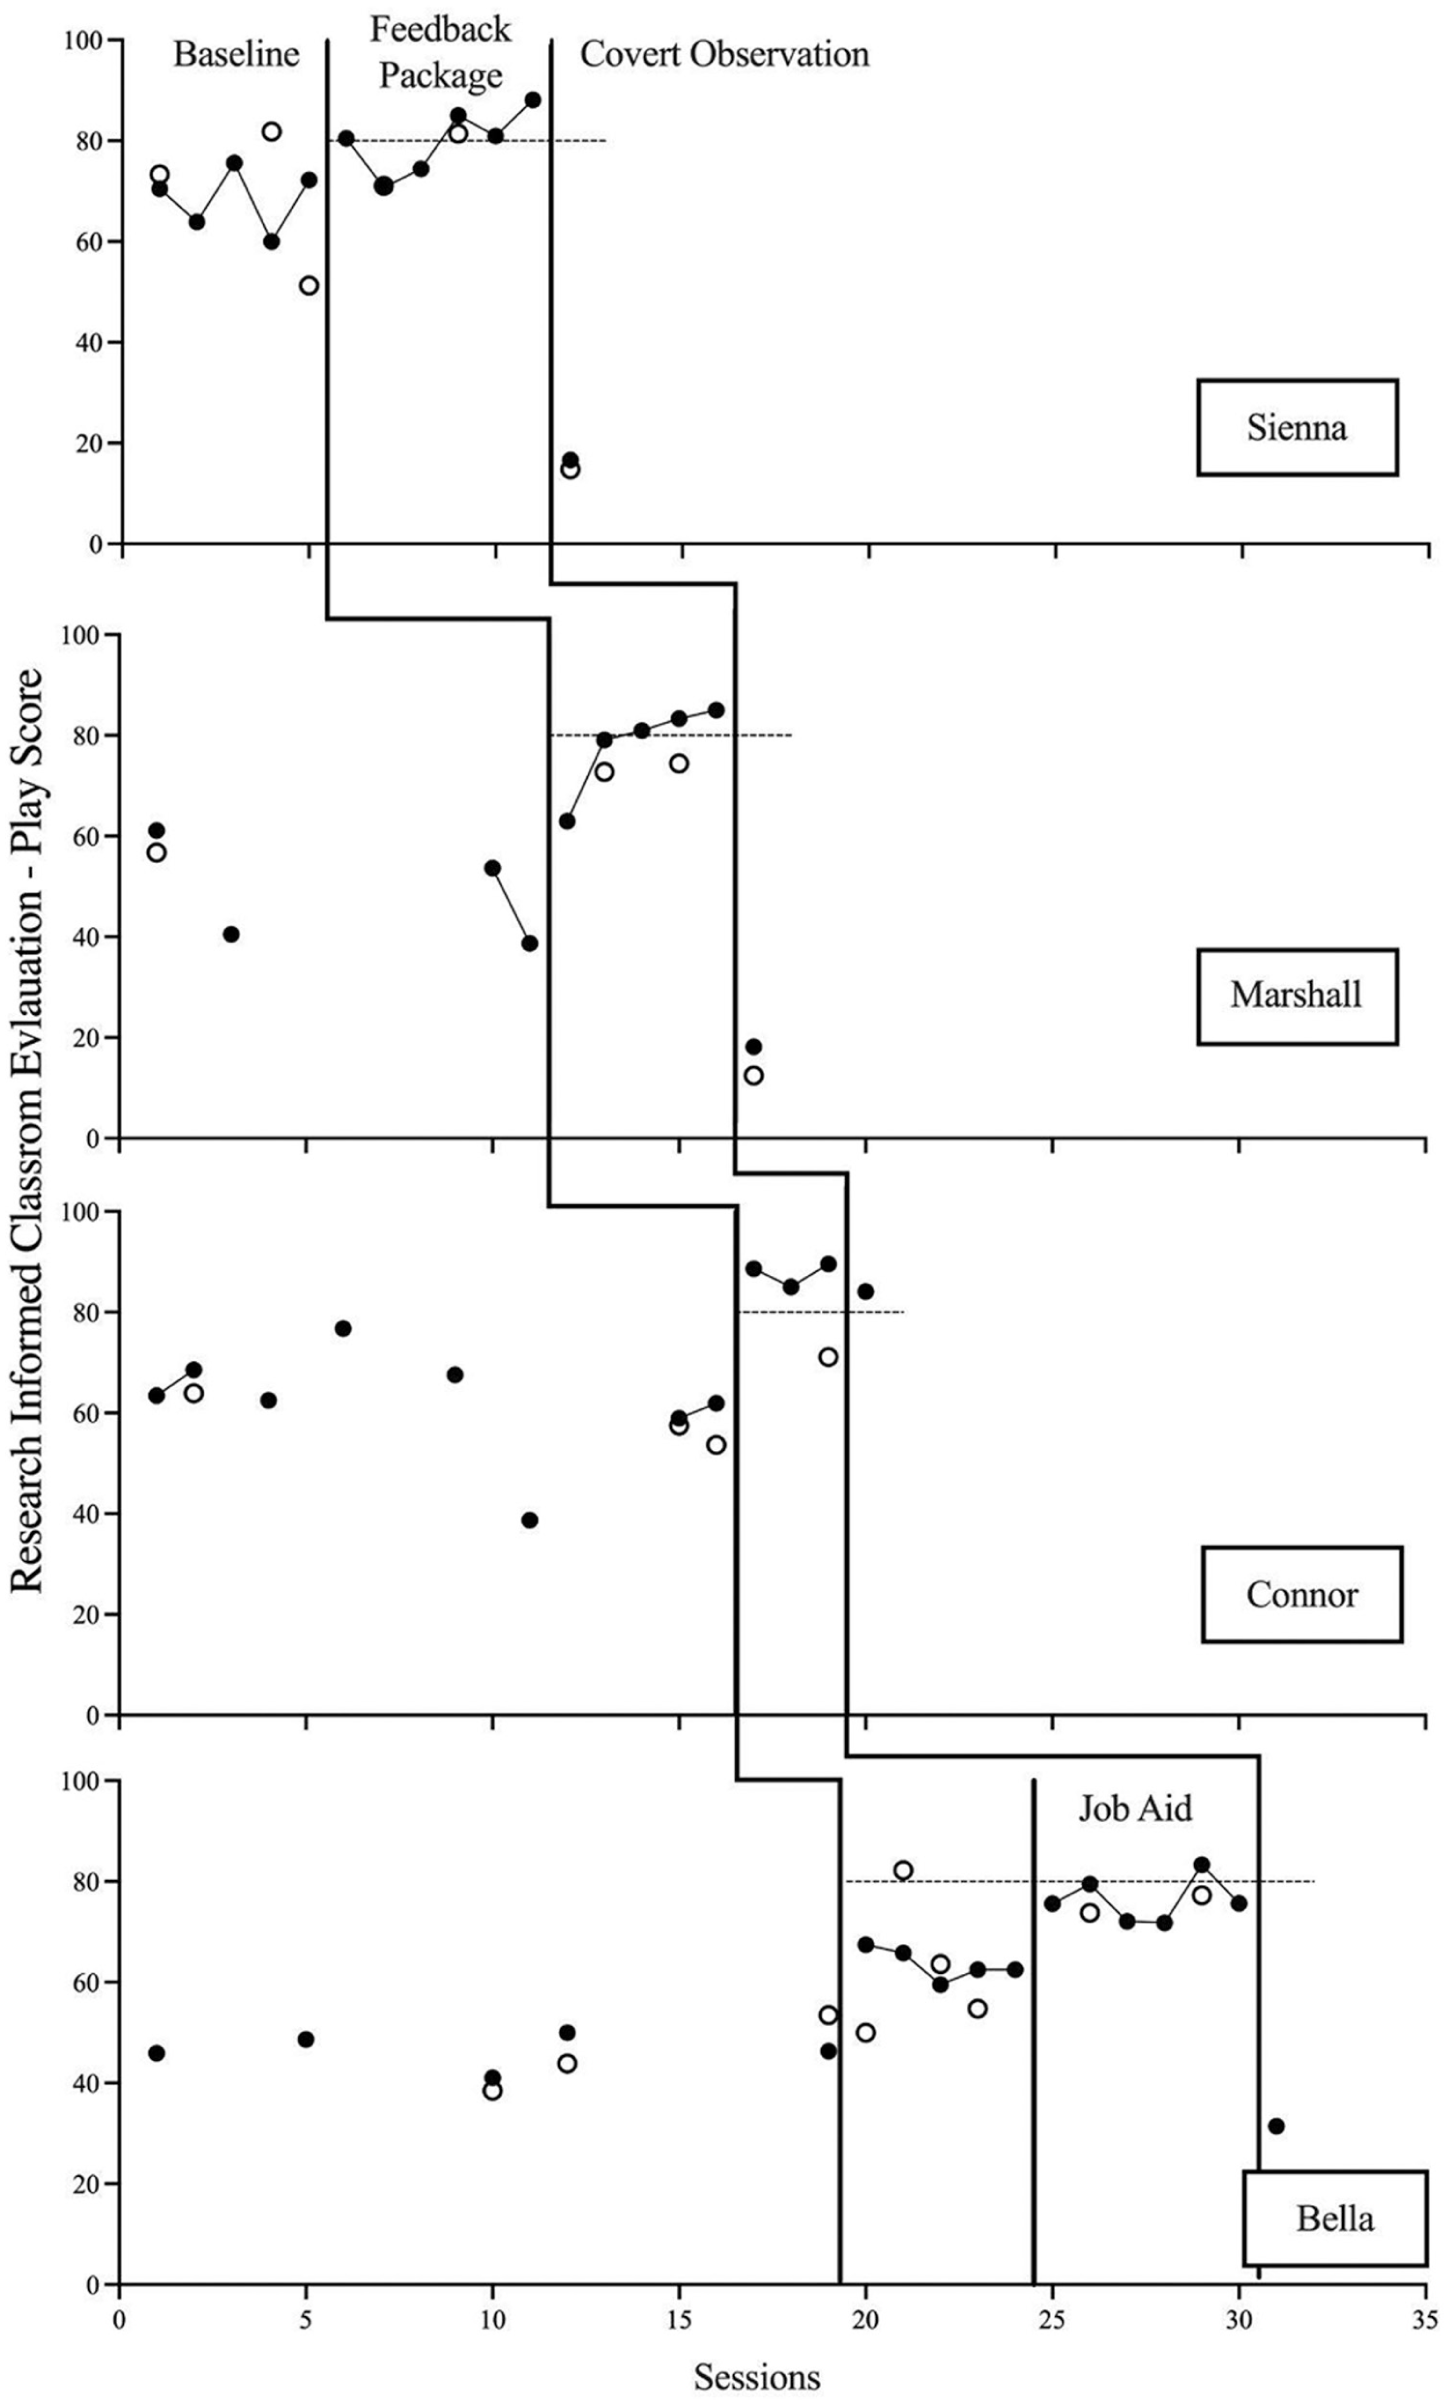
RICE-P scores during feedback evaluation.
Interrater Reliability
Point-by-point agreement averaged 82.22% (range: 64.44%–88.88%) for Sienna, 84.44% (range: 82.22%–88.88%) for Marshall, 85.00% (range: 73.33%–88.88%) for Connor, and 78.55% (range: 66.66%–88.88%) for Bella. Analysis of the secondary observer’s data graphed alongside the primary does not reveal any systematic variation (i.e., bias). Although there were deviations between final scores of the observers, none of these differences seemed to be systematic, thus it is unlikely that these differences were due to expectancy bias. These secondary data are graphed alongside the primary data in Figure 1; thus, readers can look at and determine for themselves if any differences in agreement impacted interpretation. Cohen’s kappa statistic, which considers agreement due to chance, was .575 for Sienna, .545 for Marshall, .744 for Connor, and .627 for Bella. Thus, Sienna and Marshalls’ agreement is considered moderate agreement and Connor and Bella’s agreement is considered substantial agreement.
Test-Retest Reliability
For the primary observer for this study, the test-retest reliability evaluation resulted in an average of 84.44% point-by-point agreement and 0.798 ICC (95% CI [0.717, 0.857]). This ICC value is considered substantial agreement. The secondary observer for this study achieved an average of 86.66% point-by-point agreement and .864 ICC (95% CI [0.81, .903]) across the three videos, which is nearly perfect agreement.
Tool Acceptability
All social validity items and scores are depicted via Supplemental Appendix C. All average scores ranged from 4.25–4.27, suggesting that, on average, interns agreed or strongly agreed with the statements. For the open response question, one intern asked for a copy of the tool. One noted that the feedback meetings were the most motivating part of the study and that any time between scoring and the meeting was aversive. In addition, this same intern noted that it may be helpful for interns to score their own behavior, so they could compare their scores with the observers.
Discussion
We evaluated the technical adequacy of RICE-P by assessing the levels of interrater reliability, test-retest reliability, treatment utility, and social validity and acceptability of the goals and use of RICE-P. When considering treatment utility, our data suggest the tool was sensitive to increases and decreases in play performances across overt and covert observations for all participants. Overall agreement ranged from moderate to substantial when analyzing the interrater and test-retest reliability. Additionally, on average, interns rated highly the importance of the selected goals (i.e., improvement of play practices for teachers and independent play behaviors for students) and their acceptability of feedback using RICE-P.
First, it is important that an observation instrument be sensitive to changes in performance while simultaneously producing consistent and reliable scores in the absence of performance change. Without these features, this instrument would provide no real treatment utility. Visual analysis of the RICE-P data reveals that changes in performance only occurred following procedural changes. Thus, these data suggest that RICE-P results in consistent performance measurement when no environmental changes were made and the ability to detect performance when environmental changes are made. This finding is not surprising, given that the RICE-P tool utilizes a partial interval recording system, a well-established method for estimating the occurrence of operationally defined behaviors (Ledford & Lane, 2024).
Second, we evaluated reliability across two fronts: interrater reliability and test-retest reliability. Our interrater reliability resulted in point-by-point agreement ranging 78.55% to 85.00% across participants, which is extremely close to the 80% standard for interobserver agreement recommendations. These same data produced Cohen’s kappa values ranging .545 to .744 across participants, suggesting moderate to substantial agreement between observers. Test-retest reliability ICC scores were 0.798 and .864 for each observer and correspond to substantial and nearly perfect agreement. Given that no alternative tool exists for measuring teaching behaviors emitted in play, we consider these data to be adequate and endorse the preliminary use of the RICE-P. However, we believe that future research should investigate methods for increasing this agreement.
For example, there may be specific questions that, when worded differently, results in better agreement between observers. Thus, future researchers may consider adapting RICE-P to see if they can obtain better agreement. Relatedly, similar to the findings of Westling et al. (2022), the reliability between observers could be a function of the learning history of the observer (i.e., if they have had experience teaching play skills or experience in special education), illustrating another future research route. One other approach to increasing agreement between observers would be to systematically evaluate how the wording of RICE-P items impacts interobserver agreement. For example, we used the phrasing “appropriate play” in some RICE-P items (e.g., item 3; imitate appropriate play). Given that there are various types of play targeted with this tool (e.g., cooperative, associative, communication in play, toy-based play), the wording of appropriate play could be ambiguous. For example, there are many different “appropriate” ways to play with toys; a child may play with toys as apparently intended (e.g., playing with a puzzle by taking the pieces out and putting them back together), or pretend that the puzzle pieces are something else (e.g., symbolic play).
One method for making that learning history more consistent across the observers would be to focus on better methods for training observers. For example, researchers could provide observers with video examples and non-examples of each behavior prior to scoring to see if this improves reliability. Relatedly, the only prerequisite administrators would need to use this tool is the ability to identify the occurrence or absence of these play behaviors. For administrators who do not have a background in teaching play, they may need to collect data alongside a trained observer in order to calibrate the measurement. This is similar to the method the observers in this study used to calibrate their measures (i.e., observing three of the same sessions and comparing scores). After this, administrators could simply provide post-observation feedback as they would with any other observation of teachers. Future iterations of this study could evaluate the technical adequacy of RICE-P when used by administrators with no background in play practices.
Ideally, administrators using this instrument would observe teachers multiple times, use evidence-based strategies to change teacher performance (e.g., feedback, training, or coaching) and look for changes in teacher performance. Thus, since our intended use for RICE-P was as a tool for administrators to conduct formative measurements of special educators’ performance, we decided to evaluate the tool in a format similar to this. If we validated this study using large groups and single time points (e.g., Westling et al., 2022), it would be unclear if this tool could actually cause and detect changes in special education teachers’ performance. Thus, we elected to use this tool within the formative context of a single case research design. This study is only a preliminary evaluation of the RICE-P and future researchers should continue to validate the instrument on a larger scale.
One interesting aspect of this study is that we conceptualized it to resolve an applied problem within the classroom, classroom interns were not using research informed practices during play. This is an important aspect of this study for several reasons. First, it highlights that training is not the “fix-all” intervention for changing staff behavior and may need additional intervention to maintain post-training outcomes, as has been noted in previous work (McGee & Freds, 2025). For example, classroom staff may need ongoing performance feedback following training. This study also highlights a successful research to practice model, whereby our study addresses a specific classroom limitation reported by the lead teacher.
Limitations and Future Directions
The data collected during this study highlight preliminary technical adequacy of the RICE-P tool, however, there are still multiple areas in which this tool could be improved and further investigated. For example, our social validity questionnaire focused on how acceptable the interns reported it was to receive feedback with the RICE-P. Thus, a next direction would be to measure social validity from the observer, that is, to determine how acceptable raters found the RICE-P to use. Given that the observers in this study were the developers of the tool, asking ourselves to rate the social validity of our own tool would have been inappropriate. Future researchers could investigate this by giving the RICE-P to school administrators, have them use the tool, then ask them to rate their experience with using the tool. In addition, future researchers could assess the value of change in teacher’s performance by having expert and blind observers rate the teacher’s play instruction.
We did not evaluate concurrent validity of RICE-P (i.e., evaluation of overlap between this and established play tools). However, this is not possible since we are unaware of any other tools that measure the construct of research informed play practices. However, this concurrent validity can be inferred from the heavy research emphasis of the tool (See Table 1). For example, Barton et al. (2013) conducted a study evaluating the effects of coaching on preservice teachers’ use of practices that increase play behaviors. Specifically, their dependent variables were using contingent imitation, implementing the system of least prompts, and providing praise and appropriate play response following the child engaging in the play behavior, each of which are included (or would be captured) as target behaviors in the RICE-P. Similarly, the target behaviors in the RICE-P could be compared to established packages (e.g., Naturalistic Developmental Behavioral Interventions; NDBI) for concurrent validity. Many of the key components to NDBI (e.g., manipulation of the three term contingency, use of prompting and prompt fading, natural reinforcement, environmental arrangement; modeling, adult imitation; Schreibman et al., 2015) would likely be captured as a research informed practice with RICE-P.
Similarly, one limitation to our study is our method of selecting research included in the RICE-P. Specifically, we relied on experts’ knowledge of play research, which may not be representative of new literature or literature just outside of the authors knowledge. Future researchers should consider conducting a systematic literature review for selecting target behaviors or conducting a focus group with experts’ from multiple backgrounds and experiences. For example, one recent finding in the play literature is that children with autism may acquire play targets that are developmentally matched before those that are age appropriate (Agana et al., 2024; Pane et al., 2022). Thus, a future iteration of this tool could include selection of play targets based on the Developmental Play Assessment (Lifter, 2000; Lifter et al., 2022).
One limitation to the generalizability of the study is the sample of interns. Three of the four interns included in this study were enrolled in an applied behavior analysis training program. Although these interns were serving as special education teachers during this study, this participant pool may not be representative of special education teachers as a whole. This sample is somewhat representative of certified special education teachers, given we did have an intern who had taught special education in the past, but was now completing his masters in applied behavior analysis and an intern not enrolled in an applied behavior analysis training program. Interestingly, the only intern who was not enrolled in an applied behavior analysis training program was the only intern who required additional modifications following performance feedback to reach the established 80% performance criteria. Lastly, all interns were serving as special education teachers in their classroom placement, thus this sample may better represent uncertified people serving as special education teachers (Peyton et al., 2021).
Lastly, the purpose of this investigation was to establish the technical adequacy of the tool, and thus we did not measure student play behaviors. Although we selected the RICE-P items based on play research for students with developmental disabilities, ensuring that these behaviors, when combined into this package, increase student play and communication should be a critical area of future investigation. First, simply measuring student behavior while the teacher is using these practices and while they are not using these practices (e.g., in an alternating treatments design) may provide an immediate snapshot into improvements. Although students are unlikely to develop complex play repertoires in 15 min, we may see an improvement in prompted responses, which could indicate later acquisition of play and communicative behaviors. However, more longitudinal studies should be conducted to ensure these practices, when used consistently over time, improve student play and communicative behaviors.
Conclusion
While the importance of play skills in early childhood education is continuously underscored as a pivotal way to practice and generalize skills (Lifter et al., 2011), few tools have been validated to accurately and reliably measure the research-informed practices of special education teachers. The data presented in this study support RICE-P as a new observation tool that has proven sensitivity to change and moderate to substantial agreement in interrater and test-retest reliability. Given the limited number of feedback tools specifically designed to pinpoint play practices in special education classroom settings, with further research, RICE-P provides a potential way to increase the quality of play-related feedback, thereby increasing access to research-informed play instruction for students with low incidence disabilities.
Supplemental Material
sj-docx-1-tec-10.1177_02711214261450587 – Supplemental material for Technical Adequacy of the Research Informed Classroom Evaluation: Play Tool for Observing and Evaluating Special Education Teachers’ Play Practices
Supplemental material, sj-docx-1-tec-10.1177_02711214261450587 for Technical Adequacy of the Research Informed Classroom Evaluation: Play Tool for Observing and Evaluating Special Education Teachers’ Play Practices by Tyler-Curtis C. Elliott, Georgette A. Morgan and Kevin M. Ayres in Topics in Early Childhood Special Education
Footnotes
Acknowledgements
We would like to thank Whitney Ward for help with development of the social validity form.
Funding
The authors received no financial support for the research, authorship, and/or publication of this article.
Declaration of Conflicting Interests
The authors declared no potential conflicts of interest with respect to the research, authorship, and/or publication of this article.
Data Availability Statement
Supplemental Material
Notes
References
Supplementary Material
Please find the following supplemental material available below.
For Open Access articles published under a Creative Commons License, all supplemental material carries the same license as the article it is associated with.
For non-Open Access articles published, all supplemental material carries a non-exclusive license, and permission requests for re-use of supplemental material or any part of supplemental material shall be sent directly to the copyright owner as specified in the copyright notice associated with the article.