
Abstract
Intra-vital visualization of deep cerebrovascular structures and blood flow in the aging brain has been a difficult challenge in the field of neurovascular research, especially when considering the key role played by the cerebrovasculature in the pathogenesis of both vascular cognitive impairment and dementia (VCID) and Alzheimer’s disease (AD). Traditional imaging methods face difficulties with the thicker skull of older brains, making high-resolution imaging and cerebral blood flow (CBF) assessment challenging. However, functional ultrasound (fUS) imaging, an emerging non-invasive technique, provides real-time CBF insights with notable spatial-temporal resolution. This study introduces an enhanced longitudinal fUS method for aging brains. Using elderly (24-month C57BL/6) mice, we detail replacing the skull with a polymethylpentene window for consistent fUS imaging over extended periods. Ultrasound localization mapping (ULM), involving the injection of a microbubble (<<10 μm) suspension allows for recording of high-resolution microvascular vessels and flows. ULM relies on the localization and tracking of single circulating microbubbles in the blood flow. A FIJI-based analysis interprets these high-quality ULM visuals. Testing on older mouse brains, our method successfully unveils intricate vascular specifics even in-depth, showcasing its utility for longitudinal studies that require ongoing evaluations of CBF and vascular aspects in aging-focused research.
Introduction
The brain comprises an intricate web of neurons and vasculature, and due to its unique complexity and pivotal role in determining overall health, it remains a focus of extensive research.1,2 As organisms age, one of the greatest challenges in neuroscience research is the intra-vital visualization of deep vasculature in aging brains. These deeply embedded vessels play a vital role in many physiological and pathological processes but are often difficult to visualize and study in vivo. The importance of understanding and visualizing these deep structures increases when investigating neurodegenerative diseases, particularly vascular cognitive impairment, and dementia (VCID) 3 and Alzheimer’s disease (AD).4 –7 VCID is associated with cerebrovascular pathologies and functional impairment of the cerebral microcirculation, including small vessel disease, cerebral blood flow (CBF) dysregulation, blood-brain barrier (BBB) disruption, cerebral microhemorrhages and cerebral infarcts.8 –23 Proper vascularization and functional integrity of cerebral vessels are indispensable for maintaining brain health. In the early stages of neurodegenerative disorders (including AD), diminished CBF and BBB dysfunction significantly contribute to disease pathogenesis, suggesting a common vascular-centric pathway underscoring neurodegeneration across diverse disorders. 24
While the importance of studying cerebrovasculature is evident, the tools at our disposal often fall short. A significant impediment is the increased thickness of the skull in aged rodents. This thickening, a natural part of the aging process, poses a challenging barrier to many imaging techniques. 25 Thinned-skull preparations have been shown to partially resolve this, but still lead to less detailed or obscured images. 25 This constraint hampers the ability to gain a clear, comprehensive view of the cortex or other deeper brain vascular structures. In this study we developed a method for longitudinal ultrasound localization microscopy (ULM) brain imaging in aged 24-month-old mice by surgically installing a plastic window. This paper presents a novel methodology for cerebrovascular imaging in aged mice, addressing the challenge of variable skull thickness and enabling long-term monitoring in the same animal. The methodology we devised facilitated precise analysis and interpretation of the data derived from microbubble trajectories, and effectively enables the measurement of the relationship among vascular density, velocity, and caliber. This approach allowed for the accurate computation of CBF within various brain compartments, including the cortex and hippocampus, and also provided the means to analyze directional flow, thereby assessing the arteriolar to venular ratio in the mouse brain cortex. We also demonstrated robust longitudinal ULM brain imaging on the same animals with high repeatability over 9 weeks. This significant methodological advancement will be of great benefit for researchers evaluating vascular alterations in preclinical models of accelerated aging, and in examining interventions targeted at vascular protection to mitigate or delay the progression of age-related VCID.
Functional ultrasound (fUS) imaging
The recent introduction of Functional Ultrasound (fUS) Imaging has emerged as a technique that detects changes of cerebral blood volume triggered by brain activation.26 –29 fUS, while still in its nascent stages, provides a novel approach to cerebral imaging, expanding the repertoire of non-invasive tools available for in vivo brain studies. fUS operates on the principle of capturing real-time cerebral blood volume (CBV) dynamics, ensuring detailed, in-the-moment data acquisition. Traditional modalities such as two photon microscopy, fMRI, and others, while advanced, are often faced with important tradeoffs as far as costs and limitation to the field of view imposed by the physical constraints of the technique. A distinguishing feature of fUS is its non-invasive nature, thus circumventing the challenges posed by more invasive imaging modalities and reducing potential risks to subjects. This feature is particularly crucial, especially in longitudinal studies where repeated measurements are typically required, while subjecting animals to recurrent surgeries can often be detrimental. One of the main benefits of fUS lies in its capability to provide high spatial resolution. 30 The granularity of images obtained ensures that even subtle alterations in vascular patterns—often overlooked in other imaging modalities—are readily discernible. Concurrently, the combined spatiotemporal resolution offered by fUS stands unparalleled, ensuring reliable capture of CBF dynamics, critical to understanding various neural processes such as neurovascular coupling (NVC). Suggesting that such rapid and sensitive measurements are well suited for studying transient cerebral events and mapping rapid changes in cerebral blood flow.31 –36 Moreover, the capacity of fUS to provide real-time monitoring of CBV is not merely about capturing transient events; it promises more nuanced insights into the functional aspects of the cerebrovasculature. Such real-time data can elucidate physiological baselines and detect aberrations, potentially offering early indicators of cerebrovascular anomalies. The emergence of fUS marks a significant milestone in neurovascular research methodologies. Its non-invasive nature, coupled with superior spatial and temporal resolutions, establishes fUS as a fundamental tool for forthcoming cerebral investigations.
Ultrasound localization microscopy
ULM emerged as a technique in 2015 37 to map super-resolved vasculature by intercepting intravenously injected microbubbles (MBs) in the bloodstream. Initial efforts saw MBs in rat brain cortex identified through rapid decorrelation across a large image stack, acquired continuously. Utilizing ultrafast frame rates achieved by emitting plane waves and collecting backscattered echoes, along with spatiotemporal filtering, ULM allows the detection and differentiation of individual MBs from slow-moving tissue signals. This innovation in ultrafast imaging not only enables enhanced MBs detection but also allowed tracking of microbubble motion, enabling detailed microvascular imaging within a reasonable time, marking a significant stride in the evolution of preclinical and clinical imaging modalities. By localizing and tracking millions of MBs flowing in the blood circulation ULM has overcome the conventional diffraction limit with two orders of magnitude 35 resulting in its wide adoption as an imaging technique both clinically38 –40 and preclinically.41 –43
Materials and methods
The conduct of this study was in strict accordance with the principles outlined in the ‘Guide for the Care and Use of Laboratory Animals’ published by the National Institutes of Health. For our experiments C57/BL6 male mice were utilized from C57BL/6 mice purchased from Charles River Laboratories (Wilmington, MA). Animals had ad libitum food (standard rodent chow) and water access in 12–12 hours of light-dark cycle. The animals were housed under specific pathogen free conditions until the cranial window surgery in the Rodent Barrier Facility at University of Oklahoma Health Sciences Center (OUHSC), then they have been transferred to the conventional animal facility of the OUHSC and single housed after surgery. The University of Oklahoma Health Sciences Center (OUHSC) Institutional Animal Care and Use Committee (IACUC) committee approved the experimental protocols including consideration on animal welfare and administered drug side effects. All experimentation complied with the ARRIVE guidelines (Animal Research: Reporting in Vivo Experiments) for how to report animal experiments.
Skull thinning, removal, and window implantation
Mice serve as a foundational model in neurovascular research due to their genetic malleability and physiological similarities with humans. 24-month-old C57BL/6 male mice were utilized due to their well-documented neuroanatomical features and extensive use in prior neuroscientific research. This age was chosen since it represents advanced age in mice, thereby allowing for investigations pertinent to aging processes in the cerebrovasculature. The procedure for skull removal was executed under aseptic conditions to minimize the risk of post-operative infections. Mice were anesthetized using isoflurane 3% and continue on 2% (ISOTHESIA, Henry Schein Animal Health, OH, USA) gas via inhalation with Surgivet Classic T3 vaporizer (Smiths Medical, Minneapolis, MN, USA) with 1–2 L/min flow rate and their depth of anesthesia was monitored throughout the procedure. The head of the mouse was fixed in the stereotaxic frame (51625 W, Stoelting Co, Wood Dale, IL, USA) through ear and nose bars. The frame was equipped with a heating pad (RT-0501, Kent Scientific Corporation, Torrington, CT, USA) to insure thermal homeostasis during the procedure. Both eyes were covered with eye ointment (NDC 75570 122 35, Delsam Pharma Lic, Bronx, NY, US) to avoid the ocular dehydration during the surgery and the head was covered by hair removal lotion (Nair hair removal body cream, Aloe). After the removal of the hair the skin was disinfected with 70% ethanol and, upon ensuring proper anesthesia, the scalp was carefully incised along the medial axis, extending from just above the eyes to the base of the skull, and then gently retracted to reveal the underlying skull. The periosteum was removed in the exposed area with a blade. The skull was then dried with a cotton swab (6-inch, Puritan Medical Products, Guilford, ME, USA) and the surface cleaned with compressed air (iDuster Compressed Canned Air for Electronics, Amazon). A high-speed microdrill (MicroMotor Technician-handle – 35 K RPM Polisher Micro Motor Polishing Hand Tool, 110 V, Amazon) was then utilized to thin the skull over the desired region (6 mm anterior-posterior and 8 mm medial-lateral cranial window), taking utmost care to prevent damage to the underlying dura mater. In the thinned skull experiments, the entire region was thinned until the underlying vasculature was clearly visible. For window implantation, only the region’s perimeter was thinned. Subsequently, a precise section of the skull was delicately lifted and removed using fine forceps, exposing the brain’s surface. Extreme care was taken to delicately remove the skull plate while preserving the integrity of the larger vessels and superior sagittal sinus. To address any minor bleeding resulting from superficial injuries, cold Hemosponge pieces (Dengenfoam, Dengen Healthcare Pvt. Ltd, India) were carefully applied as needed. In this study, careful measures were taken to maintain the integrity of key anatomical structures, specifically the dura mater and the transverse and sagittal sinuses, in the experimental mice. This was crucial to minimize the risk of inadvertent remodeling, inflammatory reactions, and excessive bleeding during the procedure. (Supplementary Figure 1). Throughout this procedure, ice-sold sterile saline was intermittently applied to reduce bleeding and swelling, prevent thermal damage, and maintain tissue integrity.
Implantation of the chronic polymethylpentene plastic window
Following the skull removal, the next crucial step involved the implantation of a chronic window to facilitate subsequent imaging sessions. For this purpose, an ethanol-sterilized 4 mm long, 8 mm wide polymethylpentene plastic window, commercially known as TPX™ (film, thickness 0.125 mm, Mitsui Chemicals), was chosen. This material was selected based on its optical clarity and compatibility with fUS imaging techniques. The window was meticulously sized to fit the craniectomy site and curved using a heated element to mimic the skull curvature. The window was sterilized in 70% ethanol for 10 minutes before being placed in contact with the brain. Using biocompatible adhesive (Super Glue by Starbond GAP FILLER, Amazon) and sutures (Chromic 5-0 C6 18 5/0 Chromic Gut Suture, Reliable Dental Supply, Fort Worth, TX, USA) the TPX™ window was secured in place, ensuring a snug fit without exerting undue pressure on the underlying tissue. The perimeter was sealed with the same adhesive to prevent potential contaminants and ensure the window’s stability for subsequent imaging sessions. The animals were then allowed to recover while being monitored. The postoperative care routine for each animal included the administration of Buprenorphine extended release (1 mg/kg, ZooPharm, WY, USA) immediately after the surgery and Baytril 2.27% (10 mg/kg, Elanco Animal Health, IN, USA) once a day for 4 days, including the surgery day.
Functional ultrasound imaging
Two weeks after the surgical operation the animal was lightly anesthetized (1–1.5% isoflurane), intubated and placed on a thermoregulated stereotactic frame (51625 W, Stoelting Co, Wood Dale, IL, USA) and attached to a ventilator SomnoSuite®Low-Flow Anesthesia System (Kent Scientific Corporation, Torrington, CT, USA) to control for changes in respiratory patterns that may lead to hemodynamic variability. The head of the mouse was shaved using a shaving cream (Nair hair removal body cream, Aloe) and cleaned with ethanol. The ultrasonic probe (IcoPrime-4D MultiArray 15 MHz, ICONEUS, France) of the Iconeus One functional ultrasound device (ICONEUS, France) was then positioned exactly above the cranial window and immerged in ultrasound gel (Gel de contact, 10904, Drexco Medical, Crosne, France). Each imaging session lasted 1.5–2 hours. Subsequently, the animal was closely observed until it fully emerged from anesthesia, ensuring the absence of any abnormal behavior or signs of discomfort.
Microbubble suspension injection
Ultrasound Localization Microscopy (ULM), also referred to as Super-resolution Ultrasound Localization Microscopy hinges on the pinpointing and monitoring of individual microbubbles (MBs) that are intravenously injected in the imaged animal. In this study we injected 50 µl of sterile MBs suspension (DEFINITY, Lantheus, Billerica, MA, USA) to obtain high-definition images of the overlayed trajectories of each microbubble in a 500 µm thick coronal brain volume. Before performing the retro-orbital injection, DEFINITY MBs need to be activated by vigorous agitation for 45 seconds until the clear solution becomes milky. This MB technique, coupled with the clear TPX window and 2 weeks of healing time allowed for reliable capture of high-resolution (2 µm/pixel) imaging from surface to the base of the brain (Figure 1).

Functional ultrasound system imaging with TPX cranial window. (a) fUS setup for longitudinal, in vivo brain vascular imaging. Cranial windows were upgraded to TPX for better conduction of ultrasound waves. (b) The illustration shows the specific location from which the 500 μm thick section was imaged, as referenced in the ABA. (c) Comparison of acute post-surgical imaging outcomes with thinned skull (top left) and TPX cranial windows (top right). Longitudinal imaging (bottom) is possible through the chronic TPX cranial window several weeks later. Image quality was improved with the TPX upgrade. Scale bar: 1000 μm.
Ultrafast ultrasound imaging for ULM
Acquisitions were performed on an Iconeus One ultrasound imaging system (Iconeus One – 256 channels, ICONEUS, France), equipped with a 15-MHz MultiArray tranducer (IcoPrime-4D MultiArray, ICONEUS, France). Successive raw ultrasound images were collected for 10 min at 1000 Hz, each corresponding to the coherent sum of 8 different transmission angles [−12°, −8.57°, −5.14°, −1.71°, 1.71°, 5.14°, 8.57°, 12°] ° at a 8,000 Hz Pulse Repetition Frequency. A bolus of MB was injected at the beginning of each recording, which lasted 10 minutes.
Image generation
Utilizing the “Compute SuperLoc” software, integrated into the Iconeus One fUS imager (Iconeus, France), we generated a maximum projection encompassing all tracked trajectories of microbubbles (MBs) within a single coronal brain section. This projection covered the entire 10-minute recording period following the injection of MBs. Subsequently, using the provided “Display SuperLoc” software, we extracted essential data components, including an MB intensity map (Figure 1), a microbubble speed map (Figure 3), and a microbubble direction map (Figure 5). These raw data outputs served as the initial foundation for our developed analysis method, which was employed to derive cerebrovascular physiological endpoints.
Image analysis
Vascular density measurement
All image processing and analysis was done using FIJI ImageJ v. 1.52p software (Wayne Rasband, National Institutes of Health, USA) open-source software package, 44 except the RGB velocity image hexagonal to grayscale conversion, which has been assessed with MatLab R2023a version. Exported high resolution ULM recordings were processed first (Figure 1(b)). Images were collected from every measurement into a stack and the Weka Trainable Segmentator, a supervised machine learning algorithm in ImageJ, was used for batch segmentation to generate binary vascular masks (Figure 2(b)). Next, cortical area maps from the Allen Brain Atlas (ABA) were aligned with the binary image and used to crop the cerebral cortical and hippocampal areas from both sides of the brain (Figure 2(c)). We used the same cortical and hippocampal masks for every brain image to avoid ROI size comparison related calculation errors. As a last step the total vascular area density was assessed using binary images from the cortical and hippocampal areas as a 2D representation of the 3D volume of interest (VOI). Then the binary masks were used for the “Skeletonization” algorithm which repeatably removes pixels from the edges of objects in a binary image until they are reduced to single pixel wide skeletons. To examine vascular branching complexity as a proxy measure of vascular density with “Analyze Skeleton” function. As a last measurement, binary vascular masks were used to determine vascular diameter distribution, using the “Local Thickness” function in ImageJ, 45 which computes the local thickness at each p point by scanning the distance ridge to find the “largest” q that p “owns” and generated histograms were scale aligned and averaged in every bin of the curve for comparison (Figure 2(d)). ULM measurements of density and diameter distribution were compared and verified with TPM images recorded in the same depth of the cortex of the same subject.

Longitudinal density measurement of the brain vasculature with ULM. (a) High resolution functional ultrasound MBs image of the mouse brain vasculature. The MBs density-based intensity color map was exported from the ICONEUS image viewer and Continued.converted to a binary mask (panel b) using a supervised machine learning algorithm for the segmentation. (c) Binary masks were manually aligned with mouse ABA, then meningeal and surface vessels were excluded to focus on the brain microvasculature in cortical and hippocampal areas. d) Cortical and Hippocampal areas underwent image processing, and the use of the brain atlas ensures that the same areas were selected for further processing and analysis from every analyzed brain. Both right and left areas were assessed and separately analyzed. Binary masks went through skeletonization and local vascular thickness was measured. Scale: 1000 μm. (e–j) Vascular density measures show improved accuracy of ULM images after a few weeks post-surgery. Vascular density (e), Vascular length (f), Numbers of vascular branches (g) and junctions (h) show improvement in the visibility of the vasculature. Vascular thickness distribution was changed over time in both cortex (i), and hippocampus (j), but it also highly depends on the alignment accuracy of the spatial location between the different time points. (n = 4 (after surgery, 2 week) or 2 (9 week), *p < 0.05, **p < 0.01, ***p < 0.001). CX: cortex, HIPP: hippocampus.
Determination of cerebral blood flow from vascular velocity
ULM speed maps were exported in high resolution. The resulting images were scaled on an RGB color map from dark blue (lowest speed) to red (highest speed) on a scale of 0–100 mm/s, with minimalization of the numbers of saturated pixels (Figure 3(a)). RGB velocity images hexagonal codes were translated to grayscale values by a custom-made Matlab code (Supplementary Material 1), then this grayscale value given for every pixel has constructed a linear scale speed image in 8-bit, where every pixel intensity referred to the actual speed (mm/s) (Figure 3(b)). The whole brain average speed was measured, then we applied the same cortical and hippocampal area selection as described above to separately measure speed in the different brain regions and correlate speed with vascular density measurements. The vascular flow rate (Q) was determined using formula (i) on the skeletonized images to exclude multiplication of the information by including multiple pixels from same vessel level. This calculation utilized previously measured values for velocity and diameter, operating under the assumption of a Poiseuille flow as previously reported:
46


Longitudinal assessment of cortical and hippocampal blood flow with (b) Pseudo colored speed maps were aligned with Allen Brain Atlas. RGB hexagonal color code of original images generated by the ICONEUS software has been used to calculate blood speed in every pixel of the original image, which resulted in a grayscale image where the pixel intensity reflects on the blood speed. Continued.(c) Assessment of cortical and hippocampal vascular flow. Speed maps of cortex and hippocampus were measured and correlated with local thickness maps of the vasculature. Scale: 1000 μm. (d) Combination of “Local Thickness” and “Skeletonization” functions to correlate vascular diameter and blood speed measured by fUS. Scale: 1000 μm. Blood speed distribution was analyzed in whole brain (e), cortex (f), and hippocampus (g) longitudinally. Average blood velocity in cerebral vessels (h) was comparable in different brain areas based on the measured vessel density in time. (i) Cortical blood speed was correlated with vessel diameter. Bubble plot shows the amount of pixels (count) matching with the given vascular thickness and blood speed. (J) Vascular flow rate (Q) was calculated based on the blood speed and was positively correlated with vascular diameter. Note the slope of the correlation between flow and diameter is between 2–3 which underscores the validity of this approach. Data shown in mean ± SD (H), or All data points (i–j), or fitted curve (e–g) (n = 4 (after surgery,) or 2 (9 week), *p < 0.05, **p < 0.01, ***p < 0.001).
Depth measurements
Cortical depth measurements were applied on the total area of the selected cortical region with rectangular selection tool, by adding separate ROIs and consecutively measuring them on every image with “Plot Profile” function in ImageJ in both vascular thickness and blood velocity maps. These measurements were executed by using a rectangular selection tool with the same width on those areas that are parallel to the surface, eliminating the bias arisen from the curvature of the brain surface. Average vascular diameter and blood speed were plotted against the depth from the top of the brain tissue (excluding meningeal vessels) starting from penetrating vessels (Figure 4).

Longitudinal assessment of in-depth vascular diameter and blood speed of the mouse cortex. (a) Representative local thickness images pseudocolored to reflect cortical vascular diameter at different time points. The diameter scale is visible in the lower right corner, image scale is 1000 μm. (b) Representative intensity maps pseudocolored to reflect cortical blood speed in the vasculature at different time points. The speed scale is visible in the lower right corner. (c) Quantification of the average brain vascular diameter starting from upper penetrating vessels (meningeal vessels excluded) and proceeding into the deep cortical vasculature (approximately 500 μm depth), at different time points. (d) Quantification of the average blood speed starting from upper penetrating vessels (meningeal vessels excluded) until deep cortical vasculature (approximately 500 μm depth) at different time points (n = 6 in each group, *p < 0.05, **p < 0.01, ***p < 0.001).
Measurement of arteries and veins in the cerebral cortex
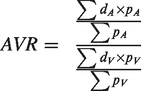
For separate assessment of the arteries and veins in the mouse brain cortex, we used ULM axial directionality map exports. Directionality maps have been adjusted to show “y” axis flow orientations: flow to “0” is red, flow from “0” to infinity is blue (Figure 5(a) and (c)). In the following, RGB directionality maps went through a color channel split, and only red (arterial) and blue (venular) channels were kept for further analysis. These were binarized into masks of the arteries and veins and were paired with the matching vascular density and blood speed images (Figure 5(b)). Image pairs underwent subtraction analysis using the “Image Calculator” tool in ImageJ, to generate separate vascular density and velocity maps of the arteries and veins in the cerebral cortex (Figure 5(d) and (e)). The total vascular density ratio between arteries and veins was measured by comparing the number of pixels belonging to arteries and veins in the cortex as a % of the total vasculature (arteries and veins together). The arteriovenous ratio has been calculated by taking the local thickness/vessel diameter histogram of both arteriole and venule images from the same VOI, then taken the ratio of the pixel number normalized diameter distribution in every given diameter sizes. We used the following formula:

Comparison of arterial and venular vessels of the cortex. (a) Representative high-resolution axial directionality map of the ULM images. Scale bar: 1000 μm. (b) High resolution ULM velocity pseudo color map reflects the directionality of blood flow in vessels. (c) Processing of the cortical vessels based on directionality. Arterial vessels were identified based on inward blood flow and Continued.venular vessels were identified based on outward blood flow. Connecting horizontal vasculature was excluded to reduce analysis artefacts. (d) Vascular thickness of the arterioles and venules. Diameter scale is visible in lower right corner. (e) Pseudo-color blood speed intensity map of the arterioles and venules. Speed scale is visible in the lower right corner. (f) Vascular density ratio of arterioles and venules of the VOI. (g) Vascular diameter distribution of arterioles and venules of the VOI. (h) Histogram of blood speed distribution of arterioles and venules of the mouse brain cortex. (i) Quantification of the average brain arteriolar and venular diameter starting from upper penetrating vessels (meningeal vessels excluded) until deep cortical vasculature in approximately 500 μm depth. (j) Quantification of the average arteriolar and venular blood speed starting from upper penetrating vessels (meningeal vessels excluded) until deep cortical vasculature in approximately 500 μm depth (n = 6 in each group, *p < 0.05, **p < 0.01, ***p < 0.001).
Intravital two-photon microscopy (TPM)
We employed multiphoton microscopy following the methodology outlined in our previous study (Nyúl-Tóth et al. 2021). 47 Briefly, mice have been anesthetized by isoflurane and fixed into a stereotaxic frame. Then the setup was moved under a LEICA Stellaris DIVE multiphoton microscope, equipped with tunable laser and spectral detectors. Emitted light (λ820 nm) was detected by HyD detectors using two filter ranges (λ420–460 nm, λ495–540 nm). Animals were injected with 500 kDa FITC-dextran (Millipore Sigma) to visualize the vasculature in an about 500 μm × 500 μm ROI, in about 250 μm depth with 1 μm step size. Images have been analyzed with the same methods as the ULM images (Supplementary Figure 2–3) for vascular density and diameter determination. For the assessment of blood velocity, we used the line-scan mode of the TPM in the middle of the vessels, and the resulting kymographs were processed with 1D Fourier transformation after subtracting the time-averaged background using a previously published MATLAB macro described by Kim et al. 48
Validation on aged mouse brain
It is essential to validate these imaging and analysis methodologies to ensure physiological accuracy in the assessment of vascular parameters. One significant validation measure was the computation of the Murray’s Law exponent, which demonstrated a compelling concordance with established physiological principles regarding vascular bifurcation and diameter relations. Significantly, our data demonstrate a positive correlation between flow rate and vessel radius, consistent with the theoretical anticipations and experimental validations of vascular tree scaling laws, also referred to as the generalized extension of Murray’s law as calculated and reported by others,46,49 which approximate that networks transitioning between diffusion and laminar flow are anticipated to exhibit characteristic exponents ranging between ∼2 and 3. 50 In our results, the best-fit equation, adhering to a power law, yields an exponent of 2.0199 (r2 = 0.67). This not only underscores the physiological accuracy of our vascular diameter assessments but also substantiates the precision of our imaging through the TPX window even at significant imaging depths. Furthermore, the exploration of a novel arteriolar to venular ratio (AVR) in the mouse cortex presents an intriguing avenue for physiological validation. This new ratio could potentially illuminate the nuanced hemodynamic relationships within the cortical vasculature, thereby attesting to the efficacy of our image analysis methods in discerning intricate vascular details.
We also compared and validated the ULM accuracy with intravital two-photon microscopy (Supplementary Figure 2–4). The same animals have been measured with fUS and TPM, recording multiple areas per animal with TPM. Images have been adjusted to similar focal planes and analysis has been made size matched VOIs. There was no significant difference between the ULM and TPM images in vascular density and vessel thickness distribution. Both Weka segmentation of grayscale images to binary and the Local thickness determination accuracy were verified with “full width at half maximum” calculation (Supplementary Figure 3) on both TPM and ULM images. Vascular speed measurement by fUS was also validated by TPM imaging assessing similar size microvessels. Vascular speed values of microvessels in the diameter range 8–12 μm measured by TPM were within the measured range of the fUS measurements from the mouse brain cortex (Supplementary Figure 4). Through these validation measures, a compelling case for the physiological veracity of our methodologies is articulated, establishing a solid foundation for their application in comprehensive cerebrovascular investigations.
Statistical analysis
Statistical analysis was performed using GraphPad Prism 10 software (La Jolla, CA, USA). Various tests were employed to assess temporal changes, including two-way analysis of variance (ANOVA), two-tailed t-tests, and paired t-tests. All data were subject to tests for normality to assess data distribution. The Shapiro-Wilk Test and the Kolmogorov-Smirnov Test were employed for smaller and larger sample sizes, respectively, providing a comprehensive analysis of the data’s adherence to a normal distribution. For multiple pairwise comparisons, the Fisher LSD method was utilized, or its non-parametric counterparts, such as the Wilcoxon test, Mann-Whitney test, and Friedman test with Dunn post hoc analysis. It’s worth noting that pairwise comparisons were conducted on the original data rather than on the fitted curves for the histograms. To explore simple correlations between radius and flow rate, Pearson product-moment correlation coefficient analysis was employed. Statistical significance was defined as p < 0.05. All plots depict either all data points ± SD or a fitted curve, serving as a visual representation of the distribution histograms.
Results
The imaging protocol and setup developed for this study was designed to improve the reliability and consistency of intravital longitudinal brain vascular imaging (Figure 1(a)). As an upgrade to our previously published thinned skull and glass optical windows,4,12,51 we here used a TPX cranial window to better conduct ultrasound waves. To visualize the vascular networks within both the cortical and hippocampal regions, we conducted imaging on a 500 μm-thick section encompassing the depicted area (Figure 1(b)). A comparative analysis between thinned skull and TPX cranial windows showcased a notable improvement in image quality and read depth, confirming the effectiveness of the TPX upgrade for longitudinal imaging (Figure 1(c)). Up to 9 weeks post-implantation (the longest timepoint evaluated), the TPX cranial window facilitated clear imaging, underscoring its potential for long-term studies. The enhanced image clarity through the TPX window was evident as signal was detectable through the whole brain section, marking a significant stride towards reliable longitudinal imaging.
We next used these enhanced images to perform a comprehensive evaluation of vascular attributes such as density, length, branching, and thickness in the cortex and hippocampus (Figure 2). A representative image for the whole brain vascular ULM images is shown in Figure 2(a). Panel b showcases the binarized version of this image, while panels 2 C and 2D highlight the selection of different anatomical regions utilizing the Allen Brain Atlas (ABA). Notably, the graphs in Figure 2(e) to (j) show the measured improvement in vascular signal over the recovery time of the animal after surgery, demonstrating the potential of this method in tracking vascular changes longitudinally. These provide a compelling premise for utilizing fUS in long-term studies aimed at understanding treatment effects on the cerebrovasculature or comparing groups cross-sectionally.
We next utilized MB for ULM imaging to study CBF (Figure 3). This approach can be leveraged to develop a dynamic measurement of CBF in multiple brain regions. Panel A shows a representative fUS MB speed image of the whole mouse brain, while panel B displays the calculated grayscale image (in false color) in which intensity of every pixel. Panel c and d show how the different anatomic regions were selected for the separate assessment of cortical and hippocampal vascular flow. Skeletonized speed maps of cortex were measured and correlated with local thickness maps of the vasculature. Blood speed distribution was analyzed in whole brain (e), cortex (f), and hippocampus (g) longitudinally. Average blood velocity in cerebral vessels (h) was comparable in different brain areas based on the measured vessel density in time. Notably, panels i and j exhibit a positive correlation between flow rate and vessel radius, validating the analytical approach as the best fit equation to a power law provides an exponent of 2.0199 (r2 = 0.67), which is consistent with theoretical predictions and experimental validations of scaling laws in vascular trees, also known as the generalized extension of Murray’s law, as reported previously.46,49 In general, networks intermediate between diffusion and laminar flow are expected to have characteristic exponents between 2 and 3, at least approximately. 50 This validates the ability of fUS to accurately map blood velocity as a function of vascular size, paving the way for deeper explorations into how cerebral hemodynamics is altered under various vascular and neurological conditions.
Additional analysis of vascular diameter and flow as a function of tissue depth showed that vascular structures and hemodynamics change over time (Figure 4). Panel a shows representative local thickness images pseudocolored to reflect cortical vascular diameter at different time points. Panel b displays representative intensity maps pseudocolored to reflect cortical blood speed in the vasculature at different time points. By examining the upper penetrating vessels in conjunction with the deeper cortical vasculature, a nuanced comprehension of the vascular alterations across the brain can be attained over a depth of approximately 500 μm. This depth segmentation was applied to both vascular diameter and blood speed, as shown in Figure 4(c) and (d), respectively, demonstrating that these parameters could be more reliably assessed after at least a couple of weeks of post-surgical healing time.
We also optimized analysis of MB trajectory to differentiate between descending arterioles and ascending venules in the mouse cortex (Figure 5). This methodological approach allows for comparative analysis between arterial and venular vessels within the cortex to assess vascular thickness, blood speed, and arteriole to venule density ratio (panels d, e, and f). In panels g to j we extend the analysis, quantifying the diameter and blood speed distributions across a cortical depth of approximately 500 μm, thereby allowing us to resolve changes in vascular diameter as a function of depth for the whole animal cortex, methodologically improving our ability to resolve longitudinal vascular alterations within the cortex.
In our longitudinal study, we closely monitored the dynamic changes in the thickness of both arterioles and venules within the cortex. To further understand the behavior of arterioles and venules, we utilized pseudo-color maps representing vessel size and MB speed respectively (Figure 6(a) and (b)). Quantitative analysis of these maps revealed changes in the average arterial and venular diameters within the cortex. We assessed these diameters, excluding meningeal vessels, from the upper penetrating vessels to the deeper cortical vasculature at a depth of approximately 500 μm, at various time points. The results are depicted in Figure 6(c) (arterial) and Figure 6(d) (venular). Our investigation also extended to the quantification of average blood flow speed along the same trajectory, excluding meningeal vessels, from the upper penetrating arterial and venular vessels to the deep cortical vasculature, approximately 500 μm deep. The study highlighted in Figures 6(e) (arterial) and (f) (venular) demonstrated expected temporal variations in cortical blood flow dynamics. As anticipated, we observed that both the size of the vessels and the speed of blood flow decreased progressively as they extended deeper into the mouse cortex.

Longitudinal assessment of arterial and venular vessels of the cortex. (a) Longitudinal tracking of vascular thickness of the arterioles and venules. Diameter scale is visible in lower left corner (b) Pseudo-color blood speed intensity map of the arterioles and Continued.venules in longitudinal tracking measurements. Speed scale is visible in the lower left corner. (c, d) Quantification of the average brain arterial (c) and venular (d) vascular diameter starting from upper penetrating vessels (meningeal vessels excluded) until deep cortical vasculature in approximately 500 μm depth, in different time points. (e, f) Quantification of the average blood speed starting from upper penetrating arterial (e) and venular (f) vessels (meningeal vessels excluded) until deep cortical vasculature in approximately 500 μm depth in different time points (n = 6 in each group, *p < 0.05, **p < 0.01, ***p < 0.001).
Discussion
The progress achieved in this methodological study was driven by a collaborative effort to enhance the precision and consistency of intravital cerebrovascular longitudinal imaging, with a primary focus on visualizing cerebrovascular changes in the aging brain. In our pursuit to refine the quality and consistency of intravital longitudinal brain vascular imaging, the transition to the TPX cranial window marked a significant novel breakthrough as it was found to be more reliable and with superior quality compared to intact or thinned skull. In addition, its persistent high performance over weeks post-implementation is particularly useful for extended longitudinal studies. The TPX window offers a more effective and precise approach compared to skull thinning, facilitating consistent comparisons across different animals and longitudinal studies in the same subject. The image analysis workflow we developed proved to be instrumental in revealing intricate vascular features across cortical and hippocampal zones. This ability to monitor vascular dynamics reliably and repeatedly in real-time positions fUS ULM as a potent tool to monitor vascular density and CBF changes across diverse brain regions. The study’s validation of flow rate-radius correlation, mirroring established vascular scaling laws, adds a layer of credibility to this imaging modality. The ULM methodology’s capacity to discern MB speed and flow direction was crucial to differentiate arterioles from venules in the mouse cortex and to ensure a robust analysis of variables like vascular thickness, blood speed, and density. In the cortex, penetrating arteries and arterioles specifically dive radically into the brain parenchyma which flows away from the transducer, ascending venules that drain blood from microcirculatory beds and return to the superficial cortex flow to the transducer. Hence, within the cortex only, arterial and venular vessels can be differentiated according to the axial direction as previously described.37,52 –54 The physiological fidelity of the methods employed in this study, particularly as validated against the principles of Murray’s Law,46,49 underscores our vascular assessments’ accuracy and depth.
Limitations
Nonetheless, a present limitation of ULM is the necessity to achieve sparse concentrations of MBs, through long imaging time windows (10 minutes) or slow-rate infusion of MB solutions to ensuring a spatially dispersed pattern of MB events, critical for precise localization and tracking. 39 Although it is very challenging to replace the probe, 29 achieving less than 100 µm accuracy in the A/P axis across sessions. Despite potential minor variations in mouse positioning and possible tissue displacement due to surgical procedures, the main vessels were consistently identifiable across panels, indicating reliable positioning throughout the study.
The arteriolar to venular ratio
The newly proposed arteriolar to venular ratio (AVR) introduced herein offers an intriguing dimension to cerebral hemodynamic understanding, further bolstering the efficacy of our image analysis mechanisms.55 –57 The proposed ‘brain AVR’ holds substantial promise for clinical studies, particularly in the realm of cerebrovascular research. By offering a nuanced understanding of hemodynamic balance and vascular remodeling, the AVR could serve as a critical biomarker for vascular health and disease progression. Its physiological relevance in the clinical setting extends to conditions like hypertension, diabetes, and neurodegenerative diseases where vascular dynamics play a pivotal role. However, it’s essential to acknowledge that the utility and sensitivity of this ratio in the mouse brain, particularly in the context of pathology, remain uncertain. Further research is needed to ascertain whether the brain AVR can indeed serve as a useful or sensitive biomarker for various neurological conditions.
Optimization for longitudinal studies
Recent evidence has improved our understanding of the cellular and molecular mechanisms underlying cerebrovascular and brain aging, as well as age-related pathologies affecting the central nervous system.4,17,18,31 –33,47,51,58 –77 The methodologies delineated in this study demonstrate significant adaptability for long-term in vivo studies, particularly useful for neuroscience and geroscience research. Alterations in the cerebrovasculature, whether structural or functional, have profound impacts on cognitive functions. For instance, impaired hippocampal blood flow can exacerbate or trigger neuroinflammatory responses and oxidative stress, 78 further contributing to hippocampal dysfunction and cognitive impairment. 58 Vascular alterations can lead to chronic cerebral hypoperfusion, which has been identified as a major driver of the vascular pathology and clinical manifestations of VCID.79 –81 One key cerebrovascular alteration in aging brains is microvascular rarefaction. This phenomenon, marked by a decline in vascular density, significantly impacts CBF and brain perfusion. Rarefaction in the aging cerebrovasculature leads to impaired clearance of detrimental proteins, further contributing to the onset of neurodegenerative conditions like AD. Notably, the extent of rarefaction in AD is region-dependent, showcasing notable capillary density reductions in the cerebral cortex and hippocampus of aged rodents.82 –84 Understanding the spatiotemporal characteristics of age- and disease-related vascular rarefaction through advanced in vivo imaging techniques is pivotal for delineating the vascular-centric pathways underpinning neurodegenerative disorders and advancing geroscience research. 85 The non-invasive nature of fUS and ULM imaging will enable physiological and structural assessment of vascular changes in multiple pre-clinical models of aging. In addition, it will allow testing of interventions. Our data provide a methodology for studies with the need for repeated assessments of CBF, vascular rarefaction, and morphological changes over time. These evaluations can provide insights into the modulation of vascular thickness in arteries and veins, illuminating the intricacies of age-related vascular pathophysiology. The methodologies outlined herein, therefore, not only facilitate a comprehensive understanding of vascular dynamics but also open avenues for formulating new questions to probe the efficacy of therapeutic interventions targeting cerebrovascular anomalies associated with aging. The newly developed capacity to track subtle vascular alterations longitudinally, without subjecting animals to invasive procedures, underscores the potential of the presented methods in fostering a more profound understanding of cerebrovascular aging processes, thereby, advancing geroscience research significantly. As we aim to explore the complexities of age-associated vascular pathologies, these methodologies stand to offer invaluable insights. Furthermore, they can inform therapeutic strategies targeting cerebrovascular irregularities. In summation, these refined methodologies are not merely tools for understanding vascular dynamics but are powerful enablers for future inquiries, significantly expanding the horizons of geroscience research. Moving forward, it is imperative to expand our analytical horizons and expand our analysis and comparisons by looking to 3D structures of the brain. 46 A more comprehensive exploration necessitates the integration of multimodal imaging techniques, particularly emphasizing capturing other crucial physiological parameters like the BBB 47 to generate a more comprehensive cerebrovascular assessment of each study subject. Moreover, to increase the physiological relevance of these studies in the context of VCID, it will be crucial to correlate the cerebrovascular findings with cognitive outcomes in each animal subject. This would not only provide a holistic view of the interplay between vascular changes and cognitive functions but also pave the way for targeted therapeutic strategies tailored to individual needs.
Supplemental Material
sj-pdf-1-jcb-10.1177_0271678X241260526 - Supplemental material for Novel intravital approaches to quantify deep vascular structure and perfusion in the aging mouse brain using ultrasound localization microscopy (ULM)
Supplemental material, sj-pdf-1-jcb-10.1177_0271678X241260526 for Novel intravital approaches to quantify deep vascular structure and perfusion in the aging mouse brain using ultrasound localization microscopy (ULM) by Ádám Nyúl-Tóth, Sharon Negri, Madison Sanford, Raymond Jiang, Roland Patai, Madeline Budda, Benjamin Petersen, Jessica Pinckard, Siva Sai Chandragiri, Helen Shi, Zeke Reyff, Cade Ballard, Rafal Gulej, Boglarka Csik, Jeremy Ferrier, Priya Balasubramanian, Andriy Yabluchanskiy, Audrey Cleuren, Shannon Conley, Zoltan Ungvari, Anna Csiszar and Stefano Tarantini in Journal of Cerebral Blood Flow & Metabolism
Footnotes
Funding
The author(s) disclosed receipt of the following financial support for the research, authorship, and/or publication of this article: This work was supported by grants from the American Heart Association (ANT: https://doi.org/10.58275/AHA.24CDA1276505.pc.gr.193648, ST: CDA941290, the Oklahoma Center for the Advancement of Science and Technology, the National Institute on Aging (RF1AG072295, R01AG055395, R01AG068295; R01AG070915, K01AG073614, R03AG070479), the National Institute of Neurological Disorders and Stroke (R01NS100782), the National Cancer Institute (R01CA255840), the Oklahoma Shared Clinical and Translational Resources (U54GM104938) with an Institutional Development Award (IDeA) from NIGMS, the Presbyterian Health Foundation, the Reynolds Foundation, the Oklahoma Nathan Shock Center (P30AG050911), and the Cellular and Molecular GeroScience CoBRE (P20GM125528) and the NCI Cancer Center Support Grant (P30 CA225520) and the Oklahoma Tobacco Settlement Endowment Trust. The funding sources had no role in the study design; in the collection, analysis, and interpretation of data; in the writing of the report; and in the decision to submit the article for publication.
Declaration of conflicting interests
The author(s) declared no potential conflicts of interest with respect to the research, authorship, and/or publication of this article.
Authors’ contributions
All the authors of this manuscript have contributed significantly to the article. ANT, SN, ST made a substantial contribution to the concept and design, acquisition of data or analysis and interpretation of data. ST, ANT and SN drafted the article. MS, ZR, CB, RJ, RP, MB, BP, JP, RG, PB, BC, ZU, ACl, AY, JF, ACs, SC, HS revised it critically for important intellectual content. ST, ANT, MS, ZR, CB, RJ, RP, MB, BP, JP, SSC, RG, BC, ZU, ACl, AY, JF, ACs, SC, HS, PB and SN approved the version to be published.
Supplementary material
Supplemental material for this article is available online.
References
Supplementary Material
Please find the following supplemental material available below.
For Open Access articles published under a Creative Commons License, all supplemental material carries the same license as the article it is associated with.
For non-Open Access articles published, all supplemental material carries a non-exclusive license, and permission requests for re-use of supplemental material or any part of supplemental material shall be sent directly to the copyright owner as specified in the copyright notice associated with the article.