
Abstract
Enlarged perivascular spaces (EPVS) are common in cerebral small vessel disease (CSVD) and have been identified as a marker of dysfunctional brain clearance. However, it remains unknown if the enlargement occurs predominantly around arteries or veins. We combined in vivo ultra-high-resolution MRI and histopathology to investigate the spatial relationship of veins and arteries with EPVS within the basal ganglia (BG). Furthermore, we assessed the relationship between the EPVS and measures of blood-flow (blood-flow velocity, pulsatility index) in the small arteries of the BG. Twenty-four healthy controls, twelve non-CAA CSVD patients, and five probable CAA patients underwent a 3 tesla [T] and 7T MRI-scan, and EPVS, arteries, and veins within the BG were manually segmented. Furthermore, the scans were co-registered. Six autopsy-cases were also assessed. In the BG, EPVS were significantly closer to and overlapped more frequently with arteries than with veins. Histological analysis showed a higher proportion of BG EPVS surrounding arteries than veins. Finally, the pulsatility index of BG arteries correlated with EPVS volume. Our results are in line with previous works and establish a pathophysiological relationship between arteries and EPVS, contributing to elucidating perivascular clearance routes in the human brain.
Keywords
Introduction
The definition of perivascular spaces (PVS) as fluid-filled compartments around blood vessels in the brain dates back to the middle of the nineteenth century.1,2 More recently, PVS have been implicated in perivascular clearance – the transport of toxic proteins out of the brain3 –5 – which sparked a renewed scientific interest in their anatomy and pathophysiology.
PVS can be pathologically enlarged, 5 which is considered a marker of clearance dysfunction. Enlarged PVS (EPVS) become visible on T2-weighted MRI as hyperintense elongated stripes and their presence has been related to aging, hypertension, stroke, and inconsistently to cognitive impairment.5 –7 Moreover, EPVS are a common hallmark of cerebral small vessel disease (CSVD),8 –11 which includes pathologies impacting the small blood vessels of the brain and frequently co-occurs with other neurodegenerative pathologies, like those associated with Alzheimer’s disease. 12 Common forms of sporadic CSVD in the aging brain are hypertensive arteriopathy (HA) and cerebral amyloid angiopathy (CAA). HA is associated with hypertension and characterized by arteriolosclerotic changes predominantly in the vessels of deep brain regions, especially in the basal ganglia (BG).13,14 On the other hand, CAA is characterized by the accumulation of Amyloid β (Aβ) in the walls of cortical and leptomeningeal vessels. The localization of brain lesions associated with CSVD reflects the localization of the pathology. For example, EPVS are predominantly observed in the centrum semiovale (CSO) in CAA, and in the BG in HA and mixed cases.15,16
A link has been suggested between the remodeling of the walls of cerebral vessels due to pathology, reduced clearance, and thus fluid build-up in the perivascular space.11,17 –19 Many questions related to these crosslinks and the yet unclear pathways of perivascular clearance remain. For example, it is still unclear whether the drainage of toxins from the brain occurs along veins, arteries, or both. The perivascular compartment is thought to enlarge when fluid accumulates due to a blockage of the exit routes. Therefore, whether the PVS enlarge around arteries, rather than veins, can provide indications about the pathways of clearance. Previous observations have determined an overlap between arteries and EPVS.20,21 However, these insightful studies included only few subjects 20 or focused on EPVS in the CSO. 21
The present study aimed to assess the topographical relationship of EPVS in the BG with arteries and veins of normal elderly controls and CSVD patients. We used spatial proximity of the EPVS to the vessels and their overlap to determine whether they enlarged around arteries or veins. To this purpose, a combination of in vivo ultra-high-resolution 7T and 3T MRI and histopathology was employed. Furthermore, we sought to replicate previous findings, that showed higher number/volume of EPVS in the BG of HA and mixed cases compared to healthy elderly controls and CAA patients.15,16 Finally, we explored how cerebral blood flow metrics obtained from the arteries of the BG (pulsatility index [PI] and mean blood flow velocity [Vmean]) were associated with the enlargement of the PVS.22 –24 Pinpointing the relationship between EPVS and measures of blood flow can increase our understanding of their pathophysiology in CSVD.
Materials and methods
Participants
CSVD patients were recruited from a longitudinal 3T MRI study investigating the pathophysiology of CSVD (University Clinic of Magdeburg and German Center for Neurodegenerative Diseases Magdeburg [DZNE]). The main criteria for inclusion were the presence of at least one hemorrhagic CSVD marker (i.e., cerebral microbleeds [CMBs], intracerebral hemorrhage [ICH], cortical superficial siderosis [cSS]) identified on an iron-sensitive MRI sequence (1.5T gradient recalled echo [GRE] T2*-weighted). The MRI was performed as a diagnostic work-up for various tentative diagnoses (e.g. transient ischemic attacks, minor strokes, seizures, migraine). CSVD patients underwent a clinical neurological examination and participants with genetic neurological diseases, history of psychiatric disorders, alcohol or drug abuse, and cerebrovascular malformations were excluded. Additionally, cardiovascular risk factors were recorded, including arterial hypertension (blood pressure > 130/80 mmHg), diabetes mellitus (fasting plasma glucose level >7.0 mmol/L, or >11.1 mmol/L two hours glucose tolerance test), and hyperlipidaemia (low-density lipoprotein cholesterol >2.6 mmol/L, and/or triglycerides >1.7 mmol/L). CSVD patients were further classified into CAA and non-CAA CSVD patients (mixed-CSVD and HA). Diagnosis of CAA25 –28 was based on the Boston criteria version 2.0. Briefly, symptomatic patients with a transient focal neurological episode, cognitive impairment or minor stroke, who presented with two or more lobar haemorrhagic lesions (ICH, CMBs, cSS) or at least one lobar hemorrhagic lesion in addition to one white matter characteristic (severe degree of MRI-visible PVS in centrum semiovale or white matter hyperintensities (WMH) in a subcortical multi-spot pattern) were classified as probable CAA. 28 Non-CAA CSVD patients were characterized by presence of either both lobar and deep CMBs/ICH 29 (mixed-CSVD) or only deep CMBs/ICH (patients with HA).
Controls were recruited from the DZNE Magdeburg and selected from a pool of cognitively normal healthy elderly individuals. Each control previously underwent a 3T MRI involving a susceptibility-sensitive MRI sequence (T2*-weighted) and was included based on the absence of haemorrhagic markers of CSVD (CMBs, ICH, and cSS). Moreover, controls showed no moderate/severe EPVS in BG/CSO, and only show-caps or pencil-thin lining periventricular WMH and/or punctate foci of deep WMH were allowed. The criteria for subcortical multi-spot WMH pattern were never met in the control group Supplementary Table 1). Demographic information of the participants included in the study are reported in Table 1. The study was approved by the local Ethics Committee of the Otto-von-Guericke University Magdeburg (93/17; 28/16). Written informed consent was acquired by all participants based on the Declaration of Helsinki and monetary compensation for transport costs and time was provided.
Demographic information of participants included in the study.
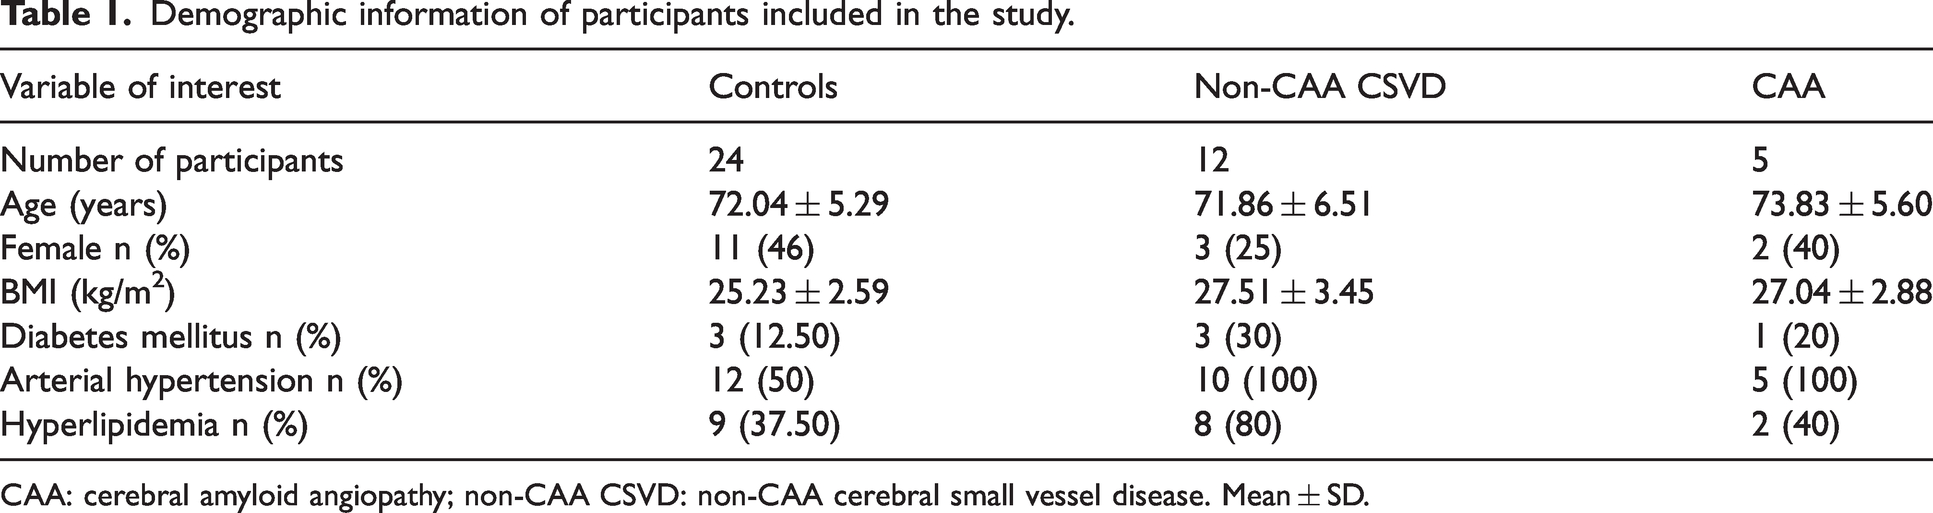
CAA: cerebral amyloid angiopathy; non-CAA CSVD: non-CAA cerebral small vessel disease. Mean ± SD.
3T MRI
Each participant underwent a 3T MRI scan prior to a 7T MRI scan (median interval [range] in months: 1 [1–24]). The 3T scan was conducted using a Siemens Verio scanner with a Siemens 32-channel array coil (Siemens Healthineers, Erlangen, Germany). The scanning protocol consisted of a T2*-weighted 3D GRE sequence for the identification of haemorrhagic markers (flip angle: 17°, voxel size = 0.8 × 0.8 × 2 mm3 [millimeter 3 ] echo time [TE] = 20 ms [milliseconds], repetition time [TR] = 28 ms, receiver bandwidth [RBW] = 100 Hz/px [Hz/pixel], GeneRalized Autocalibrating Partially Parallel Acquisitions [GRAPPA] acceleration factor 2 and 24 reference lines). Also, a T2-weighted turbo spin echo sequence (TSE) was utilized to detect and quantify EPVS in the BG (flip angle = 120°, voxel size = 0.5 × 0.5 × 2 mm3, TE = 73 ms, TR = 6500 ms, RBW = 222 Hz/px, GRAPPA acceleration factor 2 and 38 reference lines). A T2-weighted fluid-attenuated inversion recovery (FLAIR) sequence was conducted to investigate and quantify WMHs (flip angle = 120°, voxel size = 1 × 1 × 1 mm3, TE = 395 ms, TR = 5000 ms, RBW = 781 Hz/px, GRAPPA acceleration factor 2 and 24 reference lines). A T1-weighted 3D magnetization-prepared rapid gradient echo (3D-MPRAGE) and a diffusion-weighted sequence were also part of the scanning protocol but were not used in this study. The total scanning time at 3T was ∼45 minutes.
7T MRI
The 7T scan acquisition was performed at a Siemens Healthineers scanner (Siemens Healthineers, Erlangen, Germany) equipped with a 32-channel head-coil (Nova Medical, Wilmington, USA). For anatomical reference, a T1-weighted sequence (3D-MPRAGE) was performed (flip angle = 5°, voxel size = 1 × 1 × 1 mm³, TE = 2.89 ms, TR = 2250 ms, inversion time [TI] = 1050 ms, RBW = 130 Hz/px, GRAPPA acceleration factor 2 and 32 reference lines). To detect veins, quantitative susceptibility mapping (QSM) was reconstructed from a T2*-weighted 3D GRE (flip angle = 10°, voxel size = 0.35 × 0.35 × 1.5 mm³, TE = 9 ms, TR = 18 ms, RBW = 100 Hz/px, GRAPPA acceleration factor 2 and 32 reference lines). To this aim, multiple-channel complex image data was combined by applying an adaptive algorithm 30 and automatic reference channel selection. A continuous Laplacian approach was used to unwrap the combined phase data. 31 Consequently, a brain mask was computed using the magnitude image as input (FSL BET routing, threshold = 0.1) and applied to the phase image. To remove the background field, we first calculated the Laplacian boundary value (LBV) with two-layer region of interest (ROI)-peeling. 32 Then, a variable spherical value (vSMV) was applied (r0 = 40 mm, step size/final kernel radius = 1 mm). 33 The final QSM was calculated from the computed local field maps by multi-scale dipole inversion (MSDI). 34
To detect arteries, an ultra-high resolution time-of-flight angiography (ToF) was acquired (flip angle = 23°, voxel size = 0.28 × 0.28 × 0.28 mm³, TE = 4.59 ms, TR = 22 ms, RBW = 130 Hz/px, GRAPPA factor 3 and 32 reference lines). Venous saturation was implemented by applying the saturation pulses sparsely, i.e. only every 7th TR. 35 In order to reduce scanning time, the ToF was limited to an axial slab covering the BG from the bottom of the hippocampus extending 5 centimeters dorsally.
PI and Vmean were measured following a protocol described in previous works.22
–24,36 Briefly, a 2;D phase-contrast (PC) sequence in combination with multi-step image processing and manual quality control was utilized to record flow velocity in the small penetrating vessels of the BG (flip angle = 45°, voxel size = 0.3 × 0.3 × 2 mm³, TE = 16.6 ms, TR = 27.6 ms, 2 segments [phase-encoding steps per cardiac cycle], RBW = 59 Hz/px). The sequence was planned manually on sagittal images of the T1-weighted sequence, ensuring that the section was approximately perpendicular to the perforating arteries of the BG. Blood flow velocity was reconstructed at 14 time points throughout the cardiac cycle, and then averaged across all selected vessels. The resulting mean velocity curve for each participant over the cardiac cycle was averaged across these time points resulting in Vmean. The PI was computed by taking into account maximum (Vmax), minimum (Vmin), and mean observed blood flow velocity (Vmean) based on the formula
Manual segmentation of BG, EPVS and vessels
To determine the proximity between EPVS and arteries, as well as between EPVS and veins, these structures were manually segmented within the region of the BG. EPVS were located and segmented as hyperintense thin stripes no wider than 3 mm on the 3T T2-weighted TSE MRI, according to established criteria. 37 Arteries were segmented based on the ultra-high resolution 7T ToF angiography, which allowed the representation of smaller arteries in this brain region, such as the lenticulostriate arteries. Small BG veins were delineated based on their hyperintense appearance on the QSM. To limit analysis precisely to the BG, the BG were manually segmented on the 3T T2-weighted TSE and included the nucleus caudatus, the globus pallidus, putamen, subthalamic nucleus, and the thalamus. All segmentations were performed on axial planes in native space, blinded to clinical information, using ITK-snap v3.8.0 (www.itksnap.org)38,39 (JB, 2 years of experience). For quality control, each segmentation was visually inspected and corrected by a second rater where necessary (VP, 7 years of experience) (Figure 1, Supplementary Figure 1).
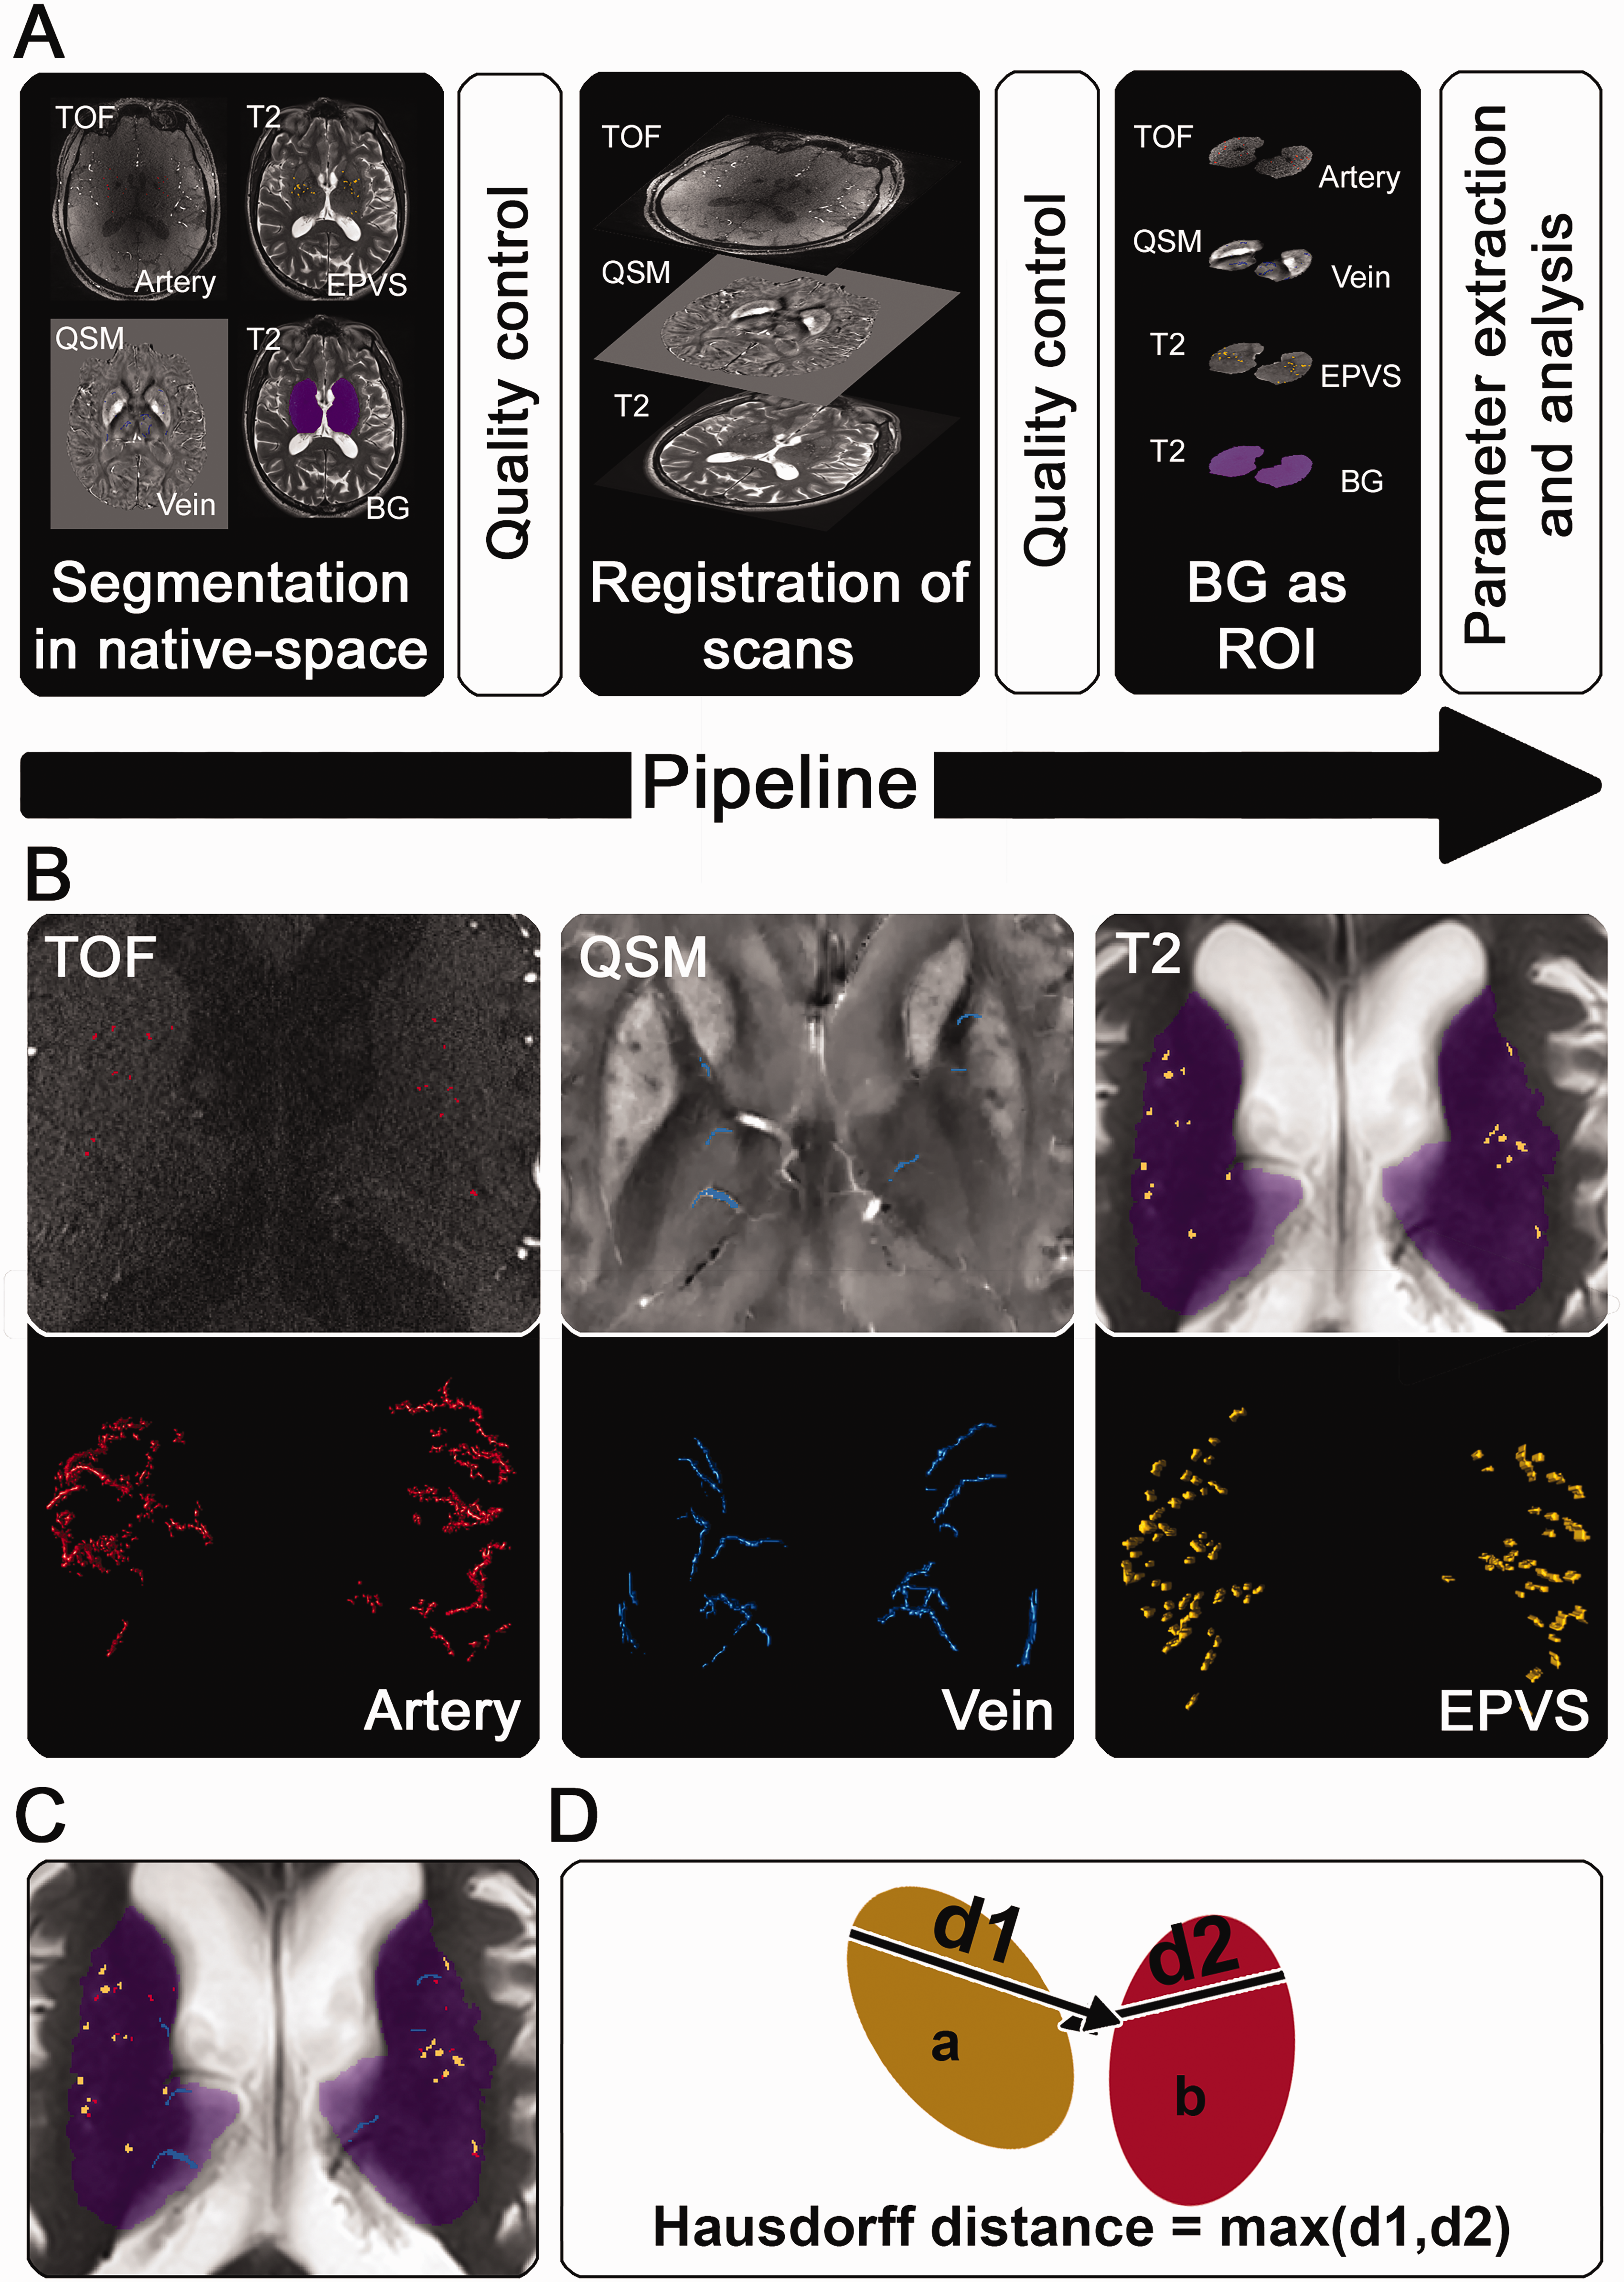
MRI-processing pipeline and parameters: a) Pipeline summarizing the MRI-processing, consisting of i) the segmentation of arteries, veins, and enlarged perivascular spaces (EPVS) in native space, ii) registration of MRI scans to each other, iii) definition of the basal ganglia (BG) as region of interest (ROI), and iv), parameter extraction/analysis. Visual quality control was conducted at every step. b) Exemplary segmentation of arteries in Time-of-Flight angiography (ToF), veins in quantitative susceptibility mapping (QSM), and BG as well as EPVS in the T2-weighted image (T2-w). Segmentations are illustrated in the axial plane (B, first row) as well as three-dimensionally, observed from dorsal to ventral (B, second row). c) Combined visualization of the exemplary segmentations in b) on a T2-weighted image (T2-w). d) Simplified graphical visualization and formula of the Hausdorff distance quantifying the spatial distance of two segmentations. d1 represents the maximum distance from the boundary in a to the nearest boundary in b
Registration of scans
The 7T QSM (used to segment the veins), the 7T ToF (used to segment the arteries), and the 3T T2-weighted TSE (used to segment the EPVS) were registered in 3 steps using ITK-Snap v3.8.0 (www.itksnap.org), 38 which has been adopted for similar purposes in a previous study. 40 First, the 3T T2-weighted TSE and 7T QSM were aligned with the 7T ToF using the manual registration feature, taking into account translation and rotation. Second, the 3T T2-weighted TSE and 7T QSM were automatically registered to the 7T ToF utilizing a rigid transformation model based on mutual information and incorporating a multi-resolution scheme with 8x to 1x down sampling.38,41 Third, each registration was inspected for accuracy and fine-tuned using the manual registration feature. The registration was cross-checked by two experts for quality control (VP, 7 years of experience; JO, 3 years of experience). Each registration was subsequently encoded in a transformation matrix and applied to the respective segmentations of BG, EPVS, and veins, transforming the now registered segmentations into the 7T ToF space by nearest neighbor interpolation. After registration and transformation of the different segmentations, the BG segmentation was used as a mask to extract segmented veins, arteries, and EPVS within the region of interest.
Spatial association of EPVS and vessels
In order to assess whether the EPVS were located in closer proximity to arteries or veins, the Hausdorff distance was computed between EPVS and arteries, and separately between EPVS and veins. The Hausdorff distance for this study (here expressed in millimeters [mm]), represents the maximum distance one would need to traverse from any given point on one segmentation to reach the nearest point on the other segmentation. It was automatically computed using Freesurfer v7.2 (www.surfer.nmr.mgh.harvard.edu), 42 generating a robust metric of spatial association (Figure 1).43,44
Quantitative assessment of EPVS number and volume
For each case, four additional quantitative measures were computed from the EPVS segmentations: Total EPVS number, total EPVS volume, EPVS volume fraction (percentage of BG volume occupied by EPVS), and mean EPVS volume (the average volume of one EPVS). Each of these parameters was computed for artery-associated EPVS, vein-associated EPVS, and for EPVS regardless of vessel association (artery or vein or no vessel). The association of an EPVS with either an artery or vein was determined according to the type of vessel it overlapped with, i.e. per EPVS segmented it was checked if any voxel was also included in the arterial or venous segmentation. When an EPVS overlapped with both, i.e. artery and vein, its association was decided by assessing whether the arterial or venous segment within the EPVS of interest was longer. The length of the EPVS and overlapping vessel segments were approximated by fitting ellipsoids to the segmentations and considering the lengths of the ellipsoids’ major axis. Only a relatively small number of EPVS overlapped with a vein and artery at the same time (median number [range] in %: 6.38 [0.00–20.93]), and only a negligible portion of EPVS had a roughly equal length of arterial as well as venous segments within the EPVS of interest. When an EPVS-segmentation was discontinued (i.e. the EPVS was visible and segmented in one MRI slide, absent in the subsequent slide, and then visible and segmented again in the following slide), two individual EPVS were processed. In addition, the percentage of the BG volume occupied by veins as well as the percentage of the BG volume occupied by arteries was calculated. Computations were conducted using python3 (www.python.org) and scikit-image (www.scikit-image.org).
Autopsy cases
Furthermore, the study included pathological brain samples from 6 individuals. The autopsy cases were part of an ongoing program that aims to evaluate the underlying histopathology of MRI markers of CSVD and were selected based on the diagnosis using stratified random sampling (2 CAA cases, 2 non-CAA CSVD cases, 2 controls). The diagnosis was made through ex vivo MRI and confirmed through pathological examination by a board-certified pathologist. The program was initiated in 2015 at Massachusetts General Hospital (MGH) and includes brain donations obtained from MGH and outside hospitals. 45 Study approval was received from the MGH institutional review board (protocol number: 2021P001920), and informed consent was obtained from the next of kin or legal representative prior to autopsy according to the Declaration of Helsinki. While the most intact cerebral hemisphere was fixed in 10% formalin and was subject to ex vivo 3T MRI and histopathological examination, the other hemisphere underwent routine neuropathological examination by a board-certified neuropathologist.
Ex vivo MRI
The most intact hemisphere underwent a 3T ex vivo MRI. To this aim, hemispheres were vacuum-sealed in a plastic bag containing periodate-lysine-paraformaldehyde and scanned overnight in a whole-body 3T MRI scanner (MAGNETOM Trio, Siemens Healthineers, Erlangen) using a 32-channel head coil. The scanning protocol included a T2-weighted TSE sequence (flip angle = 150°, voxel size = 0.5 × 0.5 ×0.5 mm3, TE = 61 ms, TR = 1800 ms, turbo factor = 15, RBW = 131Hz/Px, total scan time ∼4 hours) and a gradient-echo fast low angle shot (FLASH) (Flip angle: 10°, 20°, 30°, voxel size = 0.5 × 0.5 × 0.5 mm3, TE1 = 4.49 ms, TE2 = 11.02 ms, TR = 20 ms, RBW =160 Hz/Px, 2 averages, total scan time ∼ 2 hours). CMBs were identified as hypointense round/ovoid foci on the gradient echo and TSE images. Cortical cerebral microinfarcts (CMIs) were lesions that appeared as hyperintense foci within the cortex on the TSE. EPVS severity score was assessed by counting hyperintense thin stripes on three axial sections in both the CSO and the BG (<3 mm) and was based on previously established criteria. 37 Two cases showed lesions compatible with the diagnosis of CAA (lobar CMBs, severe EPVS in the CSO). Severe CAA burden was confirmed in the pathological analysis and these cases were therefore classified as definite CAA cases. 28 Two cases had a clinical diagnosis of probable CAA but displayed no evidence of CAA on histopathology. Additionally, they showed neuroimaging markers of CSVD (lobar CMBs, severe EPVS in the CSO or BG, cortical microinfarcts, lacunes) and were therefore rated as non-CAA CSVD cases. Two cases, which were included as non-neurological controls and had no severe CSVD markers (no CMBs, no cSS, <20 EPVS on one MRI slide) and no CAA on pathological examination were included as non-CSVD control cases. Demographic information and severity of markers of CSVD are provided in Table 2.
Characteristics of autopsy cases.
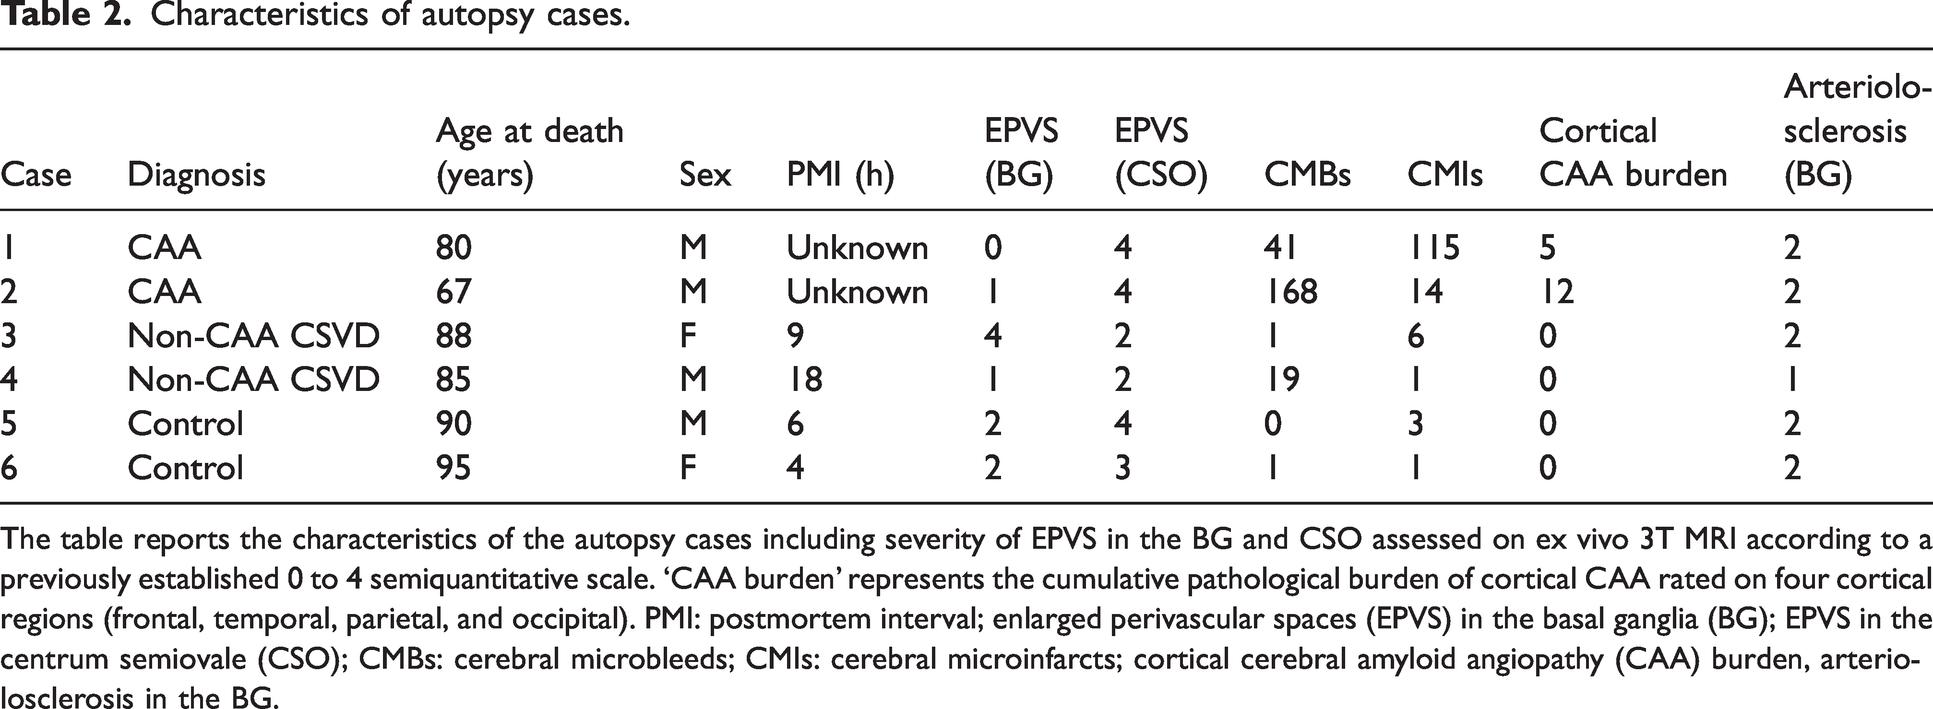
The table reports the characteristics of the autopsy cases including severity of EPVS in the BG and CSO assessed on ex vivo 3T MRI according to a previously established 0 to 4 semiquantitative scale. ‘CAA burden’ represents the cumulative pathological burden of cortical CAA rated on four cortical regions (frontal, temporal, parietal, and occipital). PMI: postmortem interval; enlarged perivascular spaces (EPVS) in the basal ganglia (BG); EPVS in the centrum semiovale (CSO); CMBs: cerebral microbleeds; CMIs: cerebral microinfarcts; cortical cerebral amyloid angiopathy (CAA) burden, arteriolosclerosis in the BG.
Histological analysis
For histological analysis, the formalin fixed hemisphere was cut in 1 cm-thick coronal slabs and samples were taken from pre-defined standard brain regions that included cortical (frontal, parietal, temporal, occipital) and subcortical areas, such as the BG (analyzed in this study) (Figure 2). Tissue blocks were embedded in paraffin and cut in 6 µm-thick serial sections at a microtome. Adjacent sections were stained for hematoxylin&eosin (H&E) and luxol fast blue with H&E (LHE) following a standard histology protocol (Figure 2). Immunohistochemistry for smooth muscle actin (SMA) (mouse, Dako, 1:250, Cat# M0851) and Aβ (mouse, clone 6 F/3D; Agilent Technologies, Santa Clara, CA; 1:200, Cat# M0872) was conducted as previously described. 45 Briefly, the protocol consisted in deparaffinization in xylene and rehydration in graded ethanol series, blocking of endogenous peroxidase (20 min), antigen retrieval in heated citrate buffer (for SMA) and formic acid (for Aβ), blocking with normal horse serum (1 hour), application of primary antibody (overnight), biotinylated secondary antibody (Vectastain kit, Vector laboratories, mouse or rabbit, 1 hour), amplification with an Avidin Biotin Complex (ABC) kit (Vectastain, Vector laboratories, 30 min), and visualization with 3′3-diaminobenzidine (DAB, Vector laboratories). The sections were finally counterstained with haematoxylin, dehydrated and cover slipped.

Ex vivo MRI and histopathology analysis: (a) 3T T2-weighted ex vivo MRI was performed on the most intact hemisphere and presence of enlarged perivascular spaces (EPVS) was evaluated. The inlet displays EPVS, which appear as hyperintense stripes. (b) Formalin-fixed 1 cm thick coronal section of the same brain and level seen in a). The inlet displays the sample of the brain region which included the basal ganglia (BG). (c) Tissue stained for Luxol fast blue with Hematoxylin&Eosin (LHE) for the identification of vessels and diameter measurement of corresponding PVS. All vessels with a diameter >10 μm (bigger inset) were selected and the corresponding PVS diameter measured perpendicularly to the vessel and the space (example of a measurement in the small inset). If the PVS was wider than 30% of the vessel’s diameter it was considered enlarged and the vessel classified as related to an EPVS. 11 and (d) smooth muscle actin (SMA) immunohistochemistry on adjacent sections allowed to differentiate between arteries and veins based on the presence of SMA-positive cells in the vessel’s wall.
After drying, sections were scanned at 55579 dpi using a Hamamatsu NanoZoomer Digital Pathology (NDP)-HT whole slide scanner (C9600-12, Hamamatsu Photonics KK, Japan) equipped with a 20x objective. Digitized images were visualized using NDP.view2 v2.8.24. In the predefined cortical areas, leptomeningeal and cortical CAA severity was assessed on the Aβ-stained sections by two independent raters (SJvV, 9 years of experience; VP, 7 years of experience) using a four-point scale (absent Aβ, 0; scant Aβ deposition, 1; some circumferential Aβ, 2; widespread circumferential Aβ, 3). 46 A consensus meeting was held to obtain a final result, and consequently the point score from the respective areas was summed up to single cumulative cortical and leptomeningeal CAA burden score (0–12). Furthermore, the severity of arteriolosclerosis in the H&E stained BG sections was classified based on a previously described four-point scale (no arteriolosclerosis, 0; mild, 1; moderate 2; severe 3). 47 As previously described, 11 all vessels with a diameter >10 μm were located and annotated on the LHE-stained BG sections (Figure 2). The corresponding PVS were subsequently measured perpendicularly to the vessel over the full width of the space and classified as EPVS when they were wider than 30% of the vessel’s diameter (Figure 2). The same arbitrarily chosen threshold was applied in a separate study and used here as well for consistency. 11 Accordingly, each vessel was classified as related to an EPVS or not. Longitudinally cut vessels were considered only once. On adjacent SMA-stained sections vessels were then classified as arteries or veins based on the presence or absence of SMA-positive cells in the vessel wall (Figure 2). Vessels that could not be confidently located on the SMA section were excluded. All grading was performed blinded to the pathological diagnosis.
Statistical analysis
Five non-parametric Wilcoxon matched pairs signed-rank tests were computed to investigate differences in Hausdorff distance, total EPVS number, total EPVS volume, EPVS volume fraction, and mean EPVS volume based on the associated vessel type (artery, vein). A one-way mixed ANOVA was conducted to assess differences between diagnosis with regard to total EPVS number (regardless of vessel association), using diagnosis (control, CAA case, non-CAA CSVD case) as a between-subjects factor. Post-hoc analyses were conducted using Tukey’s multiple comparisons test (corrected for multiple comparisons using statistical hypothesis testing). Additionally, three non-parametric Kruskal Wallis H-tests used diagnosis as an independent factor and total EPVS volume, EPVS volume fraction, and mean EPVS volume respectively (regardless of vessel association) as independent variables. Dunn’s tests were adopted for post-hoc testing (corrected for multiple comparisons with statistical hypothesis testing). A paired sample t-test was utilized to compare the percentage of the BG volume occupied by veins to the percentage of the BG volume occupied by arteries. To assess whether EPVS in histopathological sections of the BG were associated with arteries or veins, frequencies were analyzed using a Chi-square test. An additional Chi-square test was computed to determine differences in expected and observed frequencies of EPVS between diagnosis.
Spearman’s and Pearson’s correlations were computed to investigate associations of PI and Vmean with the total volume, volume fraction, mean volume, and total number of artery-associated EPVS. Age was included as a covariate. For each analysis, Shapiro-Wilk tests were calculated to assess normality of the data and choose the appropriate test. Analysis and data presentation was conducted using R-studio v1.4.1 (www.rstudio.com) and Graphpad Prism v9.4.1 (www.graphpad.com). Statistical tests were two-sided and utilized an alpha level of 0.05 as the threshold for significance.
Results
A total of 41 CSVD participants were included in the study (mean ± SD; age = 72.21 years ± 5.59; 61% female): 24 were elderly controls (mean ± SD; 72.03 years ± 5.29; 46% female) without CSVD and cognitive impairment; 17 were CSVD patients (mean ± SD; non-CAA CSVD [n = 12]: 71.86 years ± 6.51, 25% female, n = 9 mixed CSVD, n = 3 hypertensive arteriopathy [HA]; CAA [n = 5]: 73.83 years ± 5.60, 40% female).
EPVS are more strongly associated with arteries than with veins on MRI
Across cases, the average total number of detected EPVS was 151.22 ± 49.14 (mean ± SD). The Hausdorff distance, which describes proximity between segmentations was significantly smaller between arteries and EPVS in comparison to veins and EPVS (Mdnvein = 0.92 mm, Mdnartery = 0.30 mm, W = −861, p < .0001, Figure 3, Table 3, Supplementary Video 1, Supplementary Video 2). The total number of EPVS overlapping with arteries on MRI was significantly larger in comparison to those overlapping with veins (Mdnvein = 10, Mdnartery = 34, W = 861, p < 0.0001, Figure 4, Table 3), and the total volume as well as volume fraction of EPVS overlapping with arteries compared to those overlapping with veins was significantly higher (total EPVS volume: Mdnvein = 86.08 mm3, Mdnartery = 335.20 mm3, W = 861, p < 0.0001; EPVS volume fraction: Mdnvein = 0.24%, Mdnartery = 0.84%, W = 861, p < 0.0001; Figure 4, Table 3).
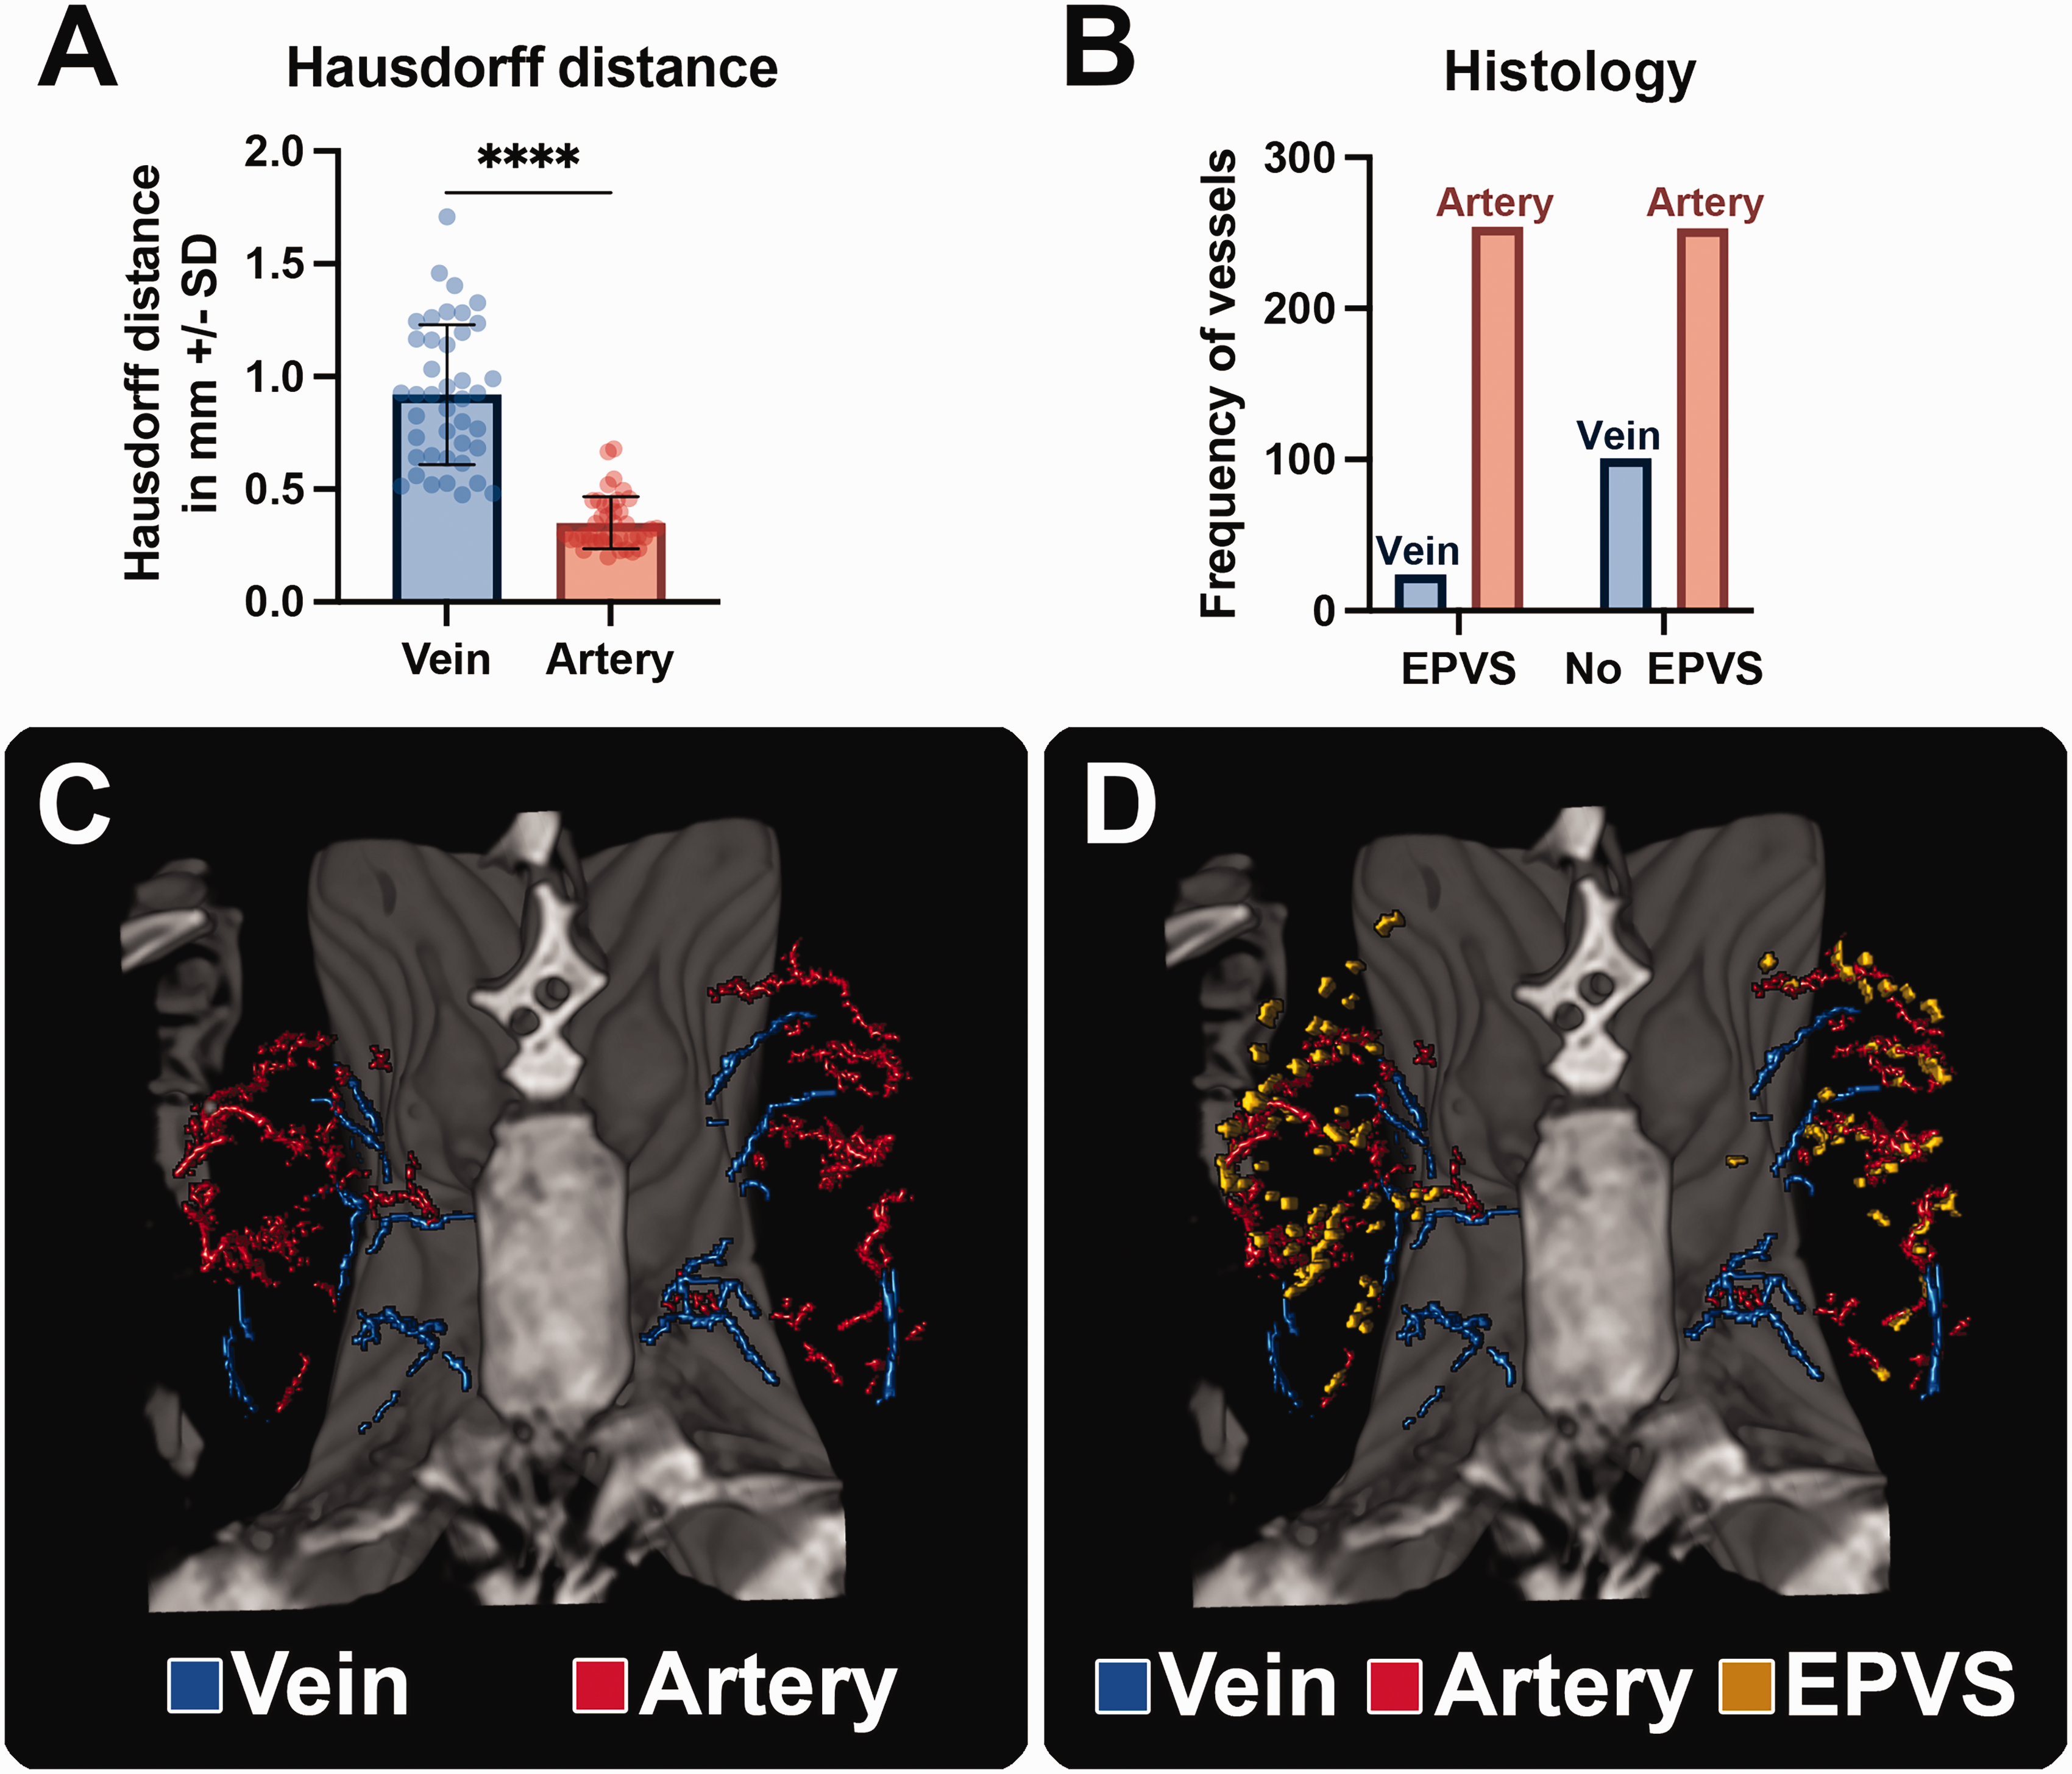
Proximity of arteries and veins to enlarged perivascular spaces (EPVS): (a) Significantly smaller Hausdorff distance between segmentations of arteries and EPVS in comparison to veins and EPVS revealing closer proximity of arteries and EPVS in comparison to veins and EPVS. (b) In histology, a significantly larger number of EPVS were associated with arteries, than with veins. (c) 3D rendering of segmented veins and arteries within the basal ganglia (BG). (d) 3D rendering of veins, arteries and EPVS within the BG illustrating closer proximity of EPVS to arteries than to veins. ****=p < 0.0001, datapoints indicate individual cases.
Descriptive statistics of EPVS-measures.
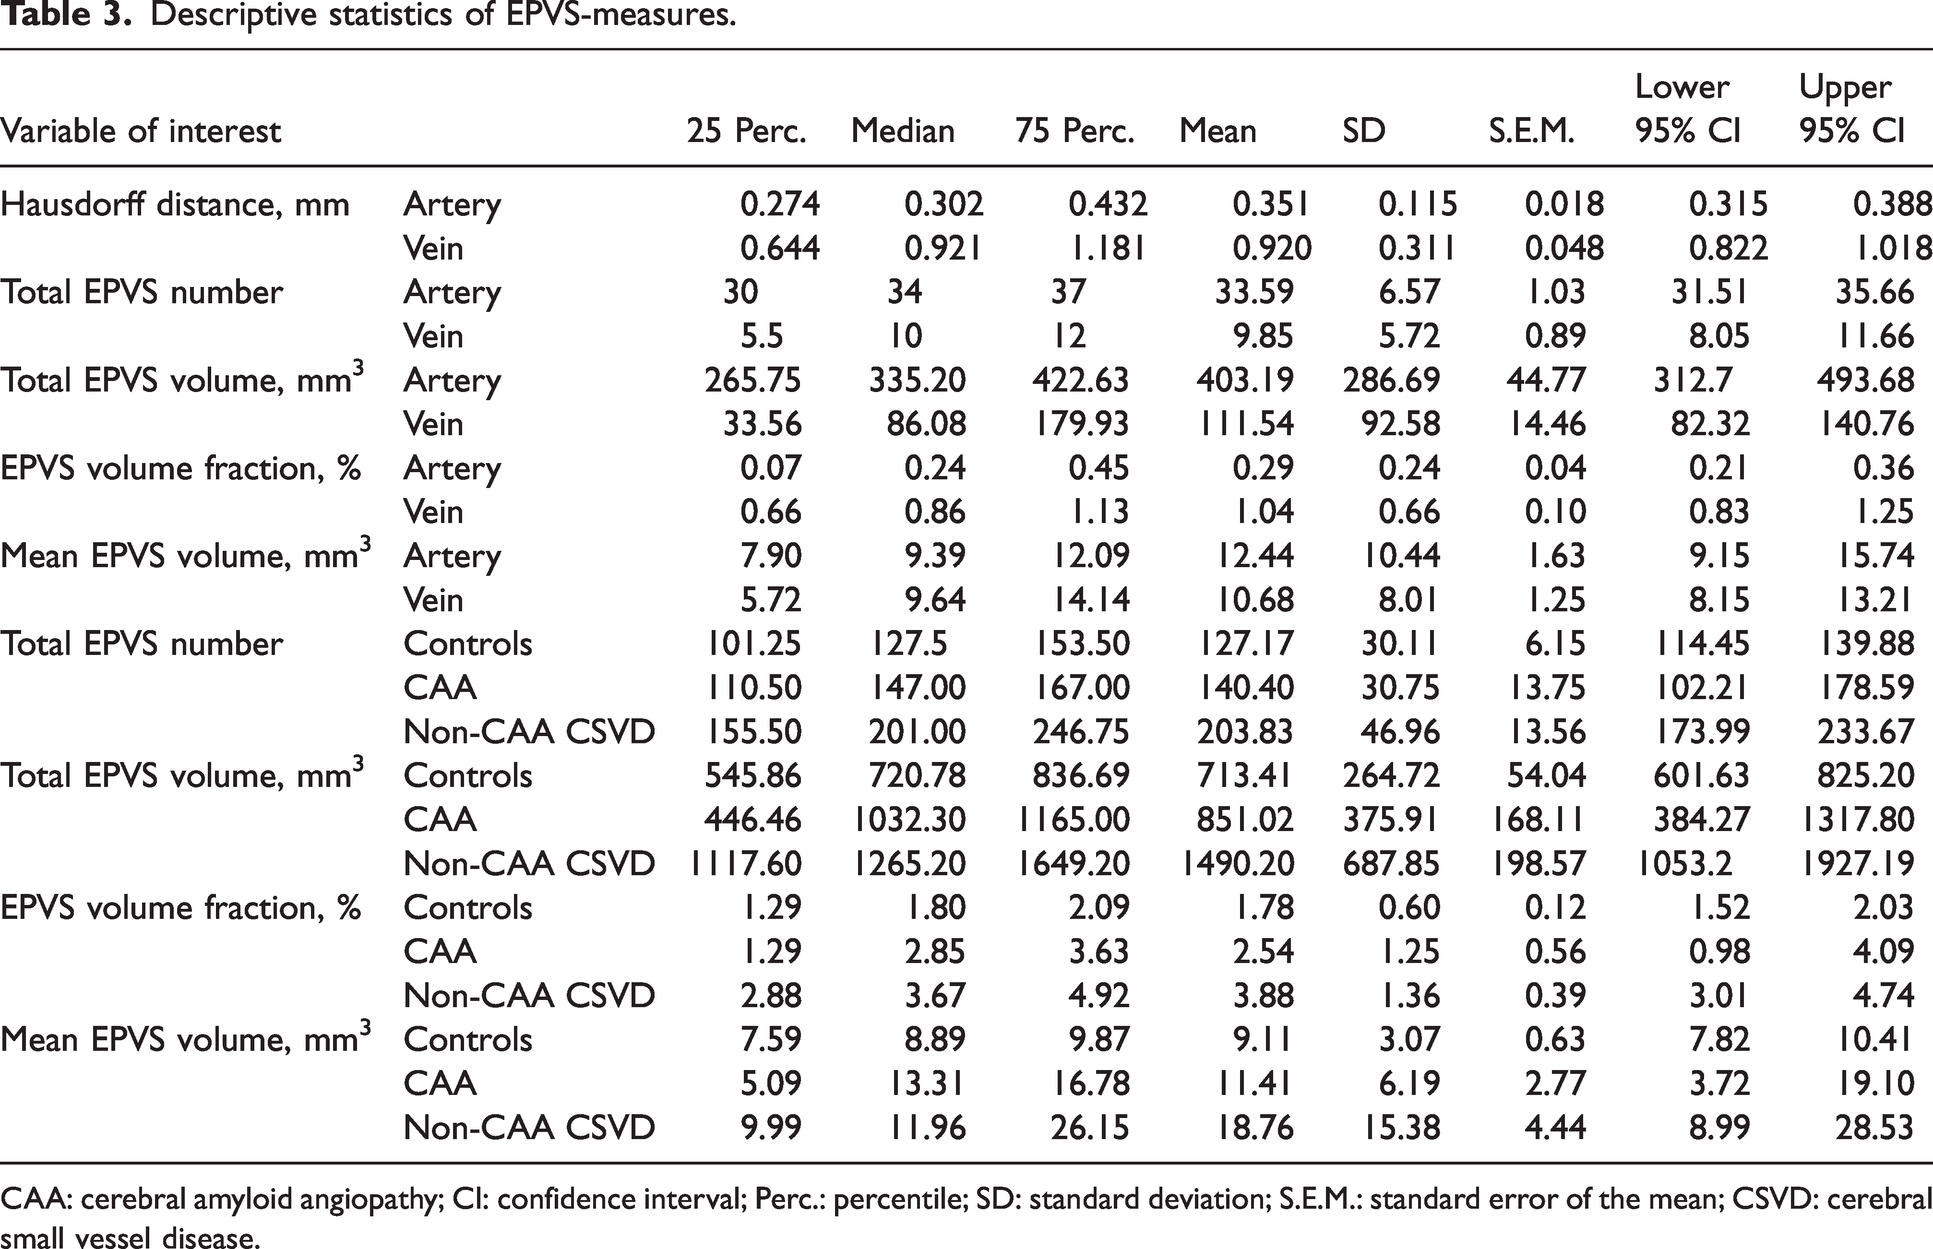
CAA: cerebral amyloid angiopathy; CI: confidence interval; Perc.: percentile; SD: standard deviation; S.E.M.: standard error of the mean; CSVD: cerebral small vessel disease.
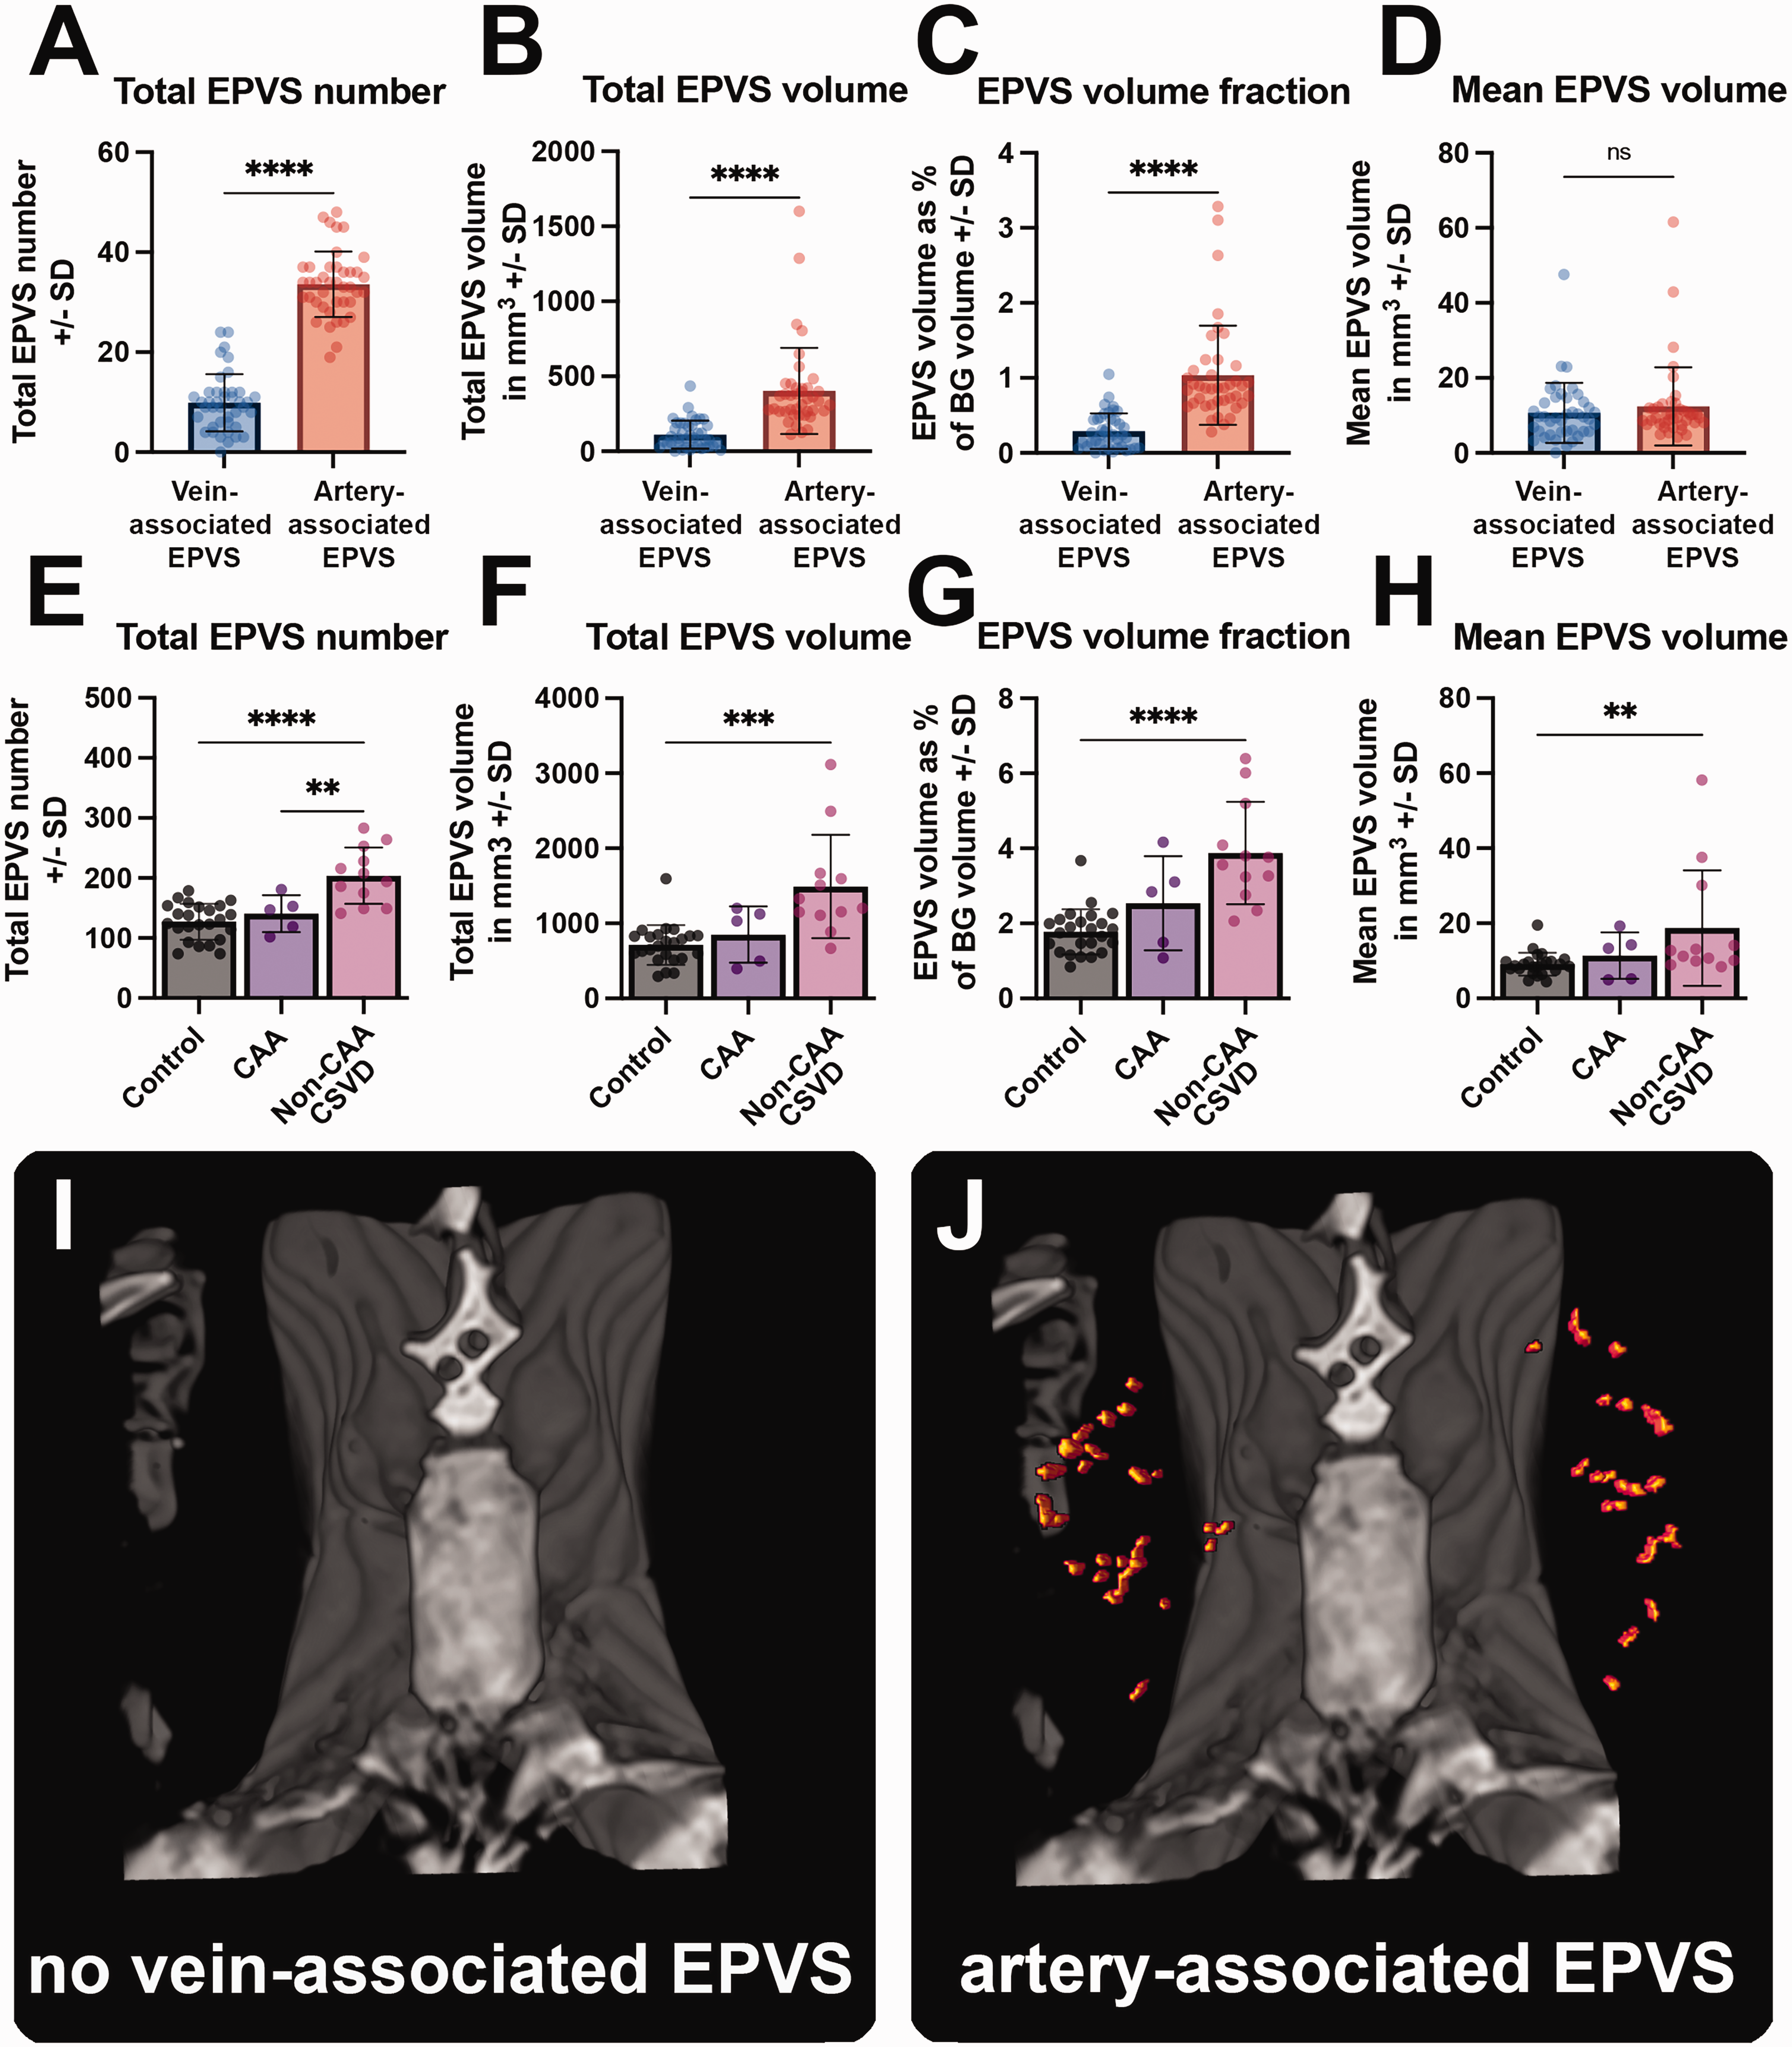
Quantitative measures of enlarged perivascular spaces (EPVS): (a) A significantly larger number of EPVS was associated with arteries than with veins. (b) The total volume of artery-associated EPVS within the BG was significantly larger than for vein-associated EPVS. (c) The volume-fraction of BG occupied by artery-associated EPVS was significantly larger than that of vein-associated EPVS. (d) The mean volume of individual EPVS was not significantly different for EPVS associated with arteries or veins. (e) Significantly more EPVS were found in the BG in non-cerebral amyloid angiopathy cerebral small vessel disease (non-CAA CSVD) patients than in CAA patients or controls. (f) The total volume of EPVS was significantly larger in non-CAA CSVD patients in comparison to controls. (g) The volume of BG occupied by EPVS was significantly larger in non-CAA CSVD patients in comparison to controls. (h) The mean volume of EPVS in the BG non-CAA CSVD patients was significantly larger than in controls. (i) Exemplary 3D rendering displaying no EPVS associated with veins within the BG. (j) 3 D rendering of the same case displaying a large number of artery-associated EPVS (in red). ****=p < 0.0001. ***=p < 0.001, **=p < 0.01, datapoints indicate individual cases.
Across cases, 30.61% ± 8.32% (mean ± SD) of the observed EPVS overlapped directly with either an artery, or a vein (Supplementary Table 2). Mean volume of EPVS (the average volume of one EPVS within one subject) associated with arteries or veins was not significantly different (Mdnvein = 9.64 mm3, Mdnartery = 9.39 mm3, W = 223, p = 0.152, Figure 4, Table 3). Within our sample, veins occupied significantly more volume within the BG than arteries (mean ±SD; veins = 0.84% ± 0.25%, arteries = 0.29% ± 0.06%, t(40) = 12.74, p < 0.0001), making it unlikely that the spatial proximity of the EPVS with the arteries is to be attributed to their better detection or higher number.
EPVS are more strongly associated with arteries than with veins also in histopathology
In the histological sections, a total of n = 637 individual vessels were marked in the BG across the six cases. Among these vessels, 5 were excluded from further analysis, because the same vessel could not be found on the adjacent SMA-stained section. Of the remaining 632 vessels, 254 were related to an EPVS (43.99%). The proportion of arteries among the EPVS-related vessels (254/278 = 91.37%) was higher than that of veins (24/278 = 8.63%) (χ2[1] = 38.86; n = 632, p < 0.001, Figure 3). Furthermore, similarly to a previous study, all the EPVS presented with a central blood vessel. 11 Taken together, these findings indicate that EPVS primarily occurred around arteries rather than veins (Figure 3, Supplementary Video 1). The frequency of EPVS in the BG sections was significantly different depending on the diagnosis (EPVS-related vessels/total vessels: 60/189 = 31.74% in the CAA patients; 70/214 = 32.27% in the non-CAA CSVD patients; 130/272 = 47.80% in the controls) (χ2[2] = 16.59; n = 675, p < 0.001).
BG-EPVS are larger and more frequent in non-CAA CSVD patients than in CAA patients and controls
We verified whether group-differences with respect to the EPVS measures in our cohort were consistent with existing observations, that report a higher burden of BG-EPVS in non-CAA CSVD. A main effect of diagnosis (control, CAA, non-CAA CSVD) was observed in total EPVS number (F(2,38) = 2.15, p < 0.0001), total EPVS volume (H[3] = 16.53, p < 0.001), EPVS volume fraction (H[3] = 19.40, p < 0.0001), and mean volume of individual EPVS (H[3] = 9.01, p = 0.011) (Figure 4). Post-hoc analyses revealed significantly higher values for all these measures in non-CAA CSVD when compared to controls (EPVS number [mean ± SD]; non-CAA CSVD = 203.83 ± 46.96, controls = 127.17 ± 30.11; p < 0.0001; EPVS volume: Mdnnon-CAA CSVD =1265.20 mm3, Mdncontrols =720.78 mm3, p < 0.001; EPVS volume fraction: Mdnnon-CAA CSVD = 3.67%, Mdncontrols = 1.80%, p < 0.0001; mean volume of individual EPVS: Mdnnon-CAA CSVD = 11.96 mm3, Mdncontrols =8.89 mm3, p = 0.009). Finally, total EPVS number was also higher in CAA patients compared to controls (mean ± SD; non-CAA CSVD = 203.83 ± 46.96, CAA =140.40 ± 30.75; p = 0.006).
Pulsatility of the BG arteries is positively associated with total EPVS volume
We observed a positive association between PI in the arteries of the BG and the total volume of artery-associated EPVS (ρ(35) = 0.31, p = 0.047, Supplementary Figure 2). Additionally, we observed a trend towards significance for the correlation between PI and the EPVS volume fraction as well as the mean volume of artery-associated EPVS (EPVS volume fraction: ρ(35) = 0.29, p = 0.081; Mean EPVS volume: ρ(35) = 0.30, p = 0.075; Supplementary Figure 2). There was no relationship between PI and the total number of artery-associated EPVS (ρ(35) = 0.13, p = 0.432) and between Vmean and EPVS-measures (total EPVS volume: ρ(35) = 0.15, p = 0.358; EPVS volume fraction: ρ(35) = 0.15, p = 0.400; mean EPVS volume: ρ(35) = 0.15, p = 0.366; total EPVS number: ρ(35) = 0.05, p = 0.781). For each correlation analysis, age was included as a covariate.
Discussion
In the present study, we used a combination of ultra-high resolution 7T and 3T in vivo MRI and histopathology in participants with CSVD and healthy elderly controls to assess the relationship between EPVS and vessel type in the BG. On MRI, EPVS in the BG were spatially related more to arteries, represented by ToF-angiography, than veins, detected using QSM. Furthermore, the number and volume of EPVS associated with arteries was higher than for the EPVS related to veins. These observations were confirmed in few pathological cases, in which the proportion of EPVS around arteries was higher than that of EPVS around veins. Overall, these findings suggest that the enlargement of PVS in the human BG occurs predominantly around perforating arteries, and not veins. This observation is consistent with findings from previous studies: one reported a lack of overlap between the EPVS and veins, 21 whereas another showed at high-resolution 7T MRI, that the PVS enlarged around the lenticulostriate arteries. 20 Finally, in a related work, we found that in histological sections of patients with pathologically-confirmed CAA, EPVS in the CSO were mainly enlarged around arteries. 11 Assuming that PVS enlarge due to clearance dysfunction and fluid build-up, this anatomical observation might indicate that the arteries are predominantly involved in facilitating perivascular fluid movement. Other possible explanations for the localization of EPVS include, that this compartment could be present only around arteries, or that periarteriolar tissue ‘gives in’ to pressure more than perivenular tissue, leading to PVS enlargement. Moreover, periarteriolar inflammation could play a role in the development of EPVS. 48 On the other hand, one study has related the presence of venous collagenosis, as quantified in histopathology, to EPVS, finding no difference in the width of the PVS associated with arteries or veins. However, samples for this study were taken from the periventricular white matter and not from the BG. 49 A general issue in this field of study is the difficulty in distinguishing arterioles from venules when the former are affected by arteriolosclerosis and loss of smooth muscle cells. However, a misidentification in this specific study would have resulted in the number of venules being overestimated, which would have increased the likelihood of maintaining the null hypothesis.
Similarly, the generalizability of our results is limited by the focus on the BG. For example, previous studies argue that the layers of the PVS which surround vessels of the BG are different from the PVS of perforating cortical vessels. PVS of the BG seem to be delimited by two layers of pia mater, whereas one abluminal layer of glia limitans and a singular layer of pia mater delimit the cortical PVS.5,50 Therefore, not only the structure of the PVS, but also the driving pathophysiological mechanism leading to their enlargement might differ according to the brain region. This possibility is corroborated by the association of EPVS with different vascular pathologies (i.e. arteriolosclerosis in the BG and CAA in the cortex).15,51 –53 Consistently with the distribution of EPVS across the CSVD-spectrum,15,51,52 the EPVS within our cohort were significantly larger and more frequent in the BG of non-CAA CSVD patients in comparison to CAA patients and controls. However, this was not confirmed in histopathology, which could be due to the higher sensitivity towards the EPVS or due to a bias introduced by the low number of cases. Furthermore, if it is true that PVS-enlargement represents a marker of (regional) brain-clearance dysfunction, it is possible that different noxious proteins are cleared in different brain-regions. In fact, Aβ rarely accumulates within the BG, and can instead be detected in the neocortex of aging individuals. 54
In the present cohort, the pulsatility and velocity of cerebral blood flow was also measured. To this aim, an innovative MRI-sequence, which had been described in detail elsewhere,22 –24,36 was used. The PI of the BG-arteries were significantly associated with total EPVS volume, suggesting a potential relationship of increased pulsatility in the BG-arteries and the enlargement of EPVS. Consistently, in a large population study, higher aortic stiffness measured using cardiac MRI, was related to greater EPVS volume of the BG. 55 Furthermore, our results are in line with previous studies linking markers of CSVD, such as EPVS and lacunes, to increased pulsatility.56,57 The lenticulostriatae arteries, which were the ones imaged in this study using ToF-angiography and PC-MRI, branch out directly and perpendicularly from the middle cerebral artery. Therefore, they are exposed to stronger pressure waves from the cerebral blood flow 58 and are thus particularly vulnerable to injury of the vessel’s wall, remodeling, and stiffening, 59 which can potentially also impair their role in perivascular clearance. We observed no relation between the mean velocity and other measures of EPVS.
The use of different modalities of high-resolution MRI is a strength of the present study, which allowed for the first time to combine the visualization of arteries, veins, and EPVS of the BG in an in vivo CSVD cohort. Moreover, the availability of measures of cerebral blood flow allows to establish a link between the vessels’ characteristics and the enlargement of the PVS. 60 The use of histopathological tissue from a different cohort of patients corroborates that the PVS tend to enlarge around arteries in this brain region. Leveraging the combination of pathological and imaging analysis represents a further strength of this study. Several automated methods for the segmentation of EPVS exist.61,62 Nonetheless, manual segmentation was the best choice in this specific case, providing the maximum achievable precision and facilitating quality control and manual correction.
The co-registration of multi-modal MRI acquisitions cannot be perfect. An error margin has to be taken into account and might theoretically influence our results. However, rigorous quality control of the individual co-registrations was conducted. Furthermore, imprecisions in the co-registration are expected to be equally distributed between arteries and veins, thus not favoring the outcome of a spatial relationship of the EPVS to either. Arteries and veins were assessed using different MRI sequences (ToF-angiography at 0.28 mm isotropic voxel-size for the former and QSM-venography with 0.35 mm in-plane voxel-size for the latter). This could have led to different sensitivity in the detection of the vessels. However, the ToF-angiography is based on the signal caused by arterial blood flow, i.e. inflow enhancement, which could be affected by various factors (e.g. blood pressure and stenosis). On the other hand, the QSM reconstruction chosen for this project has been shown to have high sensitivity for the detection of veins. 34 We observed that the volumetric fraction of the BG occupied by veins was significantly larger than the one occupied by arteries, so that it seems unlikely that the spatial proximity of the EPVS with the arteries is to be attributed to their better detection or higher number.
One limitation of the present study is the relatively small sample size of the in vivo cohort. However, this needs to be evaluated in relation to the difficulties of acquiring 7T MRI, which is subject to strict exclusion criteria, often fulfilled by an elderly and hospital-based population. The sample size is indeed in line with previous studies utilizing 7T MRI in comparable cohorts.63 –65 Relatedly, our cohort consists of a selective group of participants, which, because of the exclusion criteria of 7T MRI, could be biased towards healthier cases. As such, it remains unclear how these findings generalize to the larger aging and neurological population. Larger sample sizes, the inclusion of patients affected by other brain diseases, as well as the consideration of further regions of interest, will lead to a more fine-grained picture. The classification of participants into non-CAA-CSVD was based on the presence of hemorrhagic markers of CSVD in deep brain areas. This previously adopted approach 66 is imperfect, but was chosen given the lack of established pathologically validated diagnostic criteria, which include also other neuroimaging markers of CSVD, such as EPVS and WMH. In addition, all participants of the CAA cohort were classified as probable CAA and therefore the findings are not generalizable to possible CAA patients. Lastly, an EPVS had to be counted twice if there was a discontinuity between MRI slices, which represents a potential imprecision.
This study contemporarily investigates the relationship of EPVS with arteries and veins in a CSVD cohort, while also combining high-resolution 7T in vivo MRI and histopathology as ground truth. We found that PVS of the BG predominantly enlarge around arteries. Independently from this result, we also observed that the total EPVS volume was significantly associated with increased pulsatility index in the BG arteries. Longitudinal multimodal human studies will be needed to reveal the mechanistic relationships between the enlargement of PVS, vascular pathologies and brain clearance. To assess the generalizability of our findings, future studies should include a larger and more diverse patients’ population, investigate other brain regions and widen the still limited amount of ultrastructural examinations performed on human-tissue samples (e.g. through electron microscopy).67,68 The present study represents a relevant step towards understanding the mechanisms underlying the enlargement of PVS in the human brain.
Supplemental Material
sj-mp4-1-jcb-10.1177_0271678X241260629 - Supplemental material for Enlarged perivascular spaces in the basal ganglia are associated with arteries not veins
Supplemental material, sj-mp4-1-jcb-10.1177_0271678X241260629 for Enlarged perivascular spaces in the basal ganglia are associated with arteries not veins by Jan Oltmer, Hendrik Mattern, Julia Beck, Renat Yakupov, Steven M Greenberg, Jaco JM Zwanenburg, Tine Arts, Emrah Düzel, Susanne J van Veluw, Stefanie Schreiber and Valentina Perosa in Journal of Cerebral Blood Flow & Metabolism
Supplemental Material
sj-mp4-2-jcb-10.1177_0271678X241260629 - Supplemental material for Enlarged perivascular spaces in the basal ganglia are associated with arteries not veins
Supplemental material, sj-mp4-2-jcb-10.1177_0271678X241260629 for Enlarged perivascular spaces in the basal ganglia are associated with arteries not veins by Jan Oltmer, Hendrik Mattern, Julia Beck, Renat Yakupov, Steven M Greenberg, Jaco JM Zwanenburg, Tine Arts, Emrah Düzel, Susanne J van Veluw, Stefanie Schreiber and Valentina Perosa in Journal of Cerebral Blood Flow & Metabolism
Footnotes
Data availability
The data that support the findings of this study are available from the corresponding author (V.P.), upon reasonable request.
Funding
The author(s) disclosed receipt of the following financial support for the research, authorship, and/or publication of this article: This work was funded by the German Research Foundation (DFG) (454245528 to V.P., 501214112 to H.M. and S.S.), by the Deutsche Alzheimer Gesellschaft (DAG) e.V. (MD-DARS project to H.M and S.S.) and by the National Institute of Health (AG059893 to S.J.v.V.).
Acknowledgements
The authors wish to thank the participants of the MRI study as well as the brain donors and their families, who made this work possible. Furthermore, we wish to thank Ashley A. Scherlek and Corinne A. Auger for processing the histopathological tissue.
Declaration of conflicting interests
The author(s) declared no potential conflicts of interest with respect to the research, authorship, and/or publication of this article.
Authors’ contributions
Experimental concept and design: V.P., J.O.; Data collection and acquisition: V.P., T.A., J.B.; Data processing and analysis: J.O., H.M., J.B., R.Y., V.P., J.J.M.Z, T.A.; Manuscript writing: J.O., V.P., H.M., S.J.v.W., S.S., S.M.G., E.D.; Acquired funding: V.P., S.S., H.M., S.J.v.V.
Supplementary material
Supplemental material for this article is available online.
References
Supplementary Material
Please find the following supplemental material available below.
For Open Access articles published under a Creative Commons License, all supplemental material carries the same license as the article it is associated with.
For non-Open Access articles published, all supplemental material carries a non-exclusive license, and permission requests for re-use of supplemental material or any part of supplemental material shall be sent directly to the copyright owner as specified in the copyright notice associated with the article.