
Abstract
Sickle cell disease (SCD) is the most common genetic blood disorder, characterized by red cell hemolysis, anemia, and corresponding increased compensatory cerebral blood flow (CBF). SCD patients are at high risk for cerebral infarcts and CBF quantification is likely critical to assess infarct risk. Infarcts primarily localize to white matter (WM), yet arterial spin labeling (ASL) MRI, the most common non-invasive CBF approach, has poor WM CBF sensitivity owing to low WM CBF and long WM bolus arrival time (BAT). We hypothesize that anemia, and associated cerebral hyperemia, in SCD leads to improved WM detection with ASL. We performed 3-Tesla multi-delay pulsed ASL in SCD (n = 35; age = 30.5 ± 8.3 years) and control (n = 15; age = 28.7 ± 4.5 years) participants and applied t-tests at each inversion time within different flow territories, and determined which regions were significantly above noise floor (criteria: one-sided p < 0.05). Total WM CBF-weighted signal was primarily detectable outside of borderzone regions in SCD (CBF = 17.7 [range = 12.9–25.0] mL/100 g/min), but was largely unphysiological in control (CBF = 8.1 [range = 7.6–9.9)] mL/100 g/min) participants. WM BAT was reduced in SCD versus control participants (ΔBAT = 37 [range = 46–70] ms) and BAT directly correlated with hematocrit (Spearman’s-ρ = 0.62; p < 0.001). Findings support the feasibility of WM CBF quantification using ASL in SCD participants for appropriately parameterized protocols.
Keywords
Introduction
Sickle cell disease (SCD) is the most common genetic blood disorder, affecting more than four million persons worldwide. In SCD, which encompasses all sickle genotypes, hemoglobin-S (HbS) production leads to hemolysis, associated anemia, and ultimately decreased arterial oxygen content (CaO2; mL O2/100 mL blood). 1 As a result, cerebral blood flow (CBF; ml blood/100g tissue/min) is generally upregulated in an effort to maintain sufficient oxygen delivery to tissue.2 –4 However, stroke and silent cerebral infarcts (SCI) are common brain injuries in patients with SCD. SCIs refer to infarcts of at least 3 mm in diameter visible on brain MRI, but not associated with focal neurological symptoms. While accepted terminology in the field, silent is now recognized as a misnomer in this context, as SCIs are well-documented to be associated with decreased cognitive performance in school aged SCD children and young adults.5,6 In terms of prevalence, 11% of SCD patients will suffer an overt stroke by the age of 20 years without screening and associated primary stroke prevention therapies, whereas approximately 53% of SCD patients will have an SCI by young adulthood.7,8 Critically, approximately 90% of SCIs in SCD patients occur in the deep borderzone white matter (WM) regions, with the majority of diffuse ischemic injury in other populations following a similar topographical pattern.9,10 As such, reliable WM CBF quantification is likely even more critical than gray matter (GM) CBF quantification for understanding the progression of disease and detection of brain parenchyma at highest risk for infarction.
The most common technique for quantifying CBF non-invasively with MRI is arterial spin labeling (ASL), which most frequently magnetically labels blood water in the cervical arteries (internal carotid arteries and vertebral arteries), after which the labeled blood water flows to the intracranial capillary exchange sites, exchanges with tissue water, and attenuates the tissue water signal in a manner that depends on both the kinetics of the bolus arrival and CBF. 11 ASL has been successfully used in SCD patients to demonstrate elevated CBF in GM related to decreased arterial oxygen content, replicating results found in PET studies previously,2,12 and has also been applied to report CBF in deeper WM regions in the setting of SCD. 9 However, previous empirical and theoretical work has found WM CBF imaging with ASL to be unreliable using common imaging parameters.13 –15 The reason for this well-known occurrence is because the label in ASL decays with the arterial blood water T1, which is approximately 1.6–1.7 s at a field strength of 3.0 Tesla, and this time may be similar to the BAT of arterial blood water to WM parenchyma. 14 This is additionally complicated by the approximately 2.5-fold lower CBF in WM relative to GM, which reduces overall signal-to-noise ratio (SNR) to near or below the detectability limit of ASL.14 –16
However, given that CBF is increased, and BAT reduced, in SCD relative to non-anemic healthy conditions, it is logical that ASL may have increased detectability and reliability for CBF in the setting of SCD.2,3,12 Here, we investigate this possibility by evaluating the regional detectability of WM CBF in patients with SCD and provide new information on how ASL WM CBF accuracy depends on hemoglobin level, blood arrival, and the extent of hyperemia.
Methods
Participants
All components of this study were performed in compliance with the Declaration of Helsinki of 1975 (and as revised in 1983) and the Health Insurance Portability and Accountability Act. All protocols were approved by the Vanderbilt University Medical Center Institutional Review Board (IRB Study 220151), and all participants provided informed, written consent for this prospective cross-sectional study. The study aimed to evaluate the feasibility of measuring WM CBF in SCD patients and non-anemic age-matched controls using a multi-delay pulsed ASL (PASL) technique. PASL was utilized since PASL is well-suited to interrogate the early phases of the kinetic curve of blood arrival owing to the short duration labeling pulse (2–10 ms). SCD patients were required to either have hemoglobin-SS (Hb-SS) or hemoglobin-Sβ0-thalassemia (Hb-Sβ0) phenotype and controls were required to have HbAA. All participants enrolled had no 3.0 T MRI contraindications including but not limited to implantable devices that were 3.0 T MRI prohibitive such as intracranial clips or metallic foreign bodies. Additionally, participants with dental braces were excluded as dental braces elicit susceptibility artifacts that extend into both the white matter and labeling regions. Both SCD and control participants did not have a history of any major independent neurological, vascular, or psychiatric conditions; patients with a history of moyamoya vasculopathy or overt stroke were also excluded.
Hematological measures
Hematocrit and hemoglobin levels, as well as hemoglobin-S percentage and arterial oxygen saturation, were measured in SCD patients within seven days of the MRI scan. Hemoglobin and arterial oxygen saturation were used to calculate the oxygen content of arterial blood (CaO2) using a binding coefficient of oxygen to hemoglobin of 1.37 mL O2/g Hb.
Magnetic resonance imaging (MRI) and angiography (MRA)
MRI and MRA data were acquired using a Philips 3.0 T MRI (Philips Healthcare, Best, The Netherlands) with body coil radiofrequency transmission and a 32-channel phased-array head coil for reception. For both cohorts, a non-contrast head MRI and MRA protocol was applied including: 3D T1-weighted (magnetization-prepared rapid gradient echo; spatial resolution =1 × 1 × 1 mm; 3D turbo fast echo; compressed sensing; repetition/echo time = 6.7/3.1 ms), 3D T2-weighted FLuid Attenuated Inversion Recovery (FLAIR) (spatial resolution = 1.1 × 1.1 × 1.1 mm; turbo inversion recovery; compressed sensing; repetition/inversion/echo time =4800/1650/340 ms), and intracranial time-of-flight (TOF) MRA (spatial resolution = 0.5 × 0.8 × 1.4 mm; 3D gradient echo; repetition/echo time = 23/3.5 ms).
For CBF and BAT determination, a 2D echo-planar-imaging multi-delay PASL sequence was utilized (spatial resolution = 3 × 3 × 7 mm; Look-Locker readout [flip angle = 40°]; inversion time spacing (TI2) = 400 ms; signal targeting by alternating radiofrequency pulses; repetitions = 25; acquisition time = 6 mins 56 s) which consisted of 16 inversion times (TIs) equally spaced from 200 to 3200 ms collected in two interleaved acquisitions. The top of the imaging volume was placed above the most superior aspect of the sagittal sinus, the gap between imaging volume and labeling volume was 20 mm, and the labeling volume had a thickness of 100 mm; example PASL imaging and labeling slabs are overlayed on a sagittal slice of a participant’s T1-weighted image in Figure 1(a). The first Look-Locker PASL acquisition collected eight TIs equally spaced between 200 and 3000 ms, while the second acquisition collected eight TIs equally spaced between 400 and 3200 ms. No signal re-scaling or change in gain settings occurred between these two scans, as recalibration and separate preparations (e.g., shimming, etc.) were turned off for the second scan. All images were combined in post-processing to yield 16 TIs equally spaced between 200 and 3200 ms. In addition, an M0 image was collected with the same geometry parameters but spin labeling removed and long TR = 15 s for equilibrium magnetization calculation. Of note, PASL rather than pCASL was used owing to its known sensitivity to BAT given the short labeling duration. 2D EPI rather than 3D GRASE was chosen owing to its ability to be readily used in a Look-Locker readout and owing to the desire to quantify regional WM CBF with reduced smoothing artifacts. The advantages and disadvantages of these labeling and readout approaches are addressed in the Discussion.
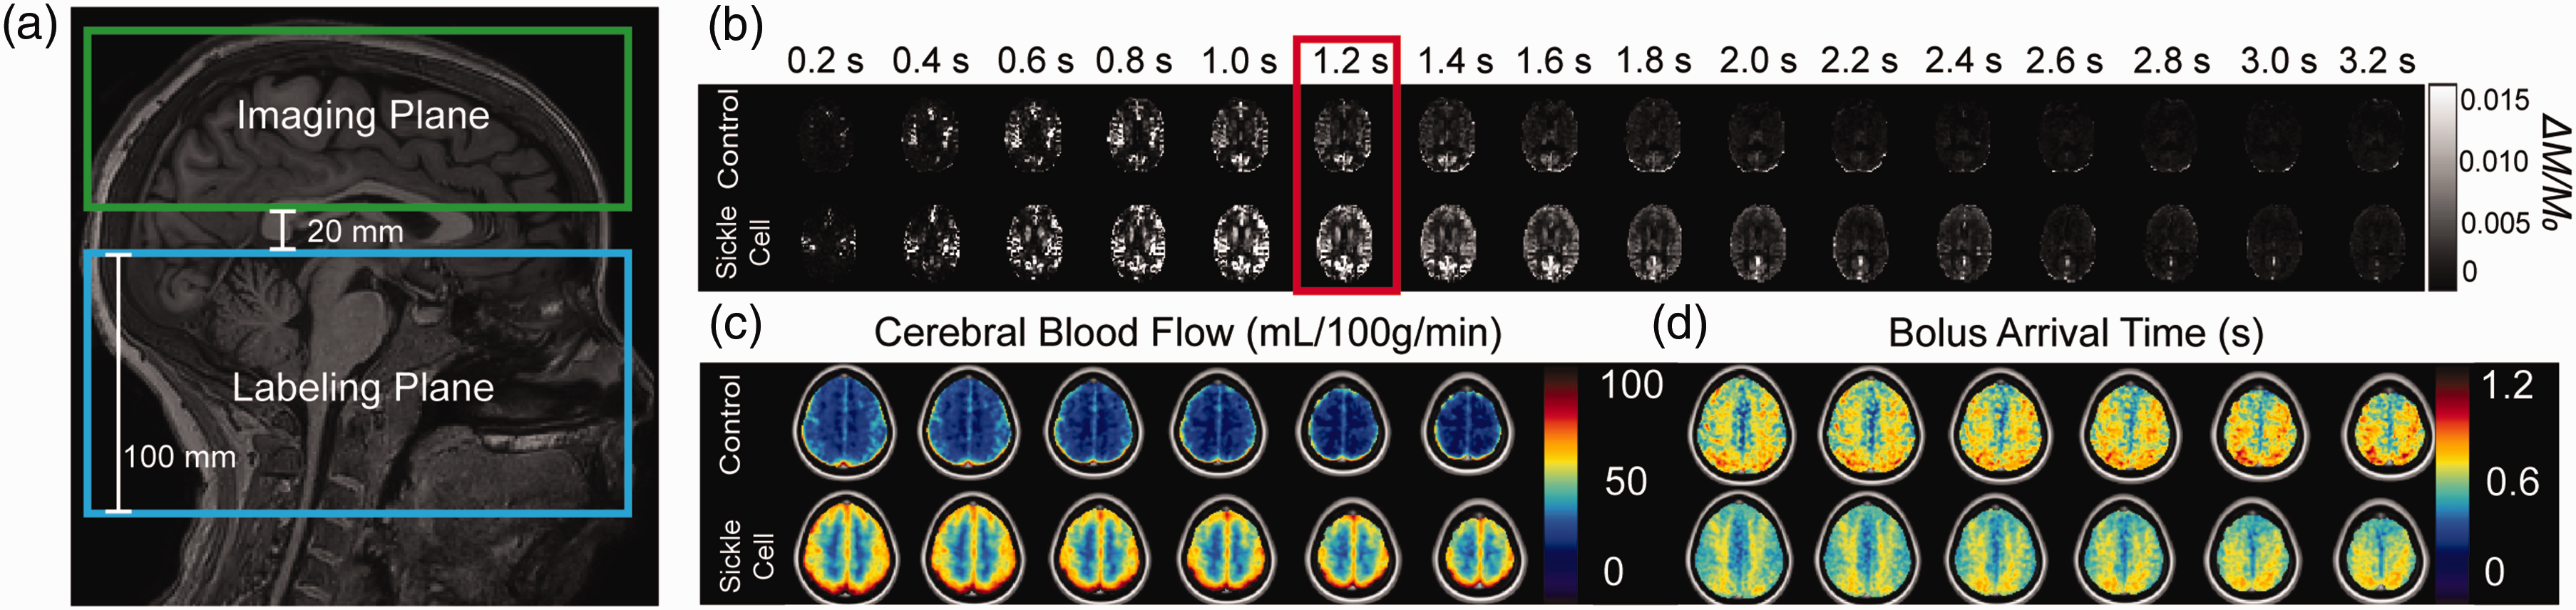
(a) Schematic showing the location of the imaging (green; nine slices at 7 mm slice thickness each) and the labeling plane (blue; thickness = 100 mm, placed 20 mm below and in parallel with the imaging plane). (b) A single slice for a representative participant in each group at each inversion time (TI) collected as part of the 16-TI pulsed arterial spin labeling (PASL) approach. Note that the blood flows in faster in the sickle cell disease relative to control participants, and also reaches a higher ΔM/M0 value, consistent with higher cerebral blood flow (CBF) and reduced bolus arrival time (BAT), as represented by TI = 1.2 s (highlighted by the red box) where the sickle cell participant has greater signal than the control. Group average CBF (c) and bolus arrival time (d) in standard MNI 152 2 mm space.
Analysis
T1-weighted anatomical images were bias corrected, brain extracted, and tissue segmented using advanced normalization tools (ANTs) 17 and the FMRIB Software Library (FSL). 18 Partial volume estimation images from FSL-FAST were used to create separate total WM and GM masks. 19 T1-weighted images were subsequently registered to an MNI 152 T1-weighted 1 mm standard atlas 20 using non-linear and linear registration and separately into the native space of the M0 image using linear registration in ANTs. Final tissue segmentation masks after thresholding were transformed into the M0 space using transforms obtained in the above registration procedures. Flow territories (anterior cerebral artery [ACA], middle cerebral artery [MCA] and borderzone regions) were segmented by transforming the atlas from Liu et al. 2023. 21 The flow territories were further segmented by tissue type into WM and GM ACA, MCA, and borderzone regions-of-interest (ROIs) as depicted in Figure S1 shown in Supplementary Information.
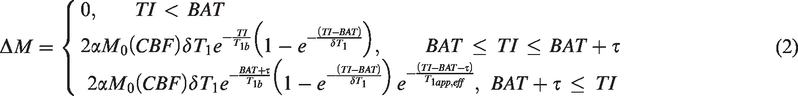
For quantification of hemodynamic parameters, PASL data were first pair-wise subtracted to obtain the ΔM image across each repetition and TI, then each ΔM image was normalized by the M0 equilibrium magnetization image to calculate the CBF-weighted image (ΔM/M0). The CBF-weighted image was averaged across all 25 repeated measurements at each TI to obtain a CBF-weighted time series in each voxel over the range of TIs: 200 to 3200 ms. Blood T1 was calculated in the SCD group using the hematocrit recorded from the blood draws with the calibration curve estimated by Lu et al. 2004,
22
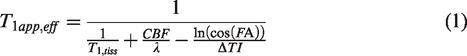
as there is currently no separate T1 calibration model for SCD arterial blood water and, in contrast to T2, hemoglobin type is believed to have only a small effect on blood water T1. The apparent effective longitudinal relaxation was modeled by T1app,eff as proposed by Günther et al. 2001:
23
GM-ACA: gray matter anterior cerebral artery flow territory GM-MCA: gray matter middle cerebral artery flow territory GM-ACA-MCA borderzone: gray matter borderzone region between anterior cerebral artery and middle cerebral artery territories WM-ACA: white matter anterior cerebral artery territory WM-MCA: white matter middle cerebral artery territory WM-ACA-MCA borderzone: white matter borderzone region between anterior cerebral artery and middle cerebral artery territories
The maps in standard space were then averaged within each group to obtain the spatial distribution of the group mean CBF and BAT across the brain.
Statistical analysis
Descriptive statistics were compared for demographic parameters between control and SCD participants. Age was compared between the two groups using a Wilcoxon Rank-Sum test while sex and race were compared using a Chi-squared test. Significance was defined as two-sided p < 0.05.
PASL signal detection in each ROI was quantified using the same paradigm as proposed in van Osch et al. 2009, treating each repetition at a TI as a sample and all the collected repetitions as a distribution of CBF-weighted signal samples. 13 This distribution was used to perform a one-sample, one-sided t-test against the null hypothesis of zero CBF detected. The t-statistic at each TI was calculated to generate a t-statistic time series of detectability in each voxel. The voxel-wise t-statistic time series was then averaged within each ROI to obtain the t-statistic time series within the ROI. The significance threshold of CBF detected as the t-statistic corresponding to p < 0.05 was then calculated. Time series data were plotted and assessed on the group-level for each region. A region was considered significantly detected in the group if the group mean t-statistic minus one standard deviation was above the p < 0.05 threshold.
In the Bayesian probabilistic fitting procedure, CBF is output as a mean (final estimate) and variance. 25 The square root of the variance was calculated to obtain the standard deviation of the estimate fit. The standard deviation is a representation of the uncertainty of the model fit in each voxel and the standard deviations were compared between controls and SCD patients in all ROIs described above.
CBF and BAT were averaged within each ROI and compared between SCD patients and age-matched controls using Wilcoxon Rank-Sum tests. Evaluating the whole tissue relationships between CBF and BAT with hematocrit was performed with Spearman correlation with significance criterion defined as two-sided p < 0.05.
Results
Participants
In total, 52 SCD patients and 15 age-matched controls were enrolled and of these, 35 SCD patients (age = 28 [range = 25–35] years; sex = 51.1% male) and 15 controls (age = 28 [range = 25–34] years; sex = 53.3% male) met inclusion criteria and completed all aspects of the protocol. Age and sex were not significantly different between the groups (age: p = 0.77; sex: p = 0.90) as summarized in Table 1.
Summary of demographics, hematological and hemodynamic variables along with statistical results when relevant. Age is given as a median with inter-quartile range in parentheses.
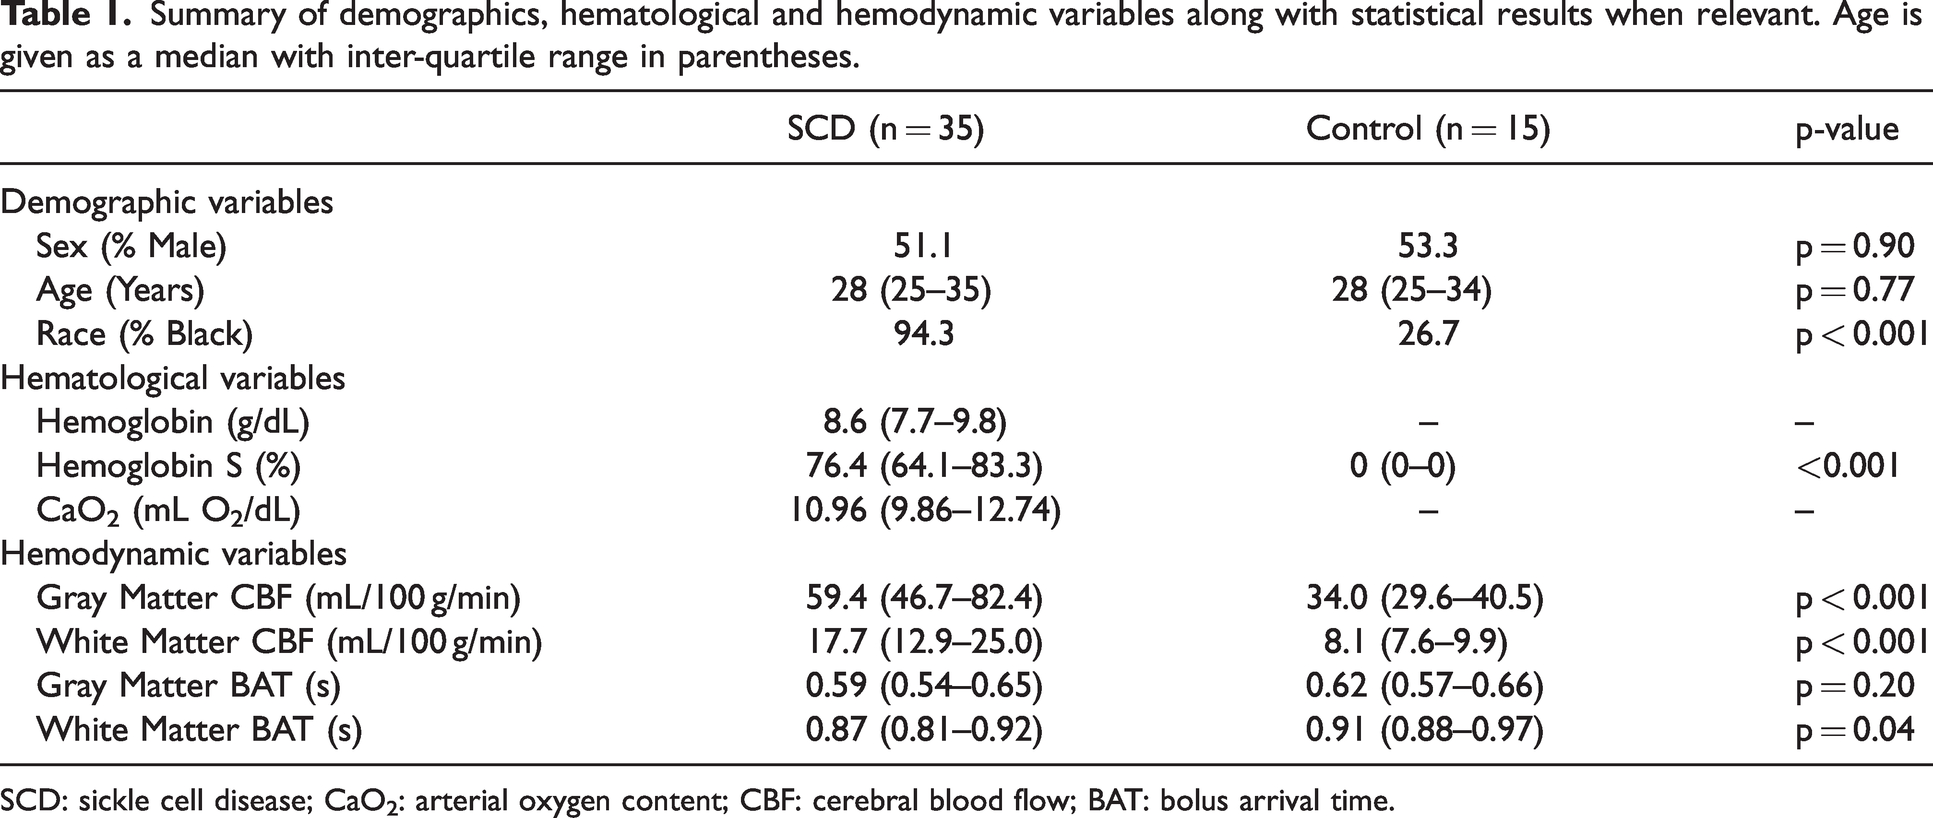
SCD: sickle cell disease; CaO2: arterial oxygen content; CBF: cerebral blood flow; BAT: bolus arrival time.
Cerebral blood flow and bolus arrival time
Group mean CBF and BAT maps are shown in Figure 1(c) and (d). CBF was observed to be significantly elevated in SCD patients across all tissues and flow territories, as expected. As is common in ASL acquired with a 2D EPI readout, data were obtained from a 3 × 3 × 7 mm (volume = 63 mm3) voxel and therefore the voxel estimate may contain partial volume effects from multiple tissue types and partial volume correction procedures were implemented here. 27 The CBF values for SCD (GM = 59.4 [range =46.7–82.4] mL/100 g/min; WM = 17.7 [range = 12.9–25.0] mL/100 g/min) and control (GM = 34.0 [range = 29.6–40.5] mL/100 g/min; WM = 8.1 [range = 7.6–9.9] mL/100 g/min) participants are shown in Figures 2(a) and (b). BAT was measured to be significantly shorter in the total WM, WM ACA-MCA borderzone region, and WM MCA flow territory as shown in Figure 3.
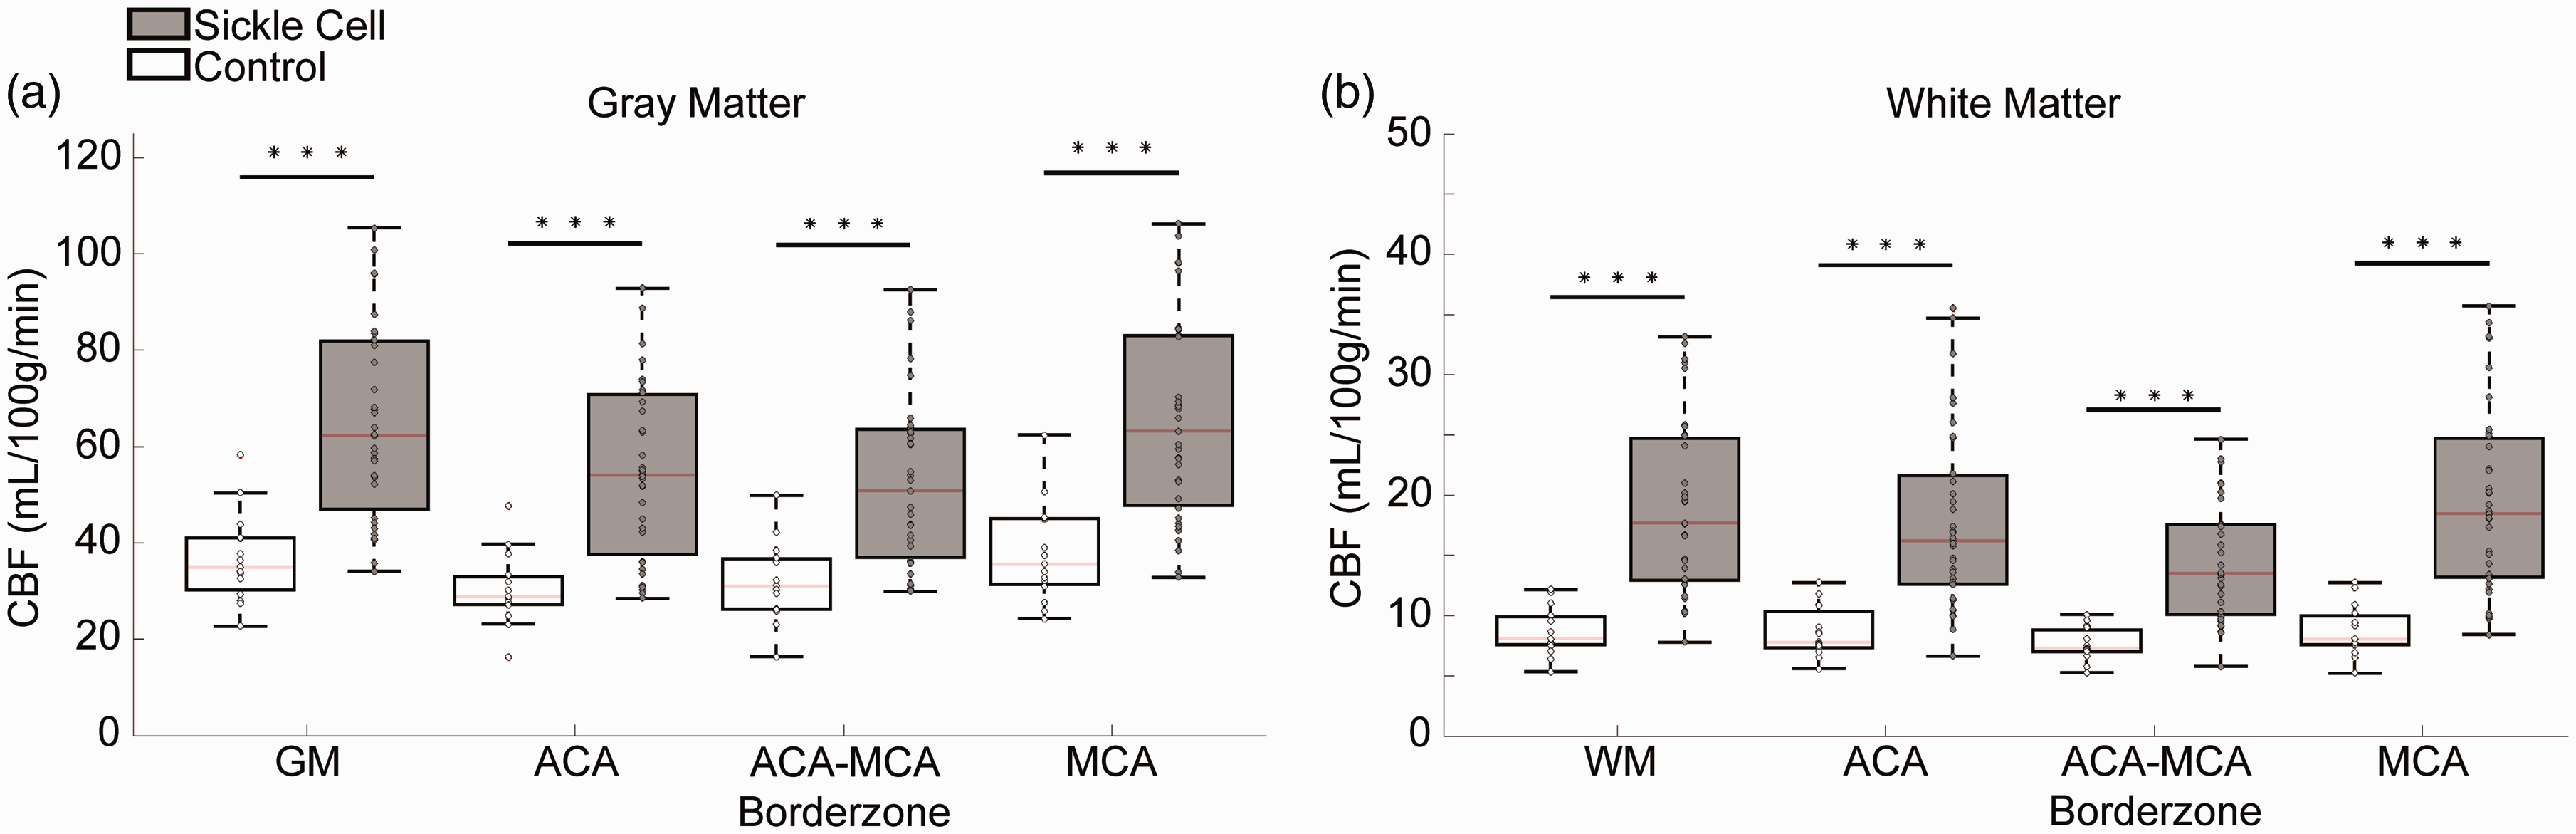
Summary of cerebral blood flow (CBF) in sickle cell disease patients (gray) and age-matched controls (white) in gray matter (a) and white matter (b) across all flow territories measured. The red line denotes the median, the upper and bottom lines of the boxplot the 75th and 25th percentile, and the whiskers extend to all data not meeting outlier criteria. Compared to controls, sickle cell disease patients have a greater variance in CBF owing to a greater difference in clinical trajectories. *p < 0.05, **p < 0.01, ***p < 0.001.
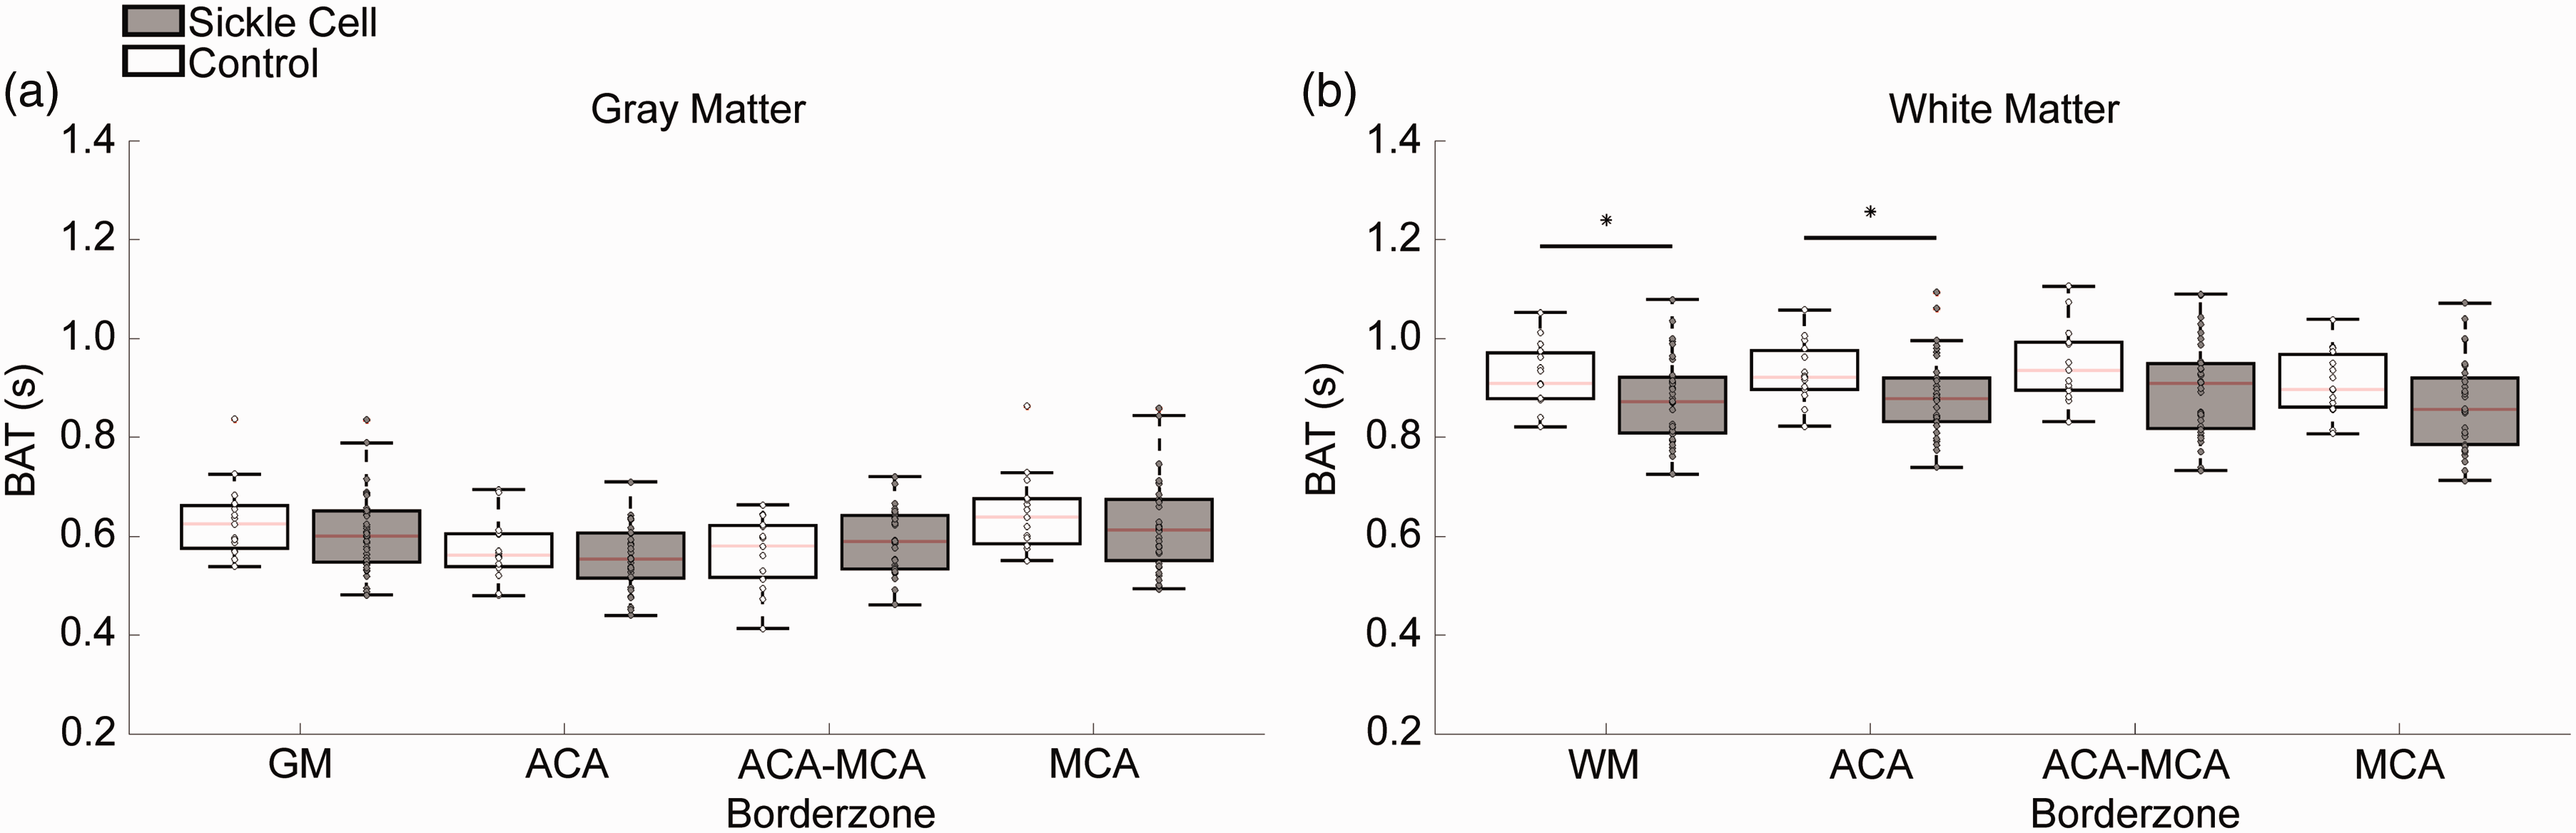
Summary of bolus arrival time (BAT) in sickle cell disease patients (gray) and age-matched controls (white) in gray matter (a) and white matter (b) across all flow territories measured. The red line denotes the median, the upper and bottom lines of the boxplot the 75th and 25th percentile, and the whiskers extend to all data not meeting outlier criteria. *p < 0.05.
The total WM CBF-weighted signal was observed to be detectible in both groups for at least one TI, as shown graphically in Figure 4(a) and (b). In controls, total WM CBF-weighted signal was only detected at TI = 1400 ms, while in SCD patients total WM CBF signal was detected over the range of TI = 800–1800 ms. Further, in the ACA-MCA borderzone region of the WM, there was no TI at which the CBF-weighted signal was detected in controls while in SCD patients the WM borderzone region CBF-weighted signal was significantly detected at TI = 1400 ms only. Fractions of voxels detected in each ROI and group are shown in Figure S2 of Supplementary Material.
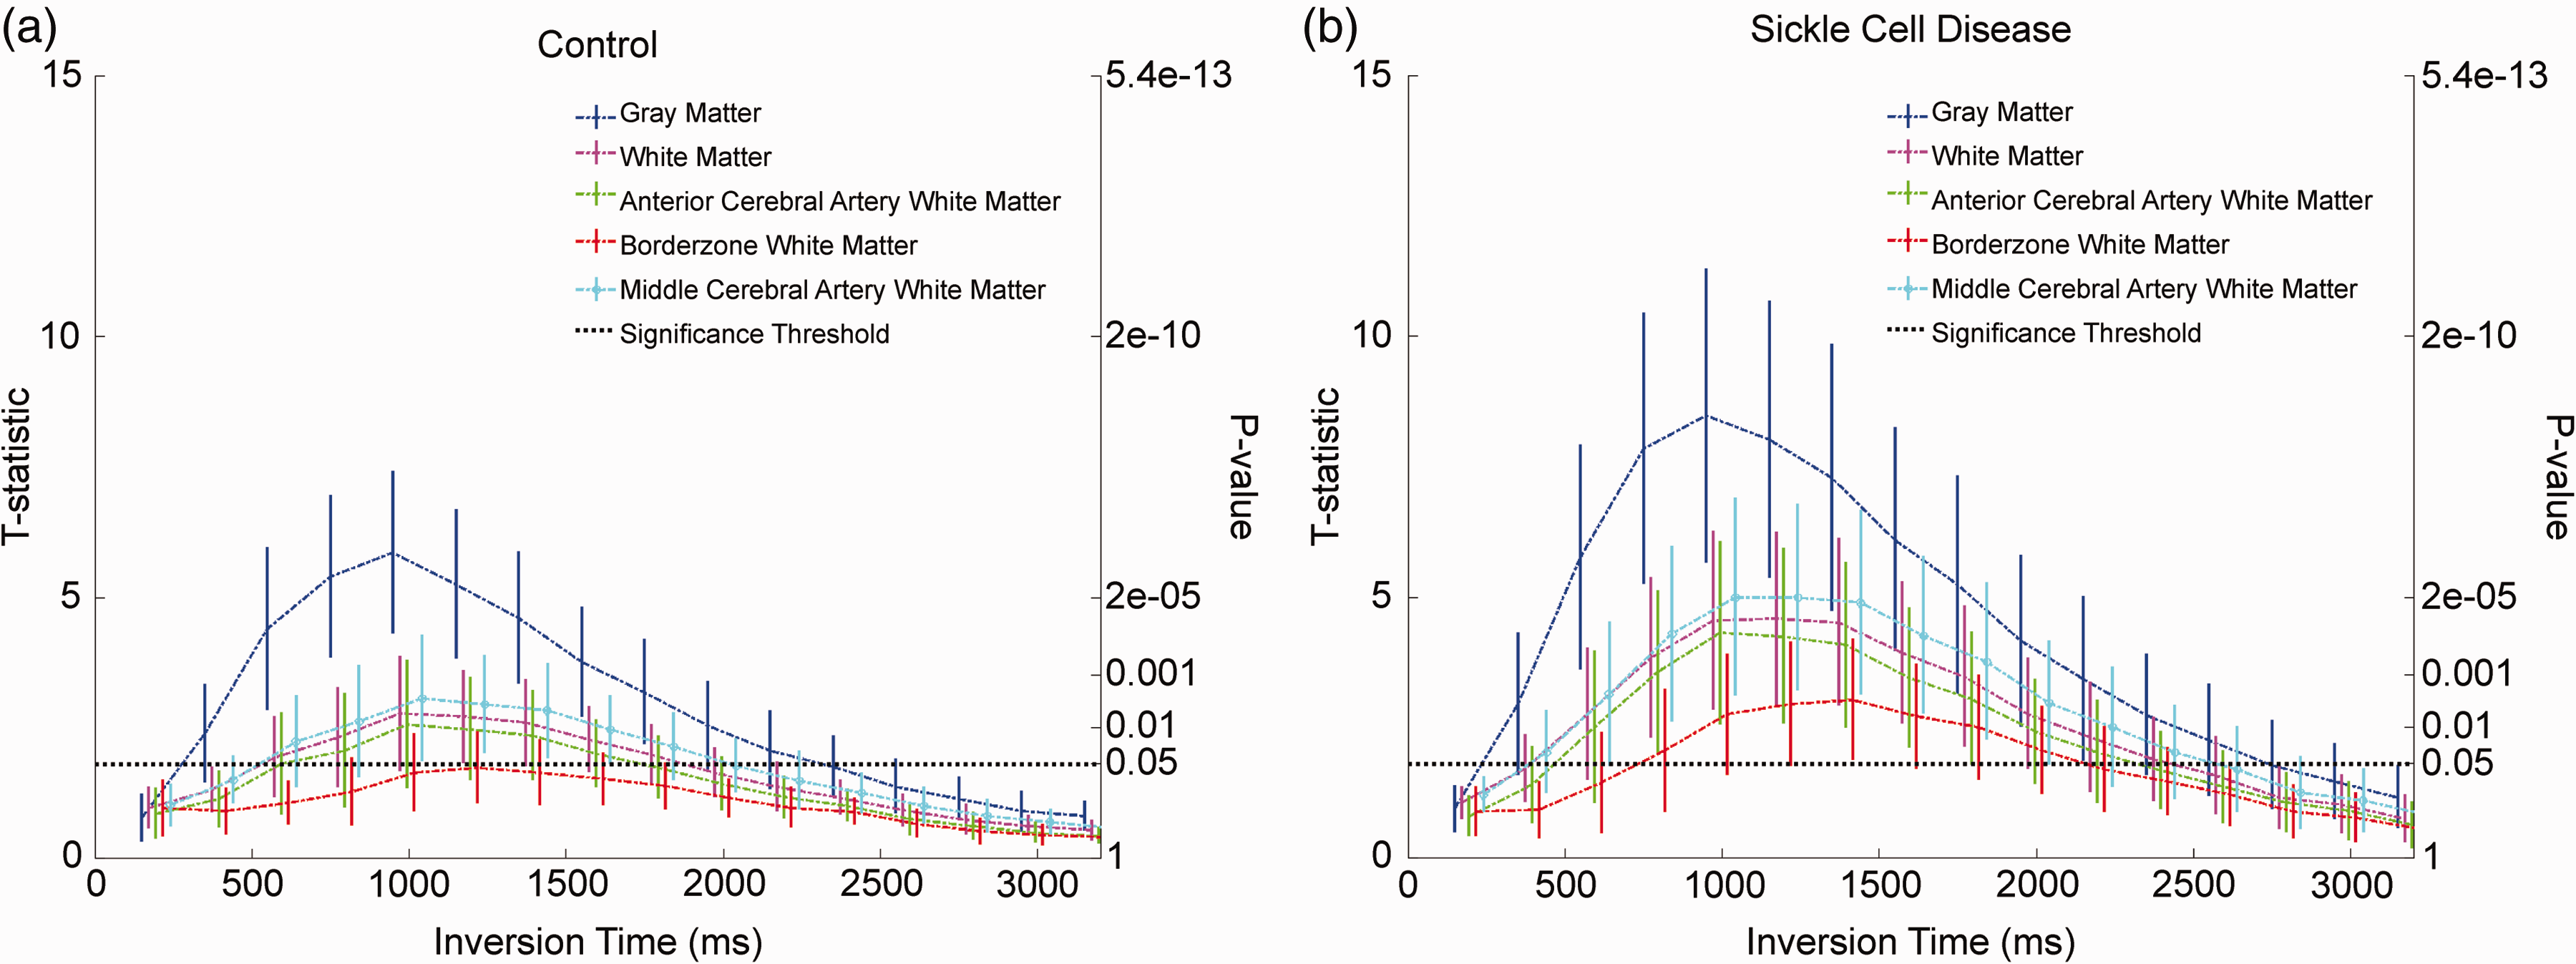
Control (a) and sickle cell disease (b) group level time series plots of t-statistics averaged over each region of interest (ROI) for each inversion time (TI). Plot Corresponding p-values are plotted on the right vertical axis for each group plot. The dot-dashed lines are the mean of each group, while the error bars at each TI depict the standard deviation within the group in the ROI at the TI. The dashed horizontal line signifies the p = 0.05 significance level for each plot.
CBF estimate standard deviation was significantly greater in SCD patients relative to controls in all ROIs measured, as summarized in Figure 5(a). Further, the group differences between the CBF standard deviation were greater in the WM versus GM.
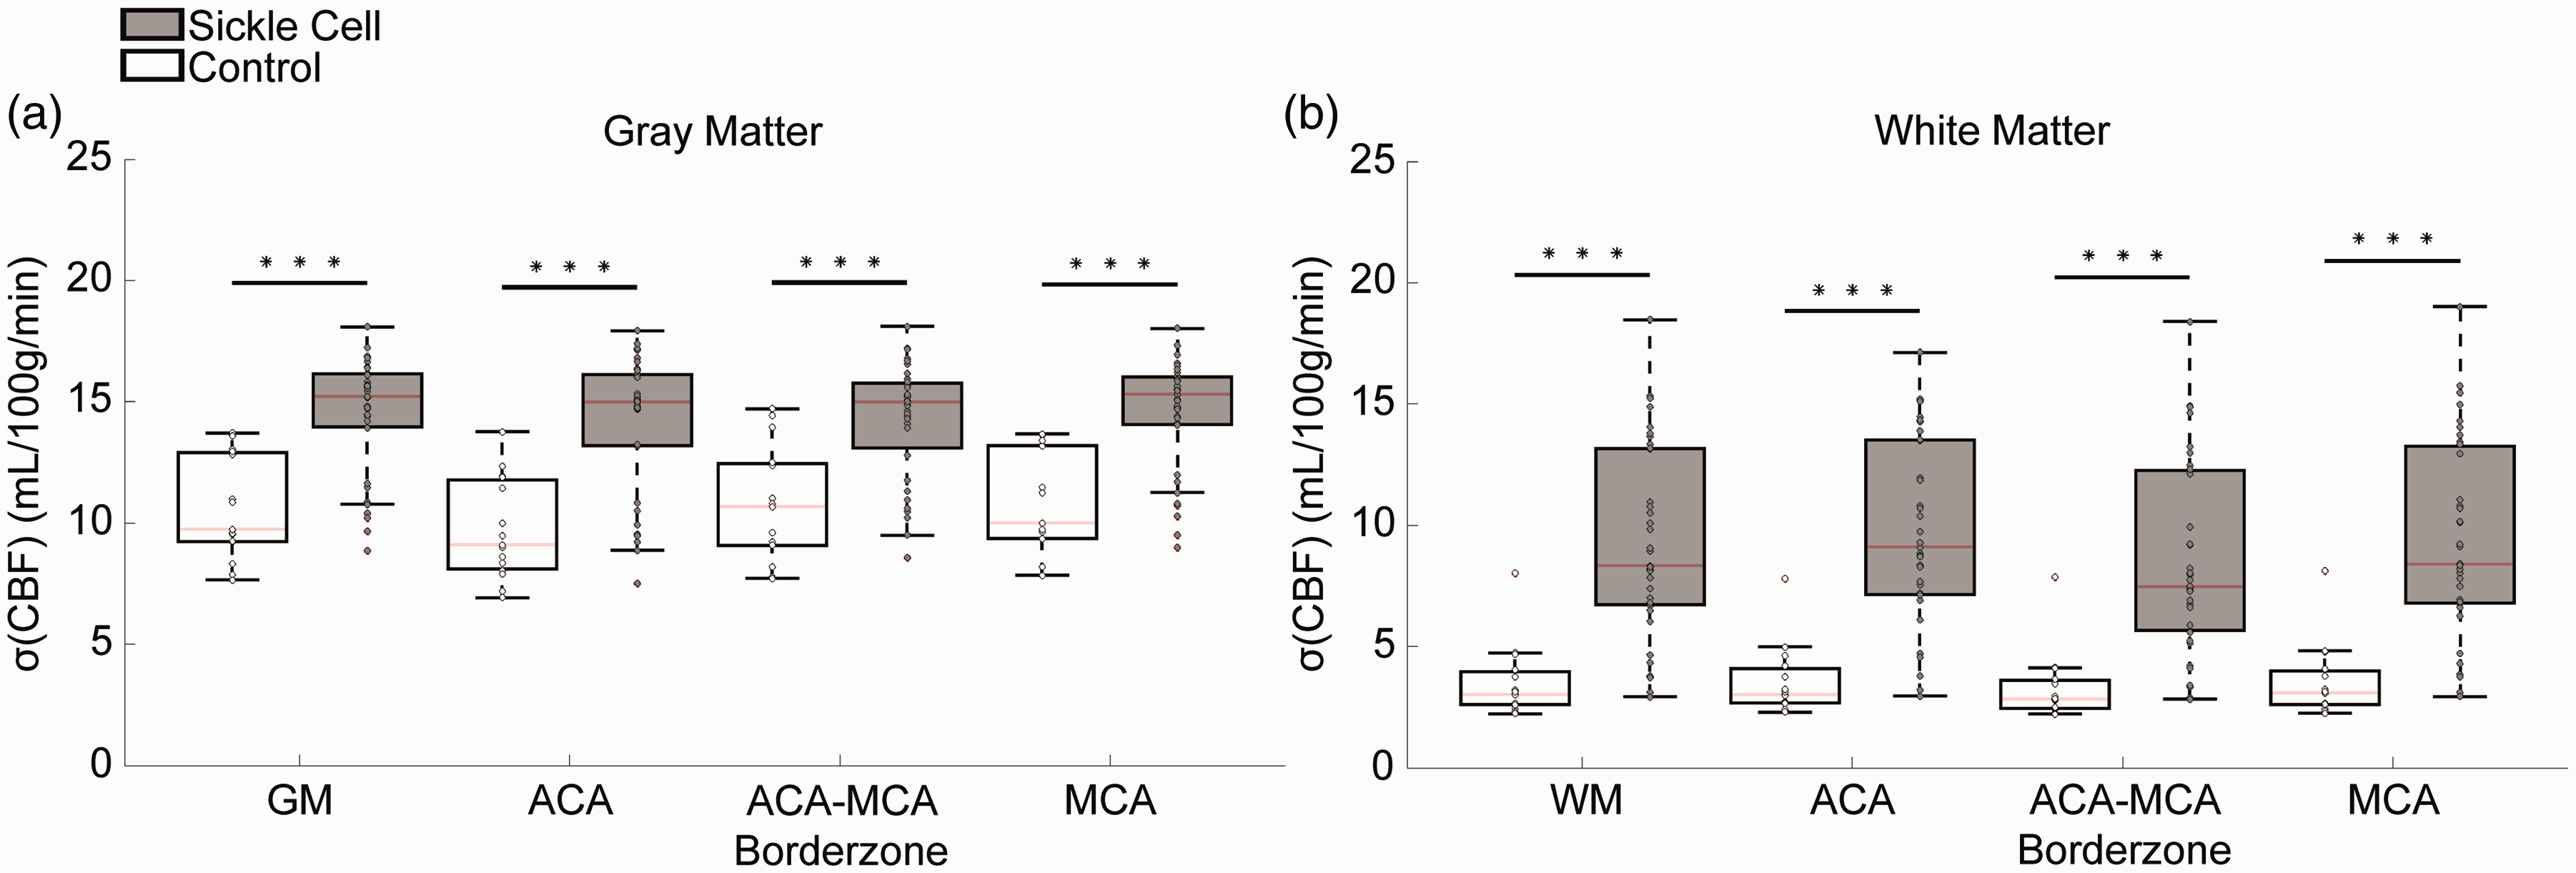
Summary of standard deviation of cerebral blood flow model estimates in sickle cell disease patients (gray) and age-matched controls (white) in gray matter (a) and white matter (b) across all flow territories measured. The red line denotes the median, the upper and bottom lines of the boxplot the 75th and 25th percentile, and the whiskers extend to all data not meeting outlier criteria. *p < 0.05, **p < 0.01, ***p < 0.001.
Finally, no relationship that met significance criteria was observed between hematocrit and CBF in the GM (Figure 6(a); p = 0.52) or WM (Figure 6(b); p = 0.60) in SCD participants over the hematocrit range of 15–32%. However, a significant relationship between hematocrit and BAT was observed in the GM (Figure 6(c); p = 0.01) and WM (Figure 6(d); p < 0.001), consistent with BAT being more closely related to hematocrit than CBF in SCD.
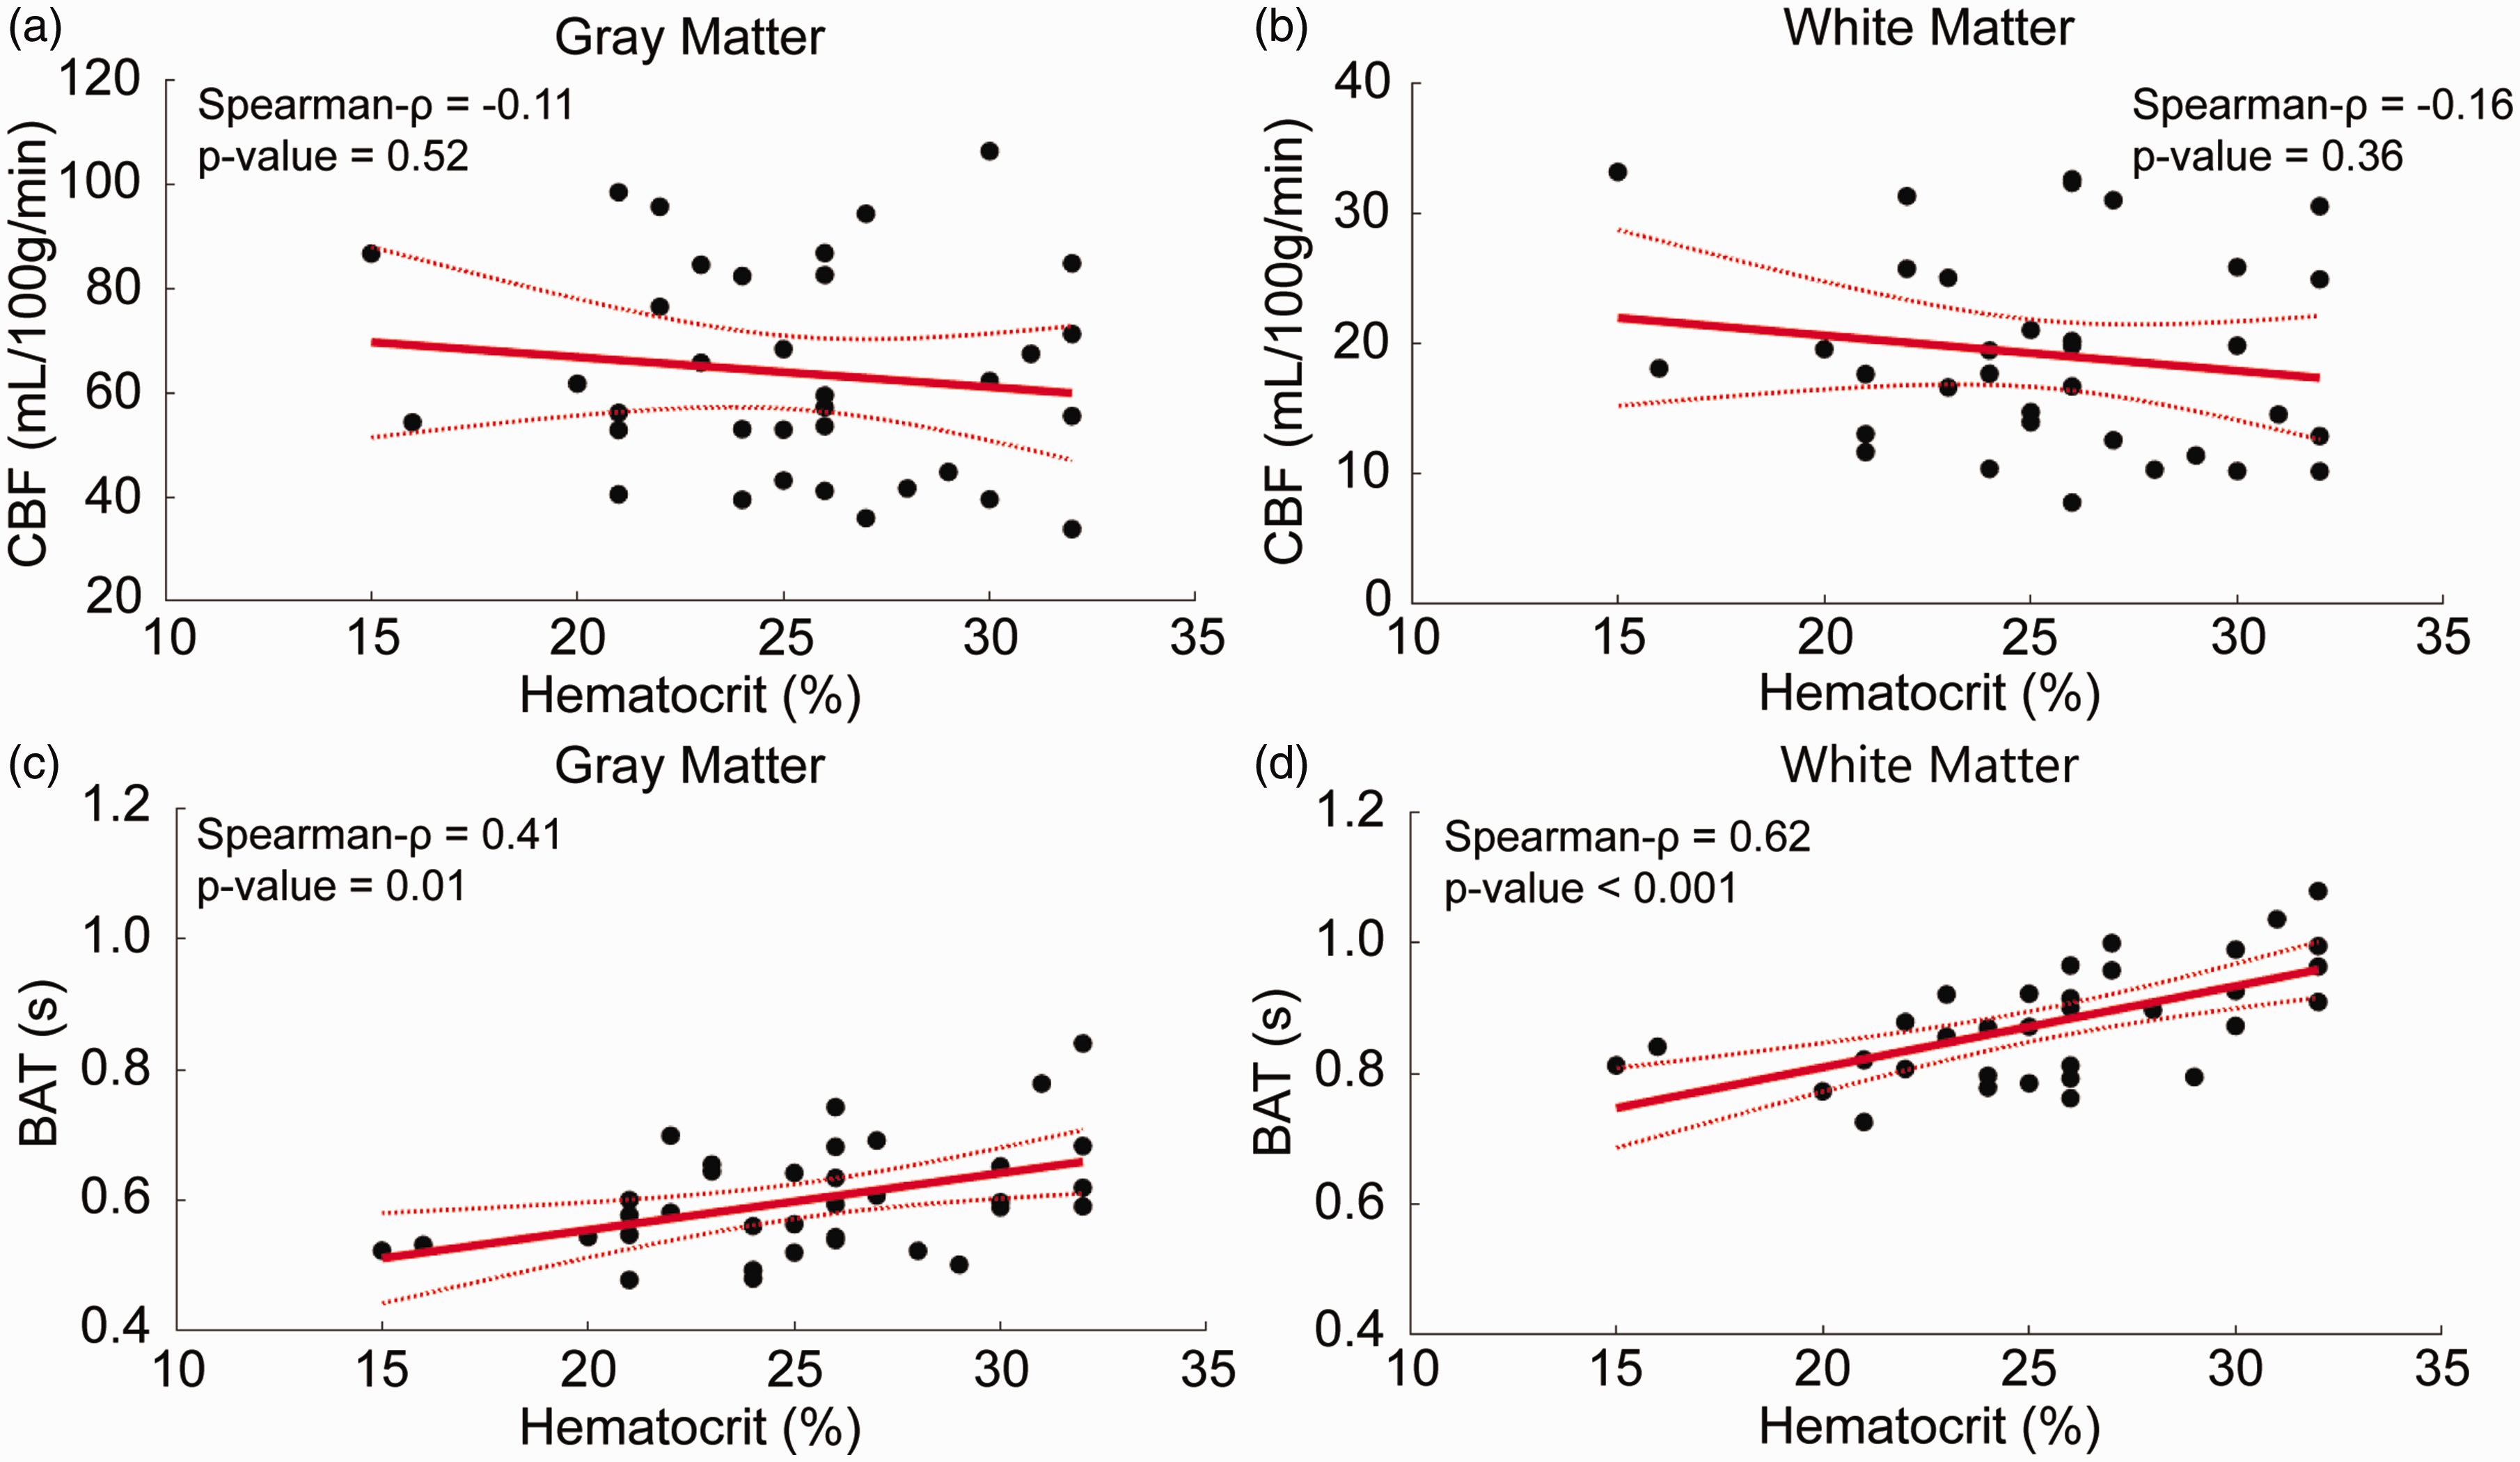
Relationships between pulsed arterial spin labeling (PASL) hemodynamics and hematocrit in sickle cell disease patients. Non-significant relationships plotted between gray matter cerebral blood flow (CBF) (a) and white matter CBF (b). Significant relationships plotted between gray matter bolus arrival time (BAT) (c) and white matter BAT (d).
Discussion
This study aimed to determine the feasibility of detecting WM CBF in anemic (HbS or HbSB0 SCD) and non-anemic (age matched HbAA) participants. It was observed that total WM CBF was approximately 2.2-fold higher than WM CBF in SCD relative to non-anemic control participants, however, WM BAT was only 1.1-fold lower in SCD relative to non-anemic control participants. Additionally, the CBF-weighted signal was more detectable in SCD patients relative to controls in the WM, as evidenced by the fact that CBF-weighted signal was significantly detected at six TIs in SCD patients but only one TI in controls. These findings taken together suggest that the increased detectability of WM CBF in SCD using ASL MRI is more attributable to the large increase in CBF signal, rather than a smaller reduction in BAT. The standard deviation of the model estimate of CBF was greater in SCD patients than age-matched controls, suggesting increased variability in SCD hemodynamics than in control participants. Finally, we observed that estimated GM and WM BAT were both more tightly related to total hematocrit than GM or WM CBF in the cohort investigated.
Increased cerebral blood flow and decreased bolus arrival time in sickle cell disease
Our findings confirm previous ASL findings of increased GM and WM CBF in SCD patients relative to age-matched controls.2,3,9,28 As shown in Figure 2(b), the median difference between the two groups in the ACA-MCA borderzone WM CBF (6.3 mL/100 g/min) is smaller than CBF in other regions of the WM (ACA: 8.4 mL/100 g/min, MCA: 10.4 mL/100 g/min, whole WM: 9.6 mL/100 g/min), which is intriguing given that the ACA-MCA borderzone is where SCIs preferentially develop in SCD patients, as well as in adults generally.9,29 However, CBF interpretation in this region, while more promising in SCD as shown here, remains relatively unreliable given the longer BAT and lower CBF in this region.
It should be noted that WM CBF detectability was increased in SCD, however, the BAT in WM was relatively similar between both control (range = 0.87–0.92 s) and SCD (0.88–0.97 s) participants. The BAT values found in this study are within the same range of WM BAT values reported in 33 controls using a separate Look-Locker PASL sequence (BAT = 0.92 ± 0.15 s). 30 Control WM CBF values reported in that study (10.1 ± 2.1 ml/100 g/min) were within 2 ml/100 g/min of the WM CBF observed in this study (8.7 ± 2.0 mL/100 g/min). 30 As such, control values reported here are approximately consistent with other prior studies using similar methods. However, as WM CBF has also been reported to be slightly higher using other sequences or modalities, it is also possible that factors related to the faster Look-Locker readout may lead to lower CBF values.
To our knowledge, Stotesbury et al. 2022 is the only other study to use multi-TI PASL to characterize hemodynamics in SCD patients. 28 Both this study and Stotesbury et al. 2022 observed shortened WM BAT in patients with SCD compared to non-anemic controls. However, this study did not observe significantly shortened gray matter BAT, which may be partly attributable to alternative labeling and modeling. Specifically, the prior study used a non-linear fit of Buxton’s three stage kinetic model with no intravascular component to model the arterial signal at earlier TIs, which could lead to a higher quantified CBF value, and decreased quantified BAT value, in voxels with larger arterial blood volume. Additionally, Stotesbury et al. 2022 labeled more distally, allowing more time for differences in blood velocities to impact BAT. A similar phenomenon may underlie why differences in BAT in the WM were detected here, as BAT is slightly longer in the WM and differences may be more readily detectable.
When compared to pCASL, PASL can yield shorter BAT due to a labeling plane more proximal to the imaging volume, although this depends on the location of labeling plane which can vary across studies. To our knowledge, the only multi-post labeling delay pCASL study in SCD patients, Juttukonda et al. 2016, 3 used a more sparse sampling rate (this study: 5 TIs per second; Juttukonda et al. 2016: 3.3 TIs per second) and labeled lower at the approximate level of the cervical or petrous ICA for a longer duration. While that study did not report mean WM BAT, a GM BAT of 1.01 s in SCD patients and 1.14 s in controls were reported, longer than the BAT found in this current study (SCD GM BAT = 0.60 s; Control GM BAT = 0.63 s). Much of this discrepancy is likely due to the labeling in the current study being performed intracranially and closer to the imaging volume (Figure 1(a)), across more distal aspects of the pre-capillary vasculature. It is logical that transit times would be different by several hundred milliseconds or more when labeling is performed more proximally. The comparison of these BAT results illustrates that PASL and pCASL data may not always be directly comparable. Given the closer proximity between the labeling plane and imaging volume here, the mean GM BAT in our SCD patient cohort was measured to be 1.7 times faster than the BAT found in SCD patients in Juttukonda et al. 2016 with pCASL. 3 Wu et al. 2013 found WM CBF quantification to be feasible with pCASL using longer labeling durations, shorter post-labeling delays, and additional repetitions, indicating that pCASL is also relevant for WM CBF assessment. 15
This study utilized a 2D Look-Locker EPI readout, with a flip angle = 40°, and the time between Look-Locker readouts (TI2) was 400 ms making the T1app,eff = 667 ms for this sequence (equation (2)). The flip angle used in this study (40°) is larger than the flip angle optimized in previous work by Günther et al. 2001 (25°). 23 However, the TI2 prescribed in Günther et al. was also different at 100 ms, yielding a T1app,eff =540 ms, which is similar to the T1app,eff in our study. However, the present study did not optimize Look-Locker flip angle parameters specifically and future studies could further optimize the Look-Locker readout parameters to increase perfusion signal SNR.
One advantage of the Look-Locker readout approach is temporal efficiency as we acquired 16 TIs with 25 averages each in under 7 min. Other readouts may also offer good efficiency, albeit with different tradeoffs. 3D GRASE modules, which have higher SNR, may also be beneficial and are worth considering; however, these methods require segmented readouts to reduce signal smearing in the phase-encode direction, and as a result, they often require similar amounts of time as more heavily averaged single-shot 2D EPI readouts. The purpose of this study was simply to measure the detectability for different post-label delays and quantify differences between healthy and anemic parameters. Future work is required to determine how the temporal efficiency benefits of a 2D EPI Look-Locker readout compare with the increased SNR benefits of 3D GRASE in terms of reliability, repeatability and quantification for WM CBF. Time-encoded pCASL labeling could also be employed as an alternate method to increase the temporal efficiency of a pCASL sequence by reducing the number of acquisitions required to the number of post labeling delays used plus one. 31 Recently, a time-encoded labeling scheme and 2D Look-Locker EPI readout was used to acquire 28 TIs in a 10 minute 30 second acquisition. 32 Future studies that build on these findings to refine multi-delay labeling and readout schemes for WM CBF in SCD should be pursued.
White matter cerebral blood flow detectability
It was observed that PASL CBF-weighted signal in the total WM ROI was reliably detectable averaging across 25 repetitions in both groups at TI = 1400 ms. However, in anterior territory borderzone regions of the WM, CBF was only significantly detected in SCD patients at TI = 1400 ms indicating that PASL sequences parameterized to detect WM perfusion should employ a TI of approximately 1400 ms or center a range of TIs on 1400 ms, if the labeling paradigm is similar. Our findings in controls mirror those from Wu et al. 15 that much of WM CBF is feasible to measure with 3.0 T ASL, however, certain regions are unreliable in controls due to low SNR. Given the feasibility of WM CBF detection in age-matched controls, with further sequence optimizations WM CBF detection could be more viable than previously appreciated in controls. An additional caveat to note is that the findings here report mean values across different flow territories. Detectability will be reduced when single voxel analysis is considered and care should be taken when interpreting WM CBF values in single voxels.
Standard deviation of cerebral blood flow and bolus arrival time model estimates
Model CBF estimate standard deviation was greater in SCD patients in each ROI measured, and the BAT estimate standard deviation was greater in several GM ROIs in SCD patients relative to controls. SCD patients have been found to have elevated pulse pressure (difference between systolic and diastolic blood pressure) relative to sickle cell trait peers. 33 Flow velocities are also associated with the phase of the cardiac cycle, becoming elevated during peak systole, and depressed during diastole. Due to this dependency, Wu et al. 2007 34 found that CBF quantification was biased by labeling synchronously with the cardiac cycle. Specifically, CBF was measured to be higher when labeling during systole and lower when measured with labeling during diastole. This evidence, taken with prior studies finding increased pulse pressure in SCD patients, could be one explanation for the increased CBF and BAT model estimate standard deviation found in this study.
Hemodynamics and hematocrit in sickle cell disease
This study observed a significant relationship between BAT in both the GM and WM with hematocrit, but no significant relationship between CBF and hematocrit over the range of hematocrit considered in SCD participants. However, a trend consistent with the literature28,35 was observed. It is likely that the range of hematocrit considered here in SCD patients was not sufficiently large to yield a significant finding, or the study was not appropriately powered to observe this relationship over the somewhat narrow hematocrit range. Decreased transit times related to hematocrit could be due to vascular resistance changes, increased cardiac output 36 or the inherent decrease in viscosity accompanying a decrease in hematocrit.37,38
This observation is relevant to consider in the context of emerging theories of SCD pathophysiology. Decreased CBF can limit oxygen delivered to the tissue, especially under anemic conditions of low oxygen carry capacity. 7 It has also been hypothesized that elevated capillary blood flow velocities could limit cerebral oxygen delivery to tissue by limiting the amount of time blood has to offload oxygen to the tissue within the capillary bed. 39 Here, it was observed that decreased hematocrit is related to decreased BAT. This suggests, but does not confirm, that capillary flow velocities are also elevated in response to decreased hematocrit. This phenomenon could work paradoxically to further limit the oxygen extraction of the tissue from the blood under the capillary shunting hypothesis and is a topic of separate study.39 –41
Importance of white matter cerebral blood flow quantification in sickle cell disease
Optimizing accurate quantification of WM CBF is likely critical to understanding infarct risk in SCD patients, since the majority of SCIs in SCD patients occur in the WM borderzone, a region which has previously been determined to be unreliable for measuring perfusion with ASL. 9 This was the impetus for the present study to focus specifically on frontal and parietal WM. The findings here support that borderzone WM CBF detection is feasible with PASL when sampled over an appropriate TI range in SCD patients. By using a sequence optimized to estimate CBF and BAT accurately, routine borderzone CBF over sufficiently large regions may be feasible and could serve as a biomarker for the prediction of silent and overt infarcts in SCD patients.
Limitations
Several limitations should be considered when interpreting these findings. First, the spatial resolution (3 × 3 × 7 mm) utilized will afford partial volume effects, especially across the relatively thin GM ribbon (approximately 3 mm cross-sectionally). 42 As with other ASL studies, this results in voxels containing both WM and GM, and in some cases CSF. Partial voluming is also an issue in superficial WM, where voxels could contain additional tissue types depending on location. We performed partial volume correction here and applied partial volume estimation thresholds, however it is challenging to mitigate these effects completely at the spatial resolution of ASL. For these reasons, GM CBF is likely underestimated relatively to pure GM CBF and WM near the WM-GM interface may be overestimated. Second, successful detection is a pre-condition for reliably quantifying WM CBF and BAT. To appropriately test reliability, a future study would need to perform at least two measurements to assess the test-retest reliability of CBF and BAT quantification within a session in various WM ROIs, as well as to potentially cross-validate against an independent measure from a different modality. Third, we used an arterial territory atlas from a previous study, as opposed to measuring the flow territories with vessel-selective ASL which would produce a more specific map of flow territories in each individual.21,43 Fourth, due to limitations in scan duration, we scanned primarily over anterior flow territories where SCIs are most prevalent. For this reason, the PCA flow territory was removed because in many of the participants the field of view did not cover the posterior cerebral artery flow territory in the WM or GM. Removal of the PCA territory could have potentially affected our whole tissue estimates of CBF and BAT by reducing mean CBF and shortening mean BAT, as PCA territory is known to typically have longer BAT but higher CBF.44,45 Fifth, the relationship between CBF and hematocrit could be complicated by the dependence of blood T1 on hematocrit. CBF quantification is directly dependent on the estimate of blood T1 relaxation (See equation (2)) and blood T1 is dependent on the hematocrit of an individual, requiring estimation based on a previously determined calibration curve. 22 A different scaling formula for blood T1 could result in a significant correlation between hematocrit and CBF. Sixth, the quantified WM CBF values in both groups were lower compared to prior studies in both controls and SCD patients.7,29,46 In controls, this is explained by relatively unreliable signal detection as depicted in Figure 4(a). A further explanation of the low quantified CBF in the WM is that we assumed labeled blood water was only affected by the Look-Locker pulses when it entered the tissue. If the blood water were affected by the Look-Locker in transit to the tissue, its T1 decay would be shortened, decreasing the arriving labeled signal in the tissue; modeling this effect requires a high level of speculation regarding transit times and as such was not conducted here. Lastly, while matched for age and sex, our control cohort was not matched for race with our SCD cohort and we cannot eliminate race as a possible contributor to cohort differences.
Conclusion
This study supports the hypothesis that white matter cerebral blood flow is detectable in sickle cell disease patients using an appropriately parameterized arterial spin labeling sequence. Since infarct incidence is highest in the white matter in sickle cell disease patients, this knowledge should help to expand the hemodynamic imaging infrastructure for future prospective longitudinal studies that aim to assess cerebral blood flow and bolus arrival time in sickle cell disease patients at risk for new or recurrent cerebral infarction.
Supplemental Material
sj-pdf-1-jcb-10.1177_0271678X241270283 - Supplemental material for Detectability of white matter cerebral blood flow using arterial spin labeling MRI in patients with sickle cell disease: Relevance of flow territory, bolus arrival time, and hematocrit
Supplemental material, sj-pdf-1-jcb-10.1177_0271678X241270283 for Detectability of white matter cerebral blood flow using arterial spin labeling MRI in patients with sickle cell disease: Relevance of flow territory, bolus arrival time, and hematocrit by Wesley T Richerson, Megan Aumann, Alexander K Song, Jarrod J Eisma, Samantha Davis, Lauren Milner, Maria Garza, L Taylor Davis, Dann Martin, Lori C Jordan and Manus J Donahue in Journal of Cerebral Blood Flow & Metabolism
Footnotes
Funding
The author(s) received no financial support for the research, authorship, and/or publication of this article.
Declaration of conflicting interests
The author(s) declared the following potential conflicts of interest with respect to the research, authorship, and/or publication of this article: MJD receives research related support from the National Institutes of Health (NINDS, NCI, NIA, NCCIH, NINR, and NHLBI), Philips Healthcare, Pfizer Inc and is a paid consultant for Graphite Bio, Pfizer Inc, Global Blood Therapeutics, Woolsey Pharmaceuticals, Alterity Pharmaceuticals, and LymphaTouch. He is a paid advisory board member for Pfizer Inc, Novartis and bluebird bio and is the CEO of Biosight Inc which operates as a clinical research organization. These agreements have been approved by Vanderbilt University Medical Center in accordance with its conflict of interest policy.
Authors’ contributions
Wesley T Richerson: Involved in study conception and design, data acquisition, analysis and interpretation of data, and manuscript drafting and revision. Megan Aumann, Alex K Song: Involved in data acquisition, interpretation of data, and manuscript revision. Jarrod J Eisma: Involved in data acquisition, and manuscript revision. Samantha Davis, Lauren Milner, and Maria Garza: Involved in data acquisition. L Taylor Davis and Dann Martin: Involved in radiology review of images for pathology. Manus J Donahue and Lori C Jordan: Involved in study conception and design, analysis and interpretation of data, and manuscript revision.
Supplementary material
Supplemental material for this article is available online.
References
Supplementary Material
Please find the following supplemental material available below.
For Open Access articles published under a Creative Commons License, all supplemental material carries the same license as the article it is associated with.
For non-Open Access articles published, all supplemental material carries a non-exclusive license, and permission requests for re-use of supplemental material or any part of supplemental material shall be sent directly to the copyright owner as specified in the copyright notice associated with the article.