
Abstract
Two complimentary techniques were used to estimate occupancy of pimavanserin (a selective 5-HT2A/2C inverse agonist) to 5-HT2A and 5-HT2C receptors in non-human primate brains. One employed the 5-HT2A/2C selective radioligand [11C]CIMBI-36 combined with quantification of binding potentials in brain regions known to be enriched in 5-HT2A (cortex) or 5-HT2C (choroid plexus) receptors to estimate occupancy. Pimavanserin was 6–10 fold more potent displacing [11C]CIMBI-36 from cortex (ED50 = 0.007 mg/kg; EC50 = 0.6 ng/ml) than from choroid plexus (ED50 =0.046 mg/kg; EC50 = 6.0 ng/ml). The assignment of [11C]CIMBI-36 binding to 5-HT2A and 5-HT2C receptors by anatomical brain structure was confirmed using the 5-HT2A selective inverse agonist MDL 100,907 and the 5-HT2C selective antagonist SB 242584 to displace [11C]CIMBI-36. The second technique employed a novel, 5-HT2C selective tracer called [11C]AC1332. [11C]AC1332 bound robustly to choroid plexus, moderately to hippocampus, and minimally to cortex. Pimavanserin displaced [11C]AC1332 with similar potency (ED50 = 0.062 mg/kg; EC50 = 2.5 ng/ml) as its potency displacing [11C]CIMBI-36 binding from choroid plexus. These results demonstrate the feasibility of simultaneously estimating drug occupancy of 5-HT2A and 5-HT2C receptors in vivo, and the utility of a novel 5-HT2C receptor selective tracer ligand.
Introduction
The 5-HT2C receptor (5-HT2CR) is an important target for neuropsychiatric drug action. 1 Preclinical studies have demonstrated that 5-HT2CRs regulate dopamine release in the brain, and modulation of 5-HT2C activity is linked to appetite control, 2 regulation of mood, 3 anxiety and stress response, 4 and addictive behaviors. 5 A large number of antipsychotics, antidepressants and anxiolytics have substantial 5-HT2CR affinity. 6 Lorcaserin (Lorqess; Belviq), a selective 5-HT2C receptor agonist, was approved by the FDA in 2012 for the treatment of obesity. 7
The role of 5-HT2CRs in drug action and clinical effect remains poorly defined. One reason for this is the lack of selective PET ligands to quantify drug binding to 5-HT2CRs in vivo. Thus, the major goal of this study was to demonstrate feasible methods to quantify drug binding to 5-HT2CRs in vivo that would be translatable to human use. Two complementary approaches were employed. The first involved using a tracer called [11C]CIMBI-36 which is approved for use in humans, and has similar affinity for the 5-HT2A and 5-HT2CR in vitro, 9 and the second employed the use of an experimental, highly selective 5-HT2C tracer called [11C]AC1332 (listed as compound #18). 8 By studying both ligands we hoped to validate a tracer already approved for human use for quantifying drug occupancy of 5-HT2CRs and simultaneously demonstrate the potential utility of a novel 5-HT2CR selective tracer.
To study [11C]CIMBI-36, we relied on the principle that PET signal (reported as binding potential) is a function of both Bmax (receptor density) and KD (radioligand equilibrium dissociation constant), 9 and therefore when a ligand has appreciable specific binding to two targets, the fractional contribution of PET signal will be proportional to the Bmax/KD ratio of each target. For a radioligand with limited receptor selectivity, accurate quantification of a target in a specific region is possible if the relative density of the desired target within that region is significantly higher than that of competing targets. By using receptor subtype-selective unlabeled ligands, coupled with the known differential brain distribution of 5-HT2A and 5-HT2CRs, it was previously shown in non-human primates that [11C]CIMBI-36 binding could be assigned to each receptor subtype within discreet brain regions, specifically 5-HT2AR binding in the cortex and 5-HT2CR binding in sub-cortical regions, and particularly the choroid plexus. 10
To complement and validate studies with [11C]CIMBI-36, we repeated these studies using an experimental, highly selective 5-HT2C tracer called [11C]AC1332 which has high affinity for 5-HT2C receptors (Ki = 2.2 nM) and 100-fold or greater selectivity over other receptors including 5-HT2A/2B receptors (affinities for the different subtypes of 5-HT2 receptor were determined in HEK 293 expressing cloned human receptors as described previously8,11). Preliminary PET data with [11C]AC1332 has shown high uptake in the choroid plexus, with moderate uptake in hippocampus and amygdala, which was blocked with the 5-HT2CR selective antagonist SB 242084. 12 Despite the limited data on this tracer, its profile suggested it could be a valuable control for the studies with [11C]CIMBI-36 and itself potentially a tool for measuring drug binding to 5-HT2C receptors. The expectation was that [11C]AC1332 would primarily label binding sites in non-human primate brain regions like choroid plexus that express high levels of 5-HT2C receptors, with lower-level binding in regions like hippocampus that express mixtures of both 5-HT2A and 5-HT2C receptors, and little binding in brain regions like cortex that express mainly 5-HT2A receptors.
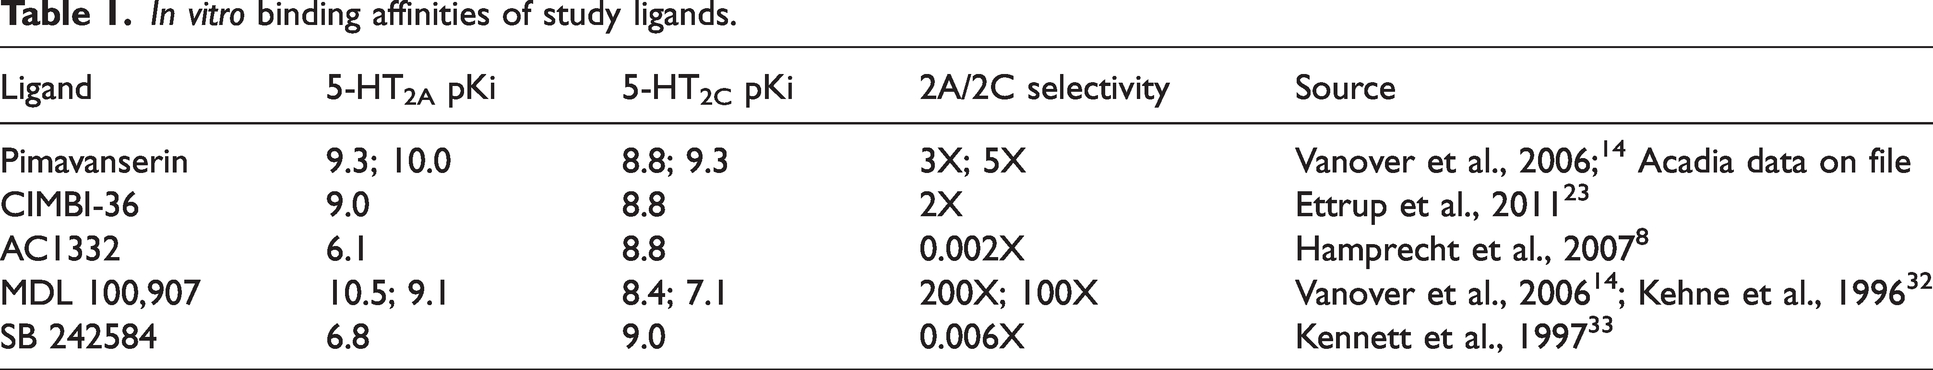
To evaluate both approaches, we studied pimavanserin as a candidate drug of interest. Pimavanserin is FDA approved for treating hallucinations and delusions in Parkinson’s disease and is a highly selective 5-HT2A inverse agonist with lesser, but appreciable affinity for 5-HT2C receptors, and no appreciable affinity for any other receptor targets.13,14 We chose pimavanserin because its receptor profile was ideal for testing our methodology for quantifying 5-HT2A and 5-HT2C receptor binding with one tracer, as well as demonstrating the potential utility of a novel, 5-HT2C selective tracer. We also employed unlabelled ligands with high selectivity for 5-HT2ARs (MDL 100,907) and 5-HT2CRs (SB 242084) to further validate and confirm binding patterns of [11C]CIMBI-36 and [11C]AC1332 in the non-human primate brain (see Table 1 for relative affinity of the study blocking compounds and ligands). Using these complimentary approaches, the feasibility of estimating drug binding to 5-HT2A and 5-HT2C receptors in vivo using [11C]CIMBI-36 as well as the potential utility of [11C]AC1332 for quantifying drug occupancy of 5-HT2C receptors in vivo is demonstrated below.
In vitro binding affinities of study ligands.
Material and methods
Preparation of [11C]MDL 100,907 and [11C]CIMBI-36
Unlabelled CIMBI-36 and its precursor (tert-butyl 4-bromo-2,5-dimethoxyphenethyl (2-hydroxybenzyl)carbamate, CIMBI-37 were produced by Department of Drug Design and Pharmacology (Denmark).
N-(2[11C-OCH3]methoxybenzyl)-2,5-dimethoxy-4-bromophenethylamine ([11C]CIMBI-36) was prepared essentially as described elsewhere 10 with minor modifications. In brief, [11C]CIMBI-36 was radiolabelled using [11C]methyl triflate which was prepared from in-target produced [11C]methane. [11C]CH3OTf was trapped at room temperature in a reaction vessel containing the precursor CIMBI-37 (0.4–0.6 mg), acetonitrile (300 µl), acetone (300 µl) and aqueous sodium hydroxide (3 M) (2–3 µl). After reaction (ca. 1 min), 1 ml of trifluoroacetic acid/acetonitrile 1/2 v/v mixture was added to the reaction vessel and the mixture was heated to 80°C for 5 min. After cooling to room temperature, the reaction mixture was neutralized with aqueous sodium hydroxide (3 M) (1000 µl) and purified using HPLC system equipped with ACE 5 C18-HL column (250 × 10 mm) with acetonitrile/0.1M aq. ammonium formate 400:600 as mobile phase (flow 6 ml/min). The desired fraction was collected into a vial containing 60 ml of water. The resulting solution was pushed through tC18 Short SPE cartridge (Waters), the cartridge was rinsed with 8 ml of distilled water. The product was then eluted with 3.0 ml of 30% of EtOH in propylene glycol and collected in a sterile receiving vial prefilled with 12 ml sterile physiological phosphate buffer solution (PBS) (pH = 7.4). The solution was finally filtered through a Millex-GV filter into the product vial. The resulting product was analyzed for radiochemical purity and specific radioactivity. The purity of [11C]CIMBI-36 was determined using an ACE 5 C18-HL HPLC column (250 × 4.6 mm, 5 µm) with acetonitrile/0.1M aq. ammonium formate 50:50 v/v as eluent, with UV absorbance monitoring at 220 nm. Radiochemical purity was in the range of 90 to 99%, MA was in the range of 280 to 1600 GBq/µmol at the time-of-injection, corresponding to injected mass range from 0.19 to 0.03 µg.
Unlabelled AC1332 and its desmethyl precursor for production of [11C]AC1332 were synthesized by Red Glead Discovery. [11C]AC1332 was prepared from the corresponding desmethyl precursor according to process summarized in supplementary Figure S1.
[11C]7-chloro-2-[4-methoxy-3-(2-methylpiperidin-1-yl)ethoxy)pheny]isoindolin-1one ([11C]AC1332) was prepared via 1-step carbon-11 labeling starting from desmethyl precursor AC1339 (0.3–0.5 mg), that was reacted with [11C]MeOTf, obtained via reaction of [11C]methane with elemental iodine, using DMF (500–600 µl) as the reaction solvent and Cs2CO3 (2.2–2.9 mg) as base, with reaction time of ca. 1 min at room temperature. Prior to reaction the mixture of precursor, carbonate and DMF was vortexed for 5–10 min until yellowish coloration became prominent. The resulting [11C]AC1332 was purified on HPLC using Waters XBridge 250 × 10 mm column, with acetonitrile/0.05M aq. phosphoric acid 350:650 v/v as mobile phase (flow rate 6–7 ml/min), concentrated on SPE cartridge (Waters tC18 Vac 1 cc) and reconstituted in sterile mixture of saline with 0.5% Kolliphor HS15 (13.5 ml) and ethanol (99.5%, 1.3 ml – used to release labelled product from SPE), followed by sterile filtration though Millex GV 0.22 µm sterile filter. The resulting product was analyzed for radiochemical purity and specific radioactivity. The purity of [11C]AC1332 was determined using a XBridge C18 HPLC column (150 × 4.6 mm, 5 µm) with acetonitrile/0.05M aq. phosphoric acid 320:680 v/v as eluent, with UV absorbance monitoring at 245 nm. Radiochemical purity was in the range of 95 to 98%, MA was in the range of 150 to 1100 GBq/µmol at the time-of-injection, corresponding to injected mass range from 0.33 to 0.05 µg.
Non-human primates
The study was approved by the Animal Ethics Committee of the Swedish Animal Welfare Agency (Dnr 10367-2019) and was performed according to “Guidelines for planning, conducting and documenting experimental research” (Dnr 4820/06-600) of Karolinska Institutet and is in accordance with ARRIVE guidelines 2.0 for how to REPORT animal experiments. Six cynomolgus non-human primates (NHPs), weighing 5.7–9.5 kg, were included in the study. The monkeys were housed in the Astrid Fagraeus Laboratory, Comparative Medicine, Karolinska Institutet, Solna, Sweden.
PET and MRI system
PET measurements were conducted using the High Resolution Research Tomograph system (Siemens Molecular Imaging, Knoxville, TN, USA). A six minute transmission scan using a single 137Cs source was obtained immediately before the radioligand injection. List-mode data were acquired for 123 min. PET images were reconstructed with a series of frames of increasing duration (9 × 20 s, 3 × 60 s, 5 × 180 s, 17 × 360 s) using the ordinary Poisson 3- dimensional ordered-subset expectation maximization (OP-3D-OSEM) algorithm, with 10 iterations and 16 subsets, including modelling of the point spread function, after correction for attenuation, random and scatter. The in-plane resolution of the reconstructed images is approximately 1.5 mm. 15 For each NHP an MRI scan was made available, either performed before the PET measurements, or an historical MRI.
PET experimental procedure
Anaesthesia of the monkeys was induced by intramuscular injection of ketamine hydrochloride (∼10 mg/kg, Ketaminol vet.; Intervet, Sollentuna, Sweden) and maintained by the administration of a mixture of sevoflurane (2%–8%, sevoflurane®; Abbot Scandinavia AB, Solna, Sweden), oxygen, and medical air after endotracheal intubation. The NHP’s heads were immobilized with a fixation device. 16 Body temperature was maintained by a Bair Hugger device (model 505; Arizant Health Care, Eden Prairie, MN, USA) and monitored by an oral thermometer. Electrocardiogram, heart rate, respiratory rate, oxygen saturation, and arterial blood pressure were continuously monitored throughout the experiments. Fluid balance was maintained by continuous infusion of saline. The radioligand was intravenously administered by a bolus administration of radioligand (∼150 MBq in 4 mL). A cannula was inserted in the external iliac artery or in the femoral artery, and arterial blood was collected continuously for 3 min using an automated blood sampling system (ABSS) (Allogg, Mariefred, Sweden) at a speed of 3.0 mL/min. Blood sampling (1.0–3.0 ml) was performed manually for the measurement of radioactivity and metabolism at 1, 1.5, 2, 2.5, 3, 5, 15, 30, 60, 90 and 120 min after the injection.
Each NHP had a baseline scan and a variable number of pretreatment scans, not necessarily on the same day. Baseline and the first post treatment scan were, in most cases, performed on the same day. All the pretreatment drugs (SB 242084, MDL 100,907 and pimavanserin were administered at the same fixed time points relative to the radioligand injection (−30 min, duration 15 minutes). Additionally, venous blood samples were taken at several time points to measure pimavanserin exposure (see details of the analytical methods below). The times relative to administration of radioligand were −1 min, +30 min (not obtained for all subjects), +60 min and +120 min. The amount for blood withdrawn from an animal was restricted to not more than 0.6% of body animals body weight on any scanning day (i.e. 6 mL of blood for every kilogram of body weight). For subsequent treatment scans there was a minimum of a 6 week rest period between treatment scans.
Study design
First, four cynomolgus animals underwent a total of 16 [11C]CIMBI-36 dynamic PET scans, at baseline and post-administration of various doses of pimavanserin (from 0.001 mg/kg to 1.0 mg/kg), SB 242084 (selective 5-HT2C antagonist, dose 1.0 mg/kg) and MDL 100,907 (selective 5-HT2A antagonist/inverse agonist, dose 0.1 mg/kg).
Then, three cynomolgus monkeys (one of which was also analysed with [11C]CIMBI-36) underwent 10 [11C]AC1332 PET scans at baseline and post-administration of various doses of pimavanserin (from 0.01 mg/kg to 1.0 mg/kg), SB 242084 (dose 1.0 mg/kg) and MDL 100,907 (dose 0.05 mg/kg).
A list of individual scans and doses, animal weight on scanning day, with associated activity levels (MBq/mCi) and pimavanserin plasma concentrations are listed in supplementary Table S1.
Pimavanserin was supplied by Acadia Pharmaceuticals. The 5-HT2CR selective antagonist SB 242084 and 5-HT2AR selective antagonist/inverse agonist MDL 100,907 were obtained from (TOCRIS, Bio-Techne Ltd). SB 242084 for pre-treatment (1.0 mg/ml as free base) was formulated in the mixture of 10:20:70 of EtOH/PEG400/25% Captisol in saline respectively. MDL 100907 for pre-treatment (0.1 and 0.05 mg/ml) was formulated in the mixture of 3:13:80 of DMSO/PEG200/10% Captisol in saline respectively. Pimavanserin for pre-treatment (range of concentrations from 0.003 to 1.0 mg/ml as free base) was formulated in sterile saline. In all cases, formulated compounds were vortexed and if necessary, sonicated to ensure complete dissolution, and filtered through Millex-GV sterile filters prior to administration to the monkeys. Samples of the filtered drug solutions were HPLC analysed to confirm the drug concentrations.
Image analysis
Each subject’s PET image was initially cropped to focus the analysis on the cerebral area. Structural MRI underwent brain extraction followed by a registration on the subject’s PET image. The CNC-CNRS atlas 17 was non-linearly warped to the subject’s MR image to enable automated definition of regions of interest (ROIs).
The set of ROIs were selected a priori and included: cerebellum, frontal cortex, occipital cortex, temporal cortex, parietal cortex, cingulate cortex, thalamus, striatum, amygdala and insula. Hippocampus and choroid plexus were manually delineated by an expert analyst by using the MRI and summed PET (software used: ITKSnap®, 18 ). The region for the choroid plexus was defined around the radioactivity in the fourth ventricle using fused PET and MRI images, as described previously. 10 The hippocampus was defined by the radioactivity in the head and tail of the hippocampus using fused PET and MRI images, since the automatic atlas segmentation was deemed too variable and large in the region definition. ROIs defined on the MRI images were applied to the dynamic PET data to derive regional time-activity curves (TACs, see example in supplementary Figure S3 and S4), with activity concentrations expressed as standardised uptake values (SUV), and calculated as radioactivity concentration [kBq/cm3]/(radioactivity injected [MBq]/body weight [kg]). The cerebellum was considered the reference region.
Radiometabolite analysis
The quantitative metabolite analysis of [11C]CIMBI-36 and its radioactive metabolites in the NHP plasma performed using a simple protein precipitation sample preparation method coupling with reversed-phase radio-HPLC. 19 Chromatographic separation was performed with ACE C18 column, (250 mm × 10 mm I.D). A gradient elution of acetonitrile (A) and ammonium formate (AMF) 0.1 M (B) were used as the mobile phase at 5.0 mL/min, with the following gradient; 0–4.0 min, (A/B) 60:40 → 90:10 v/v; 4.0–6.0 min, (A/B) 90:10 v/v for [11C]CIMBI-36 and 0–4.0 min, (A/B) 65:35 → 90:10 v/v; with an Agilent binary pump (Agilent 1200 series) coupled to a manual injection valve (7725i, Rheodyne), 5.0 mL loop and a radiation detector (Oyokoken, S-2493Z) housed in a shield of 50 mm thick lead measurements with 10 second radio-detector accumulation. In addition, a ChemStation Rev. B.04.03; Agilent, was used to aid the collecting and controlling the data.
The arterial blood samples were taken 2, 5, 15, 30, 60, 90 and 120 minutes after administration of [11C]CIMBI-36 into the NHP. The plasma samples were separated using centrifuged and mixed with 1.4 times volume of acetonitrile and again centrifuged (2000 rpm × 4 min) to precipitate the plasma protein. Finally, the supernatants were diluted with water and injected into a reversed phased radio-HPLC. Peaks for radioactive compounds eluting from the column were integrated and their areas were expressed as a percentage of the sum of the areas of all detected radioactive compounds considering the time decay correction.
The quantitative metabolite analysis of [11C]AC1332 and its radioactive metabolites in the NHP plasma performed as in [11C]CIMBI-36 (see above), using a simple protein precipitation sample preparation method coupling with reversed-phase radio-HPLC. The gradient elution of acetonitrile (A) and ammonium formate (AMF) 0.1 M (B) used as the mobile phase at 5.0 mL/min, were the follows for [11C]AC1332; 0–4.0 min, (A/B) 60:40 → 90:10 v/v; 4.0–6.0 min, (A/B) 90:10 v/v with an Agilent binary pump (Agilent 1200 series) coupled to a manual injection valve (7725i, Rheodyne), 5.0 mL loop and a radiation detector (Oyokoken, S-2493Z) housed in a shield of 50 mm thick lead measurements with 10 second radio-detector accumulation.
Pharmacokinetic estimation of pimavanserin in plasma
Study samples were received on dry ice and stored at −70°C until the analysis. HiStock solutions and spiking solutions were performed in acetonitirle: DMOS (95:5). Solutions were stored at −20°C when not used. Fresh Stock and spiking solutions were prepared for each analytial instance. Pimavanserin was extracted from the plasma by protein precipitation and the samples were then analyzed using reversed phase LC-MS/MS. The method calibration range in the plasma samples ranged from 500 to 0.1 ng/mL. Human blank plasma was used as anticoagulant for the calibration samples.
Kinetic modelling
[11C]CIMBI-36 PET tissue data were analysed using Multilinear Analysis 1 (MA1), with t* = 30 minutes), as previously described in20,21 to derive the total volume of distribution VT and the non-displaceable binding potential (BPND) using the cerebellum as reference region, as in
The percentage reduction in binding potential in an ROI following drug administration was quantified as 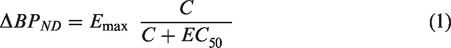
[11C]AC1332 PET tissue time-activity curves were analysed using kinetic modelling methods that employ a metabolite-corrected plasma input function (calculated as for the [11C]CIMBI-36 tracer) such as the one or two tissue compartmental models for reversible and irreversible binding.
22
We also tested a simple blood contribution model and the MA1 approach. The optimal model was identified using goodness of fit and precision of estimates. Since the tracer was identified as reversible, the non-displaceable binding potential BPND was calculated as above using the cerebellum as reference region. The percentage reduction in binding potential following drug administration was also calculated as above and used to build the relationship between plasma concentration of pimavanserin and occupancy. The Emax model (equation (1)) was then fitted to the data to derive the
Estimation of 5-HT2A and 5-HT2C fractions using [11C]CIMBI-36
Since [11C]CIMBI-36 has comparable affinity for 5-HT2Rs (Ki (nM): 5-HT2A = 0.5–0.8; 5-HT2B = 0.5; 5-HT2C = 1.7), 23 and the brain contains regionally varying proportions of 5-HT2A and 5-HT2CRs, ΔBPND would be expected to change in different ROIs. In particular, it is known that the cortical regions mainly express 5-HT2ARs, 24 the choroid plexus is dominated by 5-HT2CRs, 25 and the hippocampus contains a mixture of 5-HT2A and 5-HT2CRs. 10
A number of methods for calculating 5-HT2A and 5-HT2C receptor occupancy following single doses of drugs have been examined previously.
26
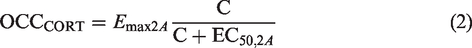
Under the assumption that specific binding in the cortex constitutes mainly 5-HT2A binding and that pimavanserin has lower affinity for 5-HT2CRs, occupancy in the occipital cortex (OccCORT) and pimavanserin concentration in plasma (C) were used to estimate EC50,2A as:
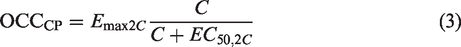
Occupancy in the choroid plexus (5-HT2C-rich region) OccCP and pimavanserin concentration in plasma (C) were used to estimate EC50,2C as:
For this study, we followed the approach proposed previously
26
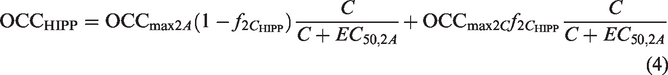
to derive the fraction of [11C]CIMBI-36 signal in the hippocampus attributable to 5-HT2CRs. Occupancy values in the hippocampus (OccHIPP) were used to estimate the f2C_HIPP (fraction of [11C]CIMBI-36 signal in the hippocampus attributable to the 5-HT2C) as:
Note that in hippocampus,
Equations (2) to (4) were solved simultaneously using a simultaneous estimation approach (SIME),
27
where all the parameters are determined together at the same time.
To note, since with [11C]AC1332 only 5-HT2C regions presented displaceable binding, no SIME approach could be carried out to estimate the fraction of 5-HT2A and 5-HT2CRs.
Results
A total of 26 PET scans (16 after administration of [11C]CIMBI-36 and 10 after administration of [11C]AC1332) were successfully acquired in 6 different animals.
There was a relatively slow decline of the pimavanserin plasma concentration throughout the duration of the scan (see supplementary Figure S2 and supplementary table S1). Concentrations at 60 minutes post-dose were used to estimate plasma concentration for each PET scan.
Figures 1 and 2 show examples of distribution of [11C]CIMBI-36 and [11C]AC1332 signals in the brain, at baseline and after administration of the 5-HT2C selective antagonist SB 242084, the 5-HT2A selective antagonist/inverse agonist MDL 100,907 and the 5-HT2A/2C antagonist/inverse agonist pimavanserin. Binding patterns of the 5-HT2A/2C ligand [11C]CIMBI-36 at baseline showed strong signals throughout the brain including highest in the cortex, slightly lower in hippocampus, and lower again in choroid plexus and amygdala as indicated in Figures 1 and 2. Baseline binding patterns of the 5-HT2C selective ligand [11C]AC1332 were much less widespread than [11C]CIMBI-36, mainly restricted to a high signal in choroid plexus, with a smaller, but still clear signal in the hippocampus, and very little binding in cortex or other subcortical regions (see Figures 1 and 2).
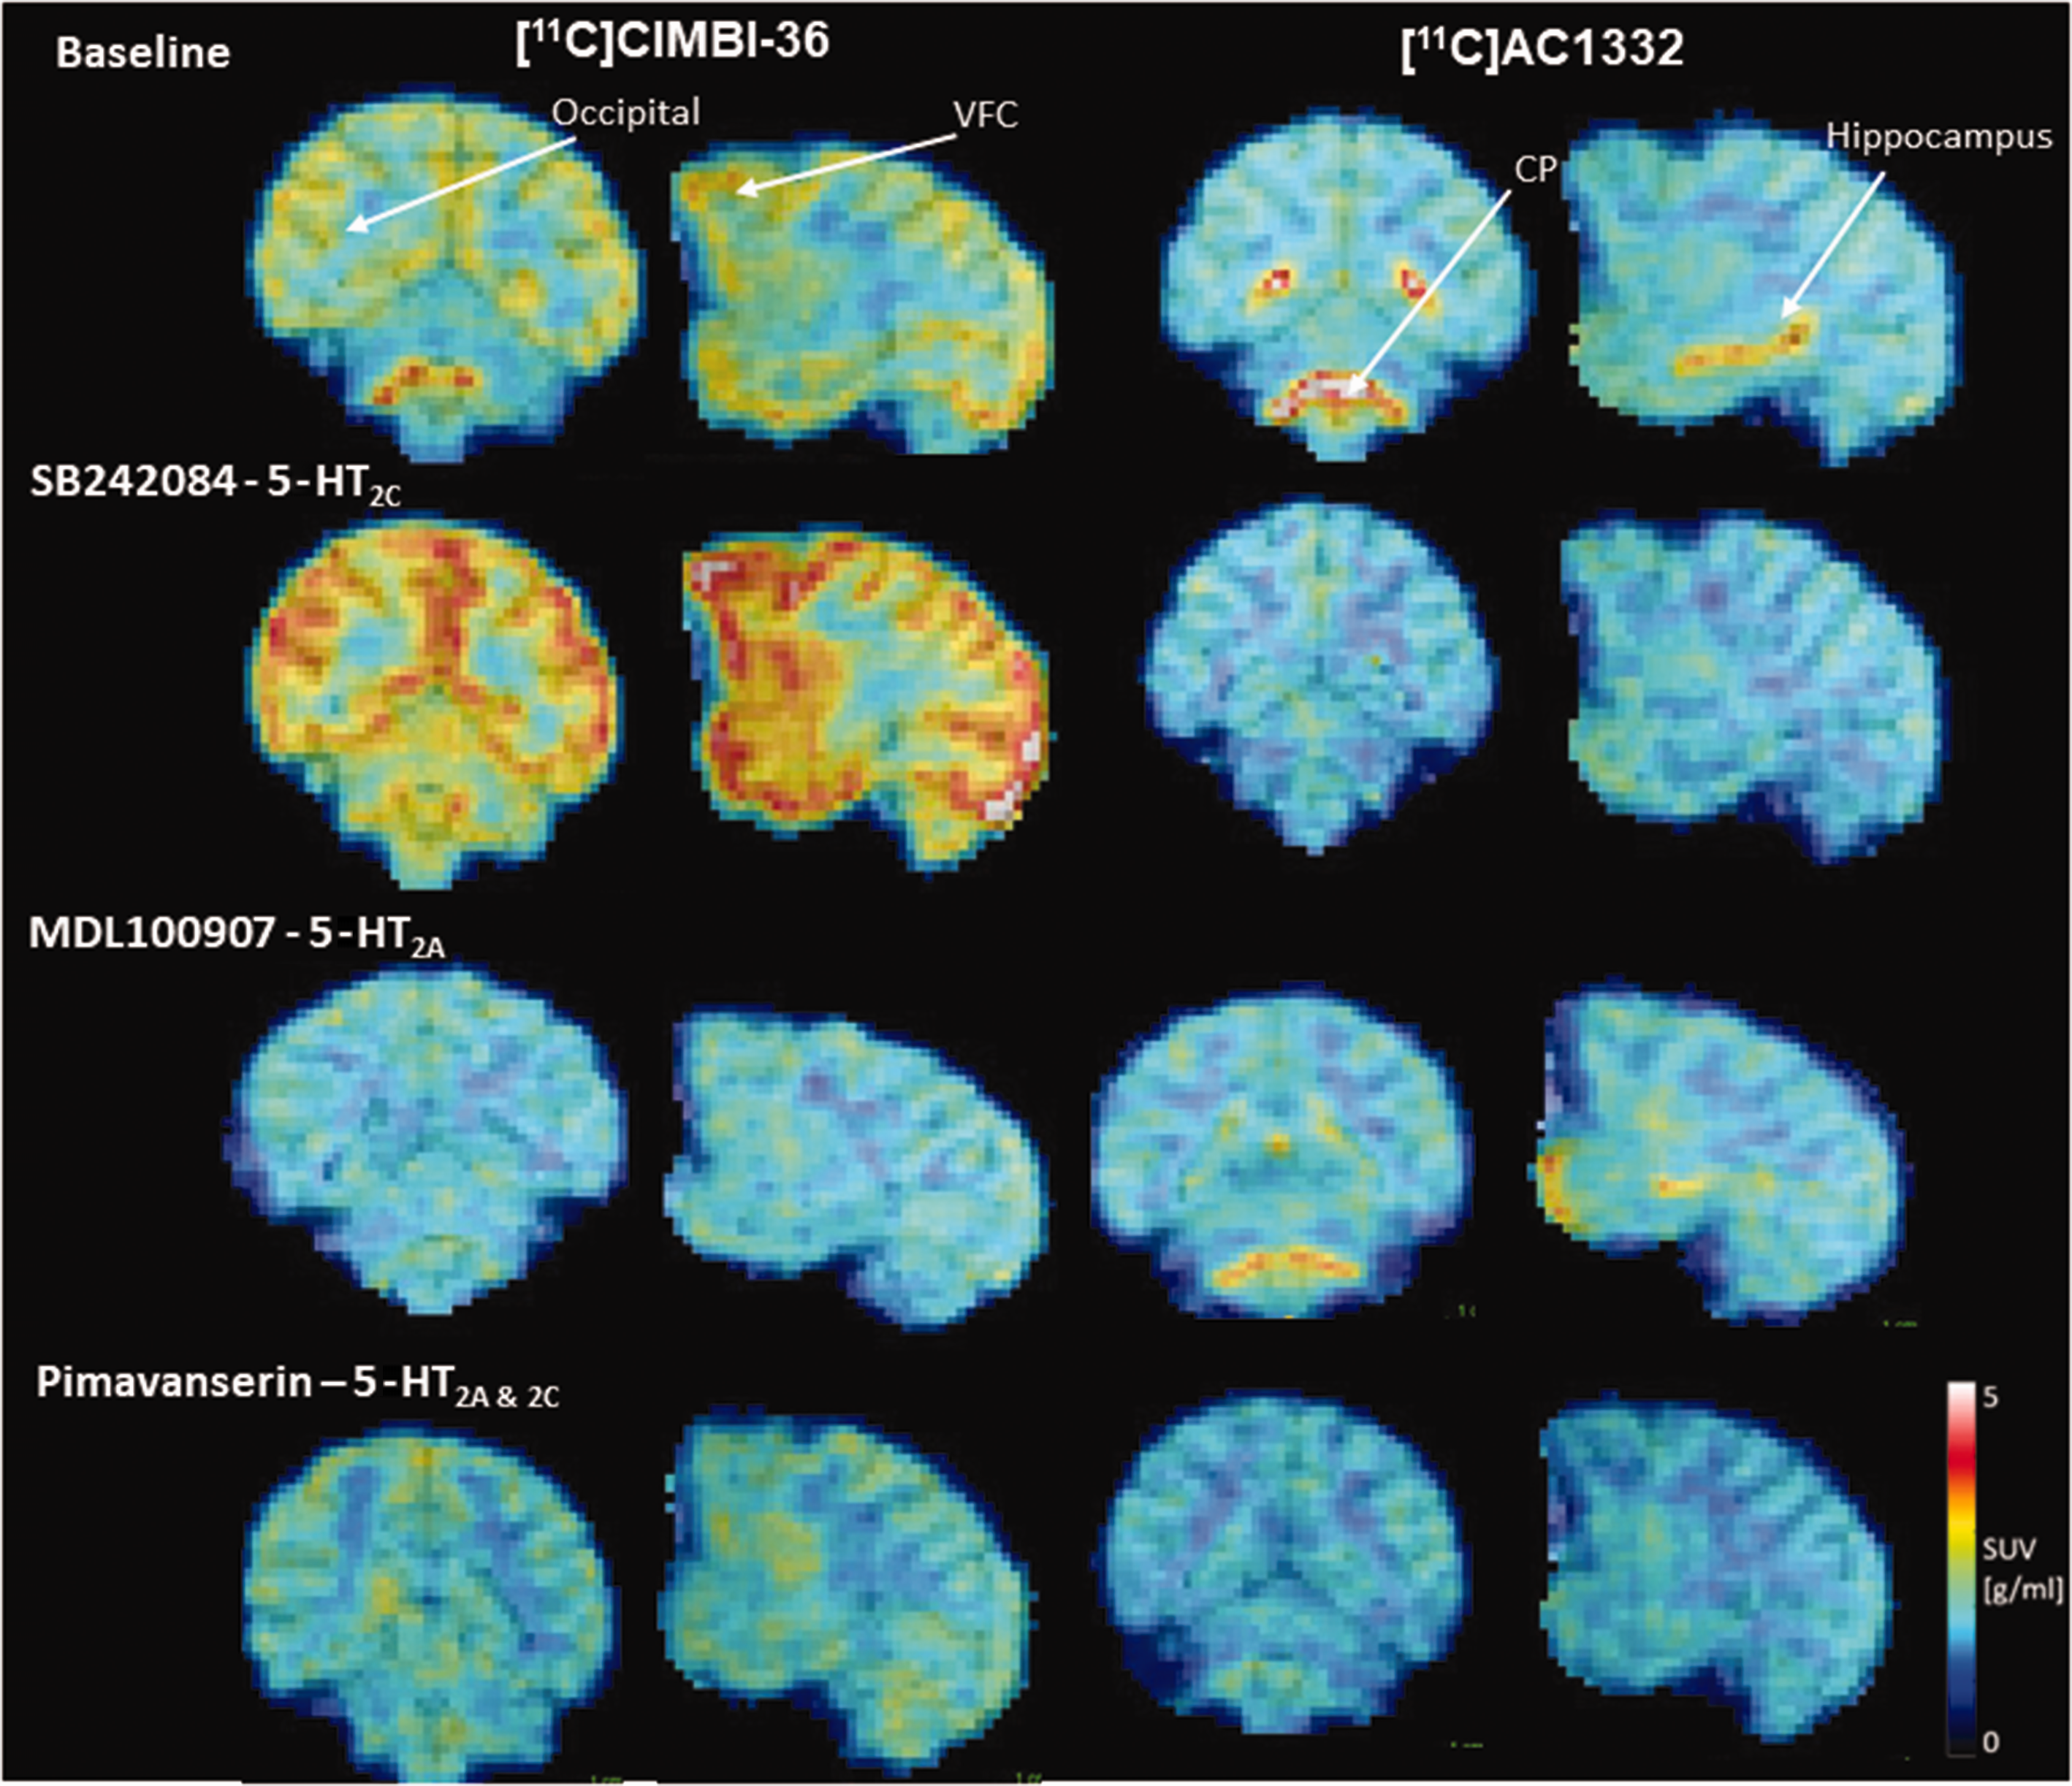
Coronal cross sections of [11C]CIMBI-36 (left) and [11C]AC1332 (right) SUV PET scans. SUV images are summed from 0–90 minutes from a representative subject at baseline, post-1 mg/kg SB 242084 (5-HT2C specific), post- 0.5 and 1 mg/kg MDL 100,907 (5-HTA specific) and post-1 mg/kg pimavanserin (5-HTAC and 5-HT2C specific) administration (left panel). Images show the expected distribution of [11C]CIMBI-36 signal. Images show high uptake in 5-HT2C regions (hippocampus and choroid plexus).
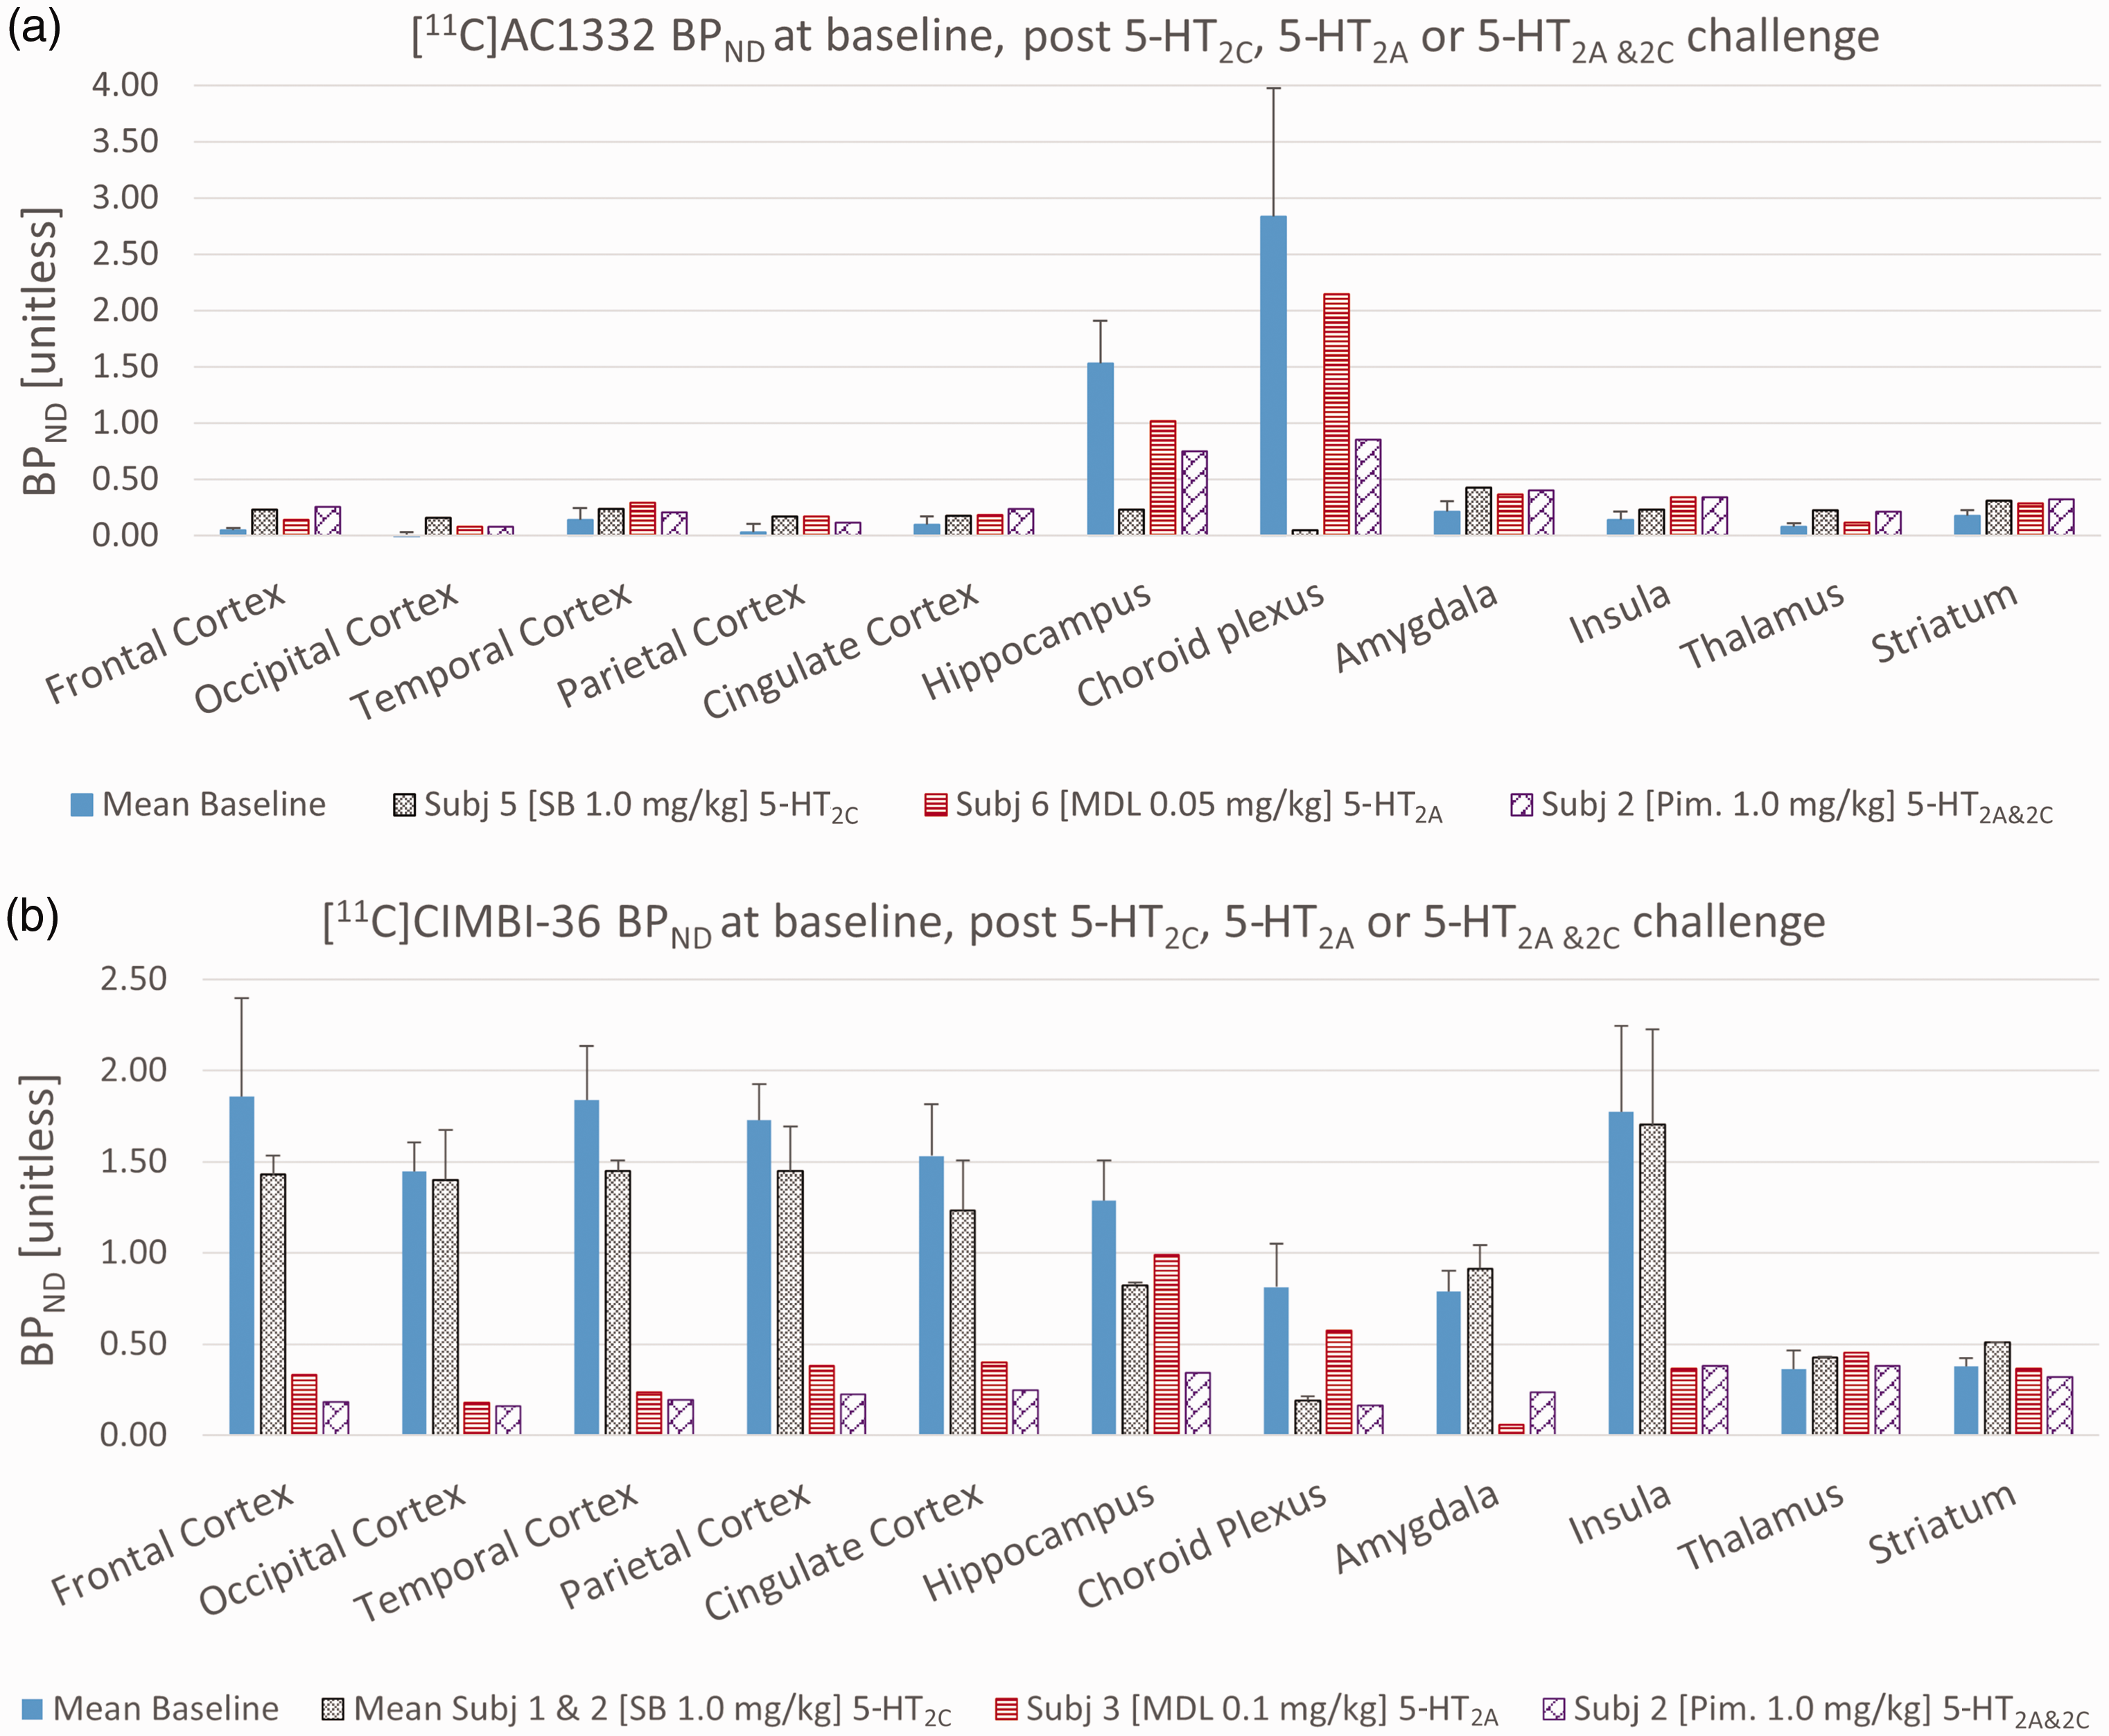
(a). BPND of [11C]CIMBI-36 in NHP at baseline and following administration of SB 242084 (5-HT2C specific), MDL 100,907 (5-HT2A specific) or Pimavanserin (5-HT2A & 2C specific). [11C]CIMBI-36 binding was measured at baseline (n = 4; mean ± SD), after pretreatment with SB 242084 (SB) (n = 2; mean ± SD), MDL 100,907 (MDL) (n = 1) and Pimavanserin (Pim) (n = 2; mean ± SD). Error bars represent one standard deviation. (b) and BPND of [11C]AC1332 in NHP at baseline and following administration of SB 242084 (5-HT2C specific), MDL 100,907 (5-HT2A specific) or Pimavanserin (5-HT2A & 2 C specific). Baseline data from n = 3, SB data from n = 2, MDL data from n = 1 and Pim data from n = 2. Error bars represent one standard deviation.
For [11C]CIMBI-36 and [11C]AC1332, kinetic modelling with MA1 produced acceptable model fits to tissue time-activity curve data in all cases (an example for each tracer is reported in supplementary Figure S3 and S4 respectively) and the VT were well determined (see supplementary Tables S2 and Table S3). BPND calculated using the cerebellum as reference region and selected regions are reported are reported in supplementary Tables S4 and S5.
For [11C]CIMBI-36 scans, post administration of SB 242084 (in both subjects), there was a significant increase in the VT (see Figure 1 and Table S2) which was associated with increased ligand by a higher peak in both scans (see representative TAC Figure S3). Despite the increases in VT following SB 242084 for both subjects (see Table S2), the BPND ratio [target/reference region] was reduced following the SB 242084 administration. This result is consistent with those seen previously. 10
For [11C]CIMBI-36 scans post administration of the 5-HT2C selective antagonist SB 242084, the highest reduction in BPND was in the choroid plexus (74%), the smallest change was in cortical regions (5–27%) and there was a 38% reduction in hippocampal BPND. On the other hand, 0.1 mg/kg of MDL 100,907 (5-HT2A selective antagonist/inverse agonist) led to 77–92% reductions in cortical BPND, but substantially lower reductions in the 5-HT2C rich areas (hippocampus and choroid plexus, 33% and 26% respectively). See Table 2 for selected regions and supplementary Table S4 for all BPND estimates.
Summary Non-displaceable binding potential (BPND, unitless) (ΔBPND %) values obtained from Multilinear Analysis 1 (MA1) after the injection of [11C]AC1332 and [11C]CIMBI in NHP during conditions and after pretreatment.
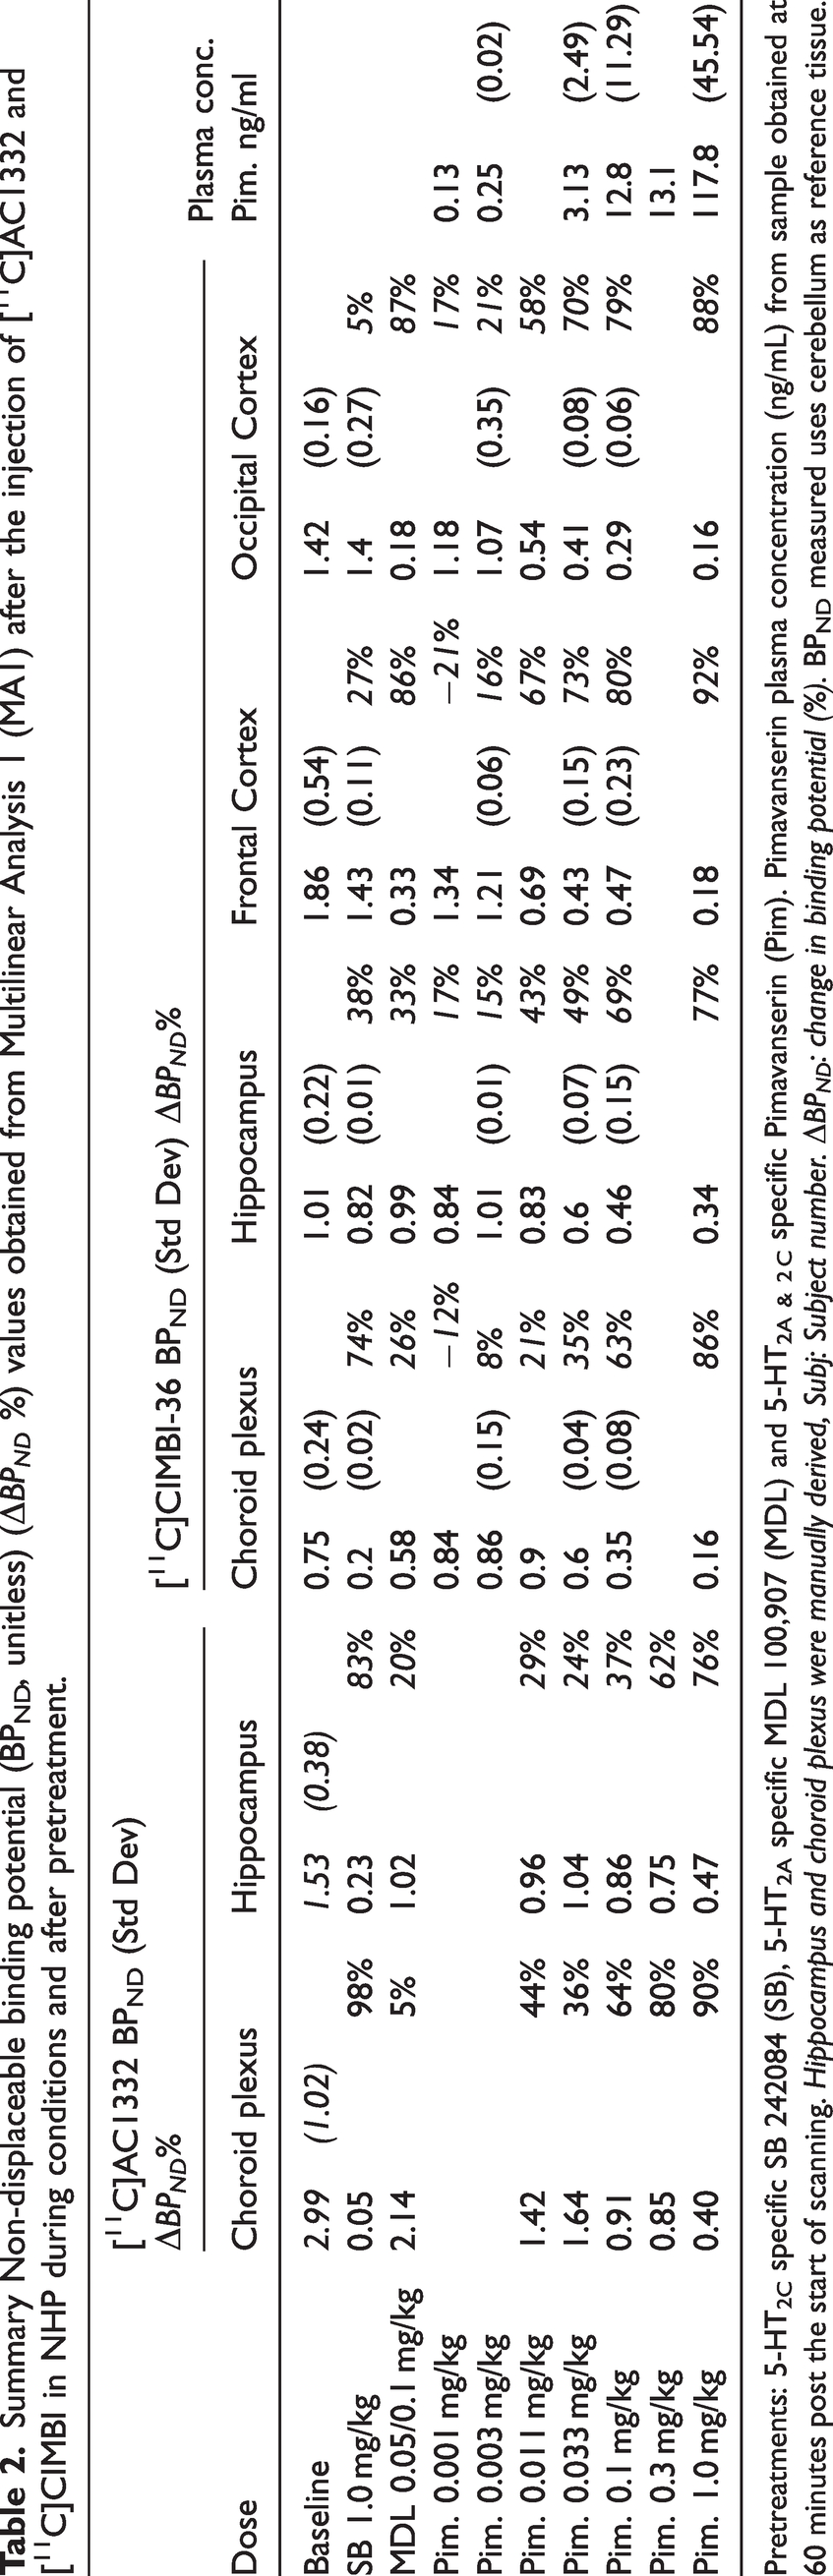
Pretreatments: 5-HT2C specific SB 242084 (SB), 5-HT2A specific MDL 100,907 (MDL) and 5-HT2A & 2 C specific Pimavanserin (Pim). Pimavanserin plasma concentration (ng/mL) from sample obtained at 60 minutes post the start of scanning. Hippocampus and choroid plexus were manually derived, Subj: Subject number. ΔBPND: change in binding potential (%). BPND measured uses cerebellum as reference tissue.
After pimavanserin administration, there was a generally robust dose dependent displacement of [11C]CIMBI-36, with displacement occurring at lower doses and plasma levels in the cortex, and higher doses and plasma levels in the choroid plexus, while the hippocampus results were more variable, with displacement of the tracer occurring at doses and exposures between frontal cortex and choroid plexus values (see Table 2 and supplementary Figure S3). Given that pimavanserin has higher affinity for 5-HT2A over 5-HT2C receptors, these results are consistent with the observations that the cortex expressed mainly 5-HT2A receptors, the choroid plexus expresses mainly 5-HT2C receptors, and the hippocampus has mixed expression of both 5-HT2A and 5-HT2C receptors.
The relationship between the measured plasma concentrations of pimavanserin and resulting ΔBPND values was determined by fitting the Emax model of equation (1). [11C]CIMBI-36 data and model fit are plotted in Figure 3. To note, PK values for subject 002 (pimavanserin dose 0.011 mg/kg) and subject 003 (pimavanserin dose 0.1 mg/kg) were excluded from results as the samples were believed to be contaminated. Using [11C]CIMBI-36 the EC50 was estimated as 0.6 ng/ml for occipital cortex, 6.0 ng/ml for choroid plexus and 0.8 ng/ml for hippocampus. Emax was estimated between 70% and 85% for the regions considered (see Figure 3).
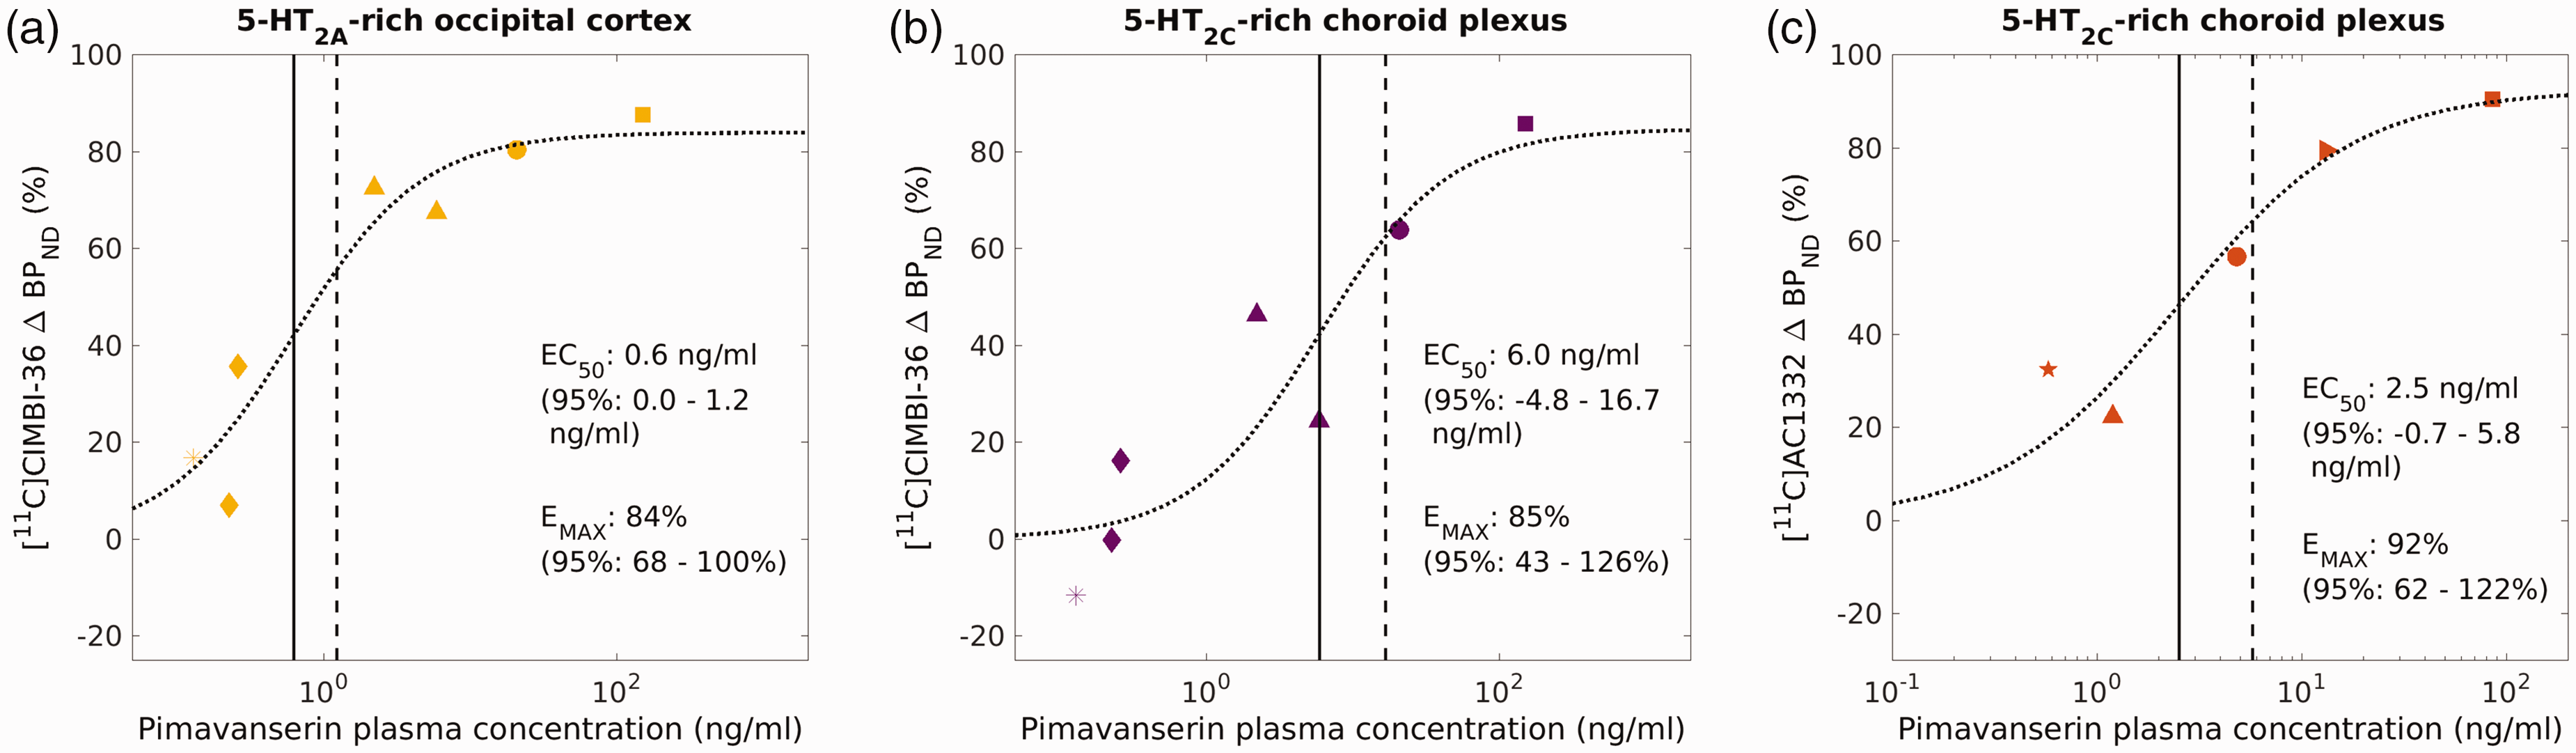
Comparison of Pimavanserin plasma concentration versus occupancy curves for [11C]CIMBI-36 in the occipital cortex, a 5-HT2A-rich region (a), or in the choroid plexus, a 5-HT2C-rich region (b), and then [11C]AC1332 in choroid plexus (c), determined by using the Emax model. ■ 1.0 mg/kg, ▸ 0.3 mg/kg, ● 0.1 mg/kg, ▲ 0.033 mg/kg, « 0.011 mg/kg, ♦ 0.0033 mg/kg and ★ 0.001 mg/kg pimavanserin.
When using the SIME approach to estimate the fraction of 5-HT2C receptors in the hippocampus using the Emax model, consistent estimates of both the ED50 and EC50 for the 5-HT2A and 5-HT2C subtypes were found. Results from the both the individual fits of the Emax model using the pimavanserin concentration (PK-RO model) and the Emax model using the pimavanserin administered doses (dose-RO model) supported the use of a shared Emax for the SIME model. The model fits are reported in Figure 5(a) and (b). The estimated EC50 was 0.6 ng/ml for 2 A subtype, 6.0 ng/ml for 2 C subtype and Emax was estimated 82%. The estimated fraction of 2 C subtype from PK-RO in the hippocampus f2c was 0.5. The estimated ED50 was 0.007 mg/kg for 2 A subtype, 0.041 mg/kg for 2 C subtype, and Emax was estimated 85%. The estimated fraction of 2 C receptor subtype from dose-RO curves was 0.57(f2c) in the hippocampus (see Figure 5(a) and (b)).
[11C]AC1332 demonstrated a binding pattern in the NHP brain consistent with a selective 5-HT2C PET ligand, with quantifiable binding in hippocampus and choroid plexus, and minimal binding in the cortex (see Figures 1, 2(b) and Table 2). Post administration of SB 242084 (5-HT2C blocker), the highest reduction was in the choroid plexus (98%), and there was an 83% reduction in hippocampal BPND. On the other hand, 0.05 mg/kg of MDL 100,907 (5-HT2A blocker) led to 20% reduction in hippocampus and 5% in the choroid plexus (the latest being within baseline variability). Both compounds demonstrated the expected change in [11C]AC1332 binding consistent with its selectivity for 5-HT2C receptors.
After pimavanserin administration, there were generally robust, dose-dependent reductions in the binding of [11C]AC1332 in the hippocampus and choroid plexus (see Figures 1, 2(b) and Table 2). The reductions were consistent with the 5-HT2C related changes in [11C]CIMBI-36 binding identified in the first part of the study.
Figure 3 shows a summary of the pimavanserin exposure vs receptor occupancy curves for [11C]CIMBI-36 (Figure 3(a) and (b)) and [11C]AC1332 (Figure 3(c)), for 5-HT2C-rich regions (i.e. choroid plexus, 3B and 3C) and 5-HT2A-rich regions (i.e. occipital cortex, 3A). Figure 4 shows a summary of the pimavanserin dose vs receptor occupancy curves for [11C]CIMBI-36 (Figure 4(a) and (b)) and [11C]AC1332 (Figure 4(c)), for 5-HT2C-rich regions (i.e. choroid plexus, 4B and 4C) and 5-HT2A-rich regions (i.e. occipital cortex, 4A).
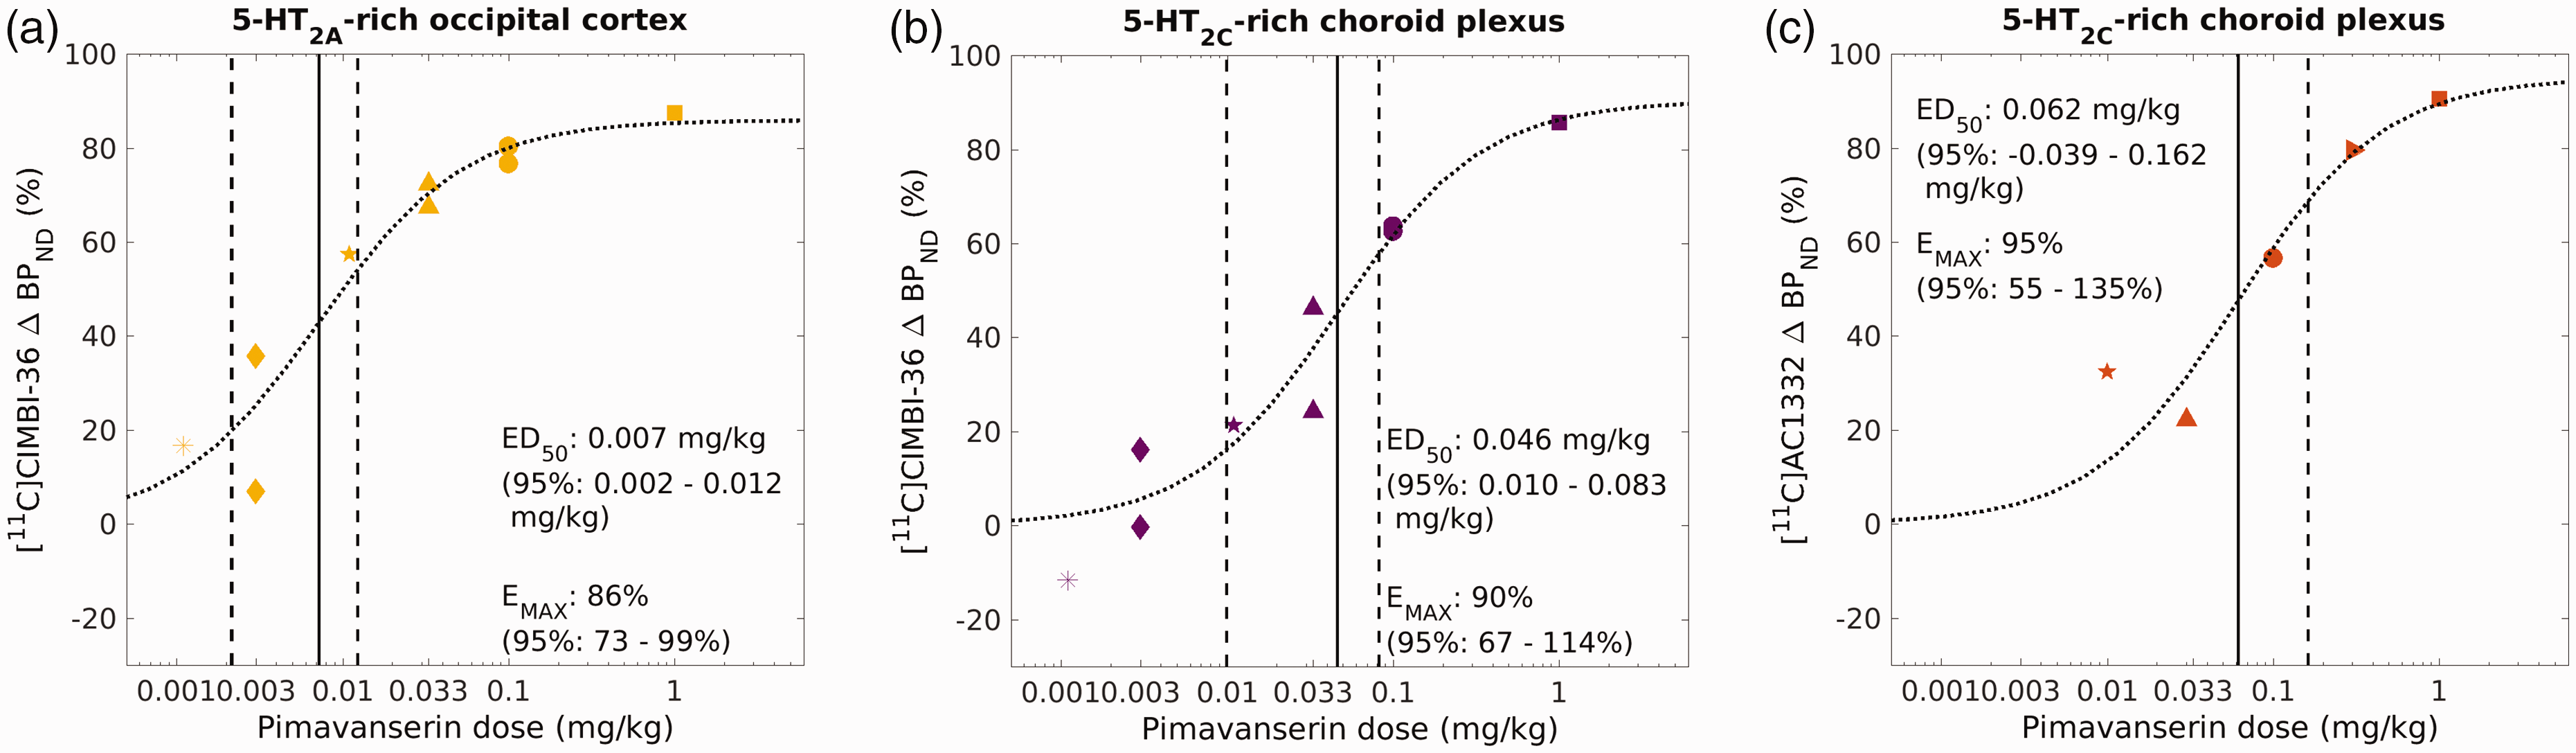
Comparison of Pimavanserin dose versus occupancy curves for [11C]CIMBI-36 in the occipital cortex, a 5-HT2A-rich region (A), or in the choroid plexus, a 5-HT2C-rich region (B), and then [11C]AC1332 in choroid plexus (C), determined by using the Emax model. ■ 1.0 mg/kg, ▸ 0.3 mg/kg, ● 0.1 mg/kg, ▲ 0.033 mg/kg, « 0.011 mg/kg, ♦ 0.0033 mg/kg and ★ 0.001 mg/kg pimavanserin.
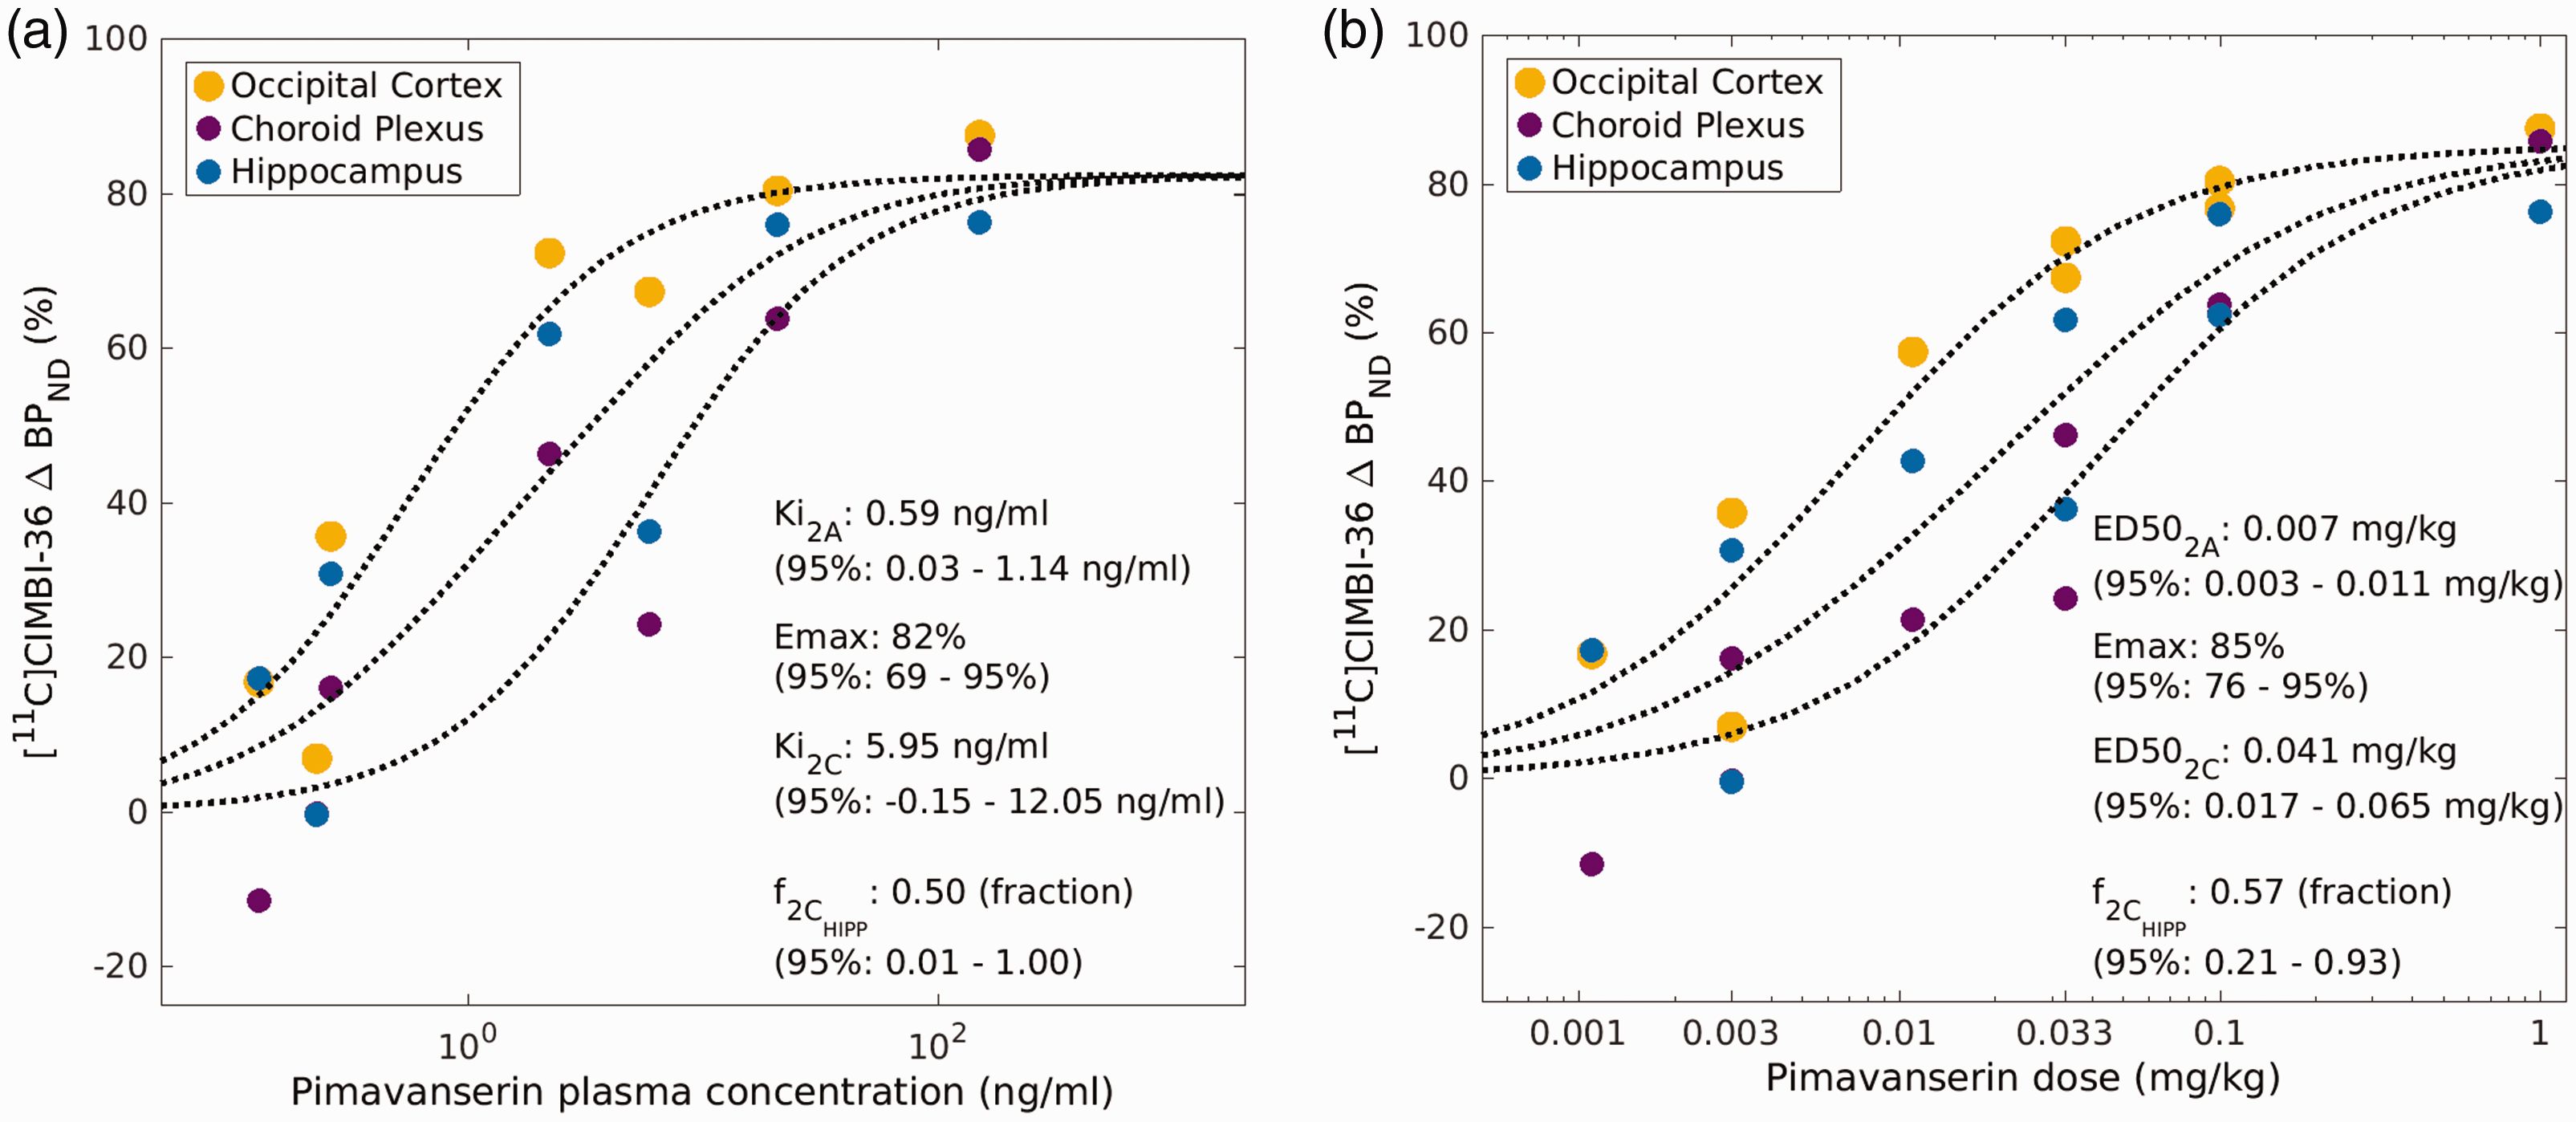
(a) [11C]CIMBI-36 Pimavanserin PK-occupancy Emax model solved with SIME allowing to determine the fraction of 5-HT2C receptors in the hippocampus (f2C) and (b) [11C]CIMBI-36 Pimavanserin dose-occupancy Emax model solved with SIME allowing to determine the fraction of 5-HT2C receptors in the hippocampus (f2C).
The occupancy of 5-HT2C receptors by pimavanserin quantified using [11C]AC1332 (ED50 0.062 mg/kg: with a 95% confidence interval of −0.039–0.162 mg/kg) provided estimates consistent with those generated using [11C]CIMBI-36 (ED50 0.046 mg/kg: with a 95% confidence interval of 0.010–0.083 mg/kg). The estimated 5-HT2A:5-HT2C affinity ratio for pimavanserin was approximately 6–10 fold.
Discussion
We evaluated two complimentary methods to estimate drug occupancy at the 5-HT2CRs in the non-human primate brain in vivo. The first used [11C]CIMBI-36 binding in discrete anatomical regions known to contain high proportions of the 5-HT2A (cortical regions) and 5-HT2C (choroid plexus) receptor sub-types. [11C]CIMBI-36 is a high affinity 5-HT2 selective radioligand with similar affinity for 5-HT2A and 5-HT2C receptors in vitro (Ki (nM): 5-HT2A = 0.5–0.8; 5-HT2C = 1.7,10,23) The second approach used a novel, 5-HT2C selective radioligand, [11C]AC1332. Pimavanserin, an FDA approved drug with known affinity for the 5-HT2A and 5-HT2C receptors was used to evaluate the two approaches above. The contribution of the 5-HT2A and 5-HT2C components to the regional [11C]CIMBI-36 VT values was confirmed by the administration of blocking compounds selective for 5-HT2A (MDL 100,907) and 5-HT2C (SB 242084). Overall, the results obtained via the two methods were internally consistent and in the case of [11C]CIMBI, in line with previous literature. 10
The in vivo affinity of pimavanserin at the 5-HT2CR has not been previously examined. The estimates obtained in this study were similar using either [11C]CIMBI-36 or [11C]AC1332 (ED50 values of 0.046 vs 0.062 mg/kg; EC50 values of 6.0 vs 2.5 ng/ml respectively). The in vivo affinity of pimavanserin at the 5-HT2AR was previously examined in a human PET study using the radioligand [11C]NMSP, which displays high binding potential in the cortex, accounting for the 5-HT2AR binding of this radioligand. 28 Although the pimavanserin EC50 for cortical regions was not calculated in that prior study, visual examination of the occupancy plots indicates a figure between 0.5 to 1 ng/ml, in good agreement with the estimate of 0.6 ng/ml obtained from the cortical occupancy estimates obtained with [11C]CIMBI-36 scans in our study. Comparison of the 5-HT2AR and 5-HT2CR affinity of pimavanserin obtained from regional occupancy estimates of [11C]CIMBI-36 PET scans provides a selectivity ratio of approximately 10-fold higher affinity for the 5-HT2AR over the 5-HT2CR. This affinity ratio is broadly consistent with the literature results obtained in vitro, of 3-to-5 fold higher radioligand binding affinity for the 5-HT2AR over the 5-HT2CR.13,14 Pimavanserin occupancy of 5-HT2A receptors is likely over 97% at the therapeutic dose of 34 mg given that the Cmax is estimated to be 50 ng/ml at steady state. 29 Therefore, assuming the in vivo selectivity ratio of approximately 10-fold that we observed in this study also occurs in humans, pimavanserin occupancy of 5-HT2C receptors is likely to be close to 90% at that same dose.
[11C]CIMBI-36 regional binding in the NHP brain was broadly consistent with previous reports, 10 with highest VT values in the cortical regions, lower ones in the hippocampus, choroid plexus and the amygdala, very low VT values in the striatum and thalamus and lowest ones in the cerebellum. 10 The baseline [11C]CIMBI-36 scans demonstrated a regional binding pattern very similar to that reported previously in primates and in humans.10,30 Previous studies have used the 2TCM model to quantify the [11C]CIMBI-36 data.10,23,30 In our study the MA1 model performed slightly better than the 2TCM and the study results and conclusions are unchanged whether the 2TCM or MA1 model is used. [11C]AC1332 regional binding was highest in the choroid plexus, followed by the hippocampus and negligible displaceable binding in all other regions, consistent with the pilot scan previously presented. 12 The regional binding pattern for [11C]CIMBI-36 and [11C]AC1332 is consistent with expectations based on the affinity of the two radioligands for the 5-HT2CRs and 5-HT2ARs and the distribution of the two receptors seen using autoradiography in post-mortem samples. 5-HT2CRs are expressed in many regions of the monkey brain including cortex, substantia nigra, basal ganglia, amygdala, hippocampus and hypothalamus, and have considerable overlap with 5-HT2ARs, but the density of 5-HT2ARs is significantly higher in most brain regions. 31 An exception is the choroid plexus which primarily expresses 5-HT2CRs in monkeys.
We have used the BPND as the preferred outcome parameter to quantify [11C]CIMBI-36 PET scans (Table 2, S4 and S5). This decision was based on availability of the cerebellum as a reference region with negligible 5-HT2 receptor expression, as well as the previous findings that reported increases in regional VT values following the administration of the 5-HT2C antagonist SB 24208410. VT values of [11C]CIMBI-36 increased approximately 60% after the administration of SB 242084 in the current study. A global increase in VT of 100% was also reported previously. 10 Finnema et al attributed these changes to increases in the plasma free fraction (fp) following the administration of SB 242084 (fp = 0.10 vs. 0.05 ± 0.01 during baseline conditions). 10 In contrast to the VT, the BPND changes (supplementary table S4) demonstrate the expected direction of change, although we did see some paradoxical increases in BPND in subject 4 when they were administered very low levels of Pim. We believe these changes are due to experimental variability at very low occupancy levels. We did not measure fp in our experiments as it is irrelevant for the estimation of BPND. If future studies intend to use VT as the outcome parameter we would recommend monitoring changes in fp.
In conclusion, both [11C]CIMBI-36 and [11C]AC1332 enable the estimation of brain 5-HT2CR occupancy by pharmaceutical agents. While [11C]CIMBI-36 allows estimation of occupancy at both 5-HT2A and 5-HT2C receptors, estimating the 5-HT2C binding component of this radioligand is more complex than it is for [11C]AC1332, because in most brain regions such as the hippocampus, the contribution of 5-HT2CRs to binding must be separated from the 5-HT2AR component. In choroid plexus however, [11C]CIMBI-36 binding is primarily due to 5-HT2CRs. [11C]AC1332 demonstrated a binding pattern in the NHP brain consistent with a selective 5-HT2C PET ligand, with quantifiable in hippocampus and choroid plexus, and minimal binding in the cortex. The choice of either ligand for future studies will depend on the exact parameters that are to be investigated, though for solely measuring 5-HT2CR occupancy, [11C]AC1332 may be a more strainght forward option. These studies illustrate the feasibility of estimating drug binding to 5-HT2ARs and 5-HT2CRs in vivo using [11C]CIMBI-36 as well as the potential utility of [11C]AC1332 for quantifying drug occupancy of 5-HT2CRs in vivo.
Supplemental Material
sj-pdf-1-jcb-10.1177_0271678X241276312 - Supplemental material for Imaging the 5-HT2C receptor with PET: Evaluation of 5-HT2C and 5-HT2A affinity of pimavanserin in the primate brain
Supplemental material, sj-pdf-1-jcb-10.1177_0271678X241276312 for Imaging the 5-HT2C receptor with PET: Evaluation of 5-HT2C and 5-HT2A affinity of pimavanserin in the primate brain by Khanum Ridler, Gaia Rizzo, Ethan S Burstein, Anton Forsberg Morén, Vladimir Stepanov, Christer Halldin and Eugenii A Rabiner in Journal of Cerebral Blood Flow & Metabolism
Supplemental Material
sj-pdf-2-jcb-10.1177_0271678X241276312 - Supplemental material for Imaging the 5-HT2C receptor with PET: Evaluation of 5-HT2C and 5-HT2A affinity of pimavanserin in the primate brain
Supplemental material, sj-pdf-2-jcb-10.1177_0271678X241276312 for Imaging the 5-HT2C receptor with PET: Evaluation of 5-HT2C and 5-HT2A affinity of pimavanserin in the primate brain by Khanum Ridler, Gaia Rizzo, Ethan S Burstein, Anton Forsberg Morén, Vladimir Stepanov, Christer Halldin and Eugenii A Rabiner in Journal of Cerebral Blood Flow & Metabolism
Supplemental Material
sj-pdf-3-jcb-10.1177_0271678X241276312 - Supplemental material for Imaging the 5-HT2C receptor with PET: Evaluation of 5-HT2C and 5-HT2A affinity of pimavanserin in the primate brain
Supplemental material, sj-pdf-3-jcb-10.1177_0271678X241276312 for Imaging the 5-HT2C receptor with PET: Evaluation of 5-HT2C and 5-HT2A affinity of pimavanserin in the primate brain by Khanum Ridler, Gaia Rizzo, Ethan S Burstein, Anton Forsberg Morén, Vladimir Stepanov, Christer Halldin and Eugenii A Rabiner in Journal of Cerebral Blood Flow & Metabolism
Supplemental Material
sj-pdf-4-jcb-10.1177_0271678X241276312 - Supplemental material for Imaging the 5-HT2C receptor with PET: Evaluation of 5-HT2C and 5-HT2A affinity of pimavanserin in the primate brain
Supplemental material, sj-pdf-4-jcb-10.1177_0271678X241276312 for Imaging the 5-HT2C receptor with PET: Evaluation of 5-HT2C and 5-HT2A affinity of pimavanserin in the primate brain by Khanum Ridler, Gaia Rizzo, Ethan S Burstein, Anton Forsberg Morén, Vladimir Stepanov, Christer Halldin and Eugenii A Rabiner in Journal of Cerebral Blood Flow & Metabolism
Supplemental Material
sj-pdf-5-jcb-10.1177_0271678X241276312 - Supplemental material for Imaging the 5-HT2C receptor with PET: Evaluation of 5-HT2C and 5-HT2A affinity of pimavanserin in the primate brain
Supplemental material, sj-pdf-5-jcb-10.1177_0271678X241276312 for Imaging the 5-HT2C receptor with PET: Evaluation of 5-HT2C and 5-HT2A affinity of pimavanserin in the primate brain by Khanum Ridler, Gaia Rizzo, Ethan S Burstein, Anton Forsberg Morén, Vladimir Stepanov, Christer Halldin and Eugenii A Rabiner in Journal of Cerebral Blood Flow & Metabolism
Supplemental Material
sj-pdf-6-jcb-10.1177_0271678X241276312 - Supplemental material for Imaging the 5-HT2C receptor with PET: Evaluation of 5-HT2C and 5-HT2A affinity of pimavanserin in the primate brain
Supplemental material, sj-pdf-6-jcb-10.1177_0271678X241276312 for Imaging the 5-HT2C receptor with PET: Evaluation of 5-HT2C and 5-HT2A affinity of pimavanserin in the primate brain by Khanum Ridler, Gaia Rizzo, Ethan S Burstein, Anton Forsberg Morén, Vladimir Stepanov, Christer Halldin and Eugenii A Rabiner in Journal of Cerebral Blood Flow & Metabolism
Supplemental Material
sj-pdf-7-jcb-10.1177_0271678X241276312 - Supplemental material for Imaging the 5-HT2C receptor with PET: Evaluation of 5-HT2C and 5-HT2A affinity of pimavanserin in the primate brain
Supplemental material, sj-pdf-7-jcb-10.1177_0271678X241276312 for Imaging the 5-HT2C receptor with PET: Evaluation of 5-HT2C and 5-HT2A affinity of pimavanserin in the primate brain by Khanum Ridler, Gaia Rizzo, Ethan S Burstein, Anton Forsberg Morén, Vladimir Stepanov, Christer Halldin and Eugenii A Rabiner in Journal of Cerebral Blood Flow & Metabolism
Supplemental Material
sj-pdf-8-jcb-10.1177_0271678X241276312 - Supplemental material for Imaging the 5-HT2C receptor with PET: Evaluation of 5-HT2C and 5-HT2A affinity of pimavanserin in the primate brain
Supplemental material, sj-pdf-8-jcb-10.1177_0271678X241276312 for Imaging the 5-HT2C receptor with PET: Evaluation of 5-HT2C and 5-HT2A affinity of pimavanserin in the primate brain by Khanum Ridler, Gaia Rizzo, Ethan S Burstein, Anton Forsberg Morén, Vladimir Stepanov, Christer Halldin and Eugenii A Rabiner in Journal of Cerebral Blood Flow & Metabolism
Supplemental Material
sj-pdf-9-jcb-10.1177_0271678X241276312 - Supplemental material for Imaging the 5-HT2C receptor with PET: Evaluation of 5-HT2C and 5-HT2A affinity of pimavanserin in the primate brain
Supplemental material, sj-pdf-9-jcb-10.1177_0271678X241276312 for Imaging the 5-HT2C receptor with PET: Evaluation of 5-HT2C and 5-HT2A affinity of pimavanserin in the primate brain by Khanum Ridler, Gaia Rizzo, Ethan S Burstein, Anton Forsberg Morén, Vladimir Stepanov, Christer Halldin and Eugenii A Rabiner in Journal of Cerebral Blood Flow & Metabolism
Footnotes
Funding
The author(s) disclosed receipt of the following financial support for the research, authorship, and/or publication of this article: This research was fully funded by ACADIA Pharmaceuticals Inc., United States, which markets pimavanserin. ESB is an employee of ACADIA.
Acknowledgements
Acknowledge that the precursor for AC1332 was produced by Red Glead Discovery, Medicon Village. Scheelevaegen 8. Lund, SE, 22363. Specifically Filip Paulsen.
Acknowledge that the standard of CIMBI-36 and its precursor CIMBI-37 were produced by the Department of Drug Design and Pharmacology, Faculty of Health and Medical Sciences, University of Copenhagen, Jagtvej 160, Building 22, Floor 1, DK-2100 Copenhagen, Denmark.
Acknowledge that the pharmacokinetic analysis was performed by Lablytica Life Science, Virdings Allee 16, 754 50 Uppsala, Sweden. Led by David Pekar.
The authors thank Piotr Ochniewicz, Yasir Khani and the staff of the Radiopharmacy Core Facility and Brain Molecular Imaging Centre of Karolinska Institutet for excellent assistance in the conduction of the PET studies.
Declaration of conflicting interests
The author(s) declared the following potential conflicts of interest with respect to the research, authorship, and/or publication of this article: KR, GR and EAR are employees of Invicro.
Authors’ contributions
KR made significant contribution to design of the study, interpretation of the data, drafted sections of the manuscript and approved the final version. GR analysed the data, made a significant contribution to interpretation of the data, drafted sections of the article and approved the final version. ESB came up with the concept and the design of the study, drafted sections of the manuscript and revised the manuscript and approved the final version. AFM contributed significantly to the design and acquisition of the data and drafted sections of the manuscript and as approved the final version. VS contributed significantly to the design and acquisition of the data and drafted sections of the manuscript and as approved the final version. CH contributed significantly to the design and acquisition of the data and drafted sections of the manuscript and as approved the final version. EAR made significant contribution to design of the study, interpretation of the data, drafted sections of the manuscript and approved the final version.
Supplementary material
Supplemental material for this article is available online.
References
Supplementary Material
Please find the following supplemental material available below.
For Open Access articles published under a Creative Commons License, all supplemental material carries the same license as the article it is associated with.
For non-Open Access articles published, all supplemental material carries a non-exclusive license, and permission requests for re-use of supplemental material or any part of supplemental material shall be sent directly to the copyright owner as specified in the copyright notice associated with the article.