
Abstract
Aircraft cabins are routinely pressurized to the equivalent of 8000 ft altitude. Exposure of lab animals to aeromedical evacuation relevant hypobaria after traumatic brain injury worsens neurological outcomes, which is paradoxically exacerbated by hyperoxia. This study tested the hypothesis that exposure of rats to hypobaria following cortical impact reduces cerebral blood flow, increases neuroinflammation, and alters brain neurochemistry. Rats were exposed to simulated ground (normobaric) or air (hypobaric 8000 ft) transport, under normoxia or hyperoxia, 24 hr after trauma. Hypobaria exposure resulted in lower cerebral blood flow to the contralateral cortex and bilateral thalamus during flight and increased delayed cortical inflammation (ED1 immunoreactivity) at 14 days post injury. Impacted rats exposed to hypobaria had higher cortical creatine levels compared rats maintained at sea level. Exposure to the combination of hyperoxia and hypobaria resulted in the greatest reduction in cortical blood flow and total creatine during flight which persisted up to two weeks. In conclusion, hypoperfusion during hypobaria exposure could contribute to worsening of neuroinflammation and neurochemical imbalances. The presence of excessive O2 during hypobaria results in long-term suppression of cerebral blood flow, indicating that supplemental O2 should be titrated during hypobaria to maintain normoxia.
Keywords
Introduction
After traumatic brain injury (TBI), the regulation of cerebral blood flow (CBF) is differentially affected by injury severity, arterial oxygen tension, and atmospheric pressure. However, the complex interaction of these factors and their contribution to secondary brain injury has yet to be defined. Human retrospective studies indicate greater morbidity and mortality in TBI patients after aeromedical evacuation ≤1 day after injury. 1 Animal studies have found that exposure to air evacuation-relevant hypobaric (AERH) conditions following TBI increases acute brain biomarkers of inflammation, decreases regional CBF, and worsens cognitive deficits, hippocampal neuronal loss, and glial cell activation.2 –4 We previously demonstrated that rats exposed to under-vehicle blast followed by hypobaria under 100% O2 exhibit increased axonal damage and impaired motor function compared to those subjected to blast and hypobaria under normoxic conditions. 5 The combination of hypobaria with hyperoxia also induces a multi-organ inflammatory response after controlled cortical impact (CCI) injury combined with hemorrhagic shock, evidenced by increased gut myeloperoxidase, neutrophil infiltration to the lungs, and lymphocyte accumulation in the kidney of rats. 6 These data highlight the need for a detailed examination of the acute effects of AERH with or without hyperoxia on secondary injury processes in the brain, including CBF, metabolism, and inflammation.
High-resolution proton magnetic resonance spectroscopy (MRS) provides complementary information and assesses metabolic irregularities following TBI, including alterations in neurochemicals sensitive to hypoxia or ischemia, bioenergetic dysfunction, neuronal injury, and inflammation. GABA and glutamate are the primary inhibitory and excitatory neurotransmitters utilized by the brain. Phosphocreatine and creatine (tCr) are critical factors in a high energy buffer system responsible for carrying phosphate from mitochondrial production sites to energy usage sites thereby ensuring adequate levels of ATP are generated via oxidative phosphorylation as energy demands increase. ATP is critical for sustaining physiologic activities, including plasmalemmal ion transport of electrolytes necessary for neurotransmission and neuronal viability. N-acetylaspartate (NAA) is critical for neuronal mitochondrial bioenergetics and for myelin biosynthesis. 7 Analysis of proton MRS using these neurochemicals has been utilized to noninvasively evaluate cellular injury in TBI patients (see detailed reviews in Croall et al and Stovell), and in some instances, to assess clinical severity and predict disease outcome.8,9 Previous proton MRS studies in various rat model injuries also indicated a time evolution of TBI.10 –13 Schuhmann and colleagues showed that tCr, NAA, glutamate (Glu), and total choline (tCho) concentrations significantly decreased during the first 24 hr, and partially recovered by one week after rat CCI. At the same time, lactate (Lac) increased and reached its peak at 7 days after TBI. We have also shown significant neurochemical failures (reductions in: NAA, myo-inositol (Ins), tCho, taurine (Tau), and Glu; increases in: Lac and Glutamine (Gln)) indicating that the brain suffered from direct cell damage, hypoxia, and neuroinflammation as early as 4 hr after rat cortical impact. 13 Taken together, these results indicate that experimental TBI and hypobaria exposure induce vascular damage, inflammation, neuronal axonal injury, and oxidative stress, which contribute to neuronal death and neurobehavioral alterations.
This study tested the primary hypothesis that exposure to AERH reduces CBF, increases cortical inflammation, and shifts cortical neurochemical profiles beyond that which occurs due to injury alone. The secondary hypothesis is that hypobaria induced injury is exacerbated by hyperoxia. These longitudinal studies will provide information about the pathophysiological basis of hypobaria-exacerbated brain injury, thereby identifying potential targets for neuroprotective interventions.
Materials and methods
Rat model of controlled cortical impact TBI
All animal procedures were conducted in accordance with the University of Maryland School of Medicine (IACUC #0317005) and the US Army and the U.S. Air Force Surgeon General’s Office of Research Oversight and Compliance (FWR-2017-0018A) according to the Guide for the Care and Use of Laboratory Animals (National Research Council, 2011). Reporting of animal experiments herein are in compliance with Animal Research: Reporting in Vivo Experiments (ARRIVE) guidelines. Rats used in these experiments were double housed prior to injury and single housed following experimental procedures to prevent additional trauma to incisions commonly inflicted by cage mates. One-inch wooden blocks for chewing and manipulation were provided as environmental enrichment during solitary housing. Adult male Sprague-Dawley rats (250–350 grams, n = 35) were subjected to a single left parietal controlled cortical impact (CCI) injury or sham injury (craniotomy). 14 TBI was performed using the CCI device (ImpactOne, Leica). Rats were anesthetized with 4% isoflurane, positioned in a stereotactic frame, then maintained under 1.5–2.5% isoflurane for the duration of surgical preparation. The skull was exposed via a midline incision and a high-speed dental drill (Henry Schein, Melville, NY) was used to perform a left-sided craniotomy above parietal cortex centered 3.5 mm posterior and 4 mm lateral to bregma. A 5 mm beveled impactor tip was accelerated to 5 m/sec with a vertical deformation depth of 1.5 mm and impact duration of 50 ms, consistent with mild injury. 15 The excised bone was replaced and sealed with dental acrylic. After closing the scalp incision with Ethilon sutures, anesthesia was discontinued. Buprenorphine (0.01 mg/kg) was administered for analgesia immediately prior to surgery and then for three days post-operatively during which time animals were monitored for weight loss, dehydration and lethargy.
Magnetic resonance compatible hypobaric chamber
The hypobaric chamber was constructed around the standard rat MRI bed as it contains the nose cone and other components essential for conducting imaging experiments. A polycarbonate cylinder (4 ft in length, 6.35 mm thick, 82 mm diameter) was used as the chamber body, sealed with removable end caps custom machined with multiple ports (Suppl Figure 1). On the end cap closest to the animals’ head, provisions were made to allow for a 4-channel phased array receiver coil and for providing gas anesthesia. On the other end, ports allowed passage of wire leads (temperature probe and respiration monitor) and tubing (warm water circulation, tubing for vacuum generation, and anesthesia gas circulation). Once the instrumented rat was placed into the animal bed and placed inside the hypobaric chamber, the chamber was sealed by capping both ends. An 86 mm linear volume array coil was then slipped over the plastic chamber and positioned at the center of the rat head with the 4-channel surface coil already in place. Simulated AERH initiated at 24 hpi was maintained for a total of six hours, including a separate 20 minute pressurization and depressurization adjustment period (Suppl Figure 2). Chamber pressure was controlled by adjusting air flow from a constant vacuum generator until 10.9 psi was reached simulating air transport conditions (hypobaria, equivalent to 8000 ft altitude). No vacuum was applied to the chamber for experiments conducted under ground transport conditions.
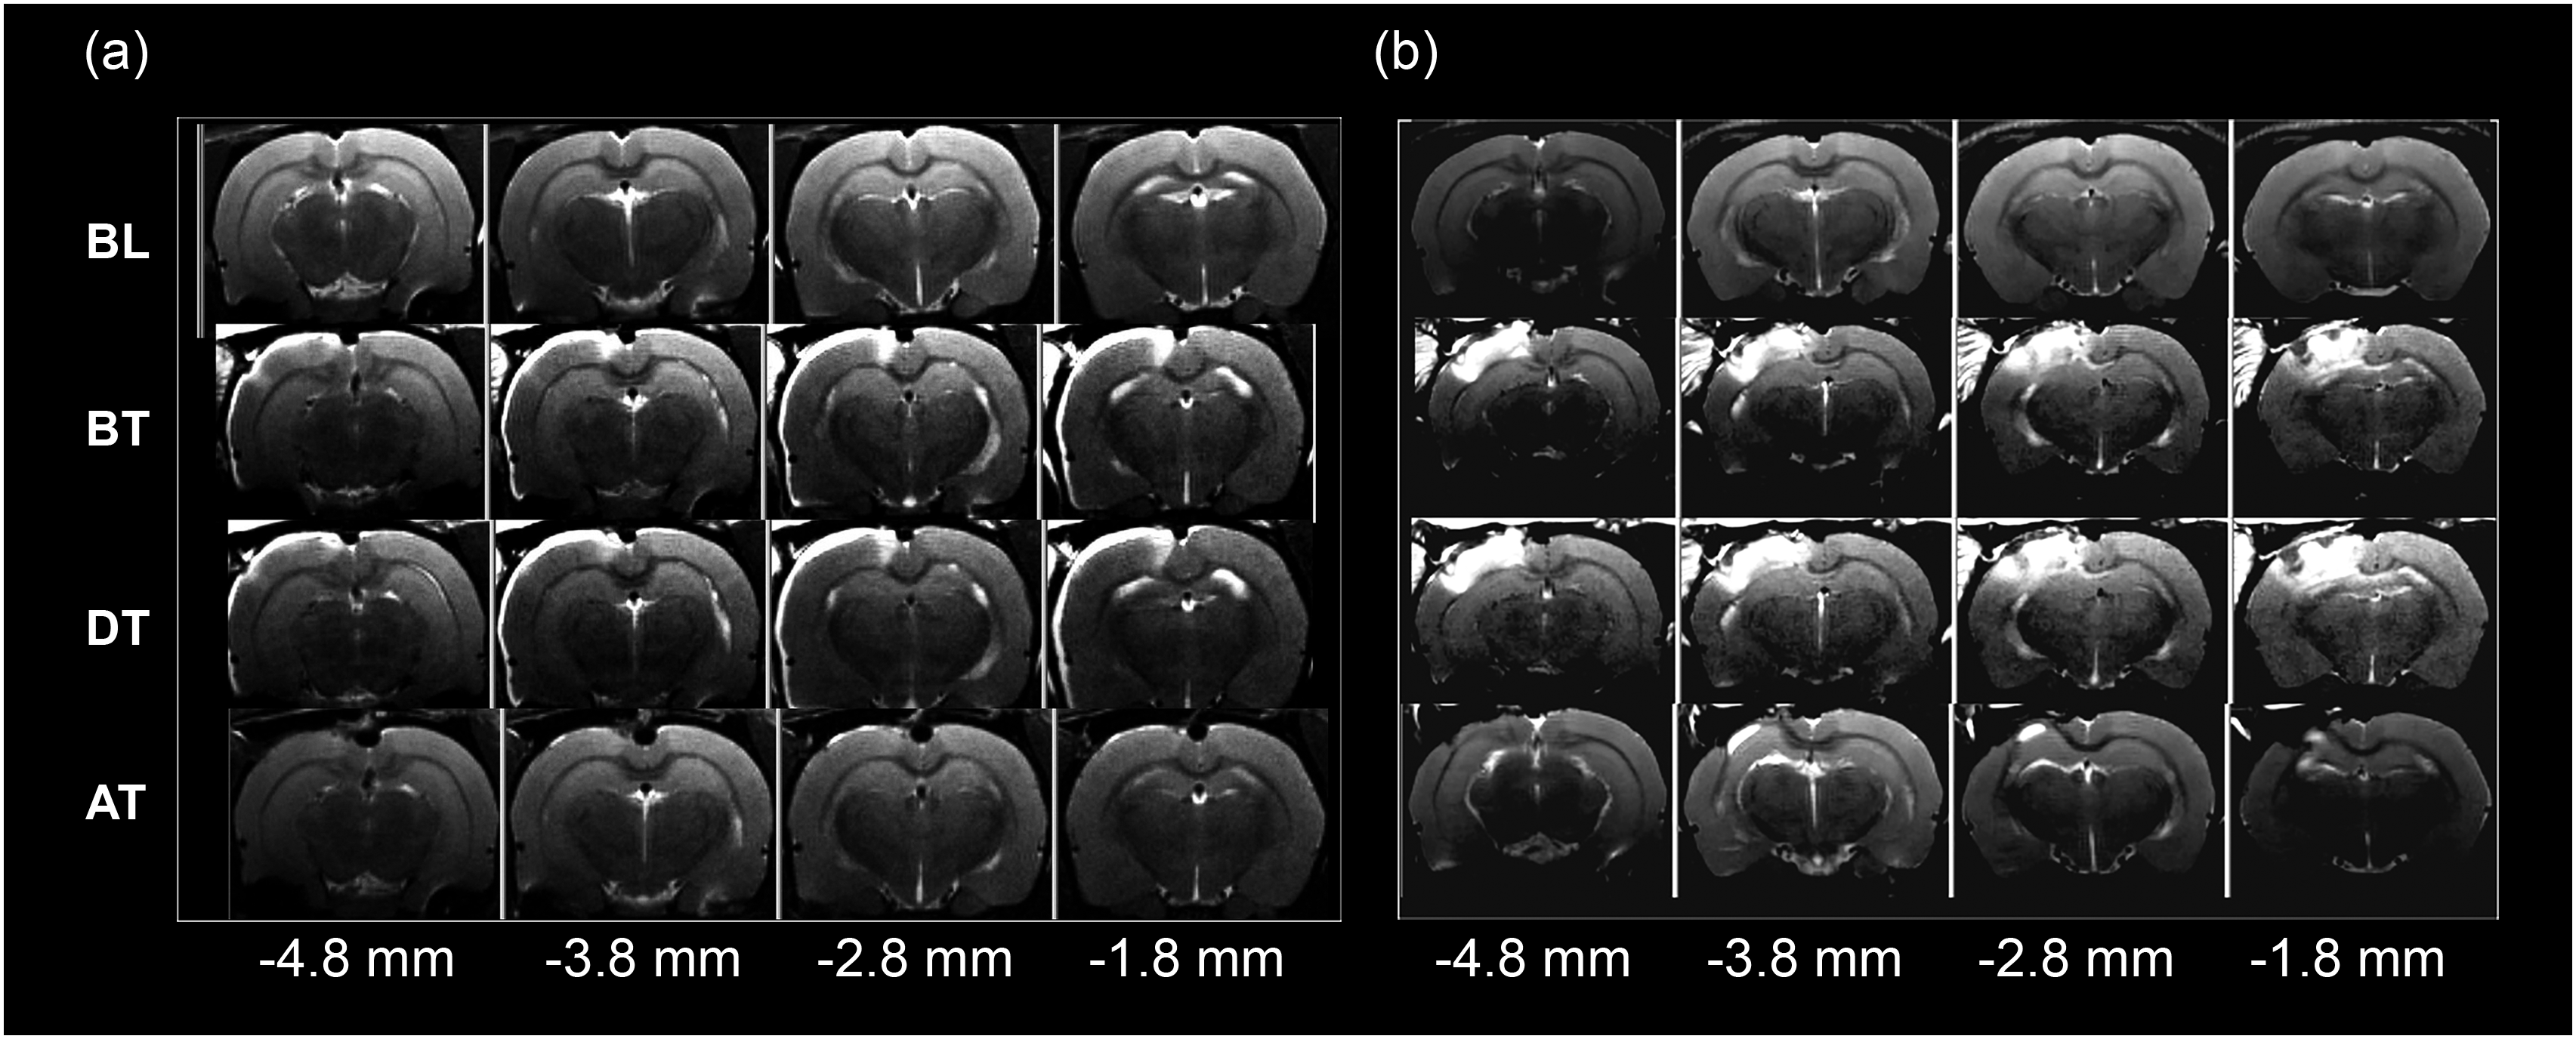
Representative brain MRI images across four bregma levels and four timepoints. (a) Coronal T2-weighted MR images from a rat following craniotomy alone (b) coronal T2- weighted MR images showing evolution of injury following controlled cortical impact BL: baseline, BT: before transport, DT: during transport, AT: after transport.
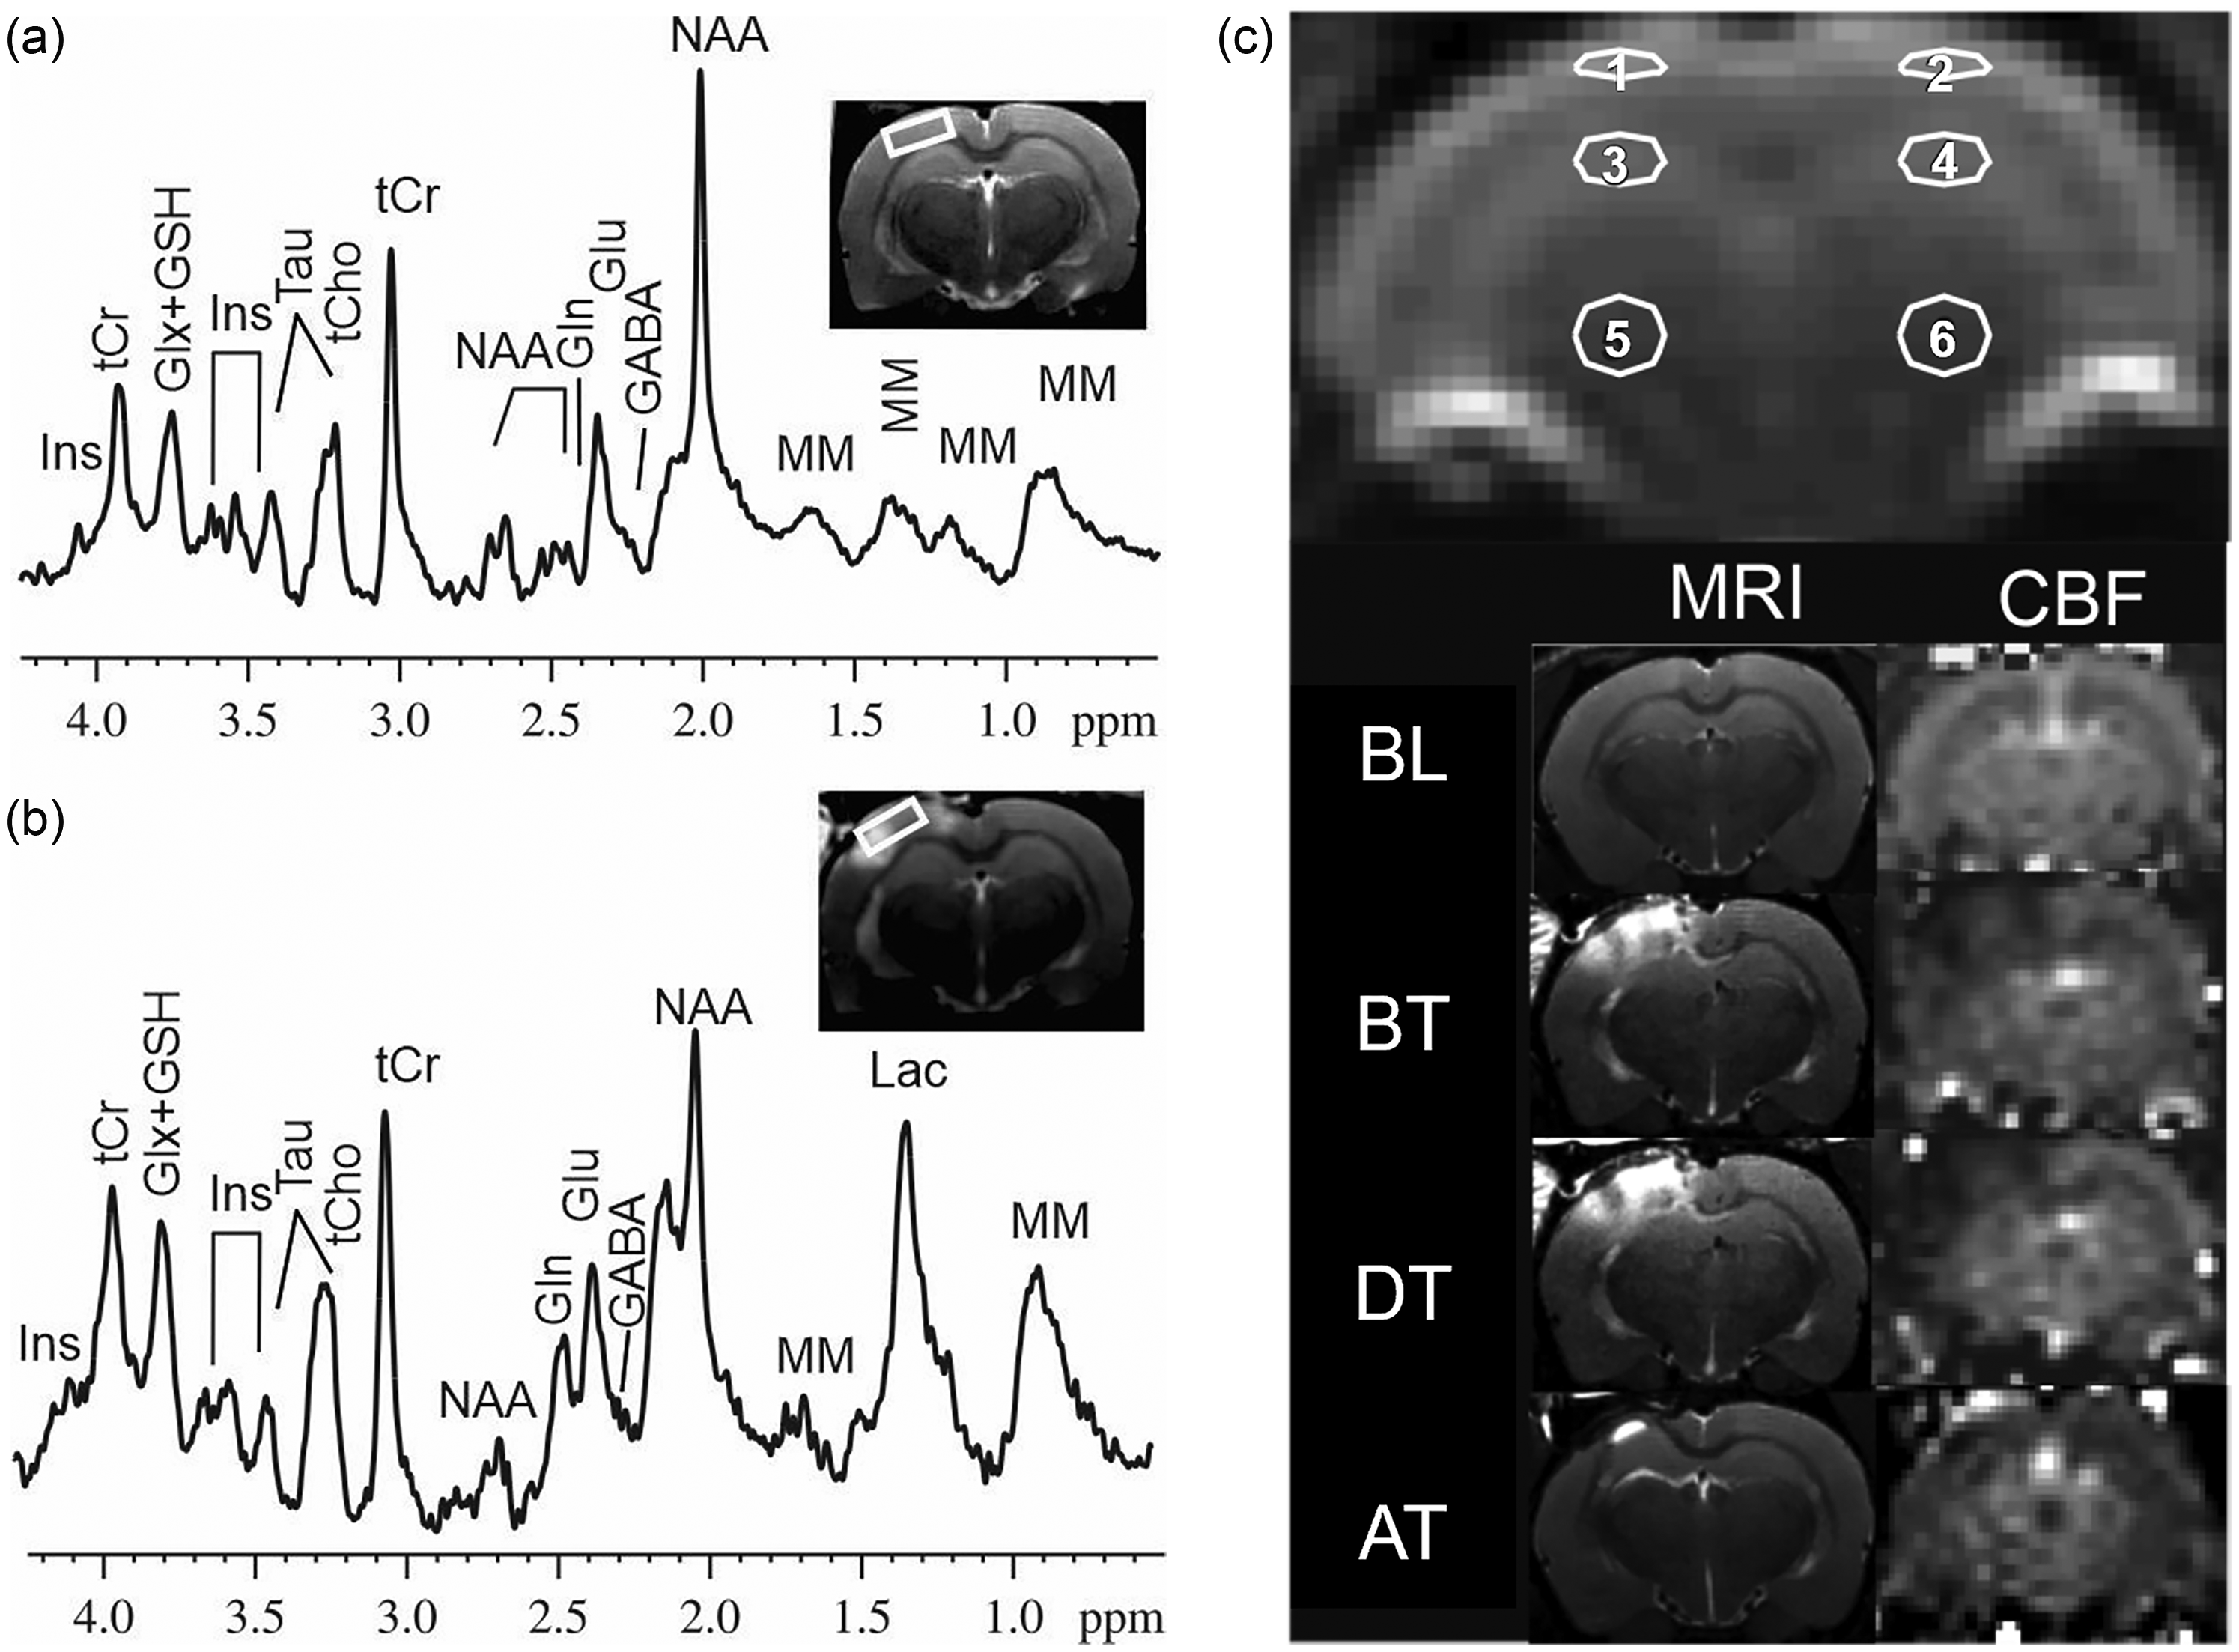
Representative in vivo localized 1H MR spectra taken from the ipsilateral cortex (white box) (a) before injury and (b) during transport. (c) Coronal T2-weighted MR images (left column) and corresponding CBF maps (right column) showing six regions of interest for CBF maps. GABA: γ-aminobutyric acid, Glu: glutamate, Gln: glutamine, Glx: Glu + Gln, GSH: glutathione, Ins: myo-inositol, Lac: lactate, NAA: N-acetyl aspartate, Tau: taurine, tCr: creatine + phosphocreatine, tCho: glycerophosphocholine + phosphocholine, MM: macromolecules. BL: baseline, BT: before transport, DT: during transport, AT: after transport. 1: ipsilateral cortex. 2: contralateral cortex. 3: ipsilateral hippocampus. 4: contralateral hippocampus. 5: ipsilateral thalamus. 6: contralateral thalamus.
MRI and MRS data acquisition
All MRI and MRS studies were performed at the Center for Translational Research in Imaging at the University of Maryland School of Medicine (Baltimore) using a Bruker Biospec 7.0 Tesla 30 cm horizontal bore scanner (Bruker Biospin MRI, Ettlingen, Germany), which was interfaced to a Bruker Paravision 6.0 console for the acquisition of MRI and MRS data. A Bruker 86 mm circular-polarized RF volume coil worked as a transmitter, and Bruker 4-channel array surface coil as a receiver.
Coronal T2-weighted Bruker rapid imaging with refocused echoes (RARE) images were obtained (spin-echo, Repetition time (TR)/echo time (TE) 3000/22 ms, two averages, RARE factor 4, field of view (FOV) 40 × 40 mm2, image matrix 256 × 256, number of slices 16, slice thickness 1 mm, with an acquisition time 6 min 24 s). These images served to verify positioning over the center of the CCI and to determine abnormalities in T2-weighted signal intensity within the slice chosen for subsequent measurements of perfusion and spin-lattice relaxation time (Figure 1(a) and (b)).
CBF was measured using continuous arterial spin labeled (CASL) MRI technique with a spin-echo read-out, a TR/TE of 5000/26.72 ms, FOV 40 × 40 mm2, image matrix 64 × 64, slice thickness 2 mm, in the coronal plane where 5 labeled images and 5 control images with an acquisition time 50 sec on a slice that covered the impacted cortex, hippocampus, and thalamus (Figure 2(c)).16,17 CBF was calculated from:


Proton spectra were obtained from both the left and right cortex (3.5 × 1.5 × 4 mm3) using a proton short-TE Point-RESolved Spectroscopy (PRESS) pulse sequence, TR/TE = 2500/10 ms, and 400 averages, respectively. 19 Sample MR spectrums collected from the cortical region showing signals associated with multiple neurochemicals are shown in Figure 2(a) and (b). The signal intensity, or area under the peak, was calculated and corresponded to a concentration in parts per million (ppm) for each specific neurochemical. The unsuppressed water signal from each of the prescribed voxels was obtained to serve as a reference for determining the specific neurochemical concentrations.
MRI/MRS data collection from rats
Animals were anesthetized (2–5% isoflurane) in an induction chamber, then placed prone on an animal bed with designated O2 level mixed with medical air administration at 0.8 L/min. The head was fixed with a bite bar and a pair of ear pins. The 4-channel radio frequency receiver coil was then centered and fixed over the head. Imaging was initiated while the anesthesia was maintained at 1–3% isoflurane via nosecone throughout the rest of the imaging session. An MR-compatible system was used to monitor respiration rate, and body temperature was maintained at 35–37.5°C using a circulating warm water heater. Pulse oximetry measurements made under anesthesia during scanning procedures indicated that SpO2 was maintained at 95–99% saturation for all animal groups.
Magnetic resonance scans were collected at the following time points: Baseline 48 hr before surgery (BL), 24 hr after surgical injury immediately before transport (BT), during transport (DT), and 14 days after transport (AT).
Baseline scans and those collected before and after transport were performed under simulated “ground transport” (normobaria at sea level) and normoxic (30% O2) conditions. Scans conducted during transport were made under a combination of simulated “ground transport” (normobaria at sea level) or air transport (hypobaria equivalent to 8000 ft) barometric pressure and normoxic (30% O2 with normobaria and 40% O2 with hypobaria) or hyperoxic (100% O2) conditions. This level of supplemental O2 was delivered to prevent hypoxia and was necessary to offset the displacement of O2 observed with long durations of isoflurane anesthesia and to account for the reduced O2 availability at increasing altitudes.
MRI/MRS data processing and analysis
Pixel-by-pixel maps of CBF generated from parent images of the perfusion studies using equation (1) and maps of T1obs generated from the series of variable TR spin-echo were programed using equation (2) in Matlab. Manually drawn regions of interest (ROIs) were initially defined within left (ipsilateral) and right (contralateral) cortex, hippocampus, and thalamus on the control images from perfusion experiments (Figure 2(c)) by assignments from a rat brain atlas. 20 Due to TBI induced brain damage, and resulting edema, images showed structural differences in injured tissue. These differences have the potential to vary from time point to time point in the same animal, especially around the three ipsilateral ROIs. The degree of brain tissue damage might also be different among different animals. Given these confounders, we manually drew the ROIs in each animal at each time point, respectively. After the neuroanatomical region for quantification was identified, a smaller ROI was manually drawn inside the boundaries of that specific nuclei. For this reason, even if the ROI location was slightly mismatched from one time point to another, it was still within the target anatomical region. To verify whether reliability of results, we varied the sizes and locations of the ROIs in the same animal with consistent results.
CBF was calculated for each ROI using equation (1). A spatially constant value of 0.9 ml/g was assumed for the blood-brain partition coefficient λ.21 The labeling efficiency, α was set to 0.7 for all CBF calculations. 22
Quantification of the MRS was based on frequency domain analysis using a “Linear Combination of Model spectra” (LCModel). 23 Absolute concentrations were estimated with the LCModel automatic procedure (version 6.3-0 G). Only those neurochemicals that passed the Cramer-Rao lower bound of ≤30% were considered for further analysis. The following neurochemicals were identified gamma amino butyric acid (GABA), glutamine (Gln), glutamate (Glu), glutathione (GSH), glutamate plus glutamine (Glx), lactate (Lac), N-acetyl aspartate (NAA), Inositol (Ins), taurine (Tau), total creatine (tCr), total choline (tCho), and macromolecules (MM).
Cortical areas on T2 images appearing bright white were classified as “hyperintensities” (HI) and areas appearing matte gray were classified as “healthy” (Figure 1(a) and (b)). Areas quantified from 1 mm thick sections were summed to calculate cortical volumes (mm3) at each of the four timepoints using ImageJ.
Immunohistochemical evaluation of neuroinflammation
Brains were perfusion fixed with 4% paraformaldehyde at 14 dpi and immunostained using antibodies against ED1 (mouse Anti-ED1, 1:100,000, Bio-Rad), a marker of inflammatory activation of macrophages and microglia. 6
Seven ED1 immunolabelled brain sections (40 µm thick, 960 µm apart) were used for stereologic quantification of cortical lesion volume (mm3), the first corresponding to the epicenter of cortical injury, then 3 sections both rostral and caudal to that section. Volume/area were measured according to the Cavelieri method. 24 Analysis was performed using a Nikon E800 motorized microscope under 10x magnification by a microscopist blinded to animal treatment group. A 25 × 25 µm grid was generated and placed by StereoInvestigator software (Microbrightfield Biosciences, Vermont, USA). The impact-induced necrotic divot was characterized by missing or fenestrated tissue where dorsal borders were estimated based on cortical thickness present on the contralateral hemisphere of the same section. Tissue surrounding the divot demonstrating an abundance of ED1 positive cells was classified as ‘penumbra’. Necrotic divot and inflammatory penumbral volumes were combined and expressed as the total lesion volume.
Study design and data analysis
Statistical analysis was performed with SigmaPlot (Systat Software, Inc., San Jose, California, USA, Version 12.5) using an analysis of variance (ANOVA) for histopathologic lesion volume data. Group-level and longitudinal comparisons were performed on CBF, T2 MR images, and individual neurochemicals data by 2-way repeated measure (RM) ANOVA on the RANKS. Assumptions of normality and equal variance were tested using the Shapiro-Wilks and Brown-Forsythe methods respectively, prior to analyzing data with an ANOVA or RM ANOVA. Pairwise multiple comparison procedures (Tukey) were used as a post-hoc test. A priori group sizes were set at n = 6 where individual rats served as the experimental unit. Sample size under this study was selected following a power analysis to provide greater than 80% power to detect a 25% difference in cerebral blood flow between experimental and control groups. Significance was set at 0.05 and within group standard deviations were estimated at 10% of the mean. No animals were excluded from the study due to meeting the exclusion criteria of having a ruptured dura, however, one animal was excluded due to surgical complications and not replaced. Technicians were blinded to treatment identifiers during surgical, imaging and data collection phases. Animals were randomized into a total of six treatment groups using simple random sampling where confounders of order of measurements and cage location were not controlled.
There were a total of six groups: Sham normobaria with 30% O2 (Sham NB, n = 5), sham hypobaria with 40% O2 (Sham HB, n = 6), CCI normobaria with 30% O2 normoxia (NB/NOR, n = 6), CCI normobaria with 100% O2 hyperoxia (NB/HYP, n = 6), CCI hypobaria with 40% O2 normoxia (HB/NOR, n = 6) and CCI hypobaria with 100% O2 hyperoxia (HB/HYP, n = 6) for a total of 35 rats.
Results
This study examined changes in CBF, brain neurochemicals, and neuropathology due to three main variables: 1. Surgical Injury (BL vs BT), 2. simulated air or ground transport (NB vs HB groups), and 3. ambient oxygen concentration (NOR vs HYP groups) during transport. The term “surgical injury” refers to an effect due to either the craniotomy alone in shams or the craniotomy and impact in injured groups
Cerebral blood flow (CBF)
CBF maps covered ipsilateral and contralateral cortex, hippocampus, and thalamus (Figure 2(c)). Low signal regions indicate decreased CBF values. A summary of group means and standard deviations for regional blood flow measurements are presented in Supplemental Table 1. Craniotomy and TBI alone resulted in an acute reduction in CBF at 24 hr after surgical injury (BT vs BL) to the cortex and hippocampus underlying the site of cortical impact regions (Figure 3(a) and (b)).
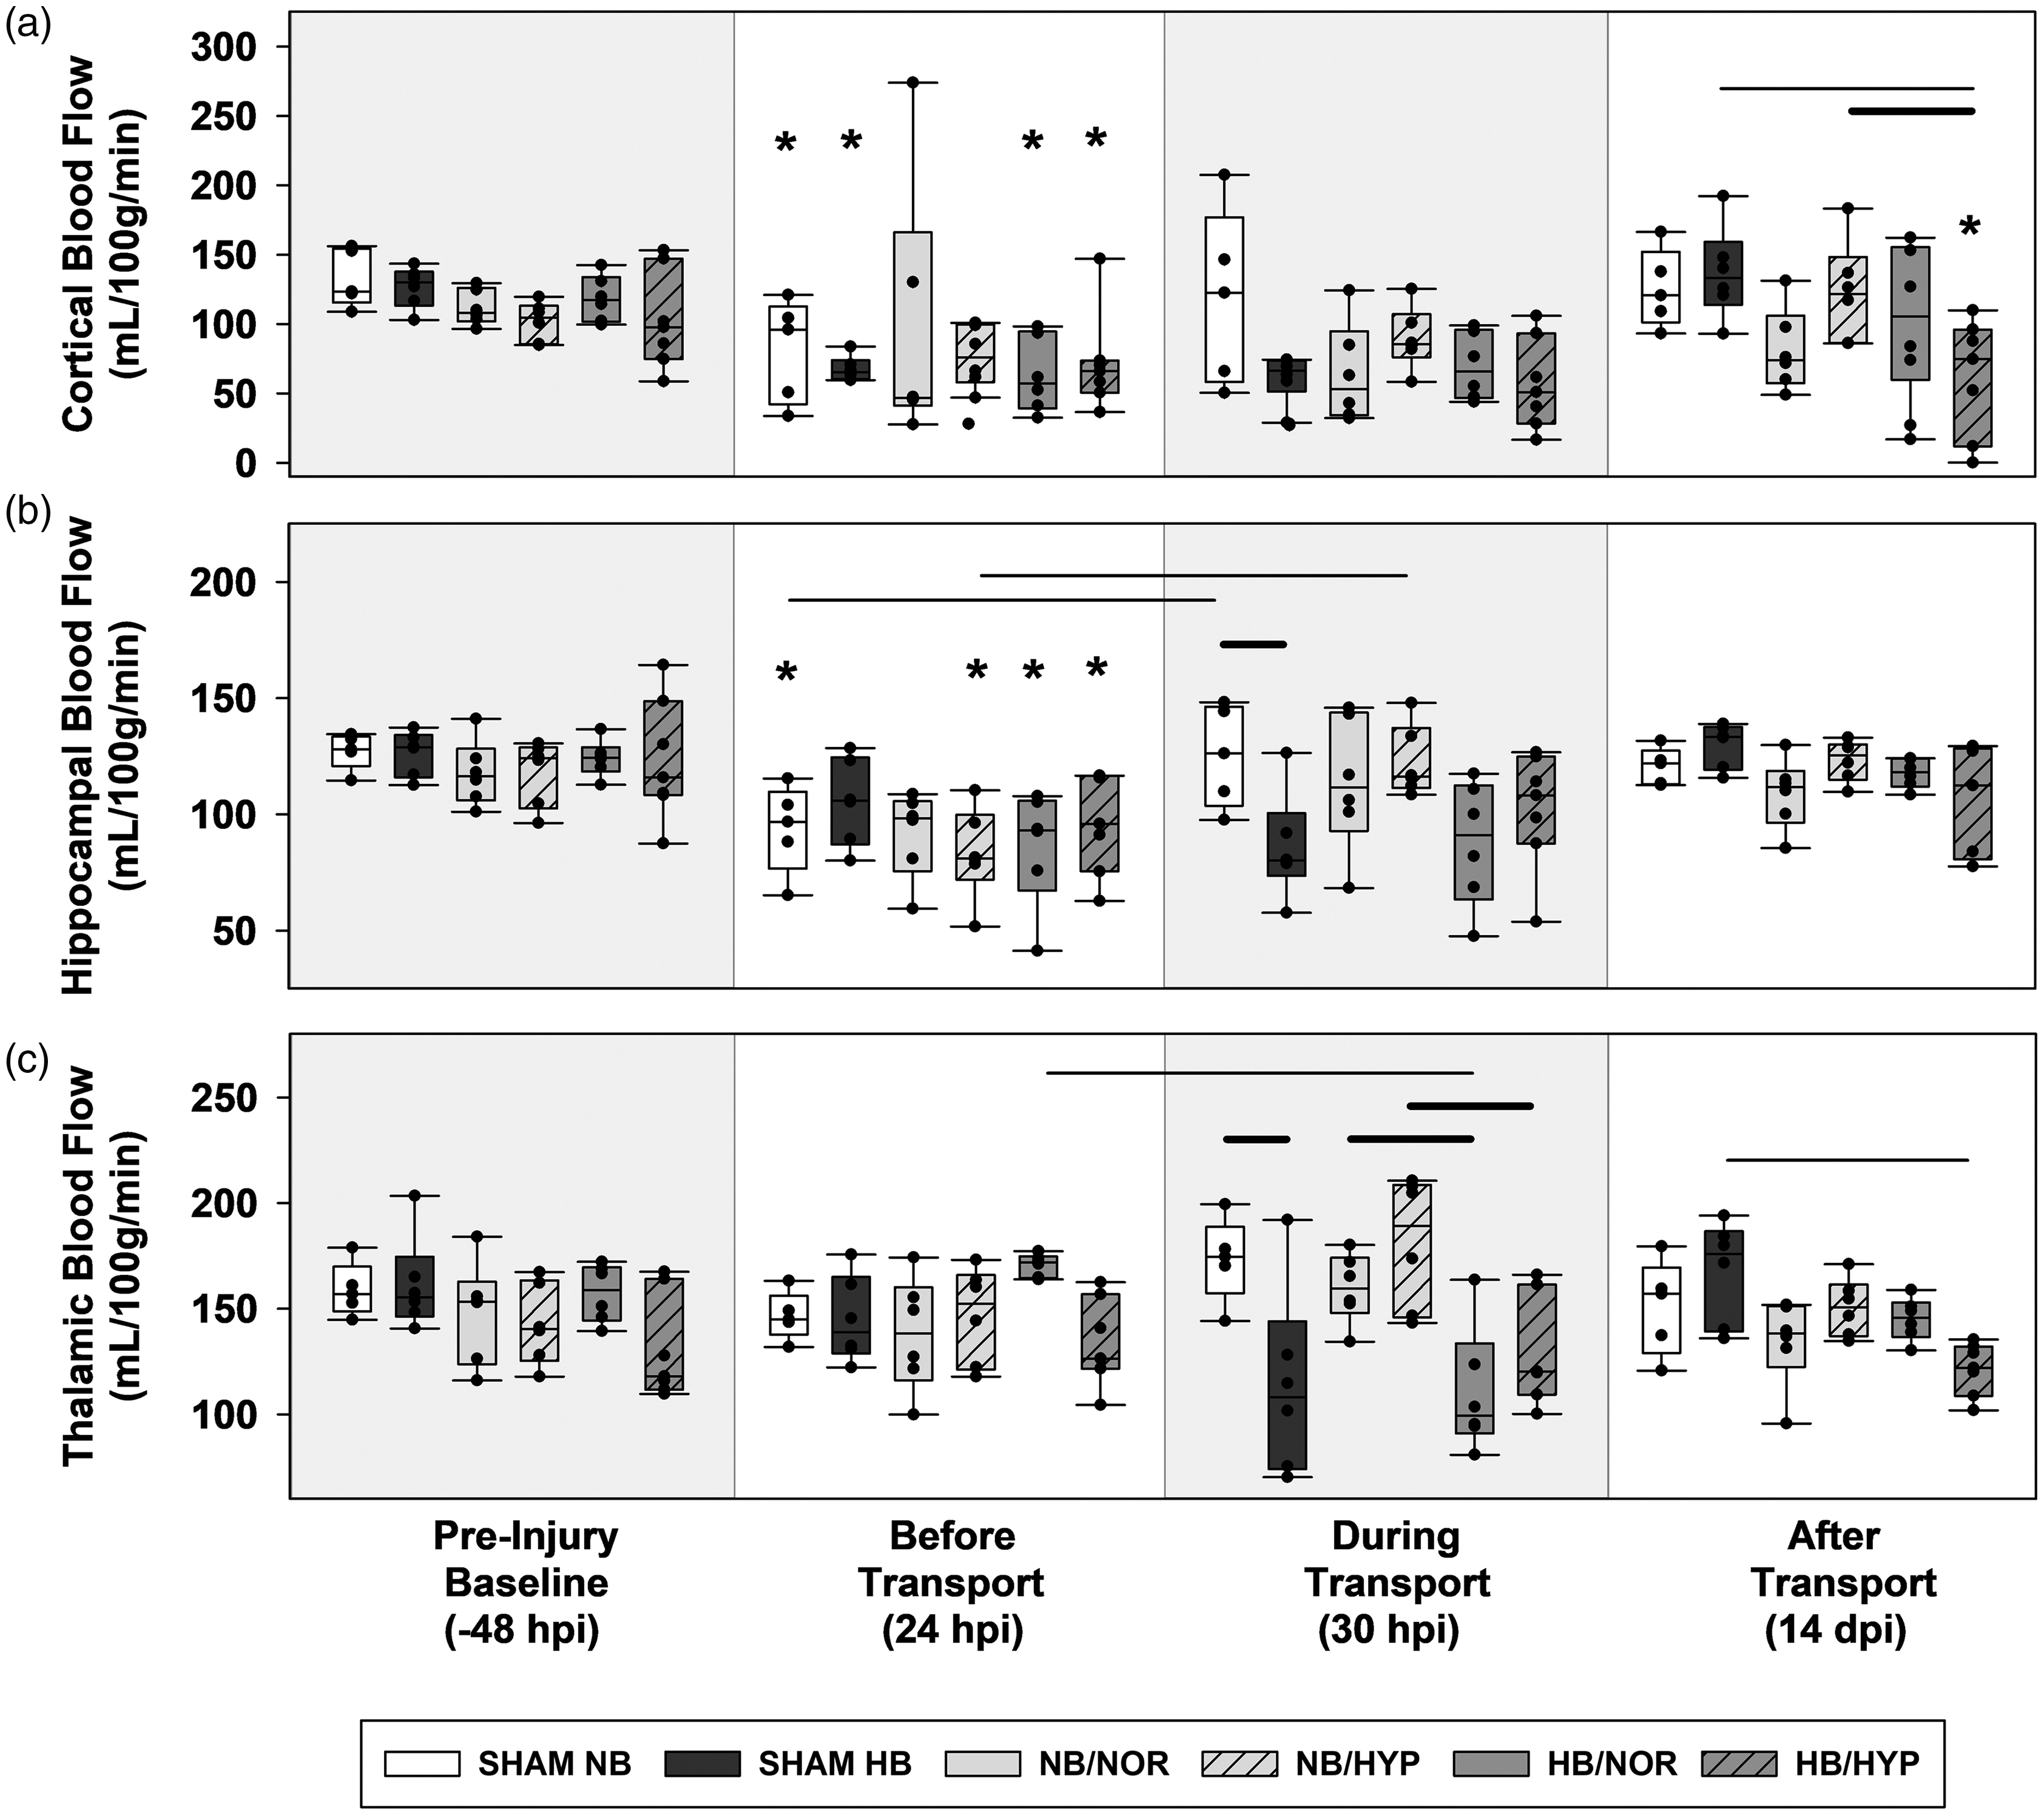
Box-and-Whisker plots of post injury CBF. (a) ipsilateral cortex. (b) ipsilateral hippocampus and (c) ipsilateral thalamus. Effects of Surgical injury: solid line; Effects of hypobaria: bold solid line. Effects of hyperoxia: dotted line. Asterisks indicate significance compared to groups own Pre-Injury Baseline values. All lines and asterisks indicate p < .05.
Post-injury hypobaria exposure resulted in lower cerebral blood flow to the bilateral thalamus during flight (DT) compared to groups maintained under normobaria (Figures 3(c) and 4(c)). Although a trend towards lower CBF was also found during transport in the ipsilateral hippocampus of all groups exposed to hypobaria, this decrease was only significant between sham groups, suggesting that hypobaria in general causes a reduction in regional CBF regardless of injury (Figure 3(b)).
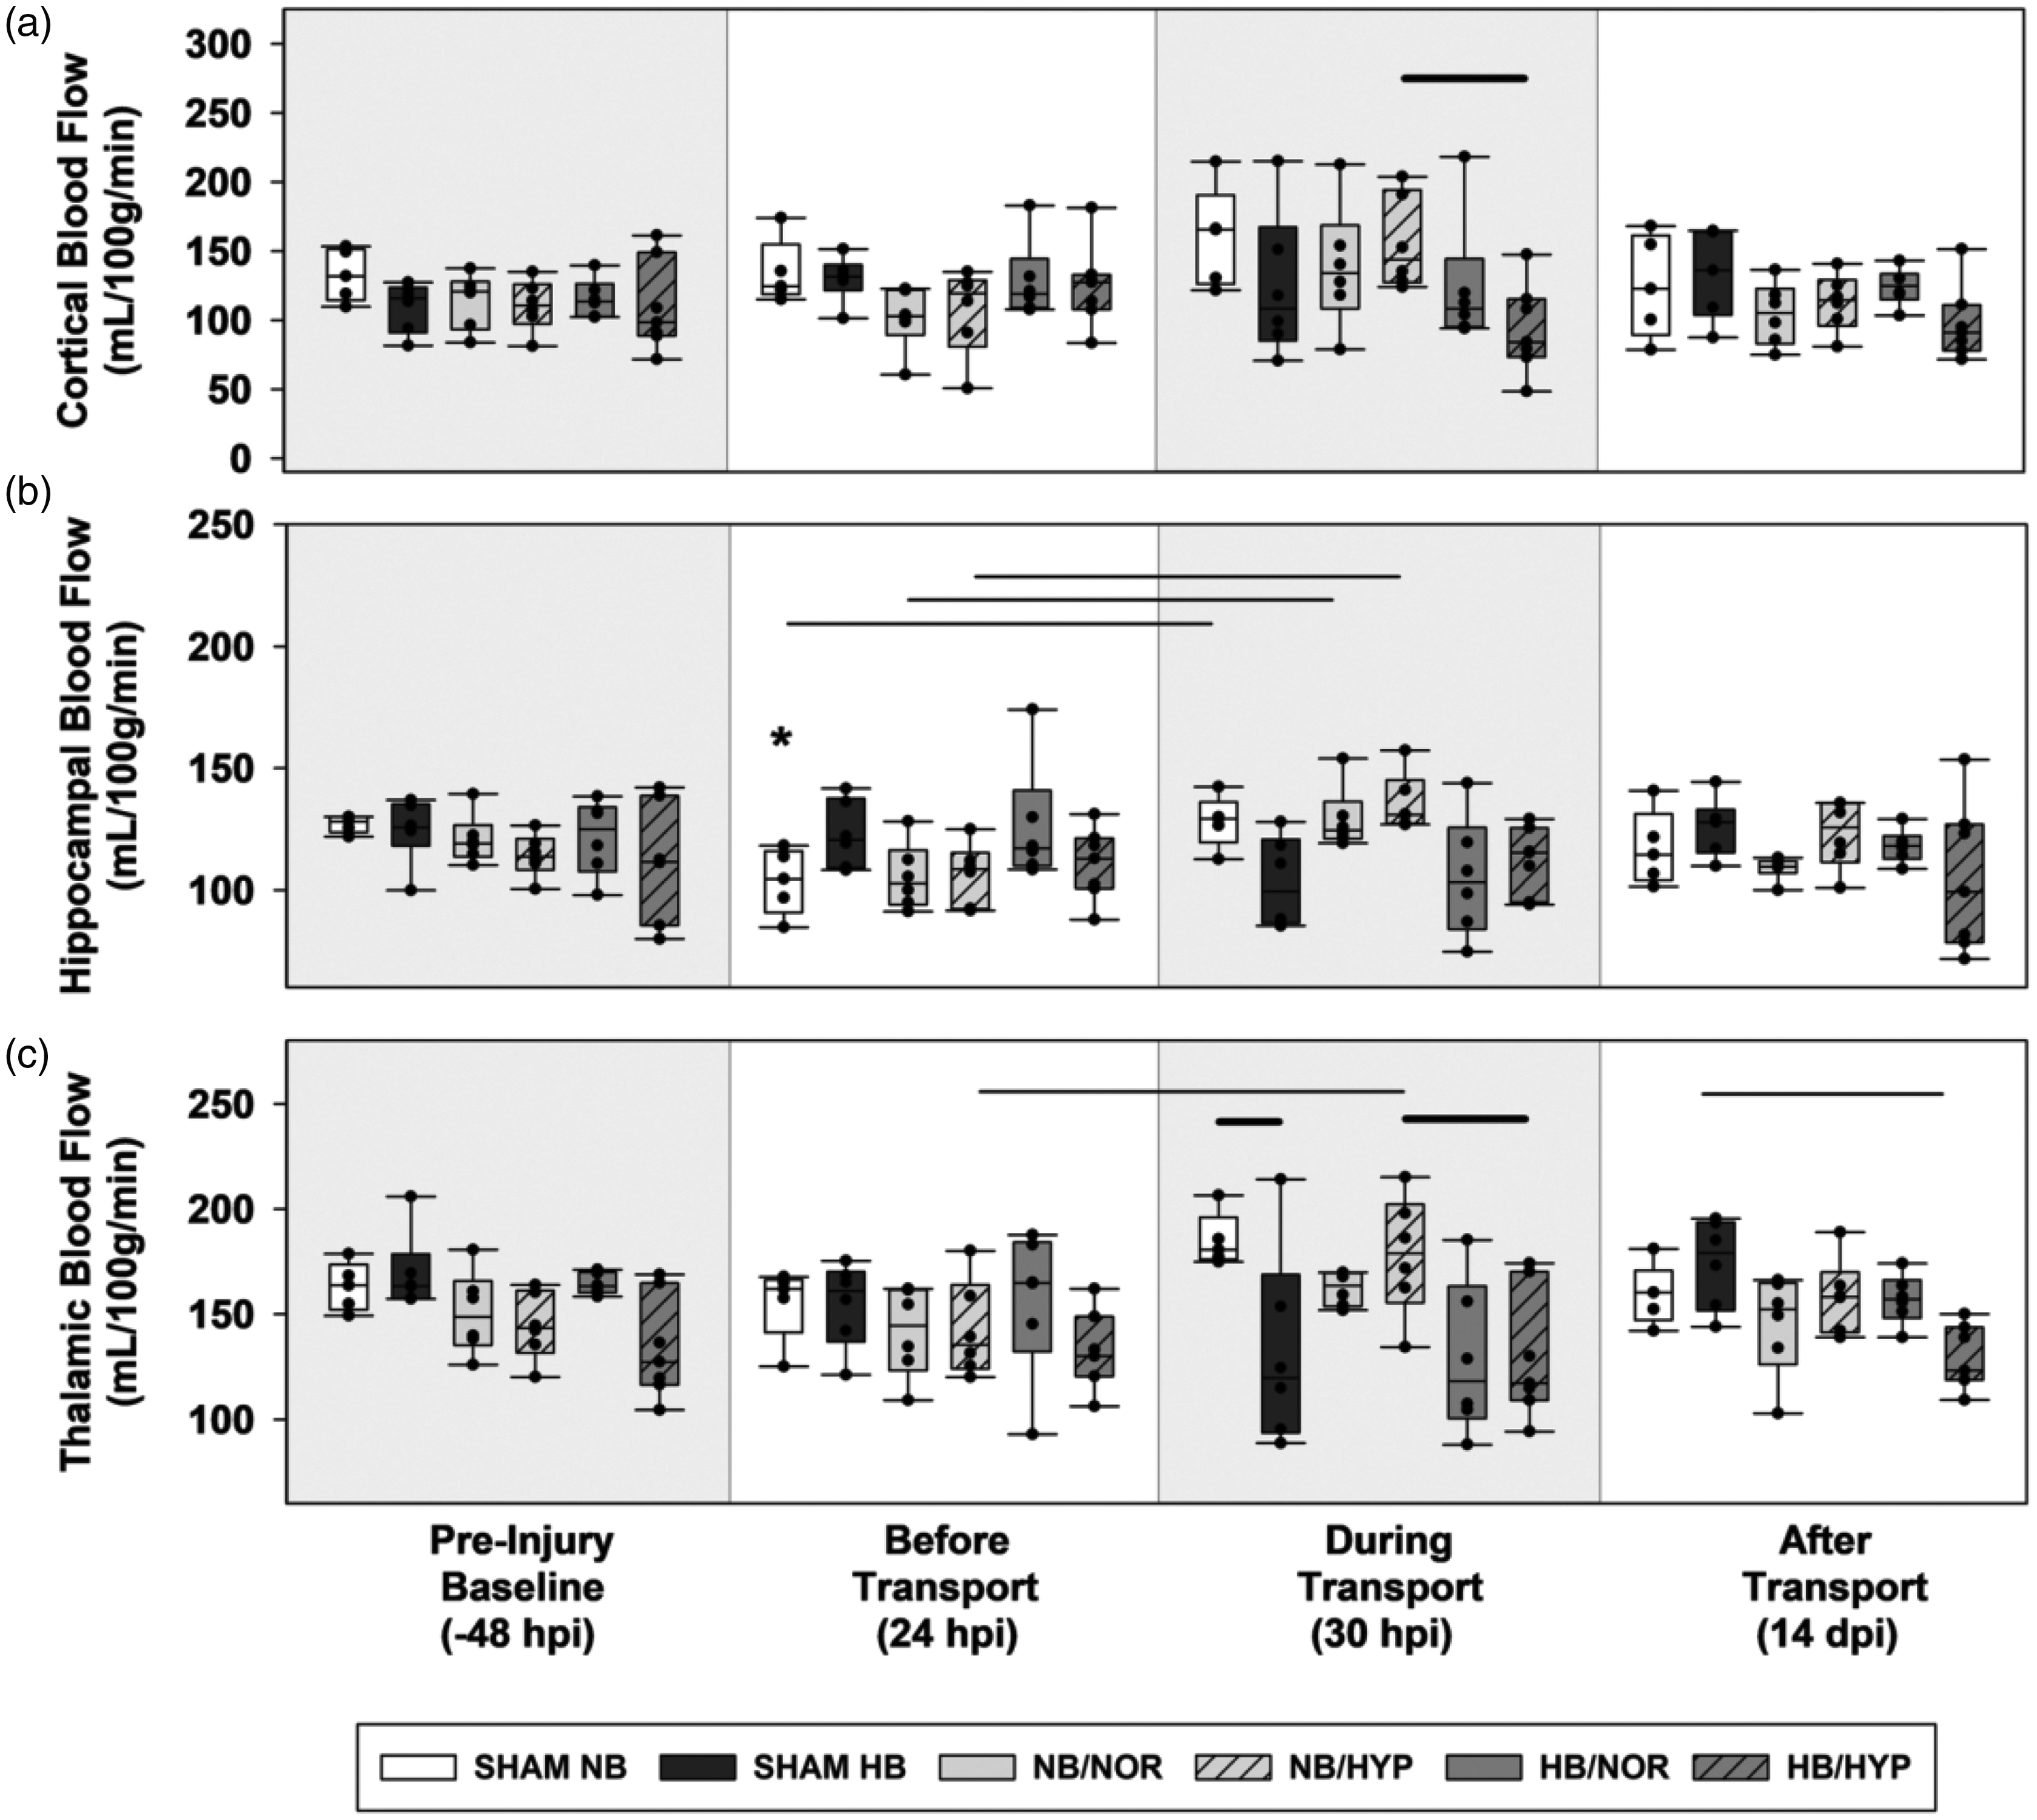
Box-and-Whisker plots of post injury CBFs. (a) contralateral cortex. (b) contralateral hippocampus and (c) contralateral thalamus. Effects of Surgical injury: solid line; Effects of hypobaria: bold solid line; Effects of hyperoxia: dotted line. Asterisks indicate significance compared to groups own Pre-Injury Baseline values. All lines and asterisks indicate p < .05.
In the cortex, acute differences in blood flow due to AERH were detected in contralateral, but not ipsilateral, hemispheres at 24 hr after impact (Figure 4(a)). By 14 dpi, brain injured rats exposed to hypobaria under 100% O2 had lower cortical blood flow (Figure 3(a)) to the injured cortex compared to those maintained at sea level (NB/HYP vs HB/HYP). Rats exposed to HB/HYP also had lower levels of blood flow to the ipsilateral cortex (Figure 3(a)) and bilateral thalamus (Figures 3(c) and 4(c)) at 14 dpi compared to sham groups transported under hypobaria (HB/HYP vs SHAM HB). There were no significant effects of hyperoxia alone on CBF detected at acute or delayed timepoints.
Cortical pathology
General pathophysiological processes including vascular disruption, infarction, hemorrhage, inflammatory cellular infiltration, edema, and gliosis were observed in and around the lesion (Figures 1 and 5), as has been observed by us and others using the CCI model.15,25,26 Although craniotomy alone resulted in minor localized injury, CCI induced a distinct but heterogeneous area of hyperintensity on T2-weighted MR images (Figure 5(b) and (c)) at the impact site at 24 hr. Quantification of MR volumes from T2 images (Figure 5(e)) demonstrated that although the lesion was partially resolved, it persisted at least 14 days after injury compared to sham injured animals. Sham, but not injured, rats exposed to AERH had higher cortical MR hyperintensity volumes during flight. Sham surgery (Figure 5(a)) produced a slight deformation (white arrow) and a localized inflammatory reaction (black arrow), visualized through T2 MR images and ED1 immunolabeling of macrophages.
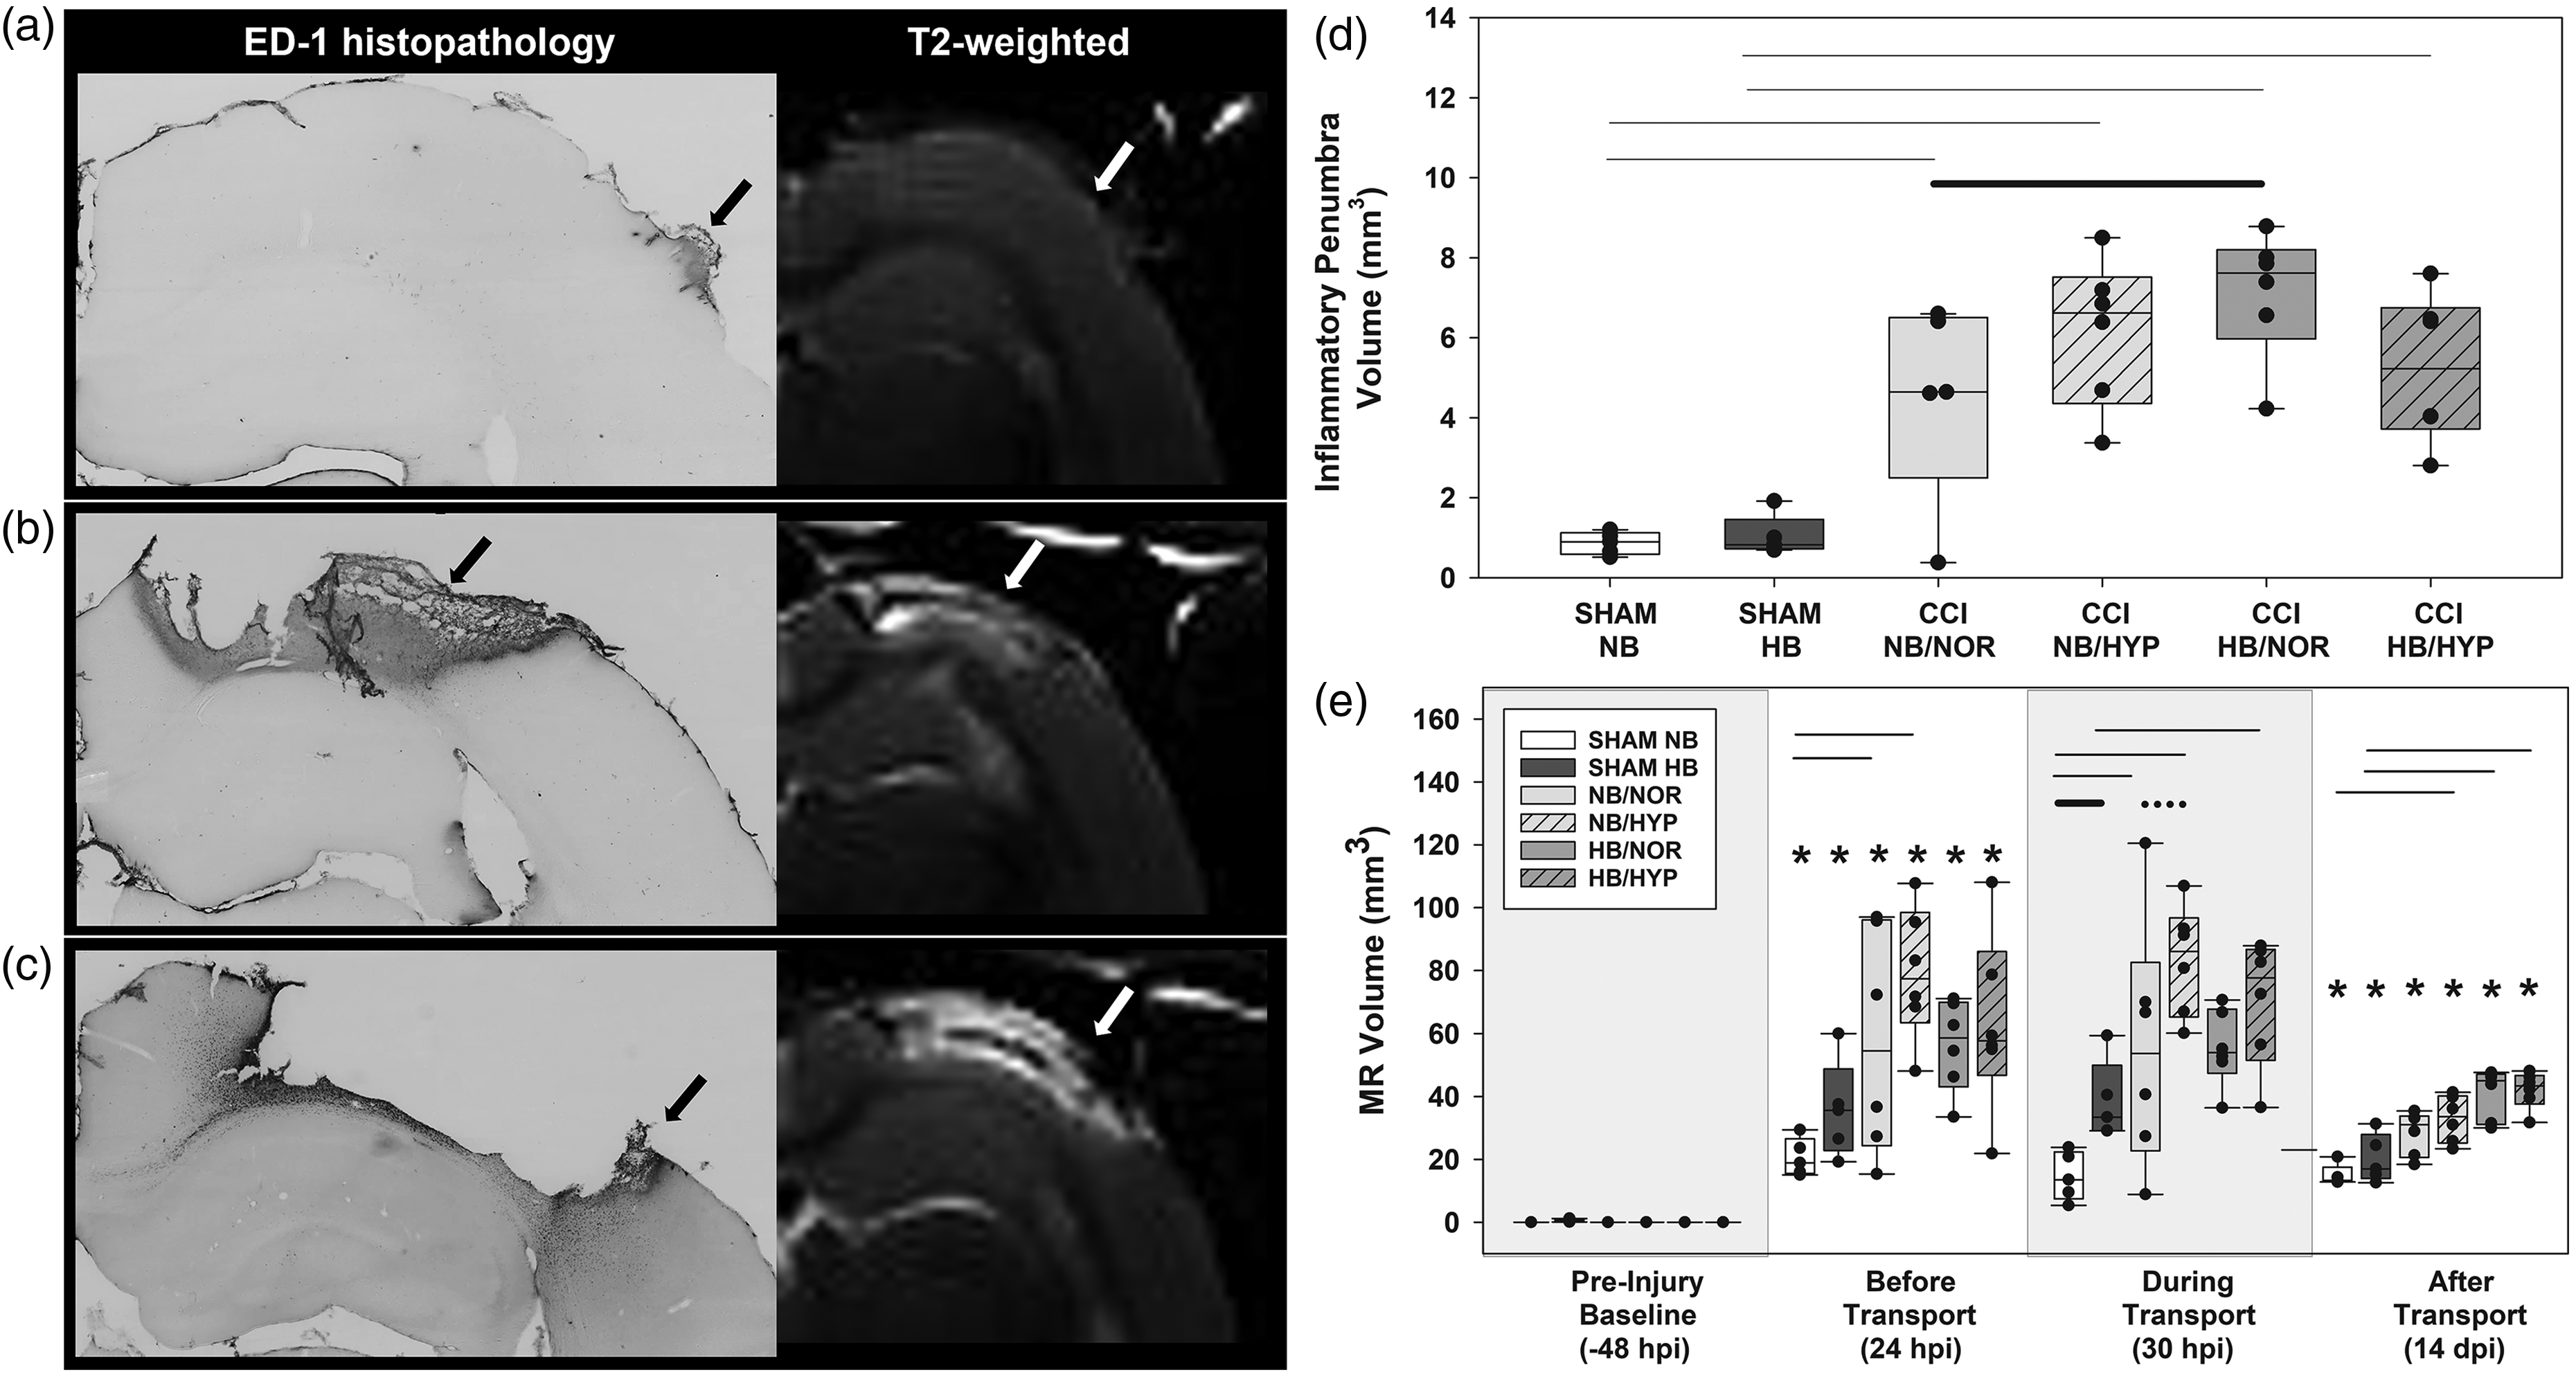
In vivo and ex vivo quantification of cortical pathology. Representative images of ED1 immunolabeled cortex at 14 days after (a) Sham with NB transport (b) CCI with NB/NOR transport or (c) CCI with HB/NOR transport. (d) Inflammatory penumbra quantification from ED1 immunostaining and (e) hyperintensity volume quantification from in vivo MR images. Effects of Surgical injury: solid line; Effects of hypobaria: bold solid line; Effects of hyperoxia: dotted line; Asterisks indicate significance compared to groups own Pre-Injury Baseline values. All lines and asterisks indicate p < .05.
CCI resulted in an ipsilateral necrotic divot along with a sizable ED1+ inflammatory penumbra (Figure 5(d)) at 14 days post injury. The necrotic divot and ED1+ inflammatory penumbra corresponds to the hyperintensity area on T2-weighted MR images. There was a moderate positive correlation between MR hyperintensity volumes measured during transport and subsequent ED1 histopathology measured at 14 dpi, r(32) = .52, p<.001. Linear regression analysis showed this relationship was significant (p = .002). This moderately positive relationship remained significant up to 14 days after injury, r(32) = .65, p < .001.
Following cortical injury, hypobaria exposure resulted in higher ED1+ inflammatory penumbra volumes (Figure 5(d)) without increasing the cortical hyperintensity volume (Figure 5(b) and (c) white arrow) quantified from T2 weighted images (Figure 5(e)). We observed no significant effects of hyperoxia on MR volumes or cortical inflammation (ED1) at the delayed timepoint of 14 dpi.
Cortical neurochemicals
1H magnetic resonance spectra (Figure 2(a) and (b)) demonstrated excellent spectral resolution and sensitivity at each timepoint measured. Cortical neurochemicals were compared from single-voxel spectroscopy taken near the location of the impact and a similar location contralateral to the lesion. A summary of group means and standard deviations for all cortical neurochemicals measured are presented in Supplemental Tables 2 (ipsilateral) and Table 3 (contralateral). Cortical Lac (Supplemental Figure 3) and Gln increased due to surgical injury while concentrations of GABA, GSH, GPC+PCh, NAA, Ins, Tau, tCr, and Glu were reduced at 24 hpi (Figure 6(a) to (d) BL vs BT). Of these metabolites, all but GABA, Glu, NAA, and tCr recovered to baseline levels by 14 dpi (Figure 6). Surgical injury alone did not alter neurochemical levels measured from contralateral cortex at 24 hr or 14 dpi (Figure 7).
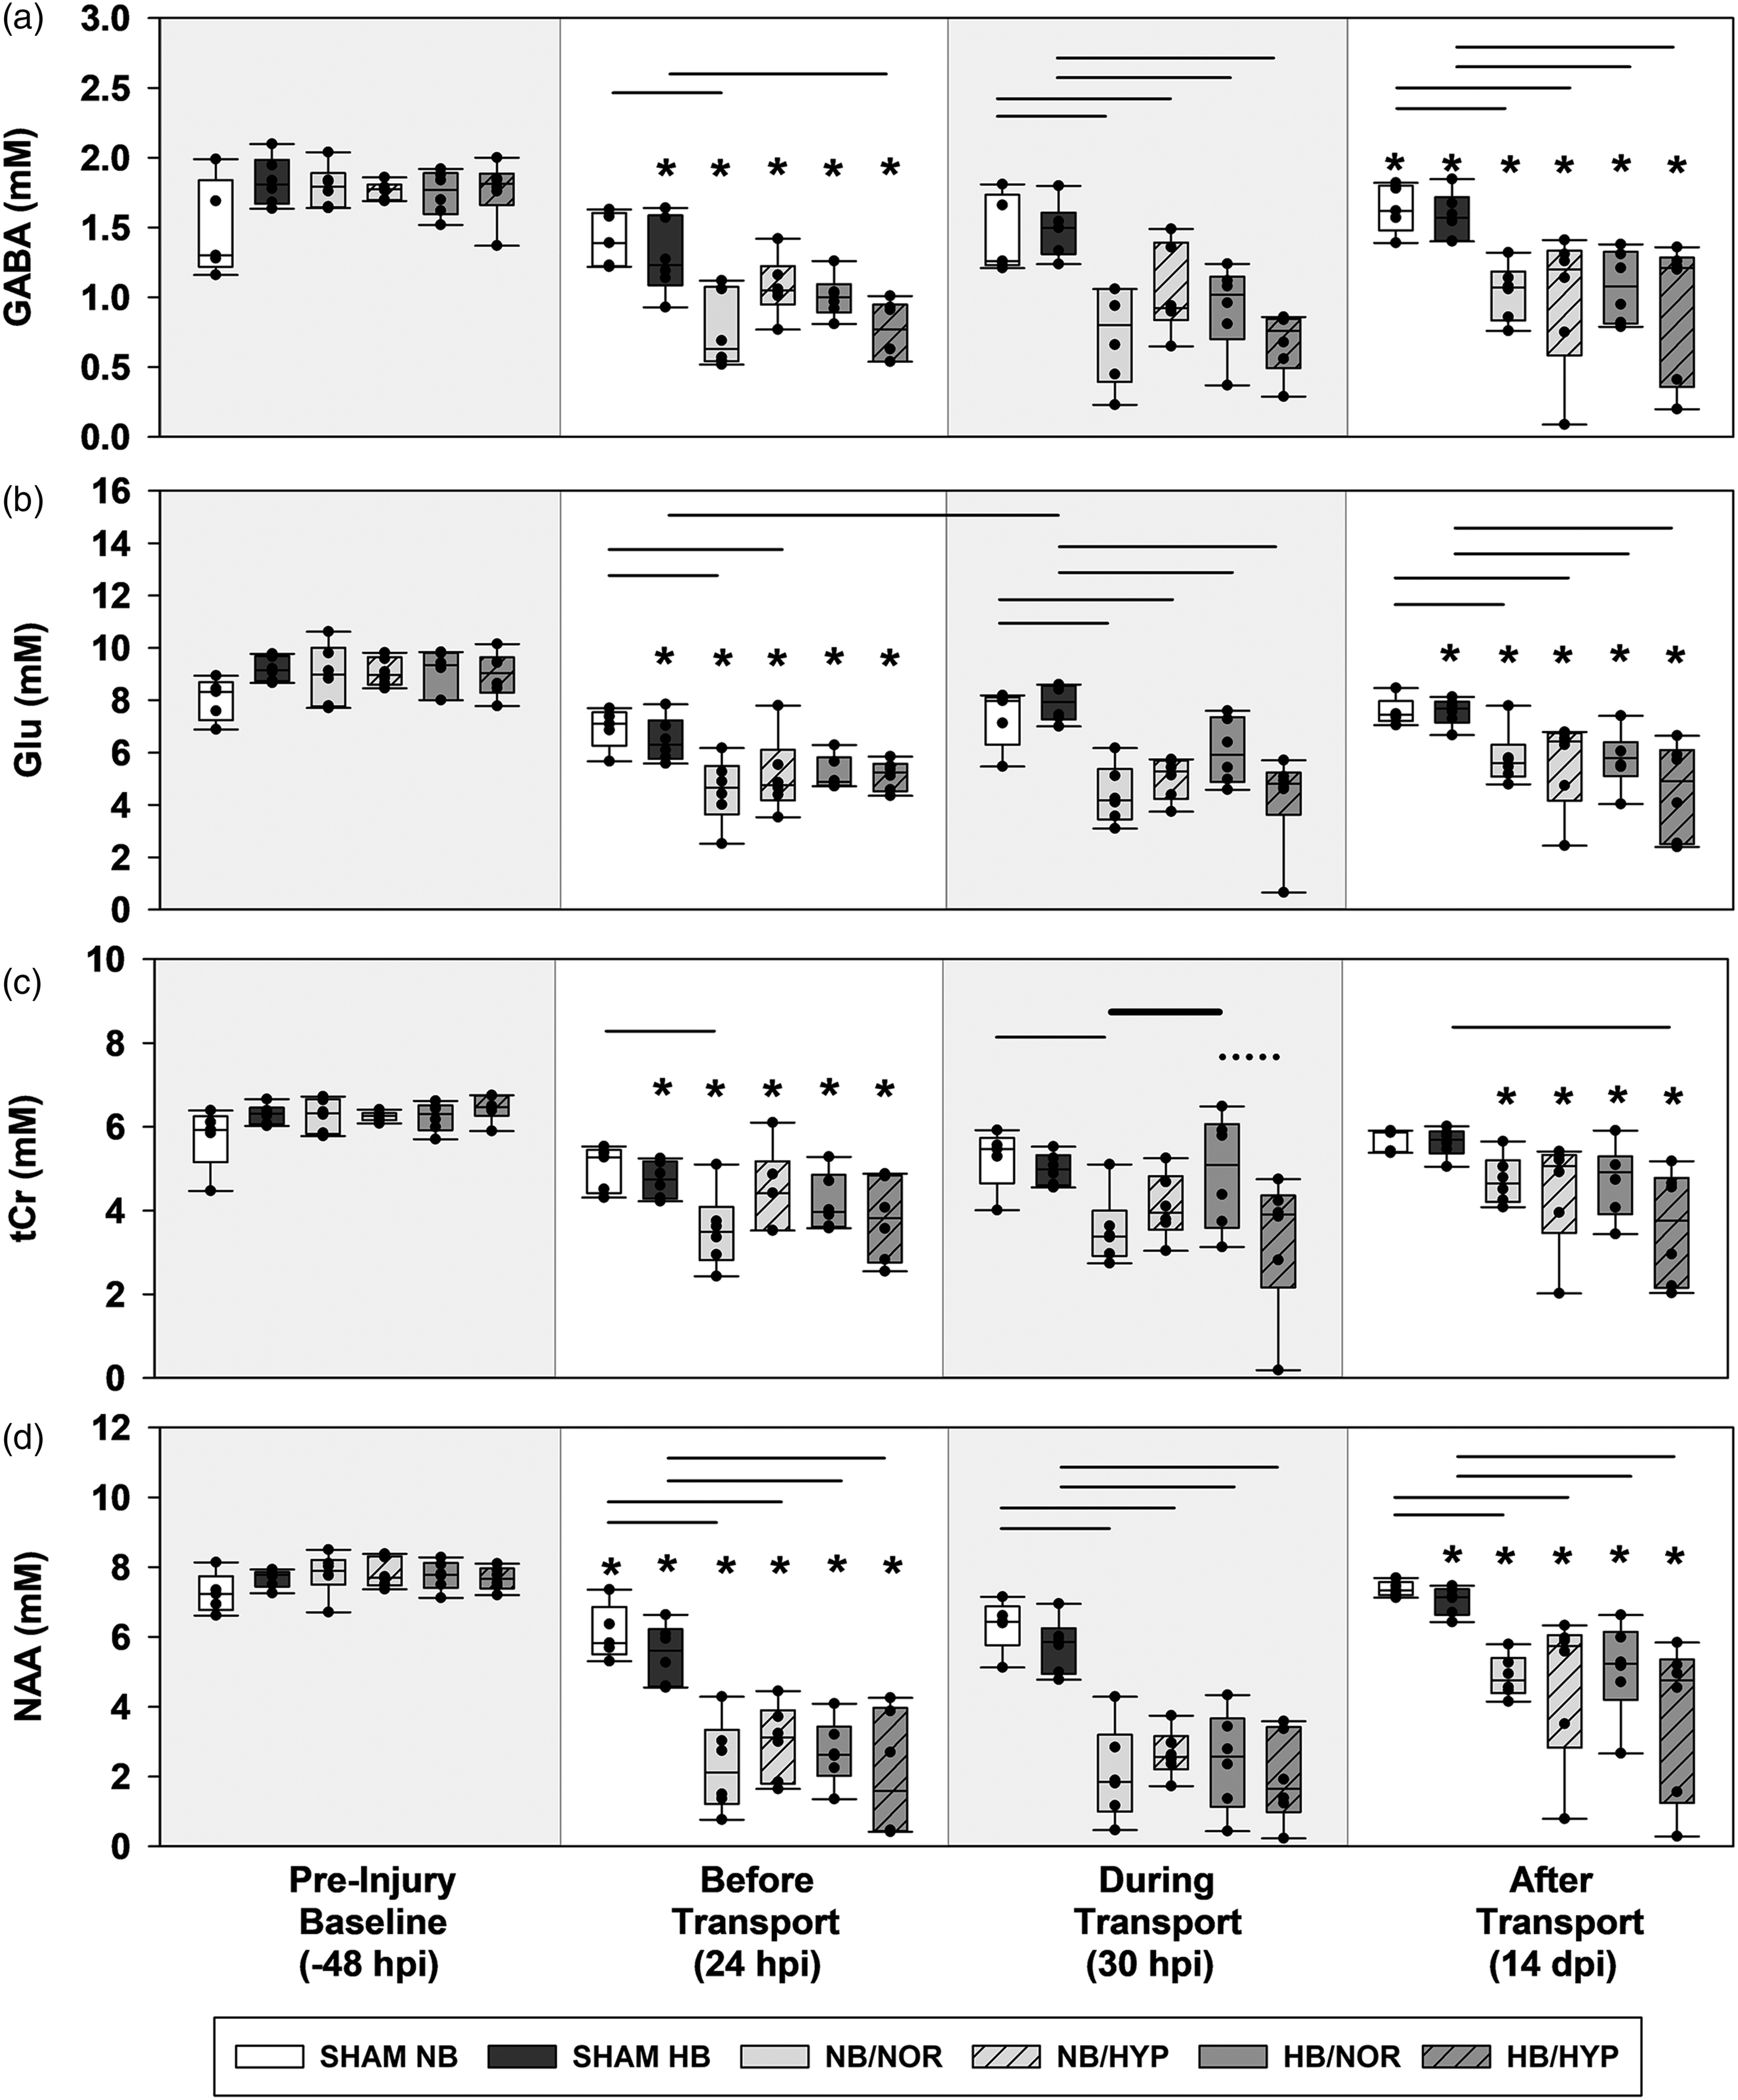
Box-and-Whisker plots of post injury ipsilateral biochemical concentrations. (a) GABA. (b) Glu. (c) tCr and (d) NAA. Effects of Surgical injury: solid line; Effects of hypobaria: bold solid line; Effects of hyperoxia: dotted line. Asterisks indicate significance compared to groups own Pre-Injury Baseline values. All lines and asterisks indicate p < .05.
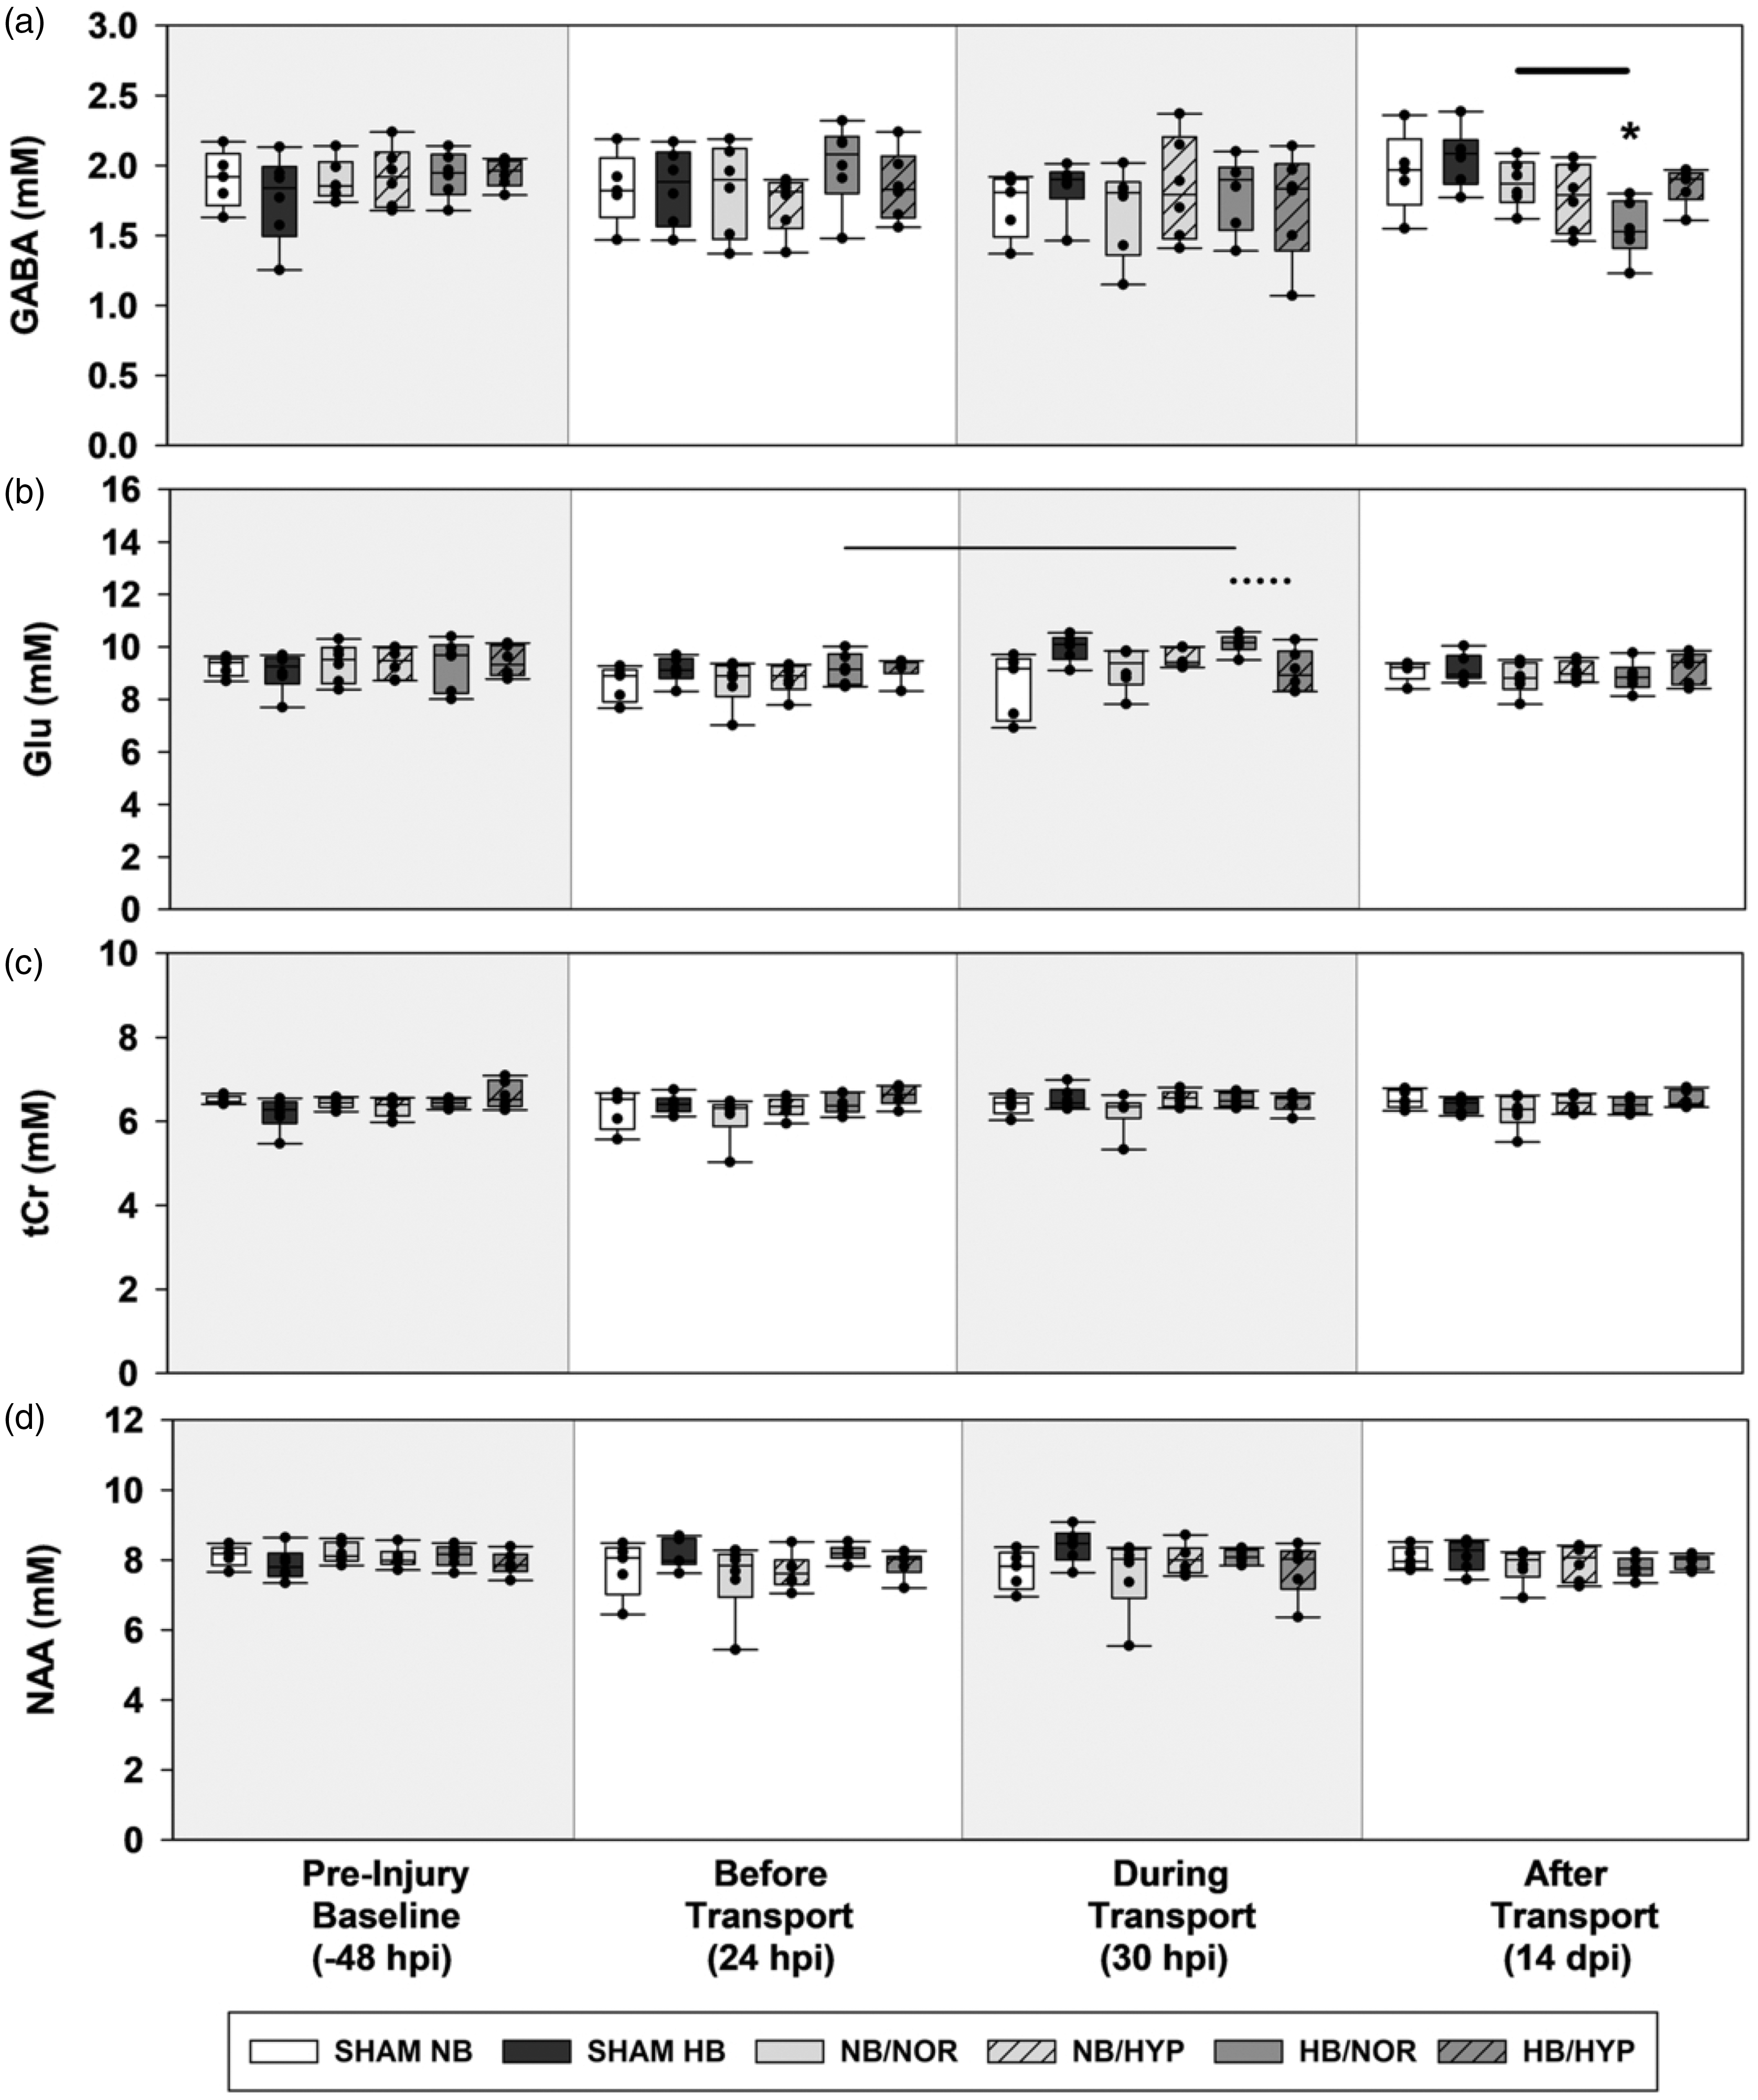
Box-and-Whisker plots of post injury contralateral biochemical concentrations. (a) GABA. (b) Glu. (c) tCr and (d) NAA. Effects of Surgical injury: solid line; Effects of hypobaria: bold solid line; Effects of hyperoxia: dotted line. Asterisks indicate significance compared to groups own Pre-Injury Baseline values. All lines and asterisks indicate p < .05.
Following cortical injury, hypobaria exposure resulted in higher levels of total creatine (Figure 6(c)) during flight in the ipsilateral hemisphere compared to injured groups maintained under sea level conditions (NB/NOR vs HB/NOR). Although an acute effect of hypobaria was not detected during flight, injured rats exposed to hypobaria had lower levels of GABA (Figure 7(a)) at 14 dpi compared to injured groups maintained under normobaria (NB/NOR vs HB/NOR).
Following injury, no neurochemical differences due to hyperoxia alone were detected. However, rats exposed to the combination of hyperoxia and hypobaria had lower concentrations of tCr (Figure 6(c)) and Glu (Figure 7(b)) during flight (HB/NOR vs HB/HYP).
Discussion
To our knowledge, this is the first study using MRI and MRS to characterize the changes of CBF and neurochemicals in vivo before, during, and after aeromedical evacuation-relevant hypobaria. In this study we observed alterations in cortical neurochemical profiles, neuroinflammation and regional CBF in response to hypobaria. We demonstrated that hypobaria in combination with hyperoxia was associated with the greatest acute and delayed brain injury.
TBI reduces CBF, alters neurochemicals, and increases inflammation in the cortex
In the current study, a decline in CBF to the cortex and hippocampus was observed at one day after injury. Under basal conditions, CBF is maintained relatively constant over a wide range of physiological conditions and changes in blood pressure. After TBI, autoregulation of CBF is often compromised, thus reducing CBF.27 –29 These TBI-induced CBF disturbances are well studied both in experimental animal models and clinically.22,27 –40 Our results are consistent with previous studies showing that regional differences of cortical CBF are heterogeneously affected. 32
T2-weighted MR images successfully identify hyperintensities indicative of cortical lesions following CCI. 32 In our study, CCI resulted in an acute increase of MR-based cortical hyperintensity volumes. These edematous volumes partially resolved by 14 days when they were accompanied by increased pathology indicated by cortical inflammation. Further analysis demonstrated that acute T2 hyperintensity volumes exhibited a moderate correlation with delayed neuropathology obtained with ED1 immunolabeling. The finding that acute in vivo MRI predicts delayed histopathology suggests that with earlier detection, treatment of neuroinflammation and improved long-term recovery may be possible. 41 Following TBI, we observed an acute reduction in the neurotransmitters glutamate and GABA indicating impaired neurotransmission and a reduction in tCr suggesting oxidative phosphorylation may be impaired. Fluctuations in tCr observed after TBI, hypobaria, and exposure to hypobaria under hyperoxia could contribute to ongoing brain tissue necrosis and inflammation. Lactate was detected within 24 hr of injury as reported by us and others.1,11,42,43 1H MRS results obtained from a similar model of rat CCI that also detected an acute decline in NAA and tCr with partial recovery at one week after injury. However, we failed to observe normalization of NAA by two weeks post-injury, which may be linked to impaired NAA synthesis in damaged mitochondria.10,11,44 –46
Impact of post-injury aeromedical evacuation relevant hypobaria
We found that AERH exposure after TBI resulted in lower CBF, a worsening of cortical inflammation and a partial restoration of injury-induced reductions of cortical creatine. Specifically, one exposure to AERH within 24 hr after injury worsened delayed cortical neuroinflammation, as observed with ED1 immunostaining, beyond that which is seen following TBI alone (Figure 5(d)). These results are consistent with the growing number of studies providing evidence for hypobaria acting as a “second hit” following TBI through worsening of inflammation in the brain and other organs, e.g., the gut, kidney, and lung.6,47,48
Changes in CBF resulting from hypobaria have been reported in numerous human and animal studies, but the direction of change has not been consistent.3,49 –51 The apparently conflicting results may be explained, in part, by the substantial variability in duration and extent of hypobaria, arterial O2 and carbon dioxide tension during exposure, and the number of previous exposures to hypobaria. Oxygen availability decreases as altitude increases, often resulting in hypobaric hypoxia, rendering it challenging to determine effects of hypobaria independent of inspired O2 partial pressures. Several studies reported an increase in CBF at high altitude and were conducted under conditions where the reduced partial pressure of O2 resulted in hypoxia.49,50 In the current study, hypoxia as a factor was eliminated by simulating normoxia under both normobaria and hypobaria through the delivery of 30 and 40% supplemental O2 respectively. Our results support studies reporting acute reductions in global CBF after hypobaria exposure compared to those maintained at sea level.51,52 Using a similar arterial spin labeling technique, Liu et al reported lower CBF in healthy human volunteers after six hr at high altitude compared to their baseline CBFs measured at sea level. 52 There is also precedence for reduced CBF in animal models treated with AERH after brain injury where the level of supplemental O2 is controlled to prevent hypoxia. Scultetus et al demonstrated this reduction in CBF in a swine model of fluid percussion brain injury when injury was followed by four hr of normoxic (O2 saturation ≤ 92%) AERH identical to the levels used in our study. 3
The partial pressure of O2 in the blood is a potent regulator of CBF. Hypoxia induces vasodilation of large cerebral vessels including the cerebral and basolateral arteries that supply the thalamus and hippocampus. Likewise, hyperoxia decreases CBF in part by inducing vasoconstriction of these same large vessels. Smaller arterioles surrounded by cerebrospinal fluid within the subarachnoid space have also been implicated in the regulation of CBF via sensitivity to the partial pressures of O2 and CO2 in the blood as well as by the local CSF environment which is determined by neurochemical conditions. In the current study, hypobaria exposure partially restored cortical tCr levels and resulted in the lowest cortical GABA and CBF in two of three brain regions measured, independent of injury status or level of O2 delivered. This resulting hypoperfusion cannot be simply explained by O2 availability as hyperoxia alone was not a sufficient stimulus to decrease CBF under normobaric pressures. Although the mechanism remains unknown, the possibility exists that regional differences in CBF following AERH may depend on the interaction of several simultaneous factors including cerebrovascular responses to changes in pressure, changes in the local CSF environment and inspired O2 partial pressures.
Impact of post-injury aeromedical evacuation relevant hypobaria combined with hyperoxia
The combination of hypobaria and hyperoxia reversed the acute restoration of total creatine, and resulted in the lowest cortical and thalamic blood flow measured after simulated air transport.
All cortical metabolites measured had an acute response (24 hpi) to surgical craniotomy with or without cortical impact. The majority of neurochemicals were not further impacted by subsequent exposure to hypobaria or hyperoxia and returned to baseline levels by 14 dpi with the exception of GABA, Glutamate, total Creatine, and N-acetyl-aspartate. The injury induced impairment to cerebral energy metabolism indicated by a reduction in tCr was partially restored by exposure to hypobaria. Hypobaria combined with hyperoxia, however, reversed the improvements in cerebral energy metabolism gained with hypobaria alone and ultimately resulted in the lowest concentrations of both Glu and tCr measured during transport. In addition, only when hypobaria was combined with hyperoxia was there long-term reduction in tCr levels as well as a persistent reduction in CBF to the cortex and thalamus measured up to two weeks after the injury.
This may indicate the regulation of CBF in an integrative process that involves the marked influence of pulmonary gas exchange and cardiovascular function in addition to intracranial mediators of cerebral vessel resistance and flow. 53 Some studies suggest that reduced CBF under hyperoxia is a form of autoregulation that provides neuroprotection by inhibiting O2 delivery and ensuing oxidative stress. 54 This scenario is not likely based on the finding that loss of neurochemicals were greatest in the groups that were exposed to hyperoxic hypobaria (Figure 6). Taken together, this may indicate that the region-specific acute changes observed in CBF may be due to hypobaria while delayed changes may reflect an adaptive response.
A distinct advantage of this study is the direct measurements of CBF and concentrations of specific cortical neurochemicals before, during, and after exposure to AERH. Additionally, while the outcome measures of many studies are restricted to one terminal endpoint after the initial TBI, our research longitudinally tracked changes in several parameters measured via MRI to demonstrate long term consequences of a single acute exposure to AERH. Limitations of this study include a relatively short observation period (14 days) after injury, precluding the evaluation of various long term injury outcomes. Given the growing evidence that females respond differently than males to traumatic brain injury, inflammation and altitude, a comparison of differences due to sex would strengthen future studies.55 –57 Although a strength of this study was the evaluation of a single homogenous trauma with one post injury transport, these findings may not be generalizable to TBI subjects with multiple injuries or those transported under varying conditions or timepoints following injury. Future studies involving the evaluation of multiple transports on military relevant compound traumas, including combinations of blast, brain impact, and hemorrhagic shock are warranted.
Conclusions and impact
This study provides innovative evidence that hypobaria exposure following TBI acts as a secondary insult that should be avoided if possible. Indiscriminate administration of 100% O2 is not the answer, as is evident by the decrease in CBF and additional alterations of neurochemicals by exposure to the combination of hypobaria and hyperoxia. Our work indicates that O2 should be titrated during hypobaric transport to a SpO2 level within the range of approximately 94 to 96% to avoid both hypoxia and hyperoxia, thereby minimizing secondary brain injury. 58
Supplemental Material
sj-pdf-1-jcb-10.1177_0271678X241299985 - Supplemental material for Aeromedical evacuation-relevant hypobaria following traumatic brain injury in rats contributes to cerebral blood flow depression, altered neurochemistry, and increased neuroinflammation
Supplemental material, sj-pdf-1-jcb-10.1177_0271678X241299985 for Aeromedical evacuation-relevant hypobaria following traumatic brain injury in rats contributes to cerebral blood flow depression, altered neurochemistry, and increased neuroinflammation by Julie L Proctor, Su Xu, Sijia Guo, Boris Piskoun, Catriona Miller, Steven Roys, Rao P Gullapalli and Gary Fiskum in Journal of Cerebral Blood Flow & Metabolism
Footnotes
Funding
The author(s) disclosed receipt of the following financial support for the research, authorship, and/or publication of this article: This work was supported by U.S. Air Force grant FA8650-17-2-6H13.
Acknowledgements
We thank the Core for Translational Research in Imaging @ Maryland for providing in vivo MRI and MRS service. We thank Dr. Jiachen Zhuo and Dr Roumen Vesselinov for their assistance with data interpretation. We thank the USAMDA medical prototype laboratory for fabricating the hypobaric chamber. The views expressed in this article are those of the authors and do not necessarily reflect the official policy or position of the Air Force, the Department of Defense, or the U.S. Government. Imagery in this document are property of the U.S. Air Force. This study has been approved by and conducted in accordance with the University of Maryland, Baltimore IACUC with concurrence from the Air Force SGE-C.
Declaration of conflicting interests
The author(s) declared no potential conflicts of interest with respect to the research, authorship, and/or publication of this article.
Authors’ contributions
The study concept was by GF and RG. The study design was by SX, SJ, and JLP. JLP, SX, and BP performed the experimental work. SX, SR, JLP, and CM assessed and analyzed and interpretation of the data. JLP, SX, GF, and RG wrote and edited the manuscript. All authors reviewed the manuscript with the exception of RG, who passed away during final manuscript preparations.
Supplementary material
Supplemental material for this article is available online.
References
Supplementary Material
Please find the following supplemental material available below.
For Open Access articles published under a Creative Commons License, all supplemental material carries the same license as the article it is associated with.
For non-Open Access articles published, all supplemental material carries a non-exclusive license, and permission requests for re-use of supplemental material or any part of supplemental material shall be sent directly to the copyright owner as specified in the copyright notice associated with the article.