
Abstract
White matter lesions (WMLs) are prevalent with aging, and higher WML burden has been observed in older adults with vascular diseases. While the physiology underlying the formation of WMLs is not known, various risk factors are associated with high WML burden. Here, we investigated the relationship between vascular risk factors and microvascular physiology (i.e., oxygen supply and oxygen extraction fraction [OEF]) and their association with WML burden. Forty-one typically aging adults (60–80 years) were classified into high or low vascular risk based on common modifiable vascular risk factors (hypertension, diabetes, hyperlipidemia, and overweight). These groups were subdivided into high or low WML burden. Differences in microvascular physiology (oxygen supply and OEF) were then compared between and within groups. Overall, OEF was significantly higher in the high vascular risk group compared to the low vascular risk group (p < 0.01). In the low vascular risk subgroup, OEF was uniquely lower in the individuals with high WML versus low WML burden (p = 0.02), despite no differences in oxygen supply between these subgroups (p = 0.87). The coupling of impaired OEF with the absence of compensatory physiology, such as elevated oxygen supply, may represent an important mechanism underlying WML burden in individuals with low vascular risk factors.
Introduction
White matter lesions (WMLs) are prevalent with aging and in dementia. The etiology of these lesions is frequently attributed to vascular impairment, and a higher WML burden has been observed in older adults with elevated vascular risk. 1 However, there is considerable unexplained heterogeneity in the relationship between WML burden and vascular risk factor presentation, and WMLs are observed in many older adults despite the absence of conventional vascular risk factors.2,3 Understanding the variability in the microvascular physiology associated with these lesions could help reveal the underlying pathophysiological processes and inform therapeutic strategies for addressing associated cognitive decline.
Oxygen availability to brain tissue is governed both by the supply of oxygen-rich blood and the efficiency with which oxygen is extracted from capillaries at the parenchymal level. Oxygen supply to the brain is largely determined by cerebral blood flow (CBF) and by the oxygen carrying capacity of blood. Brain tissue hypoxia due to hypoperfusion-related reductions in oxygen supply has been hypothesized to contribute to the formation of age-related WMLs.4 –6 However, factors determining oxygen extraction efficiency, which can be described by the oxygen extraction fraction (OEF), are less well understood. It has previously been observed that oxygen supply and oxygen extraction exhibit an inverse relationship. 7 For example, in pathological states where oxygen supply is reduced due to arterial steno-occlusion, increases in OEF might temporarily compensate for the metabolic demand of the tissue.8,9 However, disturbance in compensatory hemo-metabolic processes could result in measurable tissue damage, such as WMLs. 10
Previous work 11 has shown that capillary flow patterns are critical for determining oxygen extraction efficiency in brain tissue. A mismatch between oxygen demand and availability may also be present in the absence of large vessel pathology and instead might originate from the capillary level. While elevated OEF in pathological states represents a marker of a mismatch scenario (so-called ‘misery perfusion’), reduced oxygen extraction efficiency in individuals with unimpaired oxygen supply may have a different presentation. However, our knowledge regarding these relationships, particularly in the absence of conventional vascular risk factors, remains incomplete. Previous work on the physiological etiology of WMLs has mostly focused on high vascular risk groups12 –14 and how these high-risk groups may differ from low-risk groups. 15 However, insight into the pathogenesis and the potential role of oxygen metabolism in the formation of WMLs might also be gained by investigating individuals who exhibit WMLs despite carrying low vascular risk. Focusing on these specific individuals could represent a crucial first step in investigating whether flow-limiting factors or early capillary dysfunctions 11 are the initial factors in WML formation.
In this study, we investigated relationships between vascular risk factors and microvascular physiology (i.e., oxygen supply and oxygen extraction) as well as their association with WML burden in a cohort of typically aging older adults. The cross-sectional results presented here are part of an ongoing longitudinally designed study with the intention to investigate cerebral hemodynamics in healthy older adults. The specific purpose of this work was to determine whether associations between hemo-metabolic physiology and lesion burden are different in older adults according to the level of vascular risk. We hypothesized that WML burden in low-risk adults may be associated with a unique physiological pattern compared to high-risk adults. To test this hypothesis, we compared MRI-based measures of oxygen supply and oxygen extraction between older adults categorized into high- versus low-risk using a vascular risk estimate and split into high versus low WML burden by age-dependent residuals of WML volume.
Methods
Study design and participants
All components of this study were performed in compliance with the ethical standards instituted by the Mass General Brigham Research Compliance office and as set forth by the Belmont Report. A cohort of typically aging older adults (n = 45; 60–80 years inclusive) was recruited through the Brain Aging and Dementia Laboratory at Massachusetts General Hospital as part of this Mass General Brigham Institutional Review Board-approved study (IRB #2021P001817). Informed written consent was obtained from all participants. Criteria for inclusion were identical to those utilized for the Lifespan Human Connectome Project in Aging: adults with cognitive function appropriate for their age and without any major psychiatric, cardiovascular, or neurological disorders. 17 MRI data as well as additional measures, including the participant’s medical history, medication use, blood pressure (seated and standing), arterial oxygen saturation (using pulse oximetry), and blood data (e.g., red blood cell hemogram, blood lipid levels, and blood sugar levels) were collected at the time of each study visit. Participants were further asked to self-report their sex (male/female binary). Participants were screened for asymptomatic carotid stenosis and intracranial atherosclerotic disease using time-of-flight MR angiography of the head, and the presence of stenosis >50% of any major intracranial artery served as exclusion criteria.
Vascular risk estimate
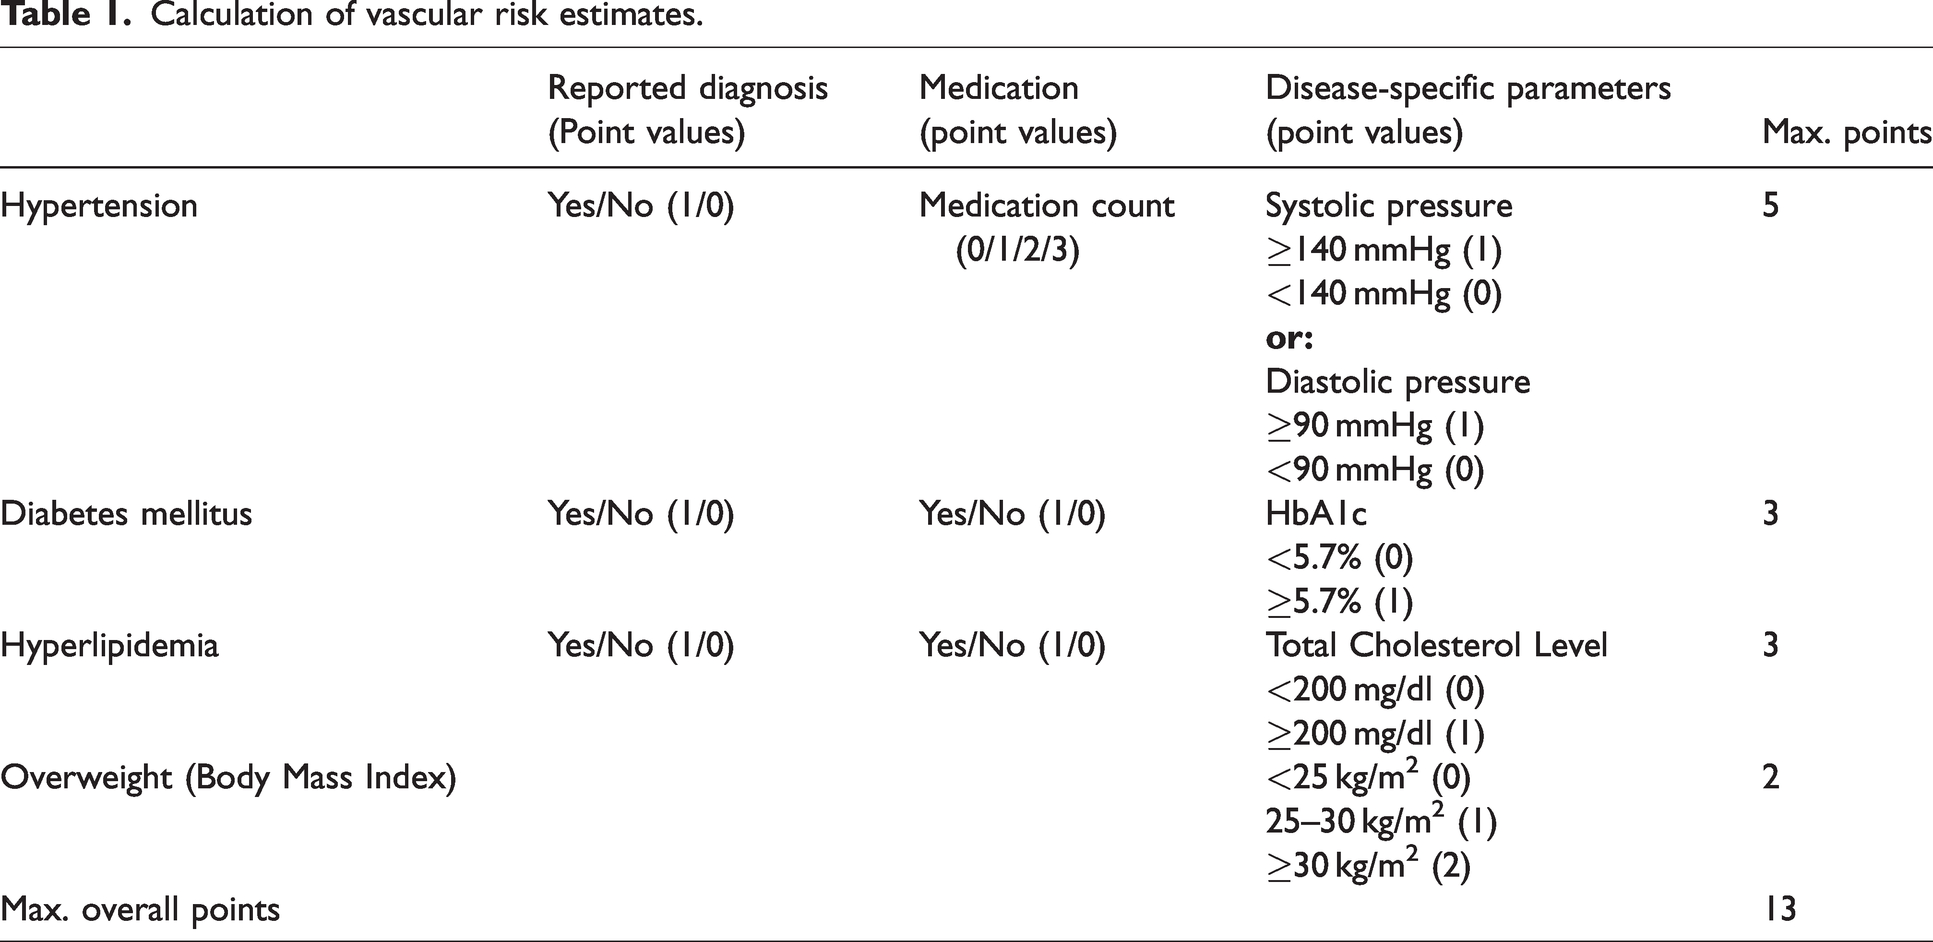
Vascular risk was estimated based on three different categories of information regarding hypertension, diabetes mellitus, hyperlipidemia, and overweight (see Table 1), in a manner that is similar to prior approaches. 18 These three categories included reported diagnosis, medication intake, and disease-specific parameters (as described below).
Calculation of vascular risk estimates.
Hypertension
Blood pressure measures were used for hypertension classification. The International Society of Hypertension defines hypertension as systolic/diastolic blood pressure above 140/90 mmHg, and both forms of hypertension, systolic and diastolic, impact an individual's overall vessel and cardiovascular health. 19 Here, blood pressure measures were acquired in the seated and standing positions. Both were used for assessment, and a point value of 1 was given if any of the measures (systolic or diastolic; seated or standing) met the hypertension criterion.
Hyperlipidemia
Total cholesterol levels measured in a standard blood lipid panel were used for hyperlipidemia classification. Total cholesterol levels are considered healthy below 200 mg/dl in individuals without previous cardiovascular events (e.g., cardiac infarction) or genetic variants in cholesterol metabolism (e.g., familial hypercholesterolemia). Here, 200 mg/dl was used as the cut-off value and 1 point was given for values above the threshold. For one participant, total cholesterol values were not available due to hemolysis. The available triglyceride values were used instead, and the triglyceride-specific threshold of 150 mg/dl was applied.
Diabetes mellitus
Blood glucose levels were assessed using the glycosylation levels of the hemoglobin (Hb) of red blood cells, (HbA1c; %). HbA1c depicts a longer period of glucose intake (approximately 2–3 months, based on the life span of red blood cells) compared to standard blood glucose levels. 20 For two participants, only fasting glucose levels were available and hence used instead. Of note, diabetes in this study indicates Type 2 Diabetes mellitus as classified by the World Health Organization. 21 Here, the threshold of an HbA1c value of 5.7% was used, which defines a prediabetic state. 22
Overweight
Overweight and Obesity were categorized using the Body Mass Index (BMI). According to the World Health Organization, an individual has normal weight if the BMI is 20–24.9 kg/m2, overweight if the BMI is 25 to 29.9 kg/m2, and obese if it is 30 to 35 kg/m2 or greater. 23 As higher BMI values correspond to higher metabolic stress on the body, a BMI of 25–29.9 was given a 1-point value, and a BMI of 30 or greater was given a 2-point value in the risk factor assessment.
Risk factor calculation
Participants were assigned a score based on reported diagnosis of either 0 (no reported diagnosis) or 1 (reported diagnosis or reported borderline disease-specific values that were under medical observation at the time of the study visit). Medication intake for diabetes and hyperlipidemia was given a point value of either 0 (no medication) or 1 (any medication). For hypertension, the count of prescribed drug categories resulted in a count of 1 point for each prescribed drug category, as hypertension severity requires additional medication according to the International Society of Hypertension core drug-treatment strategy. 19 In blood pressure treatment, monotherapy is considered sufficient in low-risk patients, and more medication is added if the therapy is insufficient in controlling the blood pressure or if other cardiovascular risk factors are present. 19 Therefore, a higher medication count reflects the severity of the risk factor for vascular health and hence was included stepwise in our vascular risk estimate.
The sum of the given points was calculated to estimate the overall vascular risk. In total, a maximum of 13 points could be reached. Low vascular risk was defined conservatively as the absence of any risk factor or a maximum of 1 point, regardless of category. High vascular risk was defined as the presence of 2 or more points in total. Risk factor distribution per individual can be viewed in Figure 1.
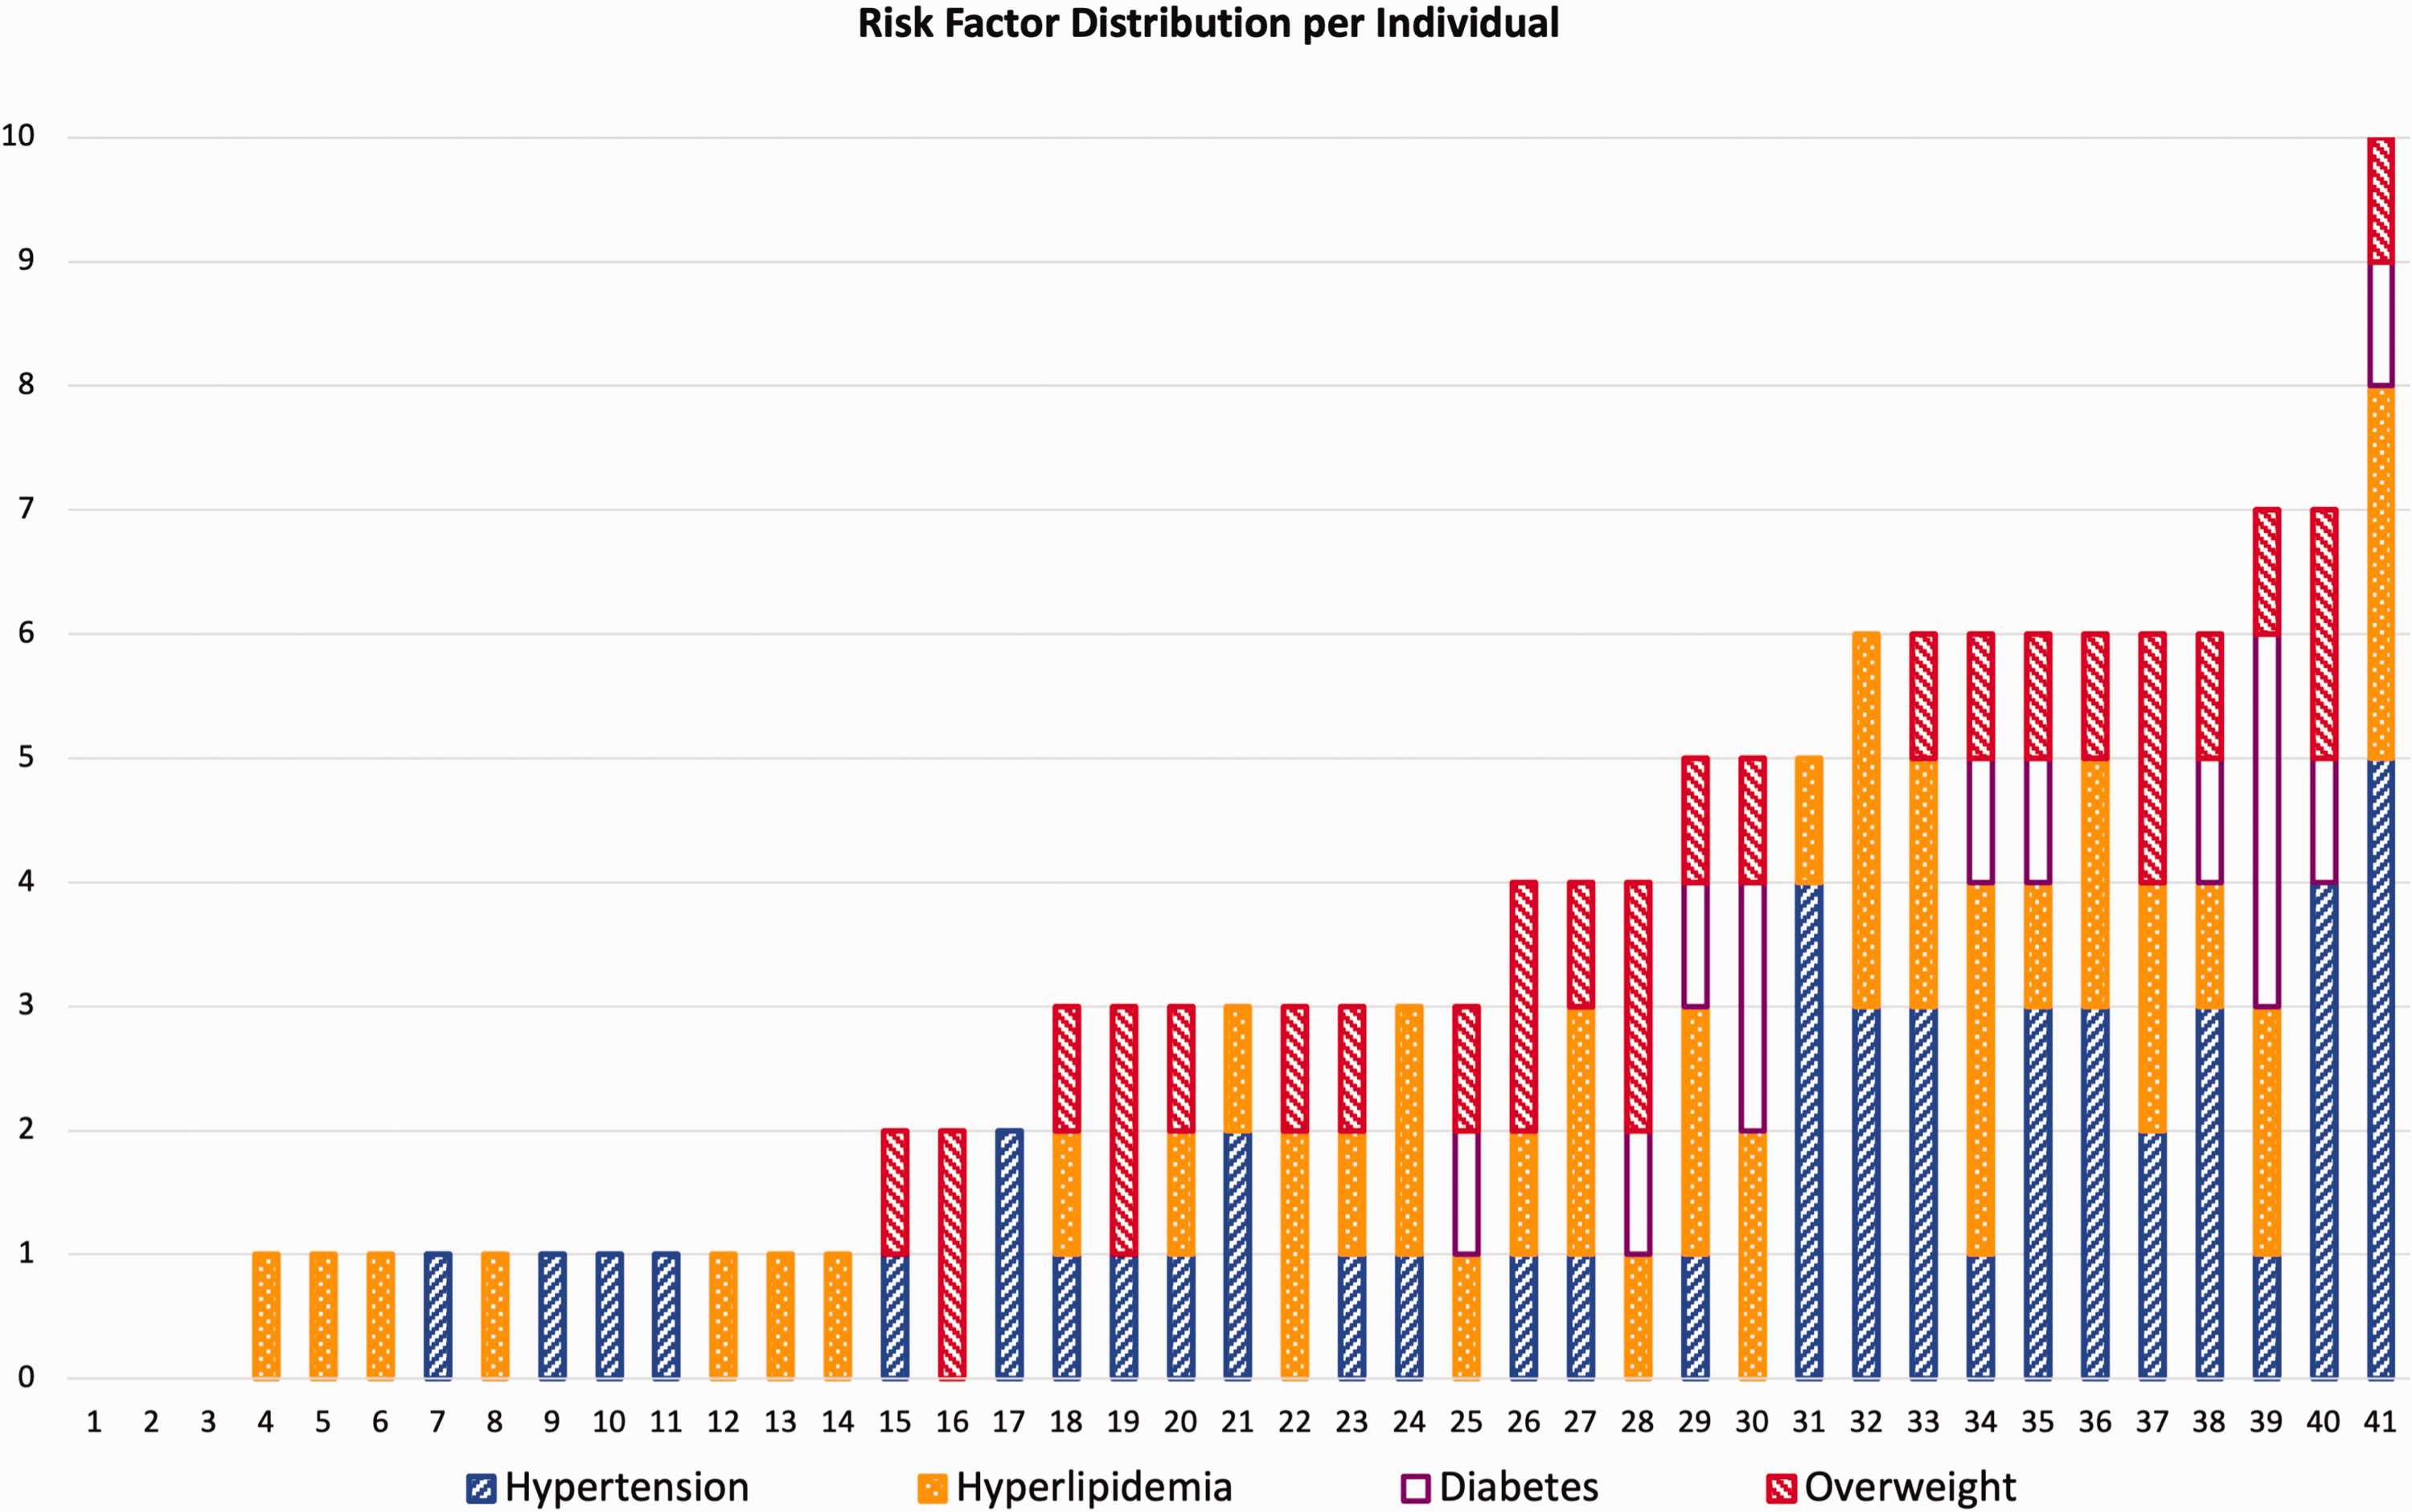
Risk factor distribution per individual. The values for each category are summed up on the y-axis, with a maximum of 5 points for hypertension, 3 points for hyperlipidemia, 3 points for diabetes, 2 points for overweight, and a total maximum of 13 points. For more information on the calculation, see Table 1. Low-risk individuals are 1-14, high-risk individuals are 16-41 on x-axis.
Image acquisition and processing
MR imaging data was acquired in all participants at 3 Tesla (3 T) using a Siemens Prisma (Siemens Healthcare; Erlangen, Germany) and with a 32-channel head receive coil.
Structural imaging and angiography
T1-weighed MRI was acquired using a multi-echo magnetization-prepared rapid gradient echo (ME-MPRAGE) with the following parameters: repetition time (TR) = 2500 ms; inversion time (TI) = 1000 ms; echo time (TE) = 1.8/3.6/5.4/7.2 ms; spatial resolution = 0.8 × 0.8 × 0.8 mm3; number of echoes = 4. T1-weighed images were used to reconstruct cortical surfaces for gray and white matter segmentations using the Freesurfer recon-all procedure (http://surfer.nmr.mgh.harvard.edu/).24,25 Control ASL images were registered to the T1-weighed image space using a boundary-based registration algorithm. 26 The inverse transform was then used to transform gray and white matter masks into ASL space.
2D FLAIR images were acquired for white matter lesion segmentation (TI = 2500 ms; TE = 9.1 ms; TR = 9000 ms; in-plane resolution = 0.86 × 0.86 mm2; slice thickness = 5 mm; slices = 35). White matter lesion volume was calculated using the lesion prediction algorithm, 27 from the Lesion Segmentation Toolbox in SPM-12. 28 WML values were log-transformed to account for the exponential nature of lesion burden with increasing age. To further account for age effects, residuals were calculated using an age-vs-WML regression line (using the log-transformed WML values). Positive residuals represent data points that are above the age-vs-WML-regression line that are higher values than expected for their age. Negative residuals present lower values than expected for their age. Based on these residuals, individuals were categorized into subgroups of higher (WML+) versus lower (WML−) burden. Two participants without a sufficiently high WML burden to be detected were also classified as having negative residuals. Using the age-vs-WML-regression residuals of log-transformed WML values captures the association of higher WML burden with increasing age and was therefore considered as a corrective factor of the age vs WML relationship.
Time-of-flight MR angiography of the head was performed for the assessment of intracranial vessels using the following parameters: TR = 21 ms, TE =3.42 ms, flip angle = 18 degrees.
Arterial spin labeling
Arterial spin labeling (ASL) MRI was acquired using a multiple post-labeling delay sequence with pseudo-continuous labeling (labeling duration = 1500 ms and five delays equally spaced between 200-2200 ms) and a multi-band 2 D echo-planar readout (multi-band factor = 6; TR = 3580 ms; TE = 19 ms; spatial resolution = 2.5 × 2.5 × 2.5 mm3). 29 Arterial transit time (ATT) values were estimated in a voxel-wise manner using a previously described cross-correlation approach optimized for the ASL acquisition used.30,31 CBF values were calculated using model fitting with a two-compartment model as described previously30,31 and incorporating the independently estimated ATT values. Gray and white matter masks derived from the T1-weighted images were transformed into ASL image space (as described above), and mean CBF and ATT values were computed inside of these masks.
Oxygen supply to the gray matter was calculated from the gray matter CBF, hemoglobin concentration, and arterial oxygen saturation using the following formula:

T2-Relaxation-Under-Spin-Tagging (TRUST)
OEF was measured using TRUST MRI data32,33 as previously described.16,34 In brief, oxygenation levels of arterial blood entering the brain are compared with oxygenation levels of blood exiting the brain through the superior sagittal sinus. The control and label single-slice TRUST images were acquired from a slice parallel to the anterior commissure/posterior commissure line, containing the superior sagittal sinus approximately 20 mm superior to the confluence of the sinuses, using a post-labelling delay of 1022 ms. Images were acquired with effective echo times (eTEs) of 0, 40, 80, and 160 ms (three averages per eTE) and quantified to compute venous blood water T2
16
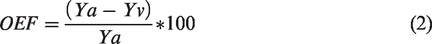
(Echo planar imaging readout: parallel imaging factor = 3, partial k-space factor = 0.7, echo time = 3.6 ms). Venous T2 was then converted to venous oxygen saturation (Yv) using individually measured hematocrit values. Arterial oxygenation saturation levels (Ya) were measured using finger pulse oximetry. OEF was then calculated using:
Statistics
Statistical analyses were performed using R (Version 2023.12.1 + 402). Normal distribution of the data was analyzed using the Shapiro-Wilk Test and visually using QQ-Plots. Homoscedasticity was analyzed using the Levene Test. The Fisher exact test was used to investigate distributions of sex in the sample. As GM CBF was used in this study for oxygen supply calculation, a correlation analysis of GM and WM CBF was performed to ensure the comparability of the oxygen supply between gray and white matter.
The participant sample was categorized into high (VRF+) or low (VRF−) vascular risk based on the vascular risk factor estimate. VRF+ participants exhibited risk scores > 1, and VRF− participants exhibited risk scores ≤1. Age, WML burden, OEF, and oxygen supply were first compared between these vascular risk groups. Two-sided t-tests were performed for group comparisons at a 0.05 significance level. Statistical significance for the group variable was determined by setting the false discovery rate (FDR) at 0.1, with p-values below the adjusted threshold considered significant. Additionally, Cohen’s d (with Hedge’s correction) was computed. Cohen’s d was compared with the minimum detectable effect (MDE, at a power level of .8 (MDE0.8)) for the main comparisons. Furthermore, a linear model regarding the effect of vascular risk status on the relationship between OEF and WML burden was performed. Based on the residual analysis of WML burden described above, the groups were next subdivided into higher (WML+) versus lower WML burden (WML−). Age, OEF, and oxygen supply were then compared for WML+ and WML− on the within-group level of VRF+ and VRF−. Statistical testing was performed similarly to the approach used in the vascular risk group comparisons as described above. To address confounding factors, CBF and ATT between groups were compared, and a linear model regarding the interaction effects of hemoglobin levels or age on the relationship between WML burden and OEF and oxygen supply was performed. However, due to the small sample size, the confounding factors were not included in the final assessment to prevent overfitting. As supplementary analyses, the association between OEF and oxygen supply in our sample was compared between VRF risk groups and WML burden. Therefore, correlation analyses using Spearman’s rho (ρ) to identify the relationships between OEF and oxygen supply by vascular risk factors were conducted and can be found in the supplemental material (Supplemental Figure 1). Furthermore, as supplementary analyses, the cerebral metabolic rate of oxygen consumption, which is the product of oxygen supply (see equation (1)) and the extracted oxygen (see Equation 2), was computed and compared between groups and can be found in the supplemental material (Supplemental Figure 2).
Results
Demographics
Data from four volunteers was excluded due to artifacts in the blood data at the time of the study, and a total of 41 participants (21 females) were included in this study. Demographic information and risk factor-related parameters for the sample are shown in Table 2. The prevalence of the risk factors in our sample is given in Table 3. Sex distribution differed neither between VRF+ and VRF− (p = 0.2) groups nor within the VRF− (p = 1) and VRF+ (p = 0.7) subgroups. Gray matter CBF was highly correlated with white matter CBF (ρ = 0.81, p < 0.01).
Participant demographics and hemo-metabolic measures.
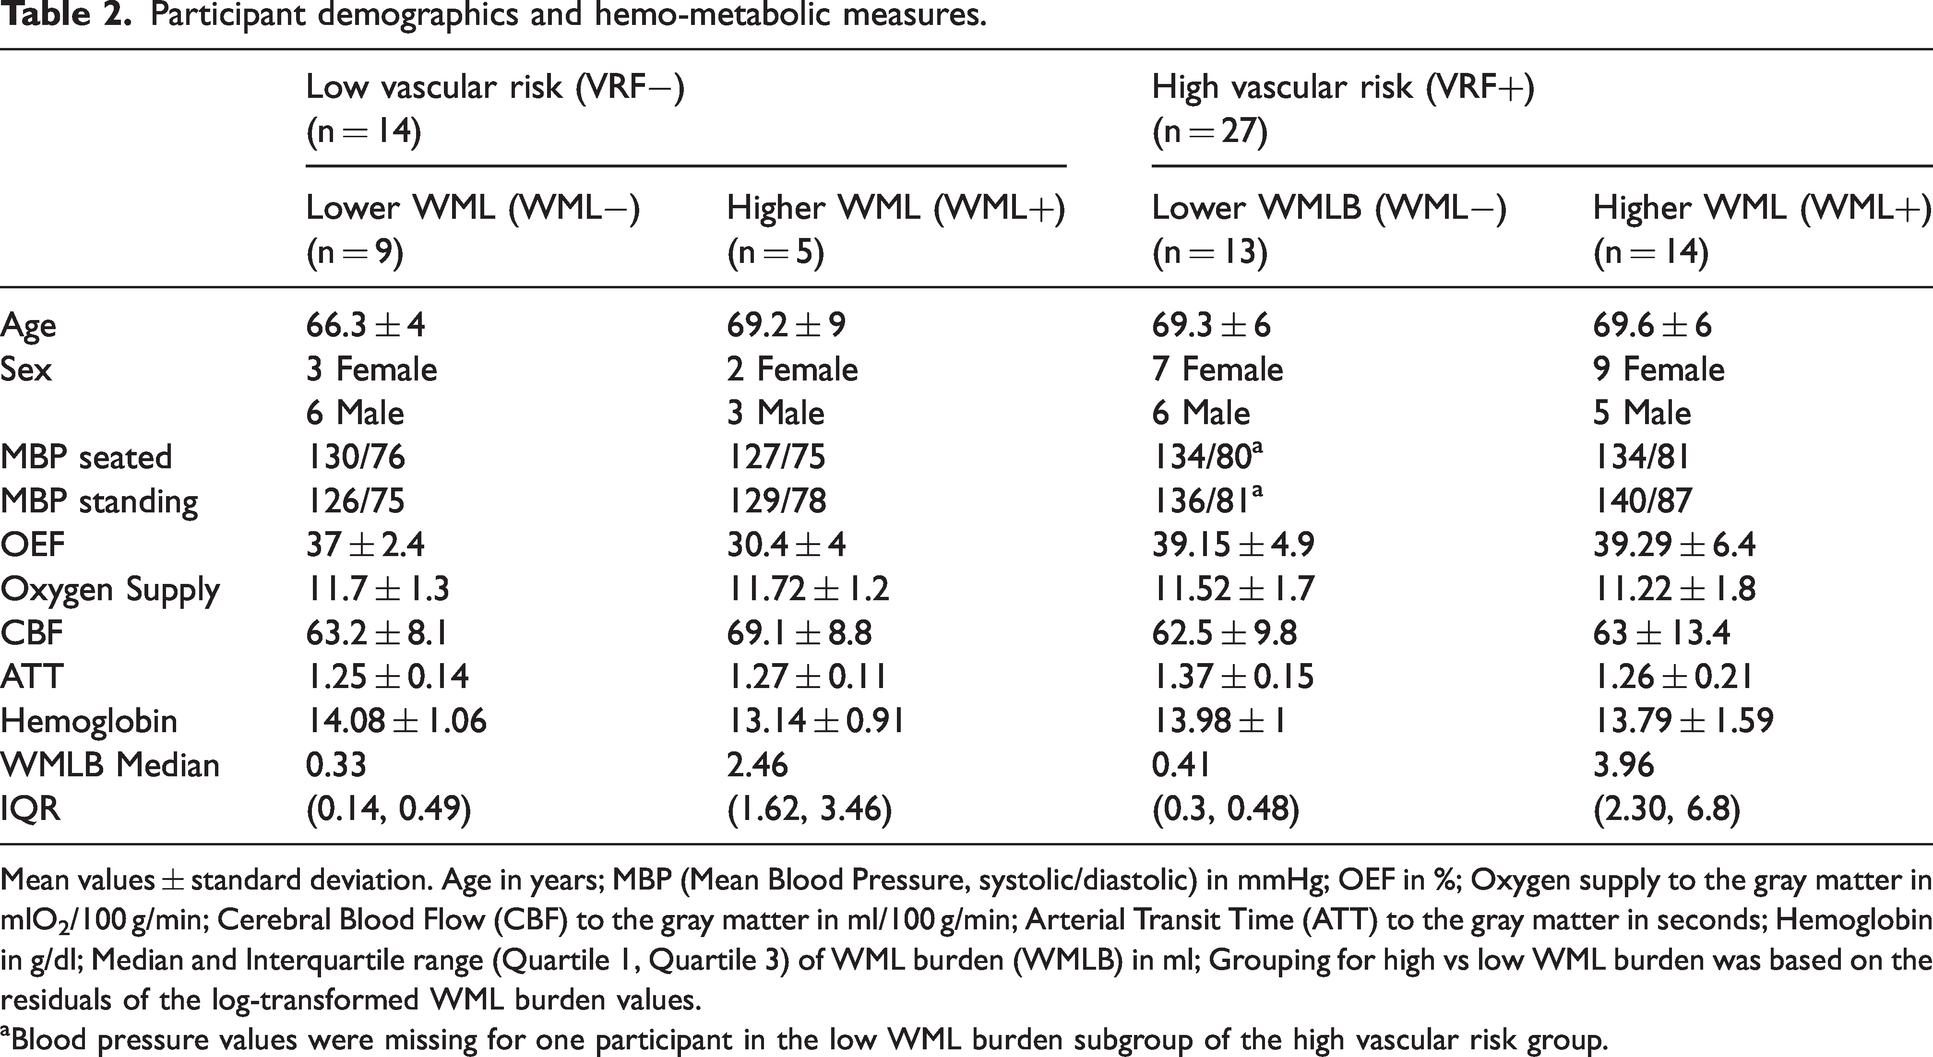
Mean values ± standard deviation. Age in years; MBP (Mean Blood Pressure, systolic/diastolic) in mmHg; OEF in %; Oxygen supply to the gray matter in mlO2/100 g/min; Cerebral Blood Flow (CBF) to the gray matter in ml/100 g/min; Arterial Transit Time (ATT) to the gray matter in seconds; Hemoglobin in g/dl; Median and Interquartile range (Quartile 1, Quartile 3) of WML burden (WMLB) in ml; Grouping for high vs low WML burden was based on the residuals of the log-transformed WML burden values.
aBlood pressure values were missing for one participant in the low WML burden subgroup of the high vascular risk group.
Risk factor cases per category. a
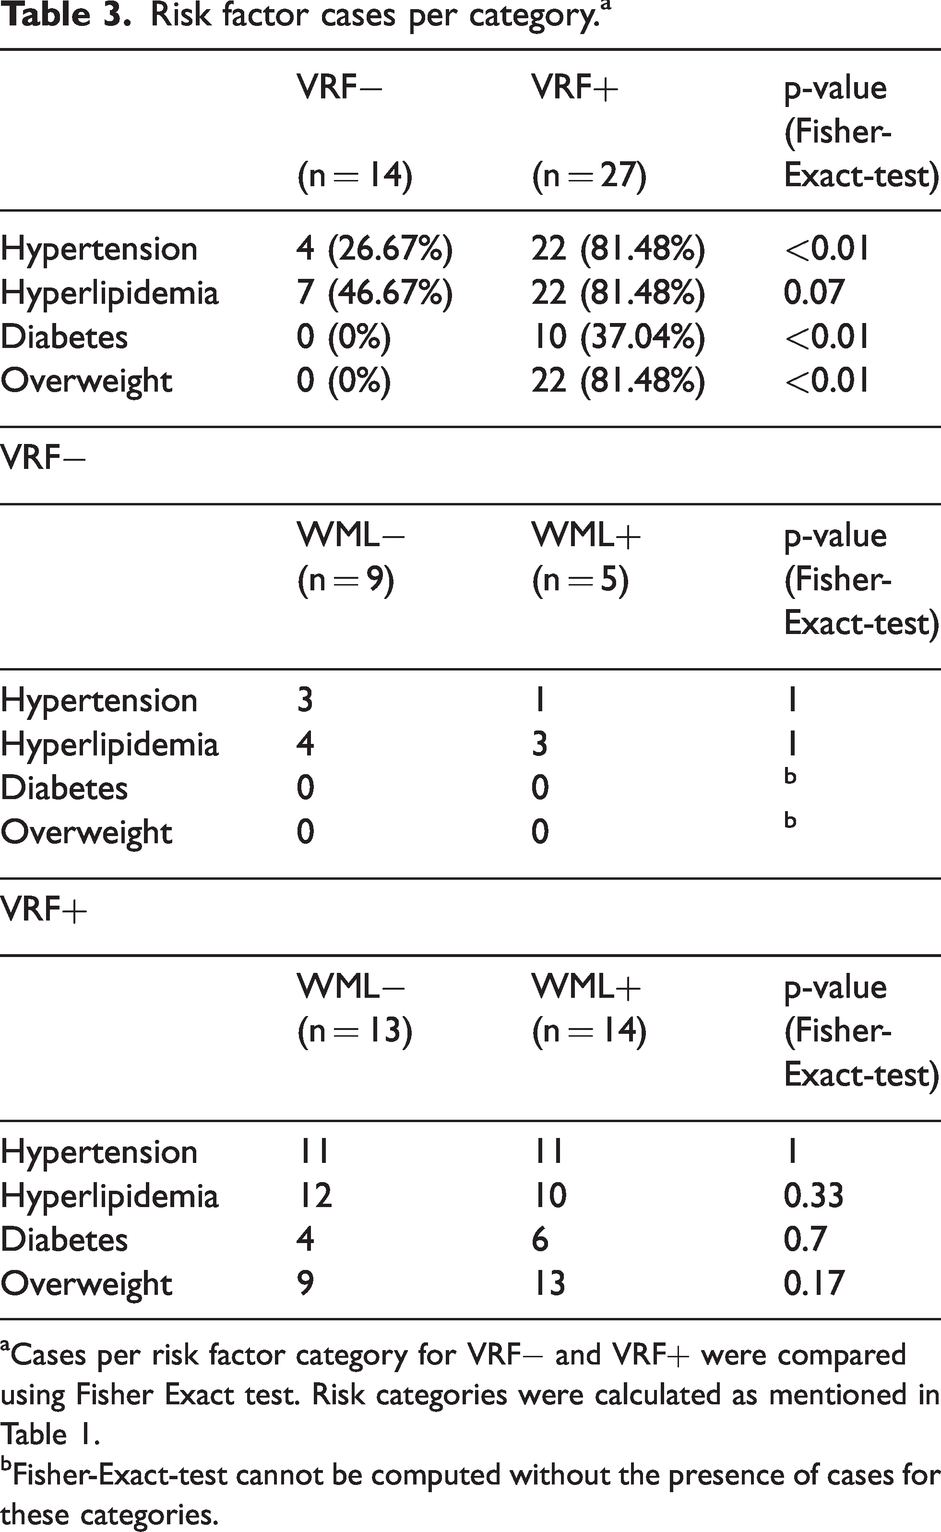
Cases per risk factor category for VRF− and VRF+ were compared using Fisher Exact test. Risk categories were calculated as mentioned in Table 1.
Fisher-Exact-test cannot be computed without the presence of cases for these categories.
High vs low vascular risk
Based on the vascular risk classification as described above, the sample was divided into VRF− (n = 14; 5 female) and VRF+ (n = 27; 16 female). The groups did not differ significantly in age, WML burden, and oxygen supply (Figure 2). However, they differed significantly in OEF (p < 0.01, d = 0.87), for which the VRF+ group (39.2% ± 5.6%) exhibited a higher OEF compared to the VRF− group (34.6% ±4.4%). There were no significant differences in oxygen supply to gray matter between the VRF− group (11.74 ml O2/100 g/min ± 1.23 ml O2/100 g/min) and the VRF+ group (11.37 ml O2/100 g/min ± 1.78 ml O2/100g/min; p = 0.43, d = 0.23). Furthermore, the VRF groups did not differ in CBF (VRF− = 65 ml/100 g/min ml ± 8.52 ml/100 g/min; VRF+ = 63 ml/100 g/min ± 11.59 ml/100g/min; p = 0.43, d = 0.24) or ATT (VRF− =1.26 sec ± 0.13 sec; VRF+ = 1.31 sec ± 0.19 sec; p = 0.27, d = 0.32). A linear model showed a potential interaction effect of vascular risk on the relationship of OEF and WML burden (p = 0.055).
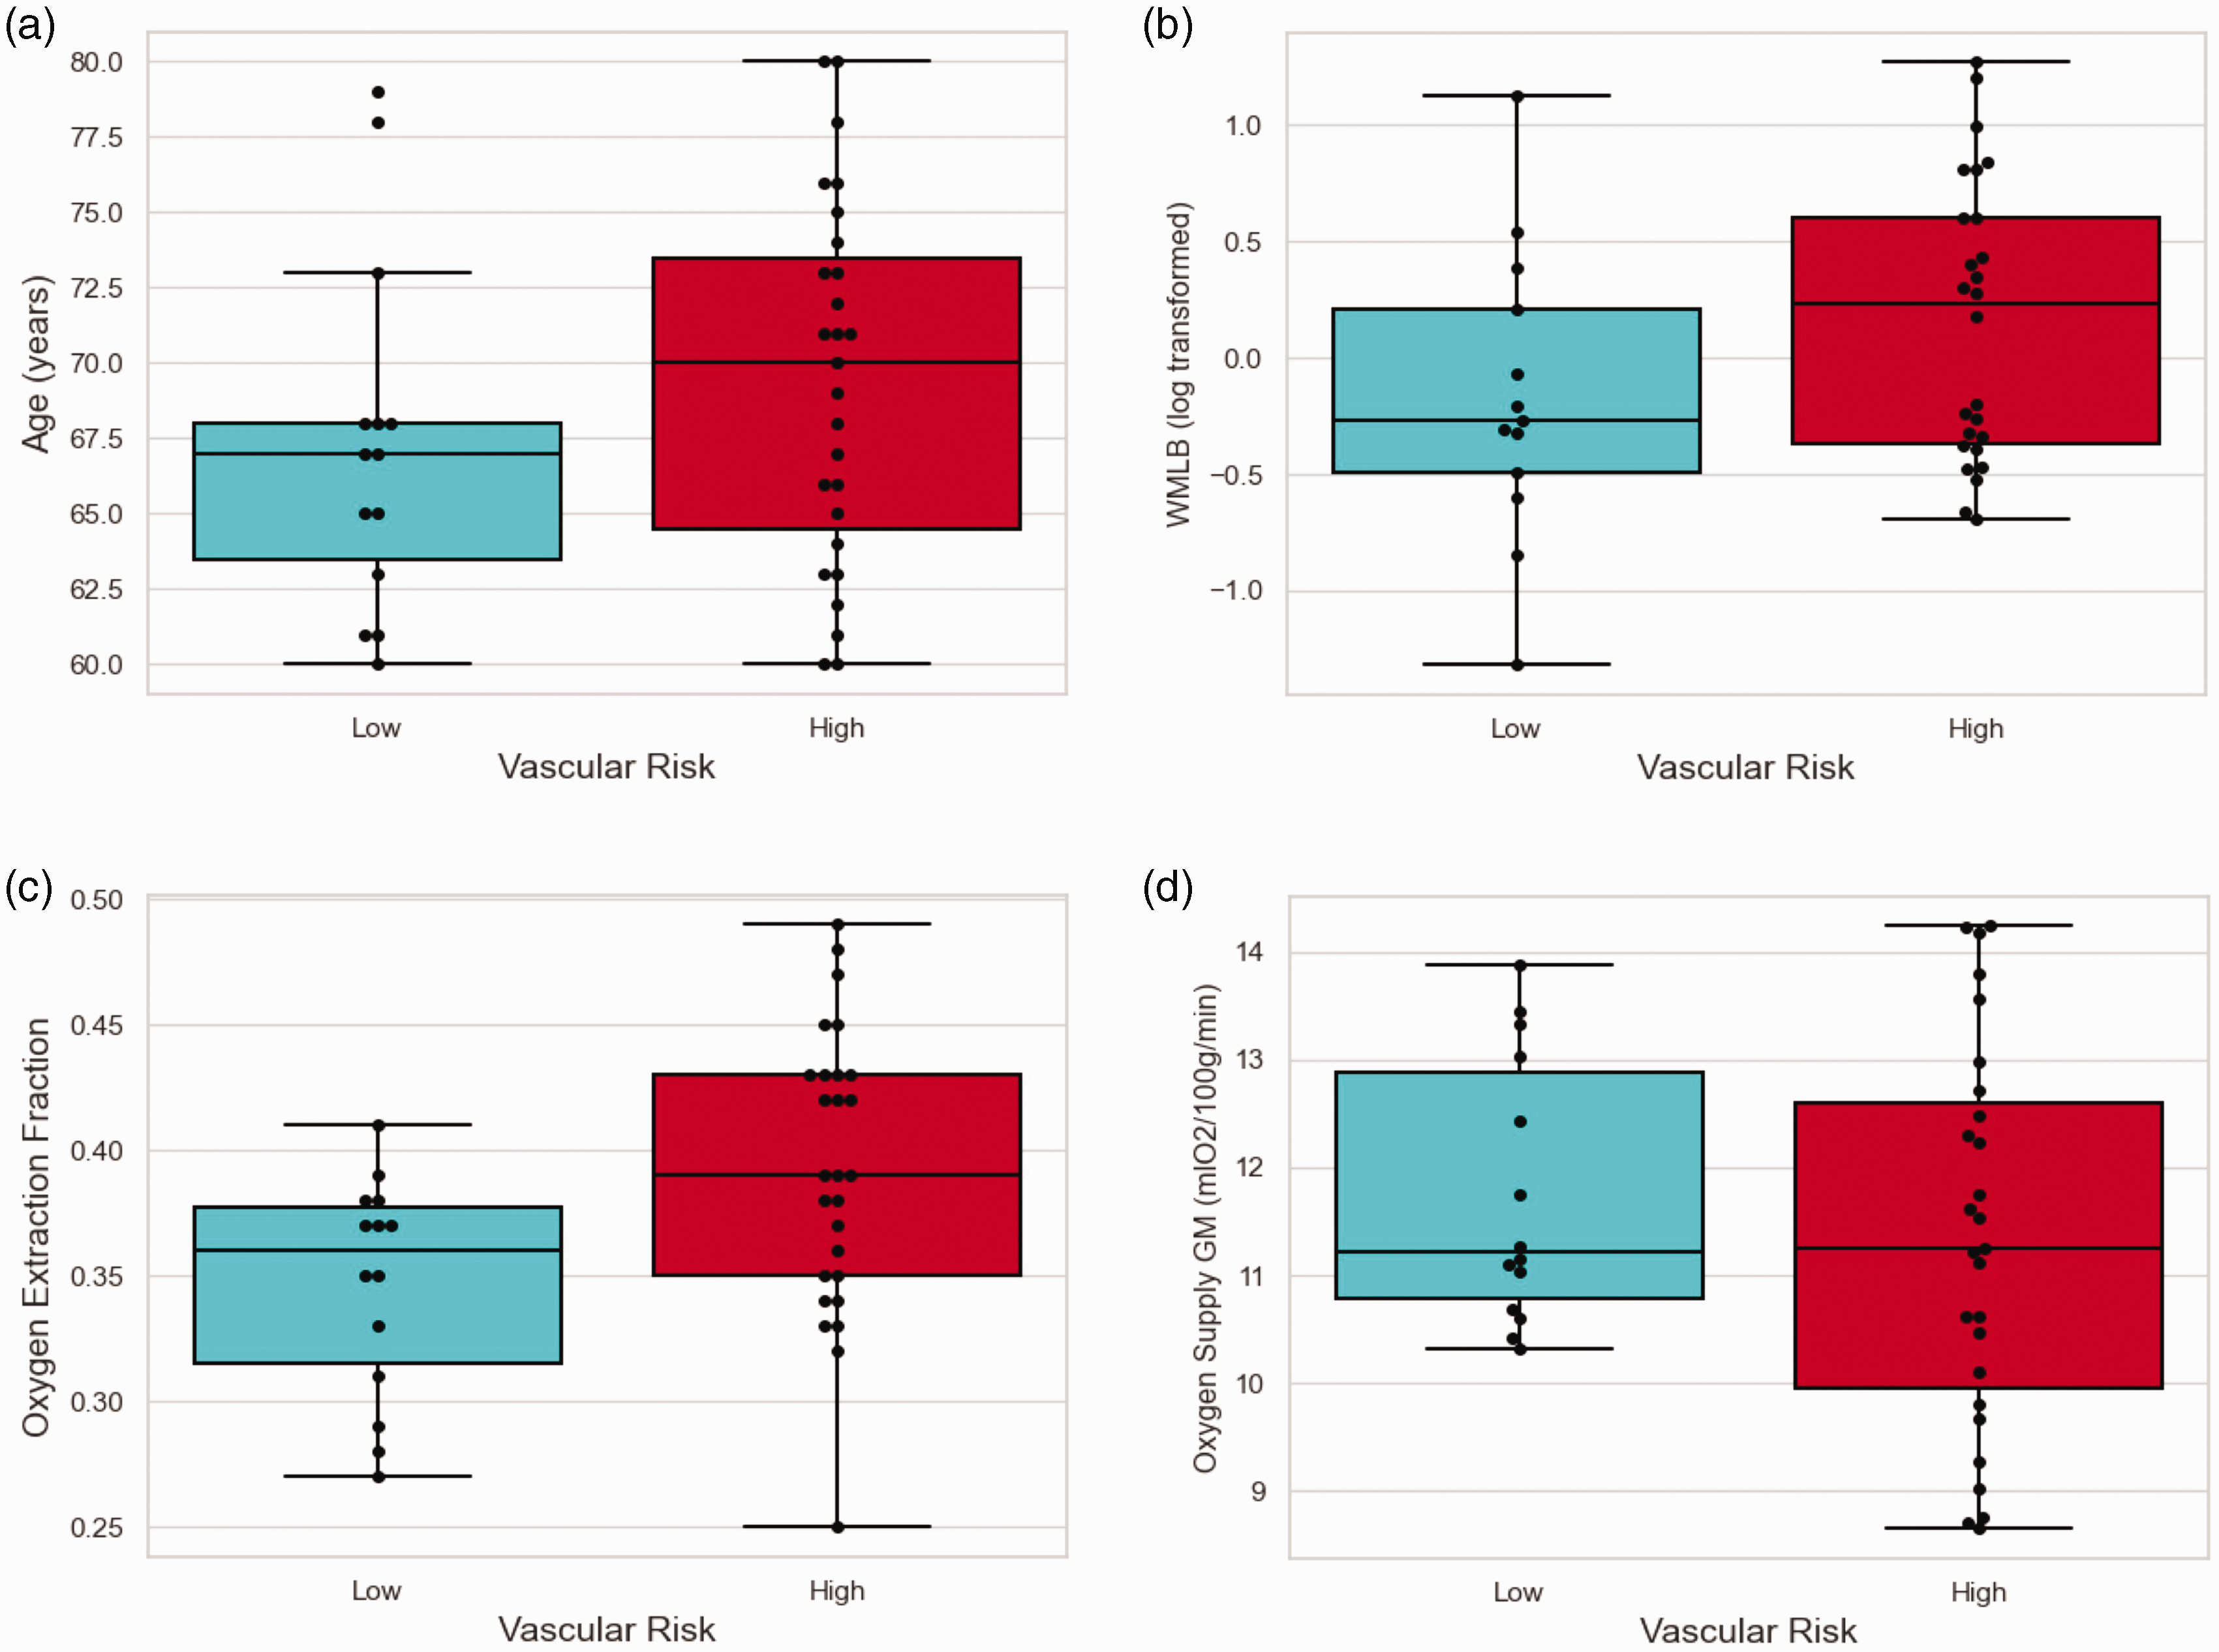
VRF+ versus VRF− did not differ in age (p = 0.29) (a), WML burden (p = 0.24) (b), and oxygen supply to gray matter (p = 0.43) (d), but differed significantly in OEF (p < 0.01) (c). VRF+ individuals had higher OEF (39.2%) and slightly lower oxygen supply values (11.37 mlO2/100 g/min), while VRF− individuals had lower OEF (34.6%) and slightly higher oxygen supply values (11.75 mlO2/100 g/min). Log transformed values of WML burden are shown for better visualization.
Low vascular risk and white matter lesion burden
Within the VRF− group, we divided the sample into WML+ versus WML− based on the calculated residuals (see Figure 3). The MDE0.8 for this sample size (n1 = 5, n2 = 9) was d = 1.7. While there were no differences in age or oxygen supply to the gray matter, OEF differed significantly between groups (p = 0.02, d = 2.05). WML+ individuals had lower OEF (30.4% ± 4%) compared to WML− individuals (37% ± 2.4%). Groups did not differ in CBF (VRF−WML+ = 69.1 ml/100 g/min ± 8.8 ml/100 g/min; VRF−WML− = 63.2 ml/100 g/min ± 8.1 ml/100 g/min; p = 0.25, d = 0.66) or ATT (VRF−WML+ = 1.27 sec ± 0.11 sec; VRF−WML− = 1.25 sec ± 0.14 sec; p = 0.69, d = 0.2). The correlation between OEF and oxygen supply was calculated as a supplementary analysis. There was no significant correlation between OEF and oxygen supply in the VRF− group (ρ = −0.15, p = 0.82, Supplemental Figure 1).
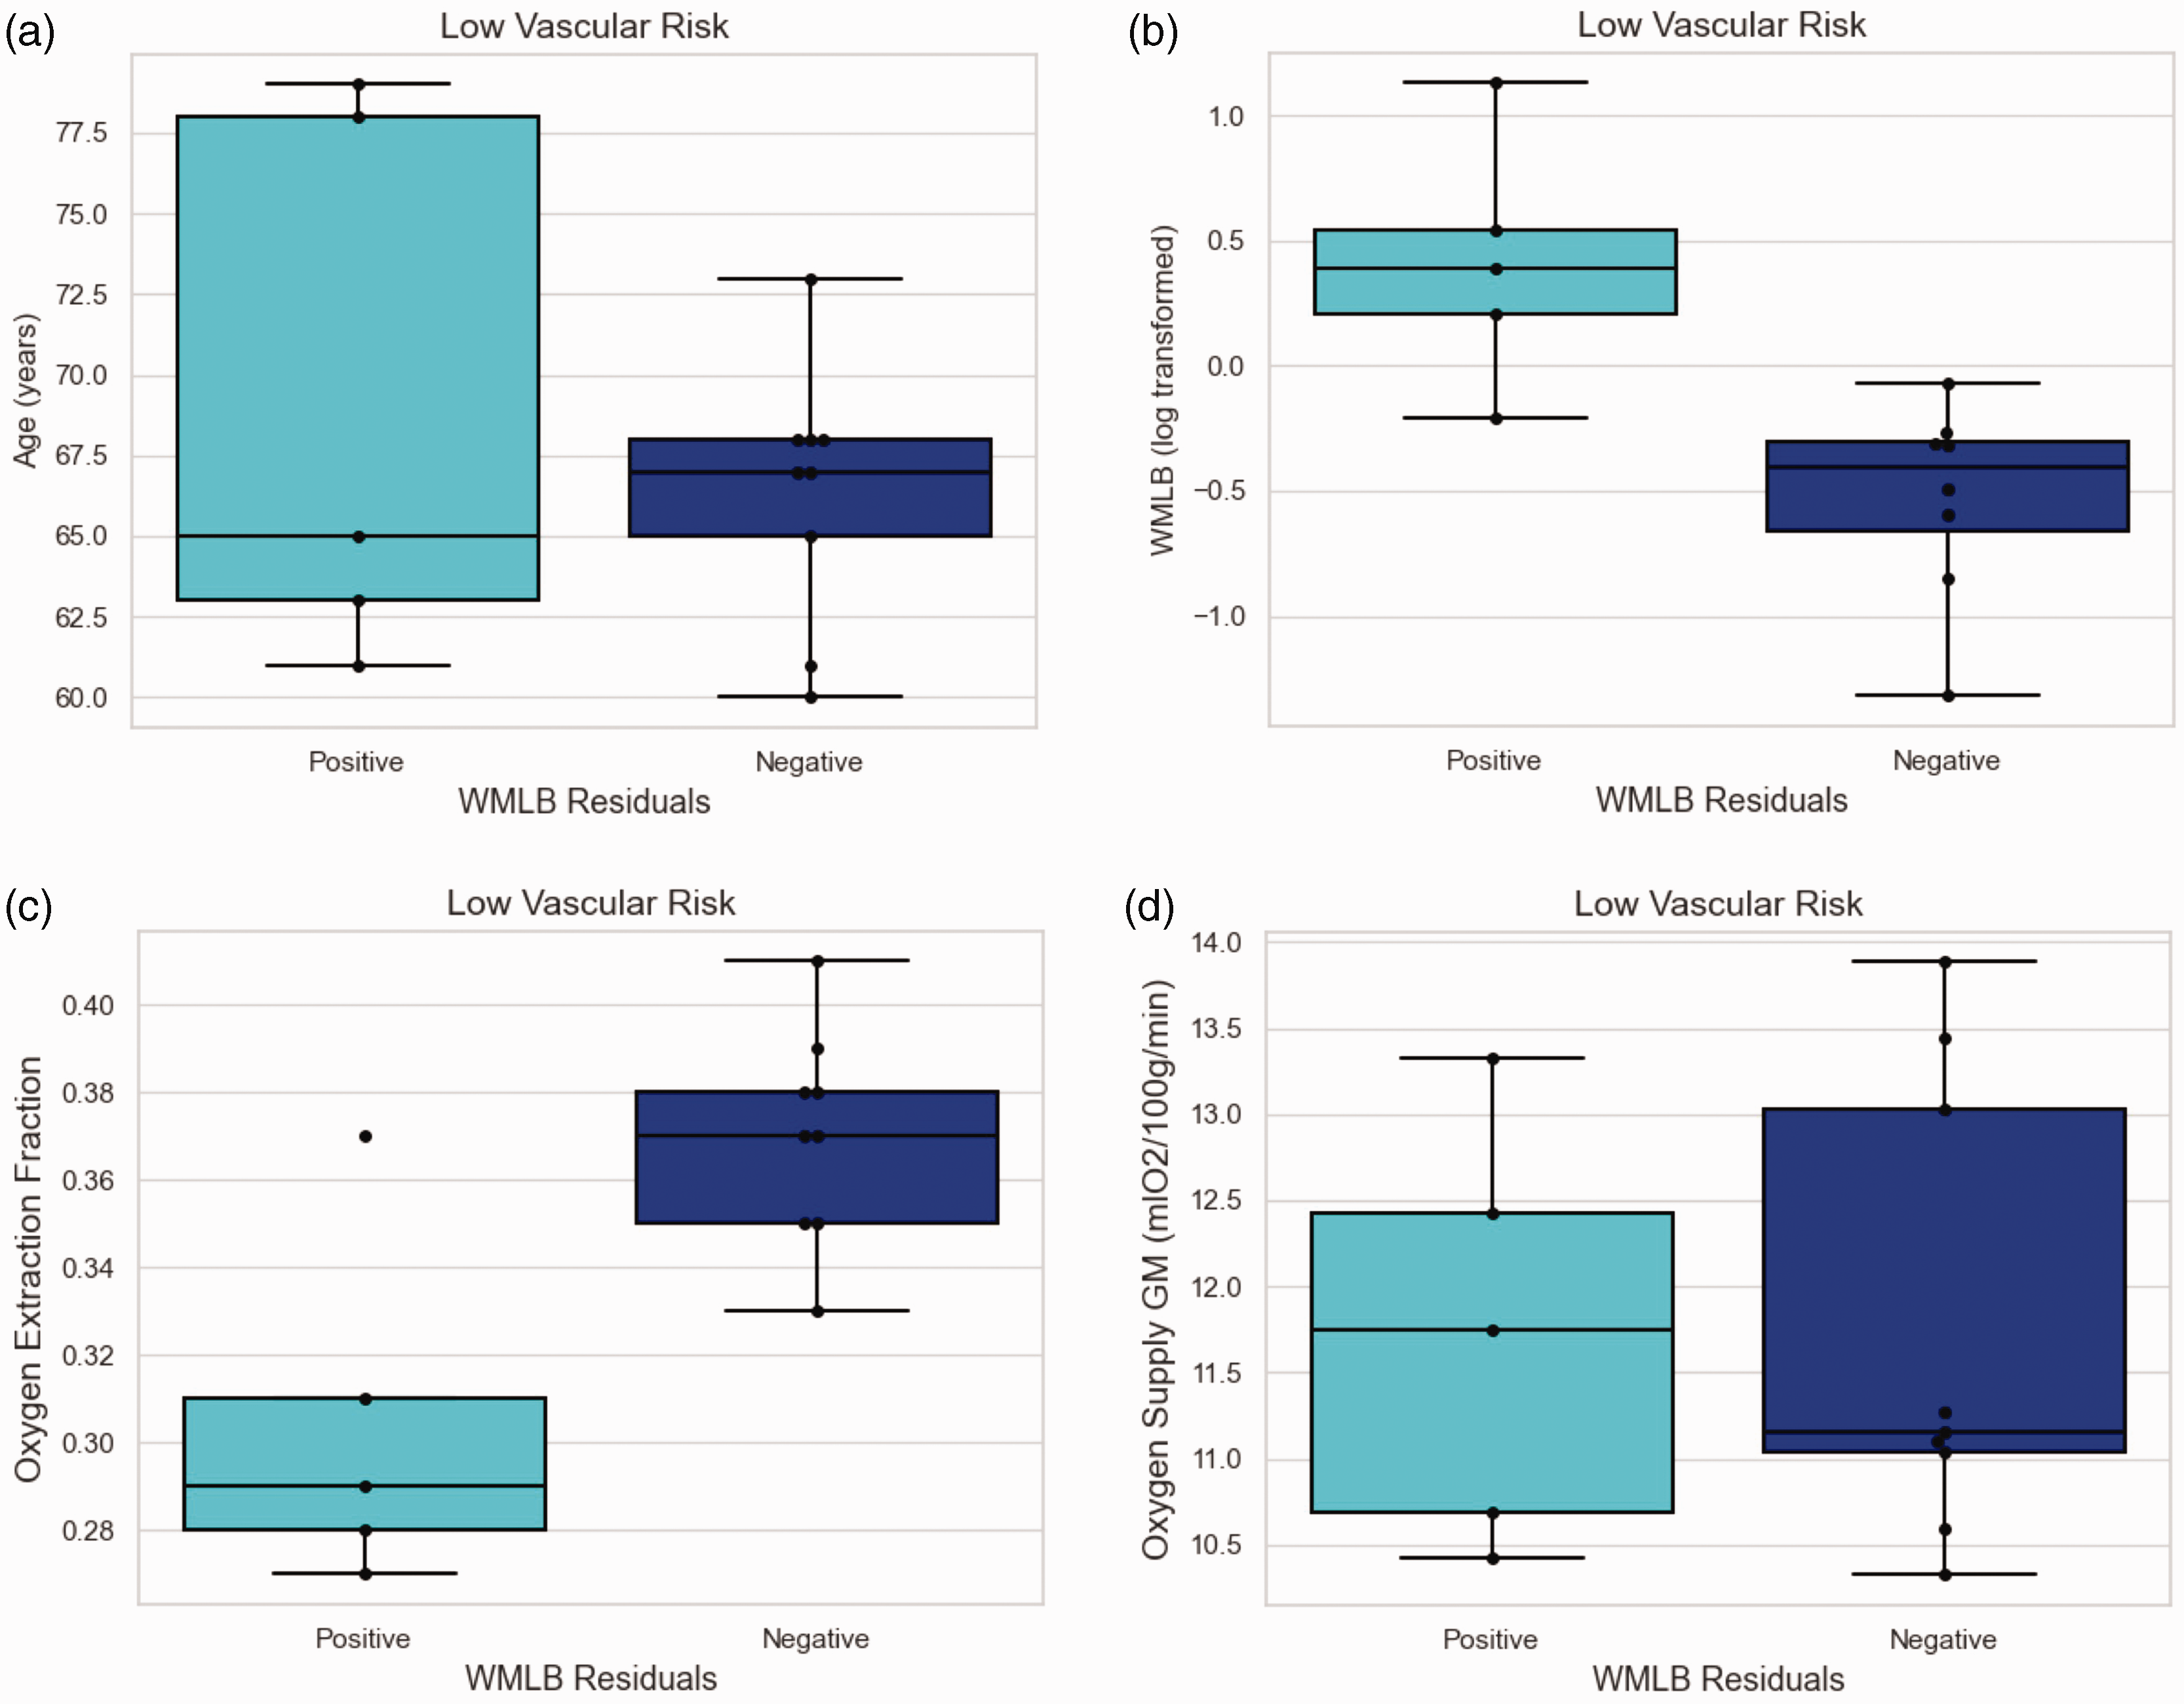
Low Vascular Risk: WML+ are individuals who present higher lesion burden than expected for their age. WML− are individuals who present lower WML burden than expected for their age. Due to the group split by WML burden, the groups differed significantly between WML+ versus WML− (p < 0.01) (b). The groups did not differ in age (WML+ 69.2 years; WML− 66.3 years; p = 0.49) (a), or oxygen supply to gray matter (WML+ 11.72 mlO2/100 g/min; WML− 11.76 mlO2/100 g/min; p = 0.87) (d), but in OEF (p = 0.02) (c). WML− individuals had higher OEF (37%) than their WML+ peers (30.4%).
High vascular risk and white matter lesion burden
The VRF+WML+ and VRF+WML− groups did not differ significantly in any variable (Figure 4). WML+ had an OEF of 39.3% (±6.4%), whereas WML− individuals had an OEF of 39.2% (±4.9%, p = 0.95, d = 0.02). Oxygen supply to gray matter was 11.22 mlO2/100 g/min (±1.8 mlO2/100 g/min) in WML+ individuals and 11.52 mlO2/100 g/min (±1.8 mlO2/100 g/min) in WML− individuals (p = 0.67, d = 0.162). Furthermore, groups did not differ in CBF (VRF+WML+ = 63 ml/100 g/min ± 13.4 ml/100 g/min; VRF+WML− = 62.5 ml/100 g/min ± 9.8 ml/100 g/min; p = 0.92, d = 0.04) or ATT (VRF+WML+ = 1.26 sec ± 0.21 sec; VRF+WML− = 1.37 sec ± 0.15 sec; p = 0.17, d = 0.6). As a supplementary analysis, the correlation between OEF and oxygen supply was calculated and showed a significant correlation in the VRF+ group (ρ = −0.49, p < 0.01, Supplemental Figure 1).
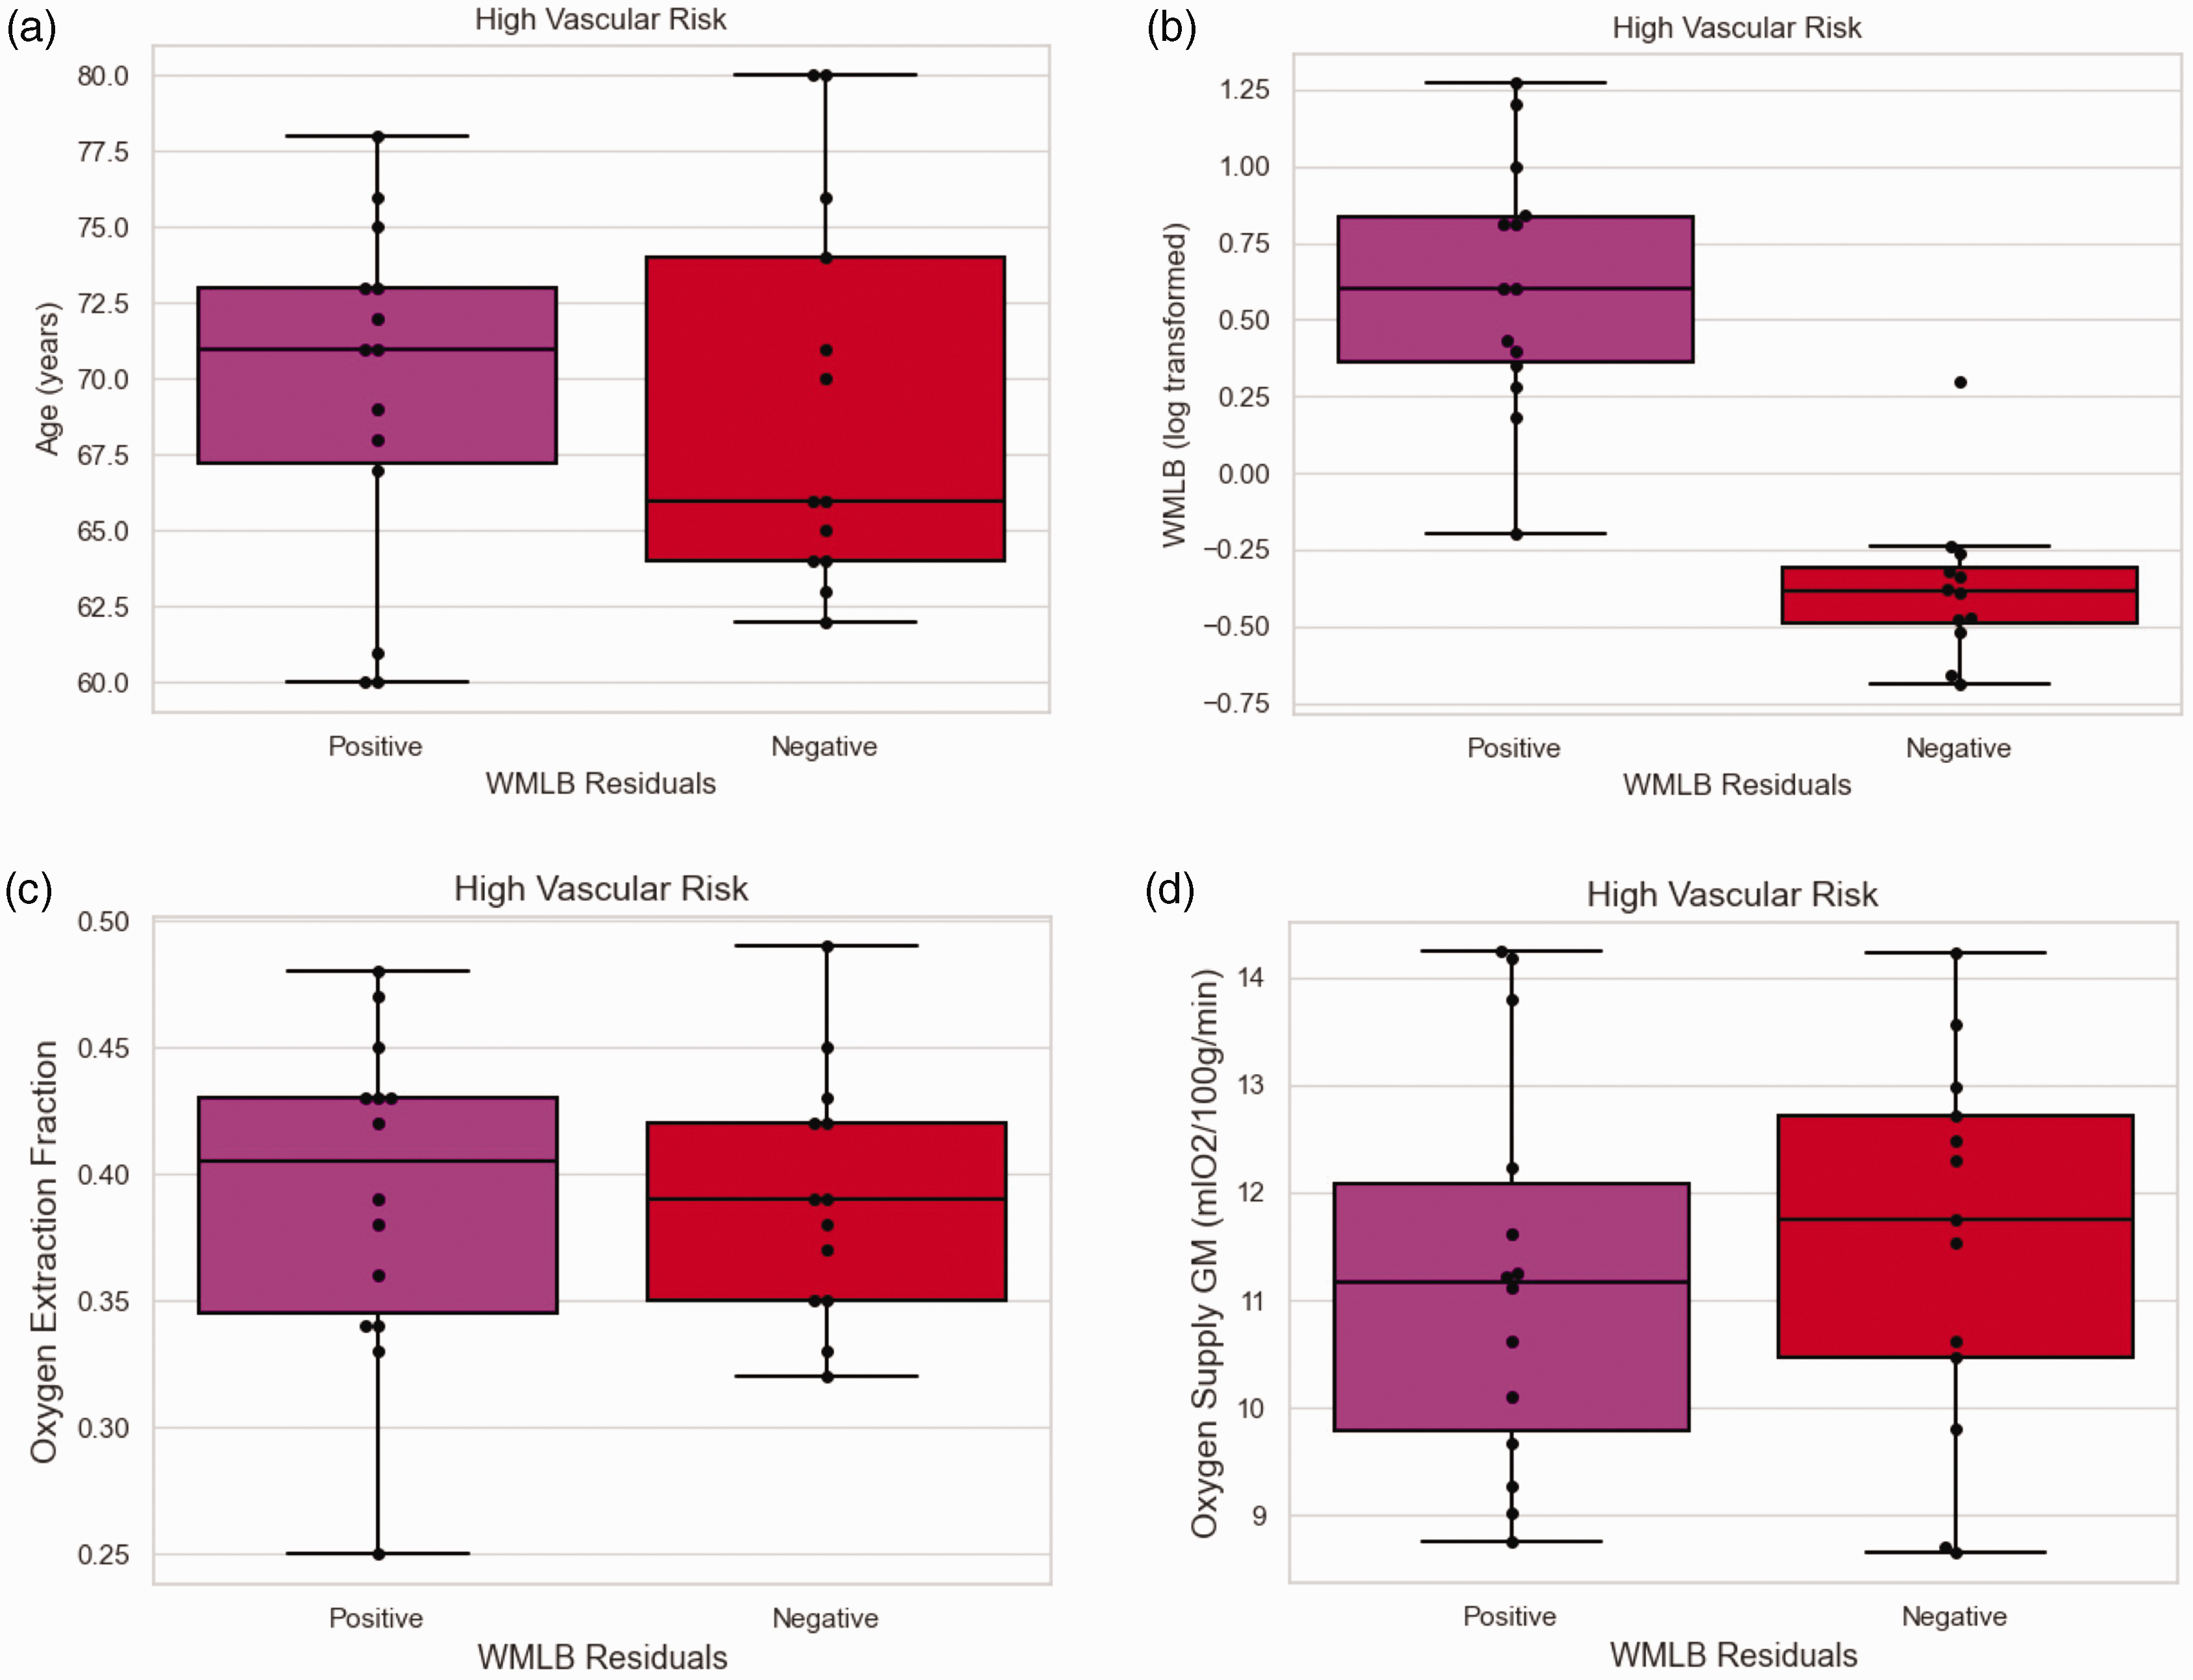
High Vascular Risk: WML+ are individuals who present higher lesion burden than expected for their age. WML− are individuals who present lower WML burden than expected for their age. Due to the group split by WML burden, the groups differed significantly in WML burden (p < 0.01) (b). The groups did not differ in age (WML+ 69.6 years; WML− 69.3 years; p = 0.91) (a), OEF (WML+ 39.3%; WML− 39.2%; p = 0.95) (c), nor oxygen supply to gray matter (WML+ 11.22 mlO2/100 g/min; WML− 11.52 mlO2/100 g/min; p = 0.67) (d).
Discussion
Imbalances in the cerebral hemo-metabolic equilibrium pose the risk of tissue hypoxia and structural damage, including in the form of WMLs. Compensation can occur through increased blood oxygen supply or elevated oxygen extraction fraction. However, the pathogenesis of WMLs remains unclear, and investigating microvascular physiology in individuals who present with a high lesion burden despite the absence of traditional vascular risk factors could help uncover underlying factors. In this study, we investigated differences in cerebral oxygen delivery and oxygen extraction based on vascular risk status and white matter lesion burden in a sample of typically aging older adults. Our findings revealed a unique variation of OEF depending on vascular risk and lesion burden, indicating that OEF might be more than just a passive parameter in WML formation pathophysiology. First, we found that OEF was higher but oxygen supply was not different in the high vascular risk group compared to the low vascular risk group. In addition, OEF and oxygen supply showed a significant inverse correlation in the high vascular risk group but not in the low vascular risk group. This could indicate that elevated OEF represents a compensatory mechanism in the high-risk group, which agrees with previous studies that showed an increase in OEF in individuals with high vascular risk in a longitudinal setting. 35 Second, within the low vascular risk group, OEF was lower in individuals with higher WML burden compared to those with lower WML burden. No such differences in OEF were observed in the high vascular risk group based on WML burden.
As this was a cross-sectional study, it was not possible to distinguish whether lower OEF is a cause or a symptom of higher WML burden. However, if lower OEF is a result of the higher lesion burden, a similar pattern (i.e., higher burden being associated with lower OEF) would have been expected in the high vascular risk group as well. As this was not the case, one plausible interpretation might be a reached state of relative homeostasis in oxygen metabolism due to or in combination with the occurrence of WMLs in the high-risk group. This would be in line with previous research that showed reduced CBF in WMLs and proposed an interpretation of long-term adaptation of lower white matter oxygen utilization. 36 In contrast, in a previous longitudinal study, larger OEF increase was associated with greater growth of WML burden, 35 but this finding was reported without specifically addressing vascular risk, hindering a direct comparison of the findings.
An alternative interpretation, especially given the results in the low-risk group, might be that the absence of compensatory mechanisms for low OEF leads to higher WML burden. One proposed pathomechanism for this observation is capillary shunting11,34 in which a state of disturbed capillary flow leads to reduced oxygen extraction efficiency as the blood more rapidly traverses the capillary bed. OEF is typically regarded as a passive quantity that changes only based on whether CBF is elevated or reduced, however, recent work has shown that OEF can be affected independently of CBF based on other factors at play, including capillary flow patterns. 37 Given that oxygen is needed to ensure tissue health and function, capillary shunting resulting in low OEF could lead to tissue hypoxia, and the high WML burden could therefore be caused by hypoxia-induced cell destruction.
Previous findings suggest that lower OEF may reflect brain dysfunction 35 and is associated with Alzheimer’s Disease. 38 Interestingly, whereas the same previous findings 38 showed that vascular risk was associated with higher OEF, which is in line with our findings, it further showed that for the subgroup of low vascular risk, lower OEF was associated with worse cognitive performance and greater amyloid burden, but not with WML burden (measured using the Fazekas score). While the interpretation of the low OEF in the low vascular risk group was interpreted to be caused by abnormally reduced CBF, this was not directly measured. Differences between the studies in the association between OEF and WMLs in this study may be related to differences in methodology associated with the assessment of WMLs. All in all, while CBF and oxygen supply are complicated measures in WML pathology as they are strongly associated with regional metabolic tissue demands.36,39 OEF could be a more insightful parameter to address the early WML formation process.
The results in this study suggest a relationship between OEF and WML burden, whilst the directionality cannot be explained by the OEF measured used in this study. As the OEF is measured in rather large venous structures instead of on a capillary level, reduced OEF could also be a consequence rather than a cause of WML burden. While our hypothesis regarding the capillary flow disturbances that may impair OEF assumes an underlying global cerebral phenomenon, the use of asymmetric spin echo MRI to measure OEF on a regional level (as an alternative to the global TRUST approach) could provide further insights into the patho-mechanism of WML formation. Regional OEF measures might give further insight into the underlying patho-mechanism and should be addressed in future research. Furthermore, it is not yet clear whether the oxygen supply to the brain increases after tissue damage, or whether any increase in blood oxygen delivery reactively reduces the oxygen extraction fraction to ensure metabolic tissue homeostasis, and whether imbalances in this process ultimately lead to the formation of white matter lesions. Recent work has suggested a novel approach to investigating vascular function by measuring venous transit times that could aid in addressing these questions, 40 especially by combining information on arterial and venous flow patterns.
The findings of the study should be considered in the context of the following limitations. First, despite the classification into high versus low vascular risk, it should be noted that the overall sample used for this study was relatively healthy. Second, the small sample size makes it especially difficult to identify differences between groups while at the same time increasing confidence in the findings. While the main finding of OEF differences within the low-risk group showed a higher effect size than the minimum detectable effect, the differences in oxygen supply showed a lower effect size than the minimum detectable effect. For detecting differences in oxygen supply between healthy individuals in similar age and hemoglobin ranges, bigger sample sizes are needed, as the detectable differences are expected to be rather small. Third, other risk factors that have may an influence on microvascular physiology, including smoking status and alcohol consumption were not collected as part of the study. The risk factor classification of this study ensured that the low-risk group did not have hidden risk factors and was as healthy as possible. However, there might still be factors overseen and not included. Fourth, due to the cross-sectional approach of this data, information on the causality of the findings is not readily apparent. Further investigation, especially longitudinal studies, is needed to determine if the impaired oxygen extraction is causal for the formation of white matter lesion burden, or whether it is a symptom of preexistent impaired tissue metabolism.
Conclusion
Our findings indicate that OEF may not represent a passive quantity but one that can be affected independently of CBF and cerebral oxygen supply in older adults. Reduced OEF in healthy individuals with low vascular risk was associated with a higher WML burden. Missing compensatory mechanisms for a reduced OEF might help explain the formation process of WMLs in otherwise healthy older adults.
Supplemental Material
sj-pdf-1-jcb-10.1177_0271678X241300394 - Supplemental material for Cerebral microvascular physiology associated with white matter lesion burden differs by level of vascular risk in typically aging older adults
Supplemental material, sj-pdf-1-jcb-10.1177_0271678X241300394 for Cerebral microvascular physiology associated with white matter lesion burden differs by level of vascular risk in typically aging older adults by Gabriele M Gassner, Nikou L Damestani, Natalie S Wheeler, Jan A Kufer, Shrikanth M Yadav, Sarah F Mellen, Katherine N Maina, David H Salat and Meher R Juttukonda in Journal of Cerebral Blood Flow & Metabolism
Footnotes
Funding
The author(s) disclosed receipt of the following financial support for the research, authorship, and/or publication of this article: This work was supported by the National Institutes of Health/National Institute on Aging (R21AG072068 and K01AG070318).
Declaration of conflicting interests
The author(s) declared the following potential conflicts of interest with respect to the research, authorship, and/or publication of this article: Meher R. Juttukonda receives research-related support from Siemens Healthineers. The other authors declared no potential conflicts of interest with respect to the research, authorship, and/or publication of this article.
Authors’ contributions
Gabriele M. Gassner and Meher R. Juttukonda: Involved in study conception and design, data analysis and interpretation of data, and manuscript drafting. Nikou L. Damestani and Natalie S. Wheeler: Involved in data acquisition, interpretation of data, and manuscript revision. Jan A. Kufer: Involved in data analysis, interpretation of data, and manuscript revision. Shrikanth M. Yadav, Sarah F. Mellen, and Katherine N. Maina: Involved in data acquisition and manuscript revision. David H. Salat: Involved in interpretation of data and manuscript revision.
Supplementary material
Supplemental material for this article is available online.
References
Supplementary Material
Please find the following supplemental material available below.
For Open Access articles published under a Creative Commons License, all supplemental material carries the same license as the article it is associated with.
For non-Open Access articles published, all supplemental material carries a non-exclusive license, and permission requests for re-use of supplemental material or any part of supplemental material shall be sent directly to the copyright owner as specified in the copyright notice associated with the article.