
Abstract
Cerebrovascular risk factors contribute to cognitive decline via mechanisms such as small vessel disease and chronic ischemia. Advanced MRI parameters, including maximum oxygen extraction fraction (OEFmax) and cerebral metabolic rate of oxygen (CMRO2), provide insights into cerebral oxygenation and cognition. This retrospective study evaluated the relationships between oxygen metabolic stress, cerebrovascular risk factors, and cognitive function in 226 adults undergoing dynamic susceptibility contrast (DSC)-MRI. White matter hyperintensity (WMH) volumes, OEFmax, and CMRO2 were quantified and analyzed against cerebrovascular risk factors (e.g., age, smoking, hypertension), MMSE scores, clinical diagnoses, and history of cerebrovascular disease. A history of smoking was linked to a higher OEFmax (P = 0.015). An older age correlated with a larger WMH volume (P < 0.001), higher OEFmax (P < 0.001), and lower CMRO2 (P = 0.001). Patients with history of infarcts exhibited larger WMH volumes (P < 0.001) and lower CMRO2 (P < 0.001). Multivariable regression showed WMH volume (P = 0.03) and OEFmax (P = 0.018) were negatively associated with MMSE scores, while CMRO2 had no significant association (P = 0.52). Patients with vascular dementia exhibited lower CMRO2 than those with Alzheimer’s or mild cognitive impairment (P = 0.001). These findings suggest that DSC-derived OEFmax and CMRO2 could provide insights into the relationship between cerebrovascular risk factors and cognitive decline, emphasizing their role as key indicators of brain oxygenation.
Keywords
Introduction
Advancements in dementia research have enhanced our understanding of the epidemiological patterns, disease progression, and underlying pathological mechanisms of this neurological disorder. Most studies on dementia have used models based on neuropathological definitions of Alzheimer’s disease, dementia with Lewy bodies, vascular dementia, and other less frequent causes of the disorder. 1 Recent findings have highlighted the impact of cerebrovascular risk factors2,3 on the onset and progression of vascular dementia and Alzheimer’s disease. For instance, hypertension alters the cerebral vascular structure and impairs vasoregulatory mechanisms, compromising blood supply and increasing the vulnerability of the brain to ischemic injury and Alzheimer’s pathology. 4 The Rotterdam Scan Study, a large population-based investigation of brain aging, identified the baseline leukoaraiosis severity, age, blood pressure, smoking, and lacunes as predictors of small vessel disease progression. Furthermore, it revealed that small vessel disease progression is closely linked to cognitive decline. 5
Many of these risk factors are associated with subcortical and white matter lesions, including white matter hyperintensities (WMHs), lacunar infarcts, and cerebral microbleeds, all of which are hallmark findings of cerebral small vessel disease visible on brain magnetic resonance imaging (MRI).6,7 Small vessel disease, a common manifestation of cerebrovascular pathology in older patients, affects brain microcirculation and either directly disrupts prefrontal–subcortical loops or indirectly contributes to cognitive decline through incident strokes. 8 These changes stem from chronic ischemia, blood–brain barrier disruption, and capillary dysfunction. Alterations in capillary morphology and flow regulation can lead to impaired oxygen delivery, a critical factor in neurodegeneration.9–11 Among the neuroimaging findings of hallmarks of small vessel disease, WMHs are the most common on MRI scans. More importantly, WMHs are a clinically important marker of increased risks of stroke, dementia, and brain atrophy, making it the neuroimaging marker of “brain frailty.” 7
Recent studies have highlighted the importance of the cerebral blood flow, oxygen extraction fraction (OEFmax), and cerebral metabolic rate of oxygen (CMRO2) metrics as biomarkers for assessing cerebral oxygenation and its relationship to cognitive function. Jespersen and Østergaard expanded the classic flow–diffusion equation to account for the impact of capillary flow dynamics on brain oxygenation, incorporating capillary transit time heterogeneity as a measure of microvascular flow distribution. 12 These parameters can be derived from dynamic susceptibility contrast (DSC)–perfusion MRI data. 13
The OEFmax metric indicates the fraction of oxygen extracted from blood as it passes through the cerebral microvasculature, thereby reflecting the amount of oxygen consumed by the brain parenchymal tissue relative to the total amount delivered by the arterial blood. 12 The CMRO2 metric indicates the amount of oxygen consumed by the brain parenchymal tissue per unit time and is often calculated by multiplying the blood flow, arterial oxygen content, and OEFmax values. Thus, the CMRO2 value directly reflects metabolic oxygen demand within the tissue. The combination of the OEFmax and CMRO2 metrics would provide detailed information on capillary flow characteristics, thereby explaining how oxygen is delivered and utilized at the microvascular level.
The aim of this study was to assess the relationships between cerebral oxygen metabolic stress, cerebrovascular risk factors, and cognitive function, using DSC-derived OEFmax and CMRO2 values as markers of oxygen metabolism. By examining these relationships, the findings could support the potential of MRI-derived oxygen metrics as markers for cognitive impairment risk, aiding in the clinical management of patients with diverse cognitive and cerebrovascular profiles.
Materials and methods
This retrospective study was conducted in accordance with the Declaration of Helsinki and the study protocol was approved by the institutional review board of Asan Medical Center (IRB number: S2024-2232-0002), and the need for informed consent was waived due to the retrospective design and the use of anonymized medical records. All protocols and data reporting adhered to the STROBE (Strengthening the Reporting of Observational Studies in Epidemiology) guidelines. 14
Study population
This retrospective cohort study was conducted at a single tertiary referral hospital between January 2023 and July 2024 and included a consecutive series of all patients meeting the following inclusion criteria: (a) adult patients aged 18 years or older; (b) patients who underwent a dedicated brain MRI protocol for cognitive impairment with gadolinium-based contrast enhancement, including DSC perfusion sequences; and (c) patients with available Mini-Mental State Examination (MMSE) score records. The exclusion criteria were (a) patients without available MMSE scores and (b) patients diagnosed with cognitive impairment due to causes other than dementia, such as Parkinsonism, toxic or metabolic encephalopathy, inflammation, tumors, or other structural neurological diseases. The patients’ medical records were reviewed to document age, sex, clinical diagnosis, MMSE score, underlying cerebrovascular risk factors [i.e., hypertension, dyslipidemia, diabetes mellitus, smoking history, and body mass index (BMI)], and the history of cerebrovascular disease (CVD) or minor stroke. Figure 1 presents the flow diagram for patient selection. From 461 potentially eligible patients, 235 patients were excluded (no MMSE data, n = 176; cognitive dysfunction due to other causes, n = 59), leaving a total of 226 patients for analysis.
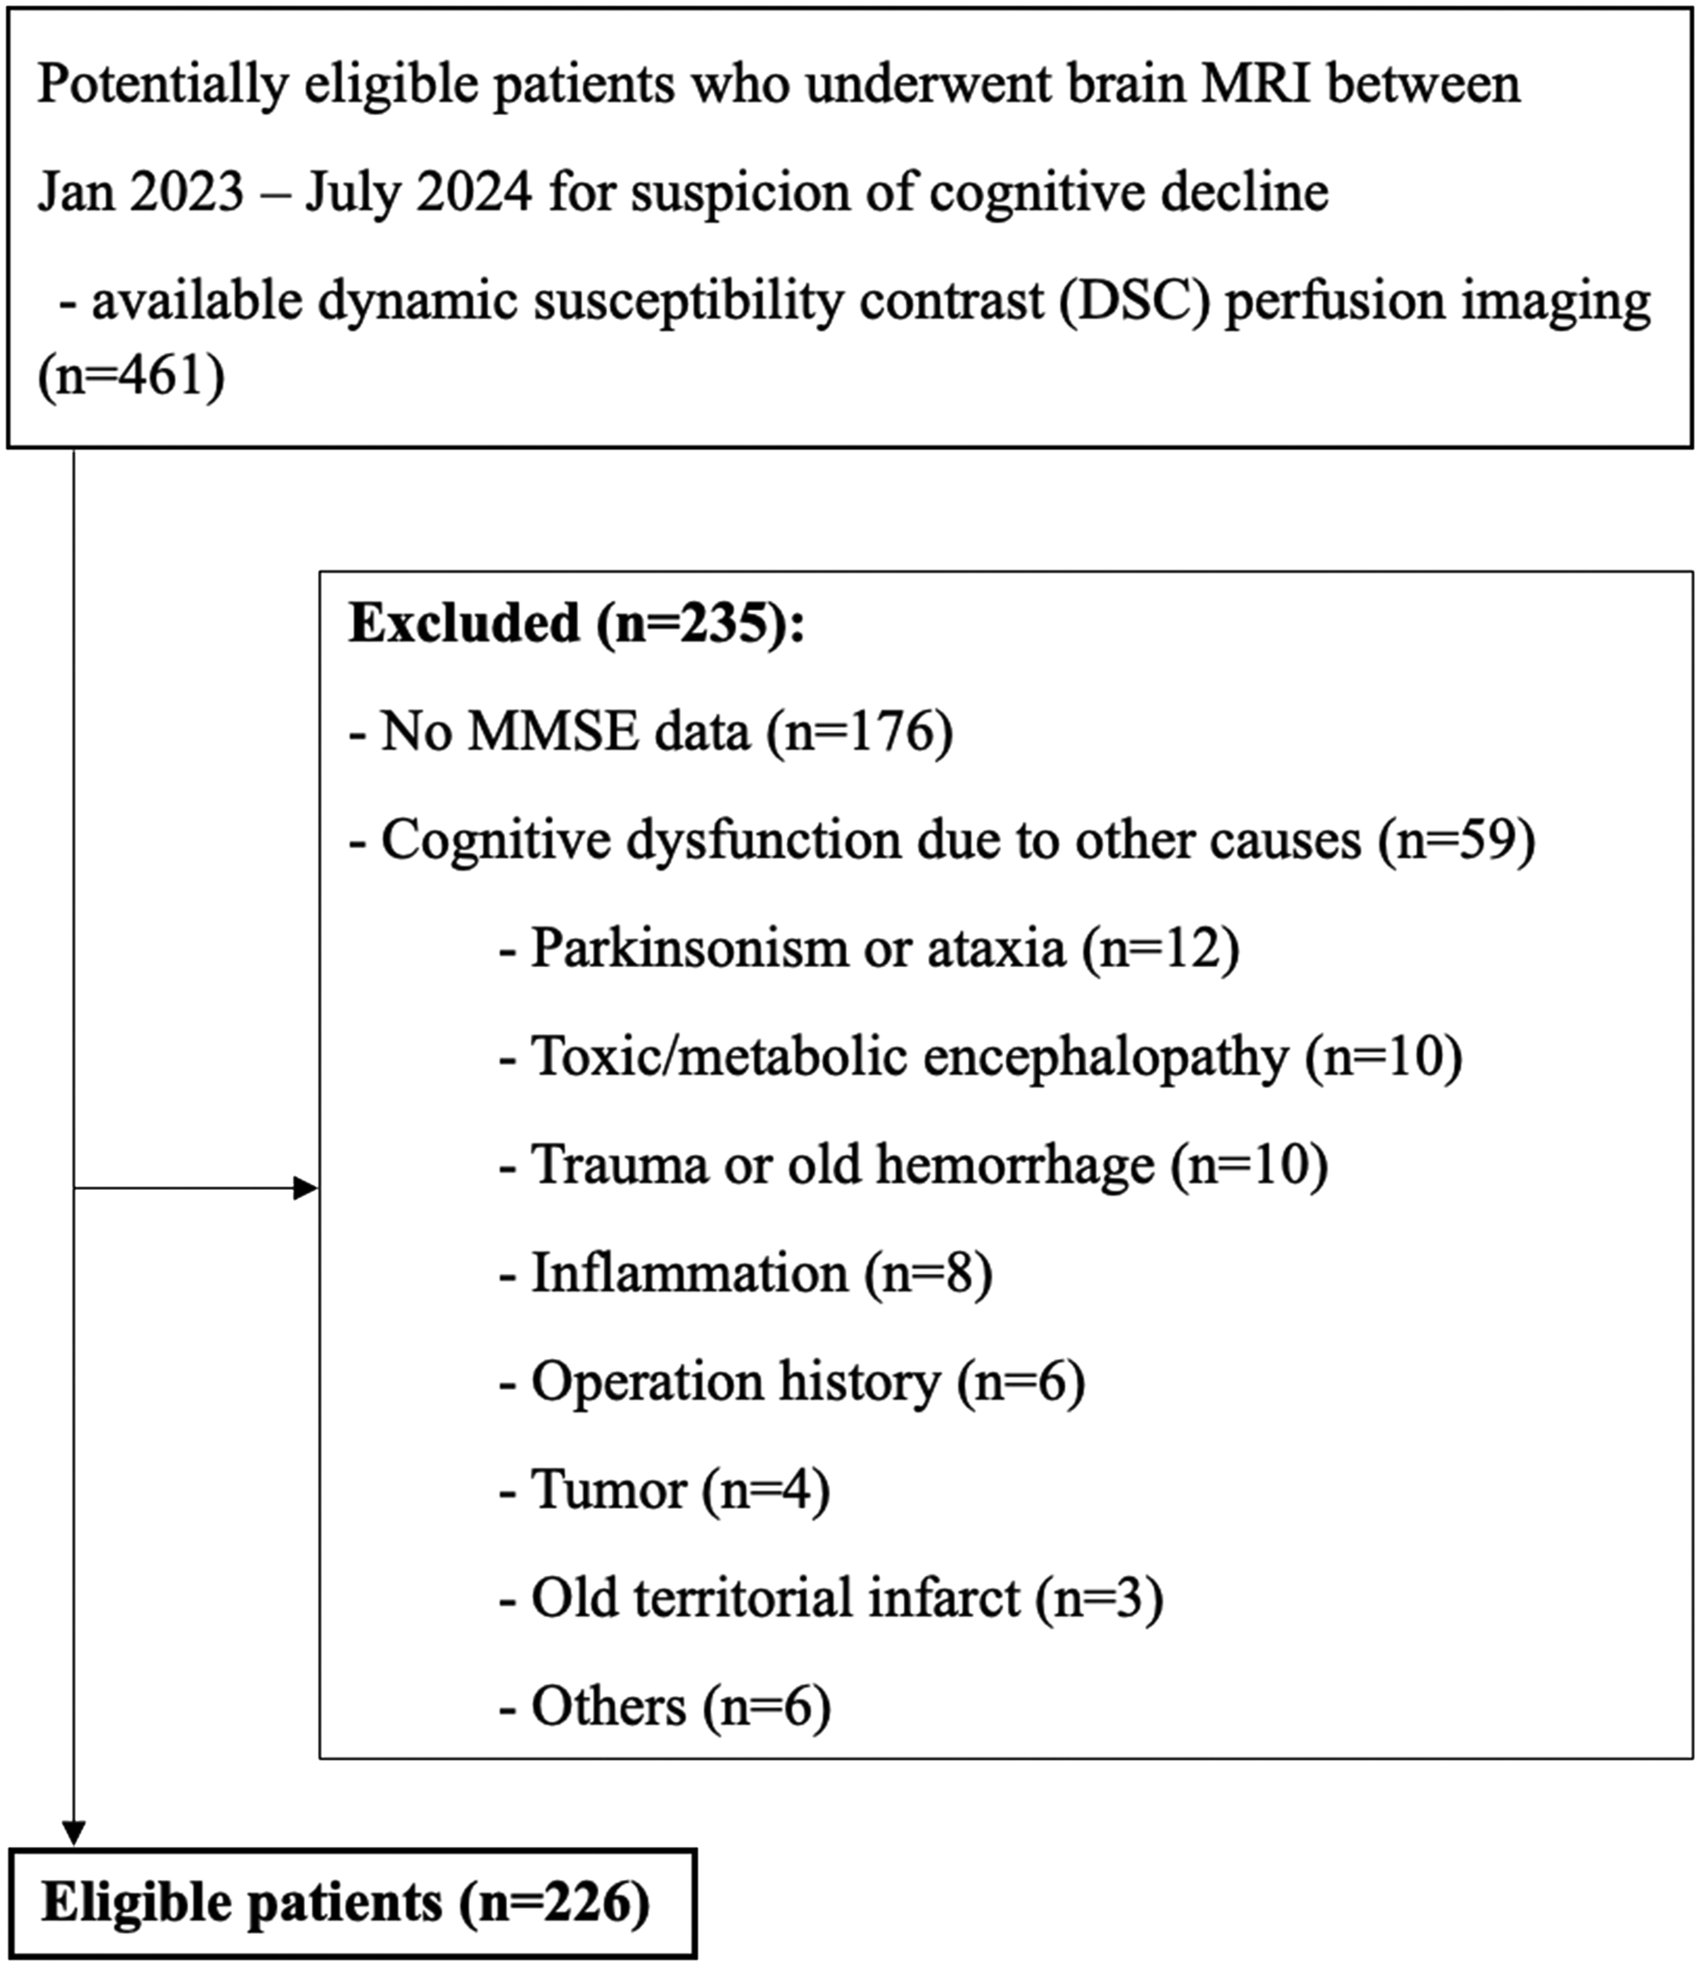
Flow diagram illustrating the selection process of eligible patients.
Table 1 indicates the baseline characteristics of the study population. The mean age was 70.1 ± 10.2 years (61.5% females, 139/235), and the mean MMSE score was 24.7 ± 4.8. With regard to cerebrovascular risk factors, 51.8% of the patients had hypertension, 43.4% had dyslipidemia, and 26.1% had diabetes mellitus. With regard to their history of CVD or minor stroke, 165 patients (73.0%) had no history of infarct, 54 (23.9%) had an old infarct, and 7 (3.1%) had a recent infarct. The diagnoses of the patients included in the study were as follows: mild cognitive impairment [MCI, 101/226 (44.7%)], subjective cognitive impairment [SCI, 42/226 (18.6%)], Alzheimer’s dementia [28/226 (12.4%)], vascular dementia including CADASIL [11/226 (4.9%)], other dementias (mixed, frontotemporal, Lewy body, and other unspecified dementias) [18/226 (8.0%)], and other diagnoses (normal pressure hydrocephalus, recurrent transient global amnesia, and psychogenic cognitive decline) [26/226 (11.5%)].
Baseline characteristics of the study population.
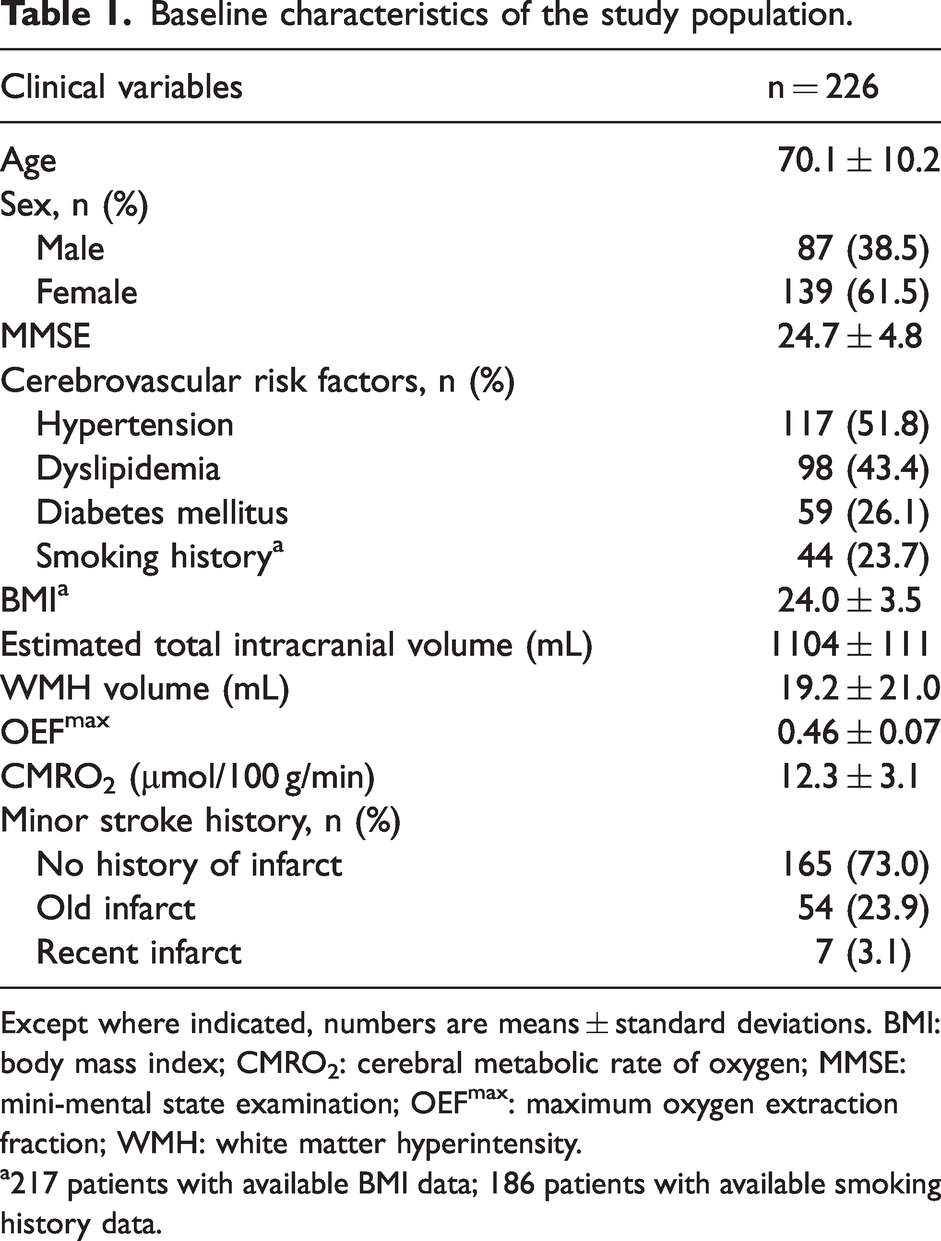
Except where indicated, numbers are means ± standard deviations. BMI: body mass index; CMRO2: cerebral metabolic rate of oxygen; MMSE: mini-mental state examination; OEFmax: maximum oxygen extraction fraction; WMH: white matter hyperintensity.
217 patients with available BMI data; 186 patients with available smoking history data.
MRI acquisition protocol
Brain MRI was performed using 3.0-T MR scanners (Ingenia CX, Philips Healthcare, Best, Netherlands). The following sequences were acquired: Three-dimensional (3D) turbo field echo T1-weighted images, axial T2-weighted images, fluid-attenuated inversion recovery (FLAIR), susceptibility-weighted images (SWI), diffusion-weighted images (DWI), 3D contrast-enhanced T1-weighted images, and DSC perfusion sequences. Detailed acquisition parameters are provided in Supplementary Table S1.
Image post-processing
All imaging data underwent a systematic post-processing pipeline. First, utilizing the FMRIB’s Linear Image Registration Tool (FLIRT) available in the FMRIB Software Library (FSL), the FLAIR and T1-weighted images were co-registered to the DSC maps using a rigid-body transformation with 6 degrees of freedom. Subsequently, skull stripping was performed using FreeSurfer (v.7.1.1, http://surfer.nmr.mgh.harvard.edu). WMHs were automatically segmented using a deep learning-based algorithm (TrUE-Net) (24), which utilizes both T1 and FLAIR sequences. The preprocessing pipeline for WMH segmentation was as follows: 1) reorientation of all images to the standard MNI space (using FLIRT), 2) skull stripping (using the Brain Extraction Tool in FSL), 3) bias field correction (using the FMRIB’s Automated Segmentation Tool in FSL), 4) co-registration of the 3D T1-weighted images to FLAIR images through linear rigid-body registration (using FLIRT), and 4) generation of white matter masks from a combination of dilated and inverted cortical cerebrospinal fluid tissue segmentations along with other deep gray exclusion masks (using the FMRIB’s Automated Segmentation Tool). The resultant WMH volumes were quantified with a voxel size threshold of 0.05 mm³.
The oxygenation parameters (OEFmax and CMRO2) were computed in fully automated fashion using Cercare Medical Neurosuite (Cercare Medical, Aarhus, Denmark, release 2021-03-02-02) post-processing software. The method for calculating OEFmax and CMRO2 in the toolbox were as follows: 1) estimation of the capillary transit time (ms) and tissue oxygen tension (Pt); 2) application of a compartment or first-order exchange model to quantify oxygen extraction for each transit time; 3) summing across the entire capillary network to obtain the global OEFmax; and 4) combining the OEFmax value with the blood flow and arterial oxygen content values to compute CMRO2. Quantitative analyses of OEFmax and CMRO2 were conducted both globally (across the whole brain) and regionally (within the WMH regions), with mean values extracted for statistical evaluation. To optimize precision, WMH masks were overlaid with brain masks generated using FSL tools to exclude potential artifacts.
The post-processing workflow consisted of four stages (Figure 2): (a) multi-sequence co-registration, (b) generation of whole-brain oxygenation parametric maps, (c) automated WMH segmentation, (d) integration of WMH masks with oxygenation maps, and (e) region-specific quantification of OEFmax and CMRO2.
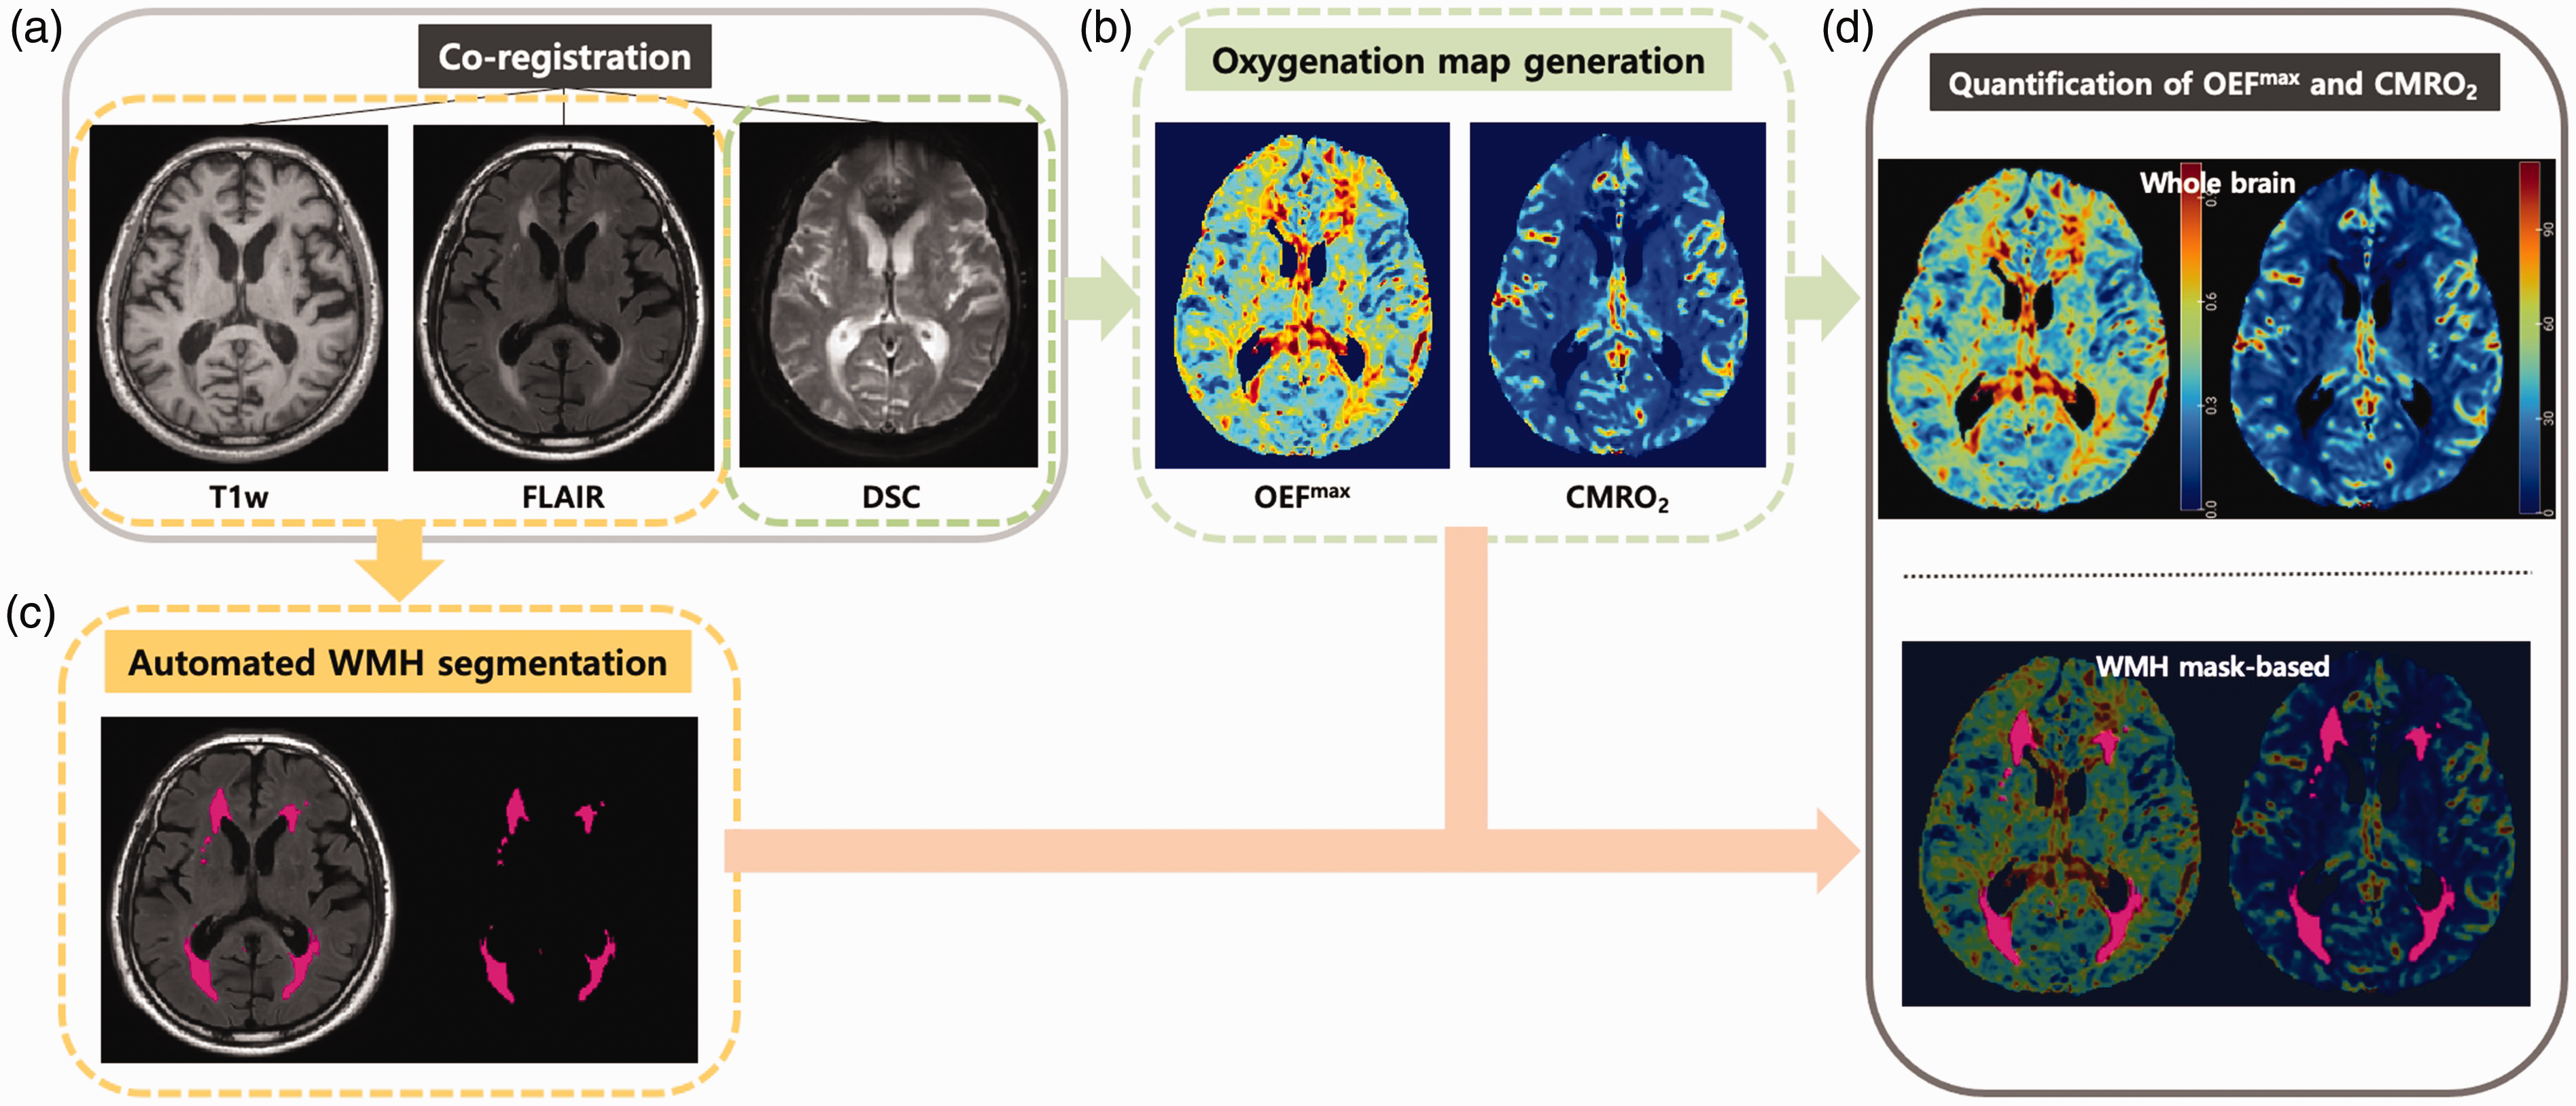
A schematic diagram illustrating the post-processing steps for OEFmax and CMRO2 quantification. (a) T1-weighted image, FLAIR and DSC images were co-registered; (b) OEFmax and CMRO2 maps were generated from processing DSC images; (c) WMHs were automatically segmented using a deep learning-based model (TrUE-Net) and (d) OEFmax and CMRO2 were quantified from whole brain images and WMH segmentations.
Statistical analysis
Continuous variables were reported as means with standard deviations (SD), while categorical variables were summarized as frequencies and percentages. Patients without certain clinical variables were excluded from the respective analyses. No imputation methods were applied. Normality of continuous variables was evaluated using the Shapiro-Wilks test and visually assessed through histograms. Non-normally distributed variables were log-transformed when appropriate. Comparisons of continuous variables, stratified by the presence of cerebrovascular risk factors, were conducted using t-tests or Wilcoxon rank-sum tests. Group-wise comparisons of MRI parameters according to CVD history and diagnoses were performed using the Kruskal-Wallis test with post hoc Dunn’s test. Multivariable linear regression analyses were performed to investigate the relationship between MMSE scores and MRI parameters (WMH volume, OEFmax, CMRO2) after adjusting for sex and age. Results were presented as regression coefficients (β) with corresponding 95% confidence intervals (CI). Statistical significance was set at a P-value of less than 0.05. All statistical analyses were performed using R (version 4.3.0, R Foundation for Statistical Computing, Vienna, Austria).
Results
Relationships between cerebrovascular risk factors and MRI parameters
Table 2 outlines the relationships between cerebrovascular risk factors and the MRI parameters (WMH volume, OEFmax, and CMRO2), with OEFmax and CMRO2 calculated within the WMH regions. Patients with a smoking history had a significantly higher OEFmax (0.48 vs. 0.45, P = 0.02) compared to never-smokers. Older patients (≥65 years) exhibited significantly larger WMH volumes (21.9 vs. 10.5, P < 0.001), higher OEFmax (0.46 vs. 0.43, P < 0.001), and lower CMRO2 (11.96 vs. 13.52, P = 0.001) compared to younger patients (<65 years). No statistically significant differences were observed between patients with and without other risk factors including hypertension, dyslipidemia, diabetes mellitus, or BMI. Figure 3 shows representative images illustrating the differences in values between groups with and without cerebrovascular risk factors.
Comparisons between various cerebrovascular risk factors and WMH volume, OEFmax, and CMRO2.
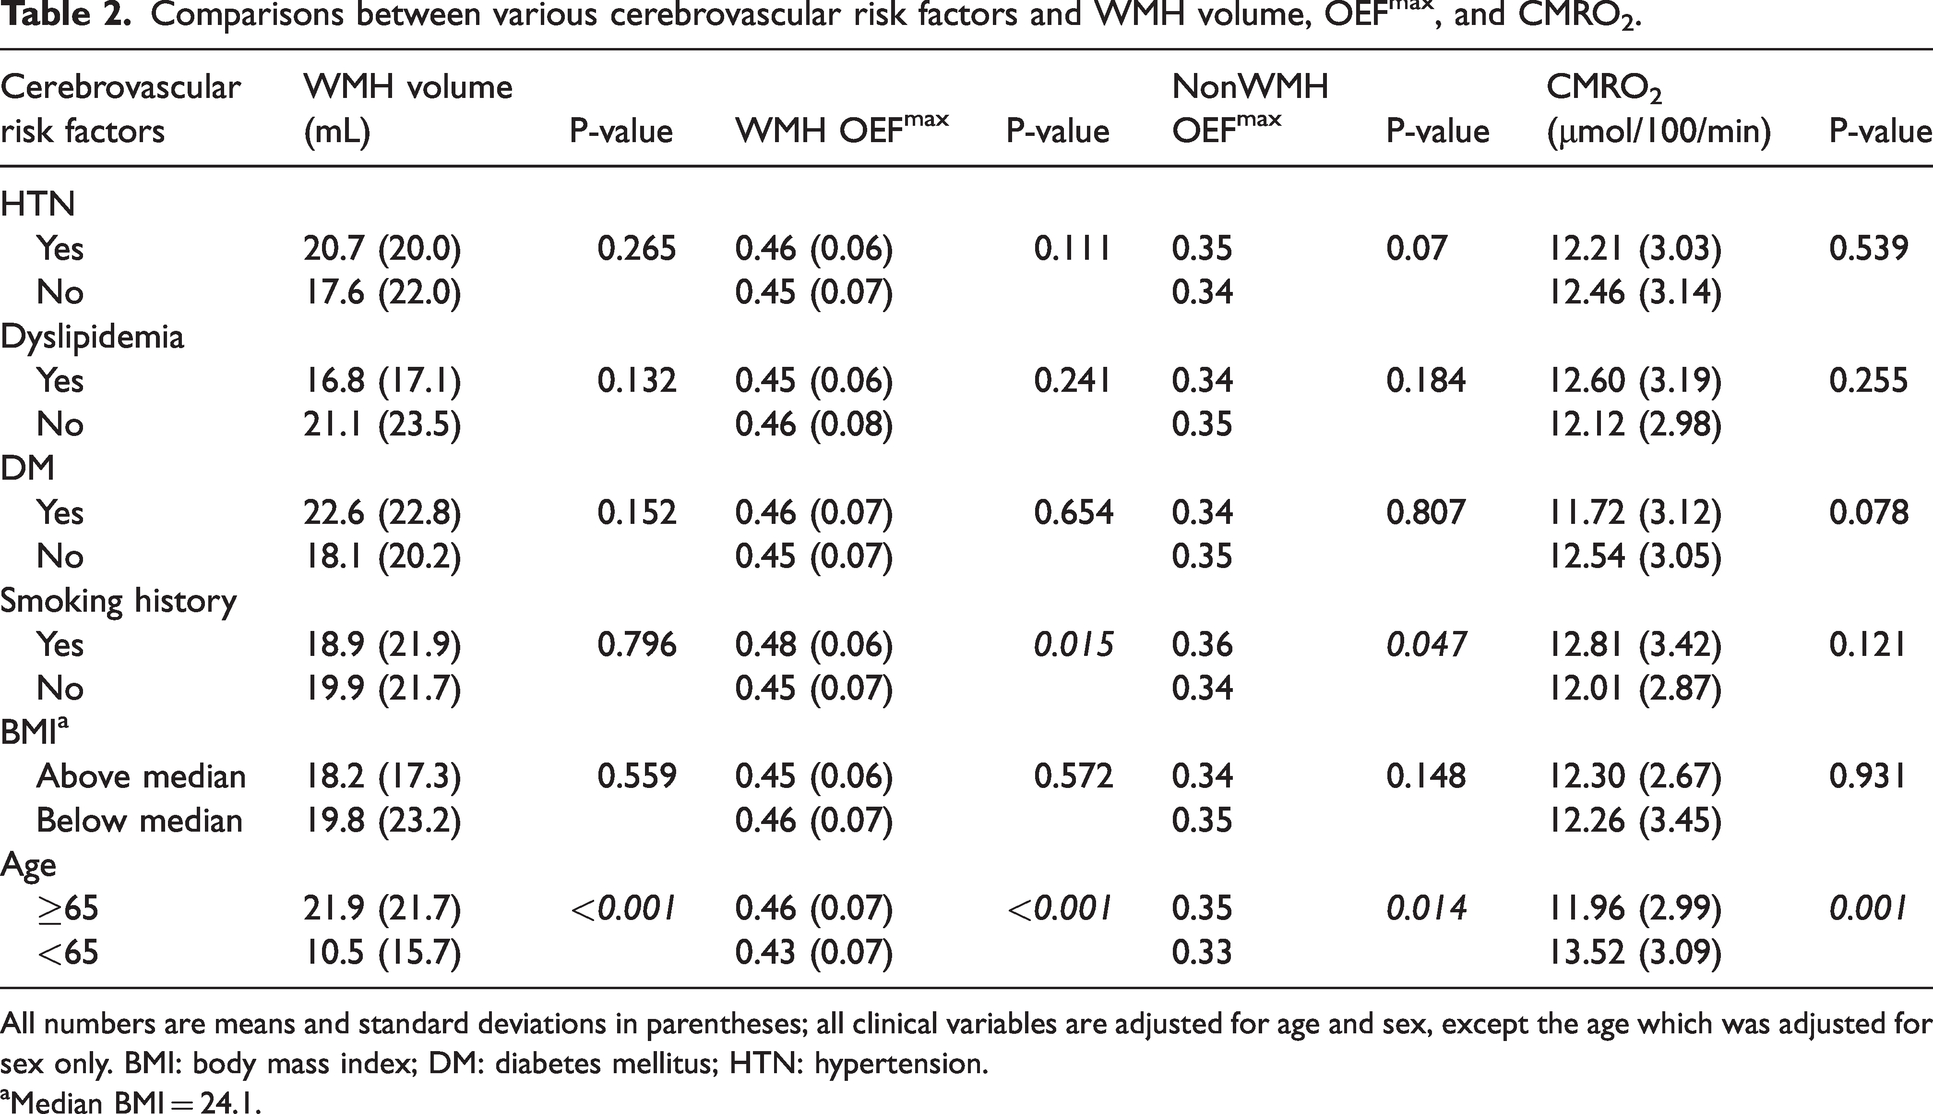
All numbers are means and standard deviations in parentheses; all clinical variables are adjusted for age and sex, except the age which was adjusted for sex only. BMI: body mass index; DM: diabetes mellitus; HTN: hypertension.
Median BMI = 24.1.
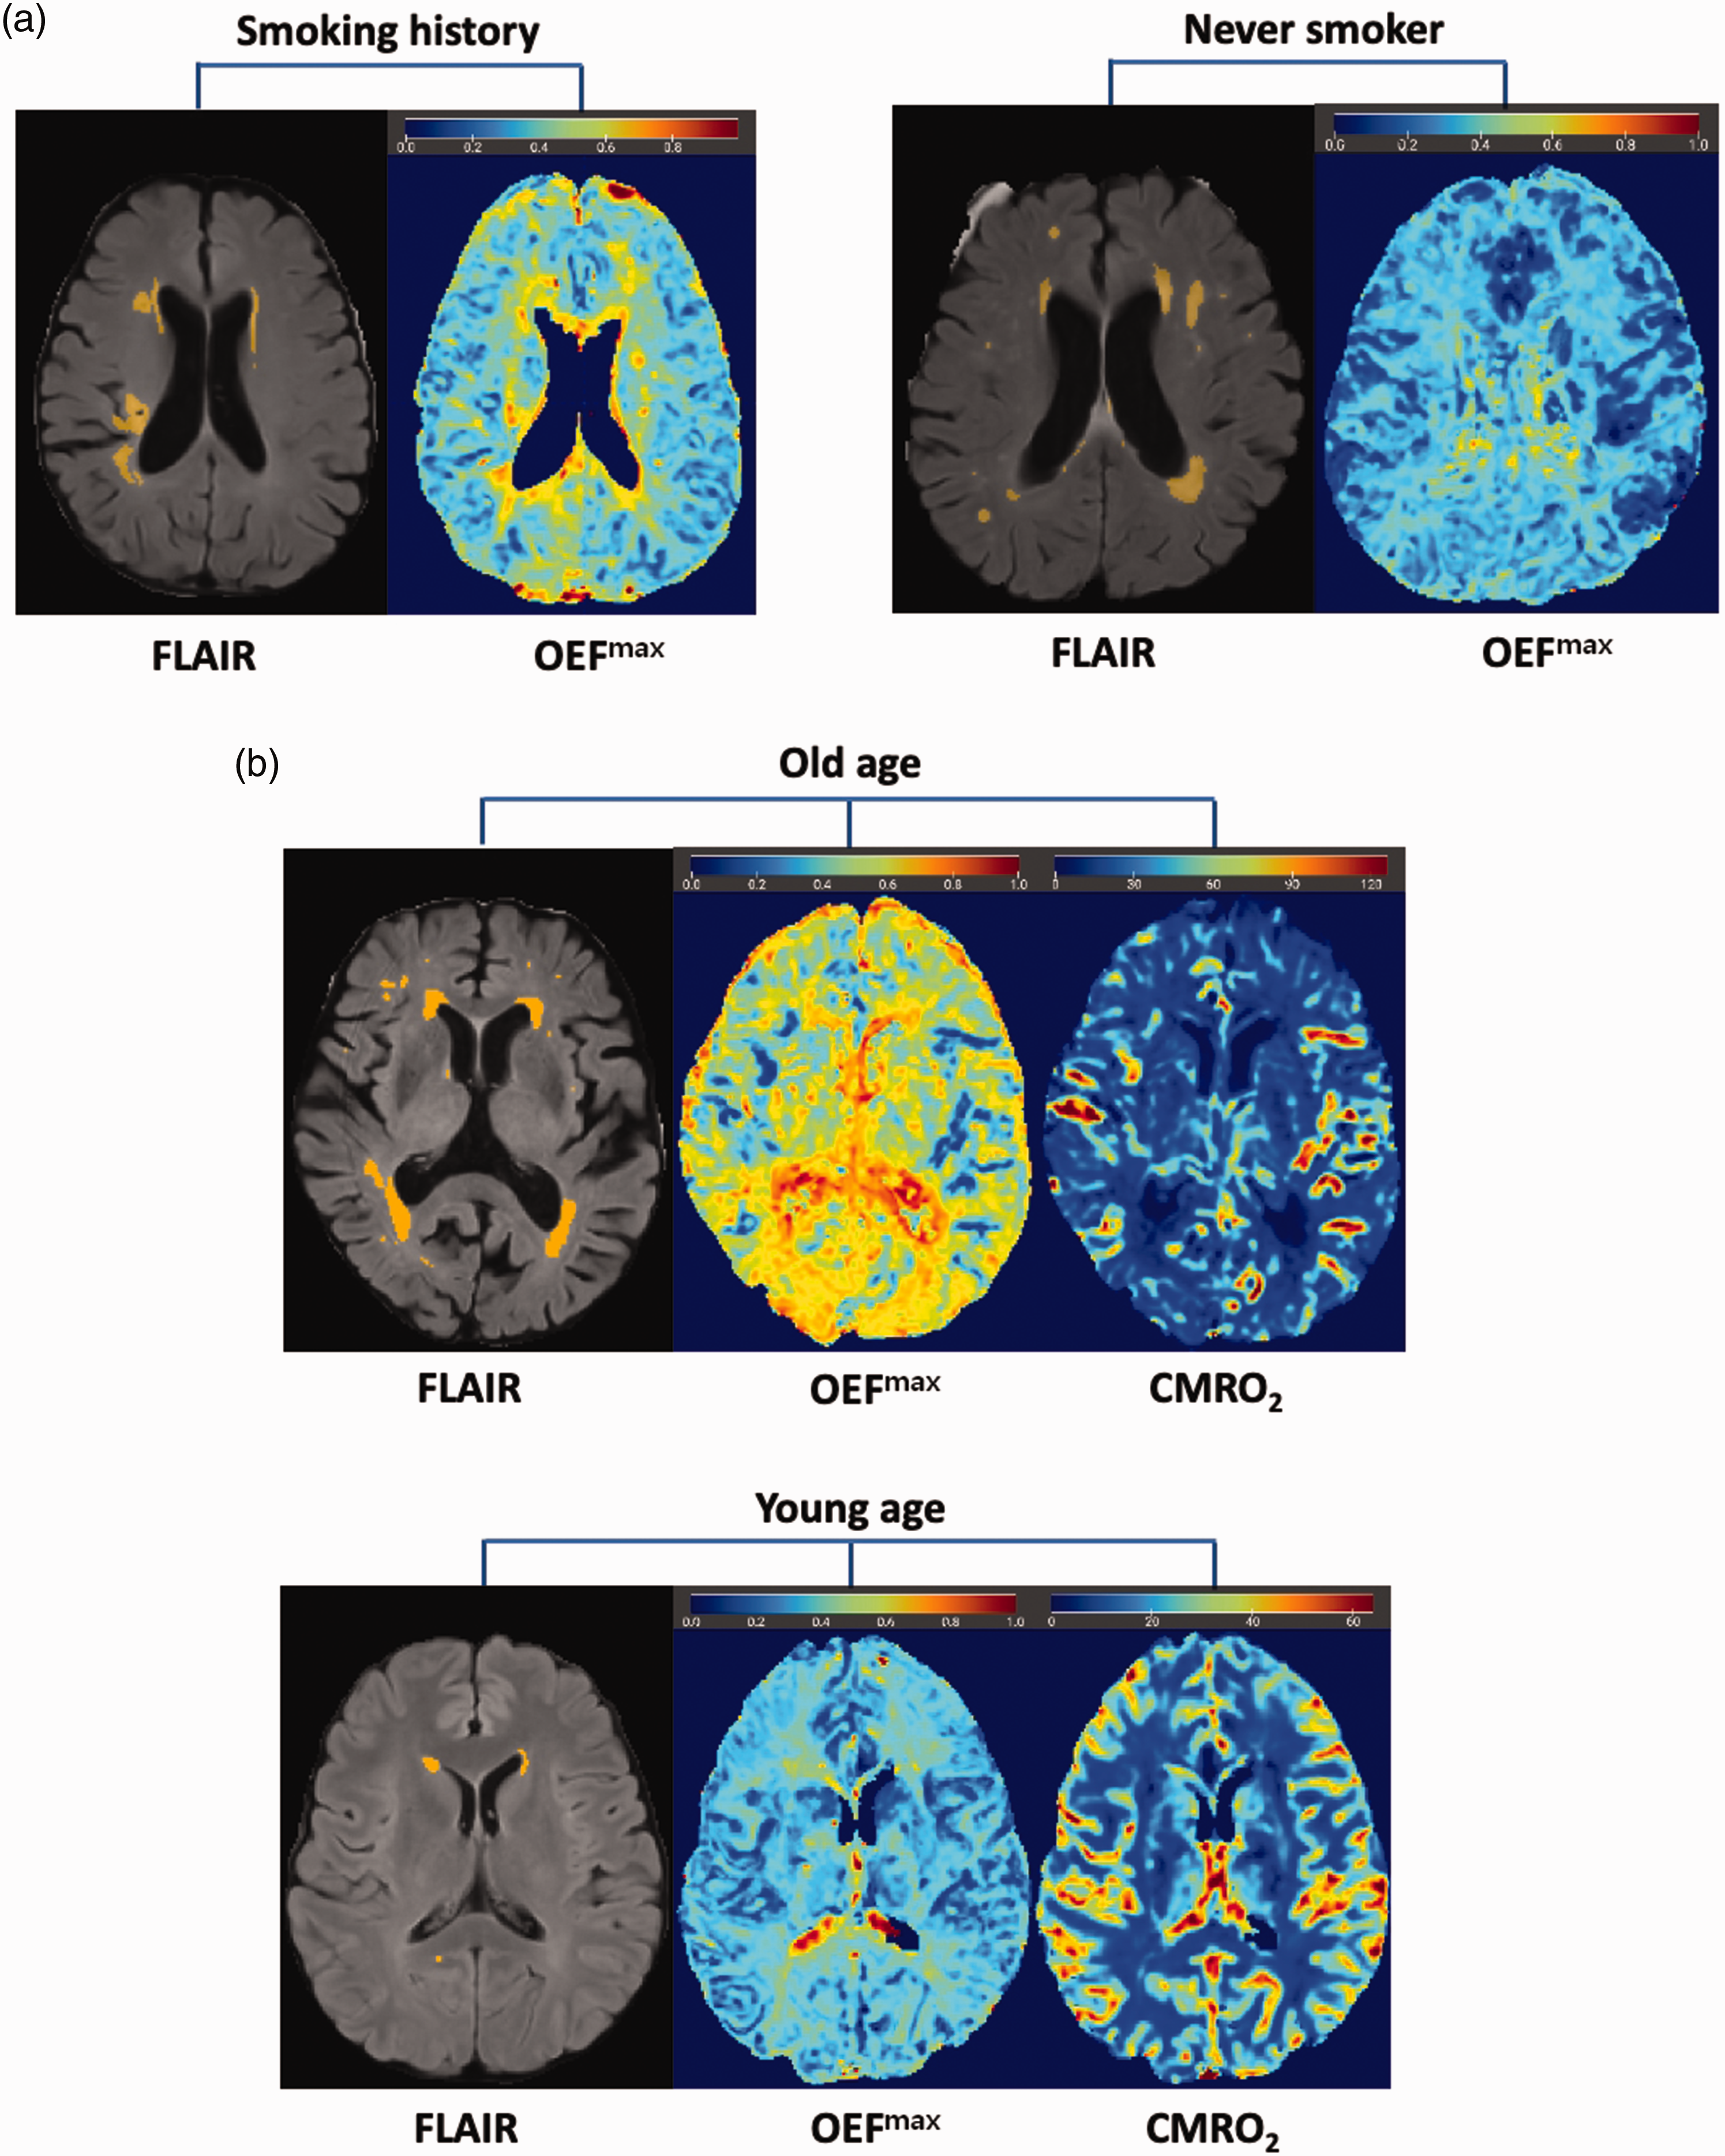
Representative FLAIR images of automatically segmented WMHs with corresponding brain oxygenation maps. (a) A 75-year-old female patient with a smoking history exhibits a similar WMH volume (10.0 mL vs. 10.0 mL) compared to a 73-year-old female patient without a smoking history, but has a higher OEFmax (0.53 vs. 0.35) and (b) An 83-year-old male patient exhibits a larger WMH volume (33.9 mL vs. 2.1 mL), higher OEFmax (0.62 vs. 0.33), and lower CMRO2 (10.1 μmol/100 g/min vs. 14.2 μmol/100 g/min) compared to a much younger 33-year-old female patient. The substantial difference in OEFmax values between the two patients of different age groups (0.62 vs. 0.33) highlights the potential impact of age-related cerebrovascular changes on oxygen demand.
Relationships between history of CVD and MRI parameters
Patients with a history of minor infarct exhibited significantly larger WMH volumes (29.5 vs. 15.4, P < 0.001) and lower CMRO2 values (10.78 vs. 12.90, P < 0.001) compared to those without a history of CVD. Supplementary Table S2 presents group comparisons of OEFmax, CMRO2, and WMH volumes according to CVD history, with OEFmax and CMRO2 values calculated within and outside the WMH area. There were significant group-wise differences in WMH volume (P < 0.001) and CMRO2 (P < 0.001) according to CVD history. A post hoc Dunn’s test revealed significantly larger WMH volumes in patients with old infarcts and patients with recent infarcts compared to those with no history of infarct (P < 0.001 and P = 0.004, respectively). CMRO2 was significantly lower in patients with old infarct compared to those with no history of infarct (P < 0.001) and showed a borderline significant difference between patients with recent infarct and those with no history of infarct (P = 0.05). Figure 4 displays boxplots comparing WMH volume and CMRO2 according to CVD history.
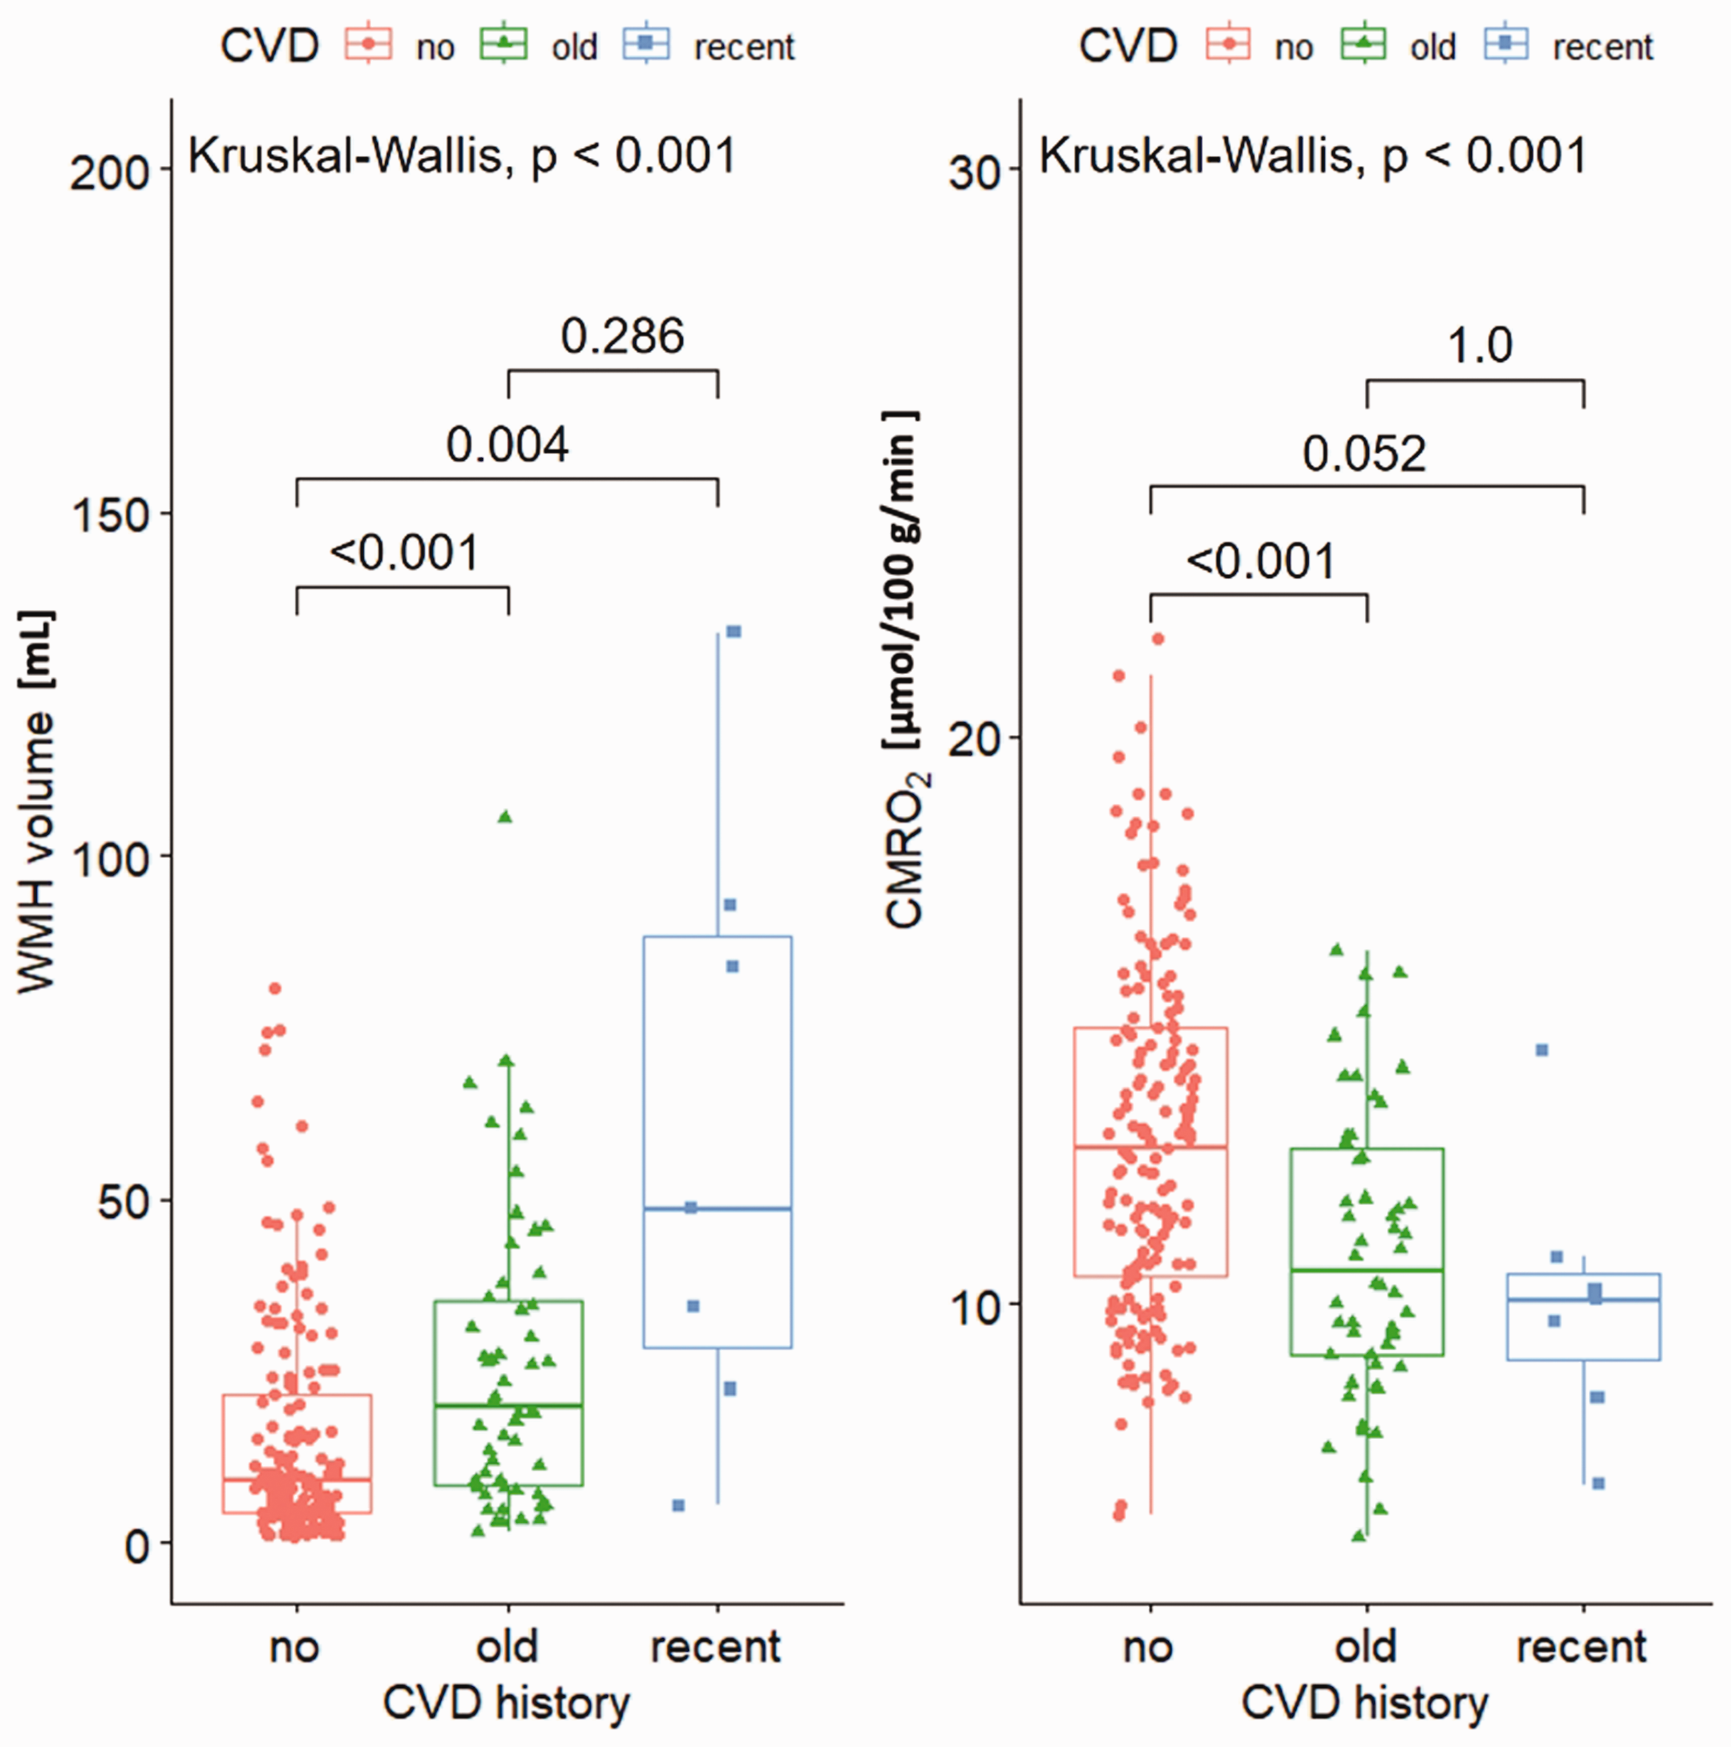
Boxplots of WMH volume and CMRO2 according to history of CVD. P-value was obtained with the Kruskal-Wallis test with a post hoc Dunn procedure to correct for multiple comparisons.
Relationships between MMSE score and MRI parameters
The relationships between MMSE scores and MRI parameters (WMH volume, OEFmax, and CMRO2) are demonstrated in Supplementary Table S3. The whole brain OEFmax and CMRO2 values were calculated. After adjustment for age and sex, multivariable regression analyses revealed statistically significant associations between MMSE scores and OEFmax (P = 0.02) and WMH volume (P = 0.03), while CMRO2 (P = 0.52) did not show a significant association.
Comparison of oxygen parametric maps according to diagnoses
Supplementary Table S4 displays group comparisons of OEFmax and CMRO2 based on diagnoses, with OEFmax and CMRO2 values calculated within and outside the WMH area. There were significant differences in WMH volume (P < 0.001) and CMRO2 (P = 0.001) according to types of dementia diagnoses. A post hoc Dunn’s test revealed significantly larger WMH volumes in patients with vascular dementia compared to those with SCI (P < 0.001), MCI (P < 0.001), or Alzheimer’s dementia (P = 0.001), and lower CMRO2 in patients with vascular dementia compared to those with SCI (P = 0.001), MCI (P = 0.001), or Alzheimer’s dementia (P = 0.048) (Figure 5). No significant differences in OEFmax were found among the diagnoses (P = 0.64).
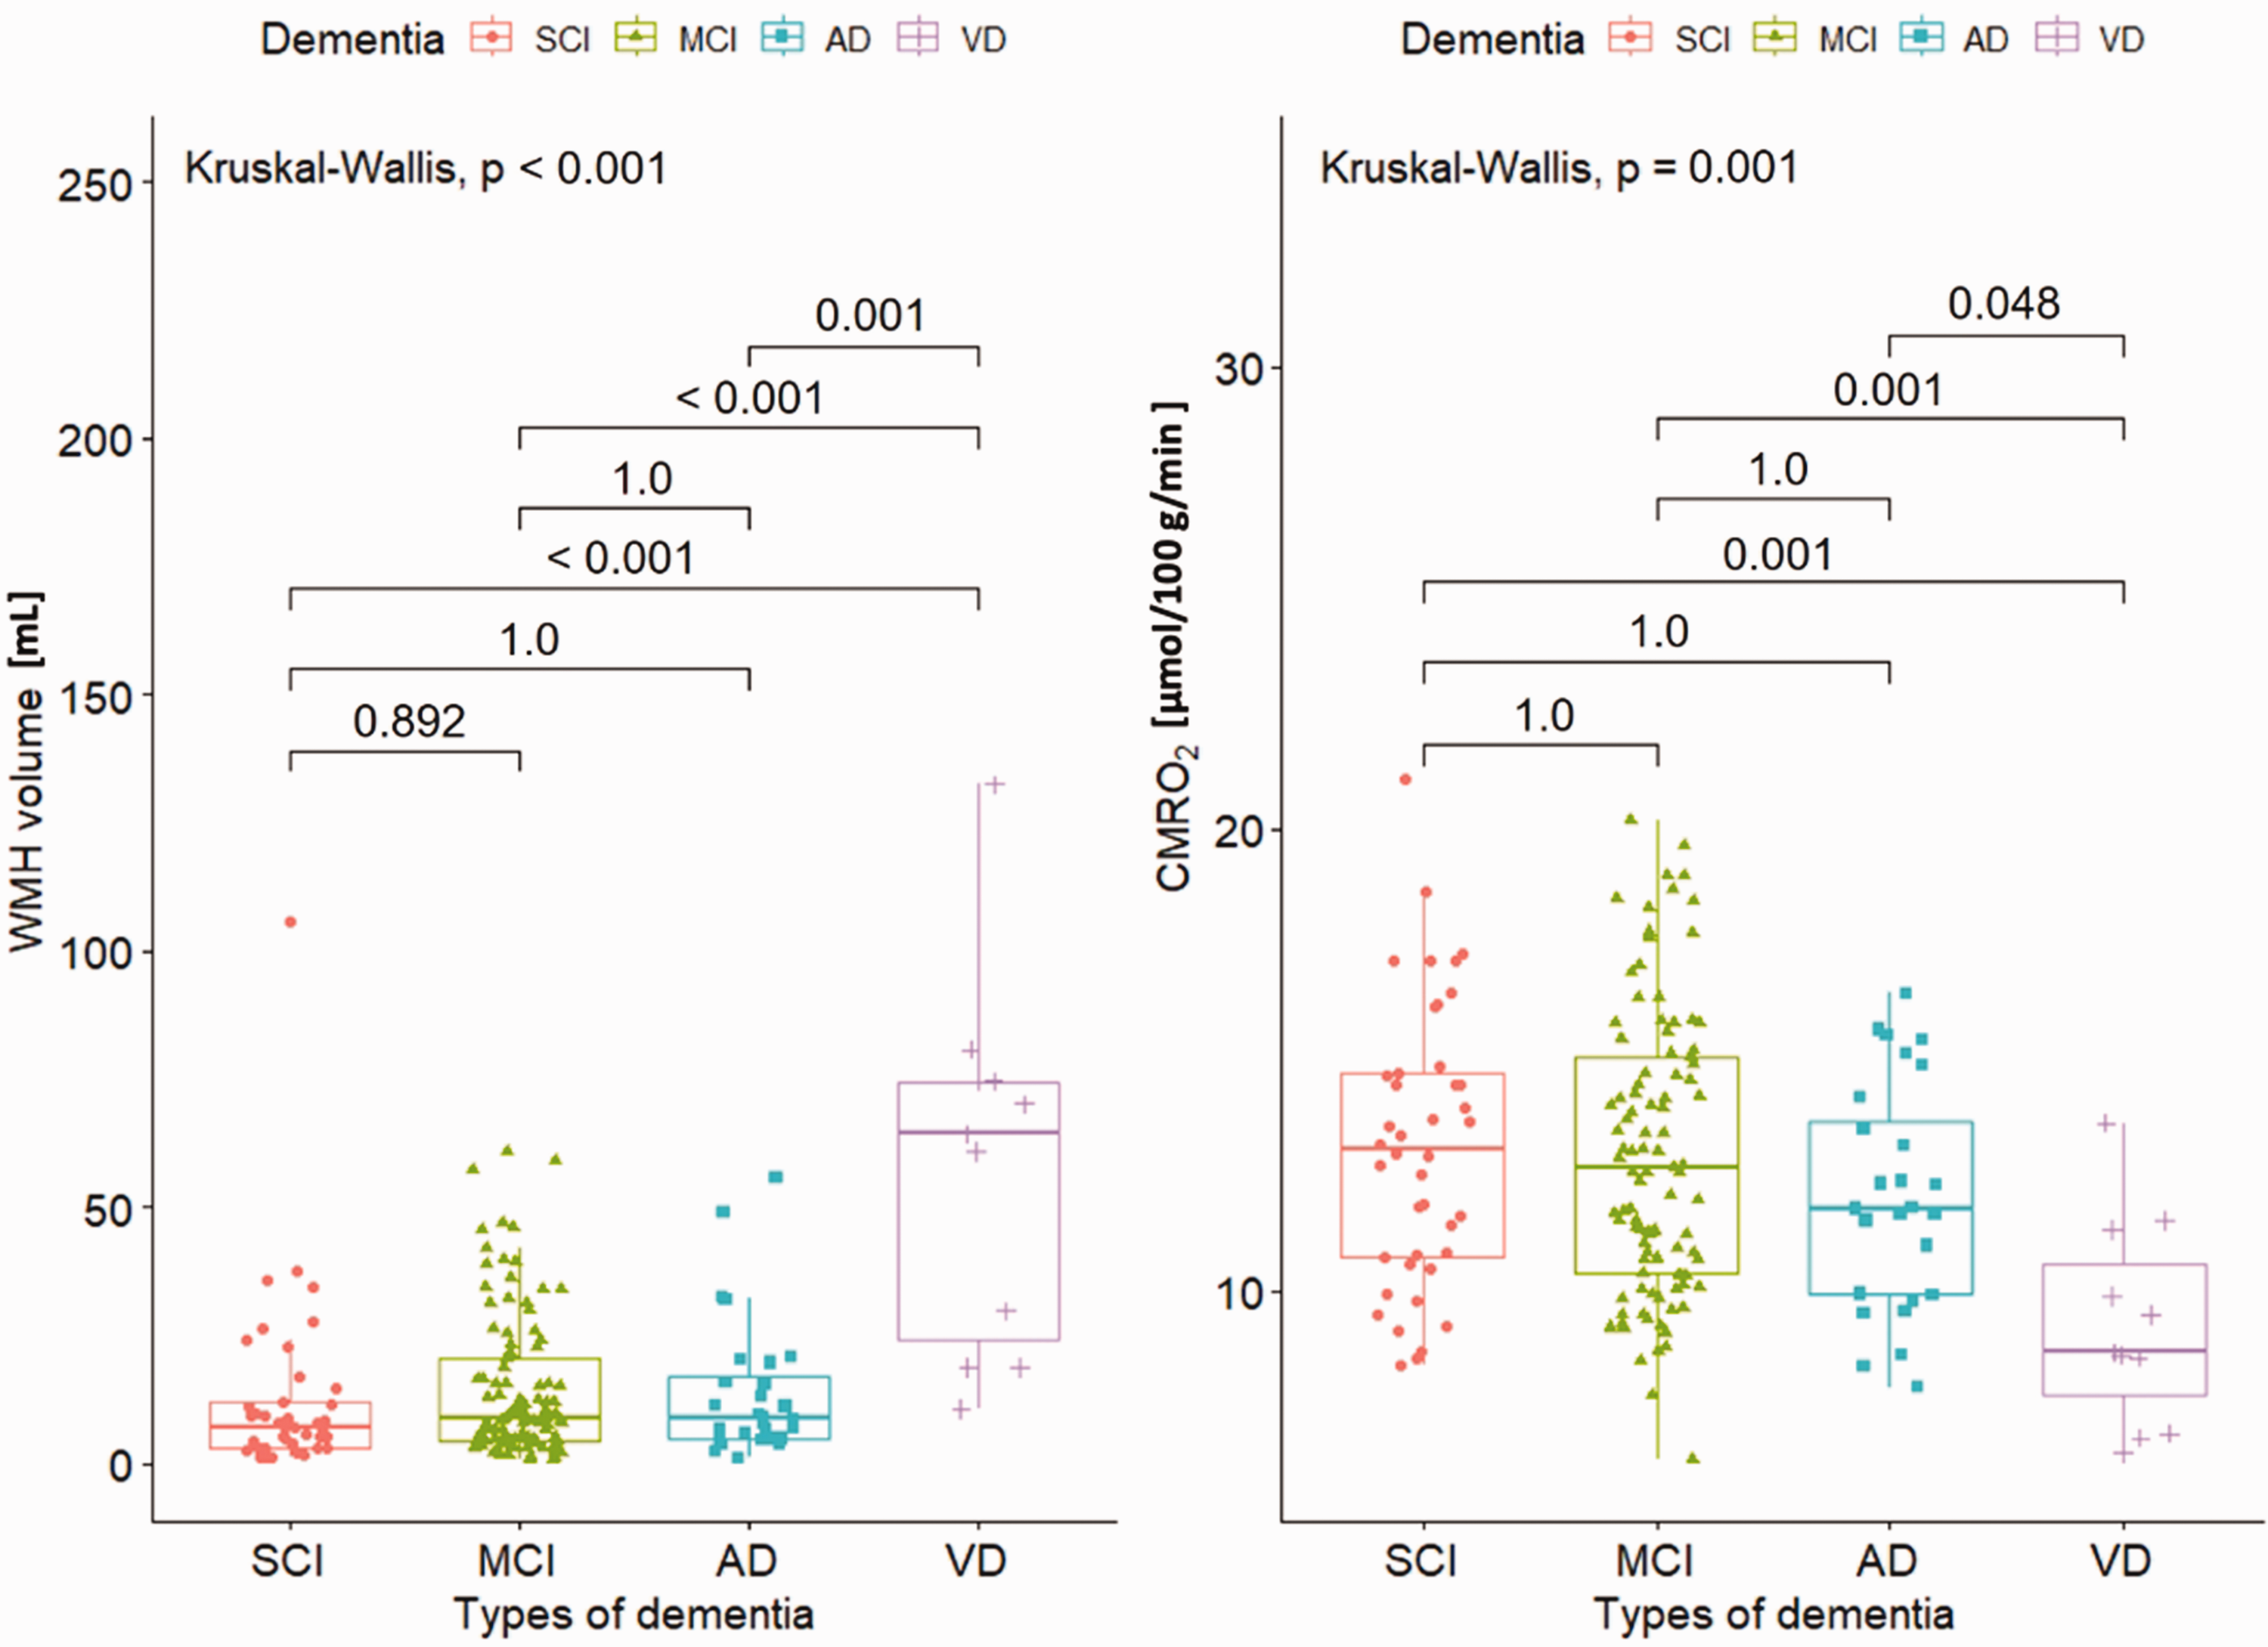
Boxplots of WMH volume and CMRO2 according to types of dementia diagnoses. P-value was obtained with the Kruskal-Wallis test with a post hoc Dunn procedure to correct for multiple comparisons. AD: Alzheimer’s dementia, MCI: mild cognitive impairment, SCI: subjective cognitive impairment, VD: vascular dementia.
Discussion
In this study, we investigated the potential of DSC-derived oxygen parametric maps—OEFmax and CMRO2— in patients with various causes of cognitive impairments and found that patients with a smoking history had significantly higher OEFmax than their counterparts. Furthermore, in patients with vascular dementia, WMH volume was significantly larger and CMRO2 significantly lower than in those with other cognitive decline, including SCI, MCI, and Alzheimer’s dementia. Lastly, multivariable linear regression analysis revealed that cognitive function is negatively associated with WMH volume and OEFmax. These observations support the hypothesis that cerebrovascular changes are closely linked to cognitive impairment in aging populations and emphasize the utility of advanced MRI markers in elucidating these mechanisms.
The observed relationships align with current knowledge about the pathophysiology of small vessel disease. In the Rotterdam Scan Study, predictors of WMH progression included the baseline leukoaraiosis severity, age, blood pressure, current smoking, and presence of lacunes. 5 In this study, older patients demonstrated larger WMH volume, higher OEFmax, and lower CMRO2. The finding of lower CMRO2 contrasts with Catchlove et al., who reported no difference in CMRO2 across age groups in healthy participants. 15 This discrepancy may be explained by our study population, consisting of patients with cognitive impairment, rather than a healthy cohort. In contrast, the observed increase in OEFmax with age (0.43 in younger vs. 0.46 in older adults) is consistent with previous studies, which have reported OEF increases of approximately 2–4 percentage points over comparable age ranges.16–19 Prior work has also noted greater intersubject variability in oxygenation with aging, 19 which may explain the more pronounced differences seen in individual cases, such as the example shown in Figure 3. For other cerebrovascular risk factors, no significant differences were observed in WMH volume, OEFmax, or CMRO2, except for smoking history. This suggests that brain oxygenation involves a complex interplay of processes beyond traditional cerebrovascular risks.
The comparison based on CVD history revealed a predictable difference in WMH volume and a significant difference in CMRO2 between those without a history of infarcts and those with old infarcts. CMRO2 was also significantly lower in patients with vascular dementia compared to those with other dementias. Given that small vessel disease and cerebral infarction are primary causes of vascular dementia, the reduced CMRO2—associated with irreversible ischemic brain damage—is linked to both vascular dementia and a history of infarction.20,21 Since WMHs may represent the extreme end of white matter injury, 22 CMRO2 may reflect subtler changes related to brain hypoxia. However, no significant group differences in OEFmax values were observed, suggesting that further investigation is needed to explore the potential underlying factors.
Significant differences in the WMH volume and CMRO2 were observed between Alzheimer’s disease and vascular dementia. Recent studies have highlighted that vascular factors contribute to Alzheimer’s disease alongside amyloid pathology.1,23 Although Alzheimer’s disease and vascular dementia increasingly show overlapping features, our findings suggest that they can be driven by distinct etiologies. Specifically, Alzheimer’s disease is associated with neurodegenerative pathological changes promoted by the accumulation of amyloid-β and tau proteins, 24 whereas vascular dementia is primarily attributed to cerebrovascular damage resulting from cerebral large vessel strokes, steno-occlusion of small vessels leading to subcortical ischemia, or multiple infarcts affecting various cortical arteries. 25
MMSE scores demonstrated a negative correlation with WMH volume and whole-brain OEFmax in the multivariable linear regression analysis, consistent with prior studies that have documented associations between WMHs and cognitive function.8,26,27 In contrast to the lack of significant association observed with CMRO2, the significant correlation between MMSE and OEFmax suggests that brain oxygenation is linked to cognitive function, albeit through a complex and multifaceted mechanism. One possible explanation for the lack of association between CMRO2 and cognitive function could lie in the compensatory flow changes that occur as part of autoregulation during the process of cerebral perfusion alteration. In this context, OEFmax may increase while CMRO2 remains preserved.28–30 Considering that cognitive function reflects the global functionality of the brain rather than that of a focal domain, it can be hypothesized that cognitive decline manifests as a symptom during the autoregulatory process aimed at maintaining oxygen delivery in the face of ischemic stress.
There are a few limitations in this study in addition to the retrospective design. Firstly, cognitive function was evaluated solely using MMSE scores, which provide a general assessment but do not reflect specific cerebral domains of impaired cognitive function. Furthermore, the cerebral oxygenation maps were not segmented into specific cerebral regions. The segmentation of WMHs was performed automatically using a deep-learning-based algorithm (TrUE-Net). While this method allows for efficient and standardized WMH quantification, the algorithm’s accuracy is not perfect and may introduce variability, particularly in patients with small WMH volumes where OEFmax and CMRO2 were calculated. Additionally, this study was conducted in a single center with a relatively specific population, predominantly elderly individuals presenting with cognitive concerns. Within this specific population, only seven patients had recent infarcts, limiting further detailed analysis on patients with various types of infarcts. These factors may limit the generalizability of the findings to broader populations, particularly those with different demographic or clinical characteristics. Finally, because independent measurements of cerebral blood flow effects were not included in the study, further investigations with a focus on cerebral perfusion are warranted.
In conclusion, this study demonstrates significant associations between cerebrovascular risk factors, MRI-derived oxygen metrics, and cognitive impairment. Specifically, WMH volume and OEFmax negatively correlated with cognitive performance, while CMRO2 was lower in patients with vascular dementia and those with a history of infarcts, indicating its potential as a marker of vascular brain damage. These findings align with existing small vessel disease research and highlight the need for further exploration of how these MRI-derived metrics reflect underlying pathophysiological processes.
Supplemental Material
sj-pdf-1-jcb-10.1177_0271678X251355742 - Supplemental material for Relationship between cerebrovascular risk factors and oxygen metabolic stress in a cognitively impaired population: Dynamic susceptibility contrast-derived oxygen parametric analysis
Supplemental material, sj-pdf-1-jcb-10.1177_0271678X251355742 for Relationship between cerebrovascular risk factors and oxygen metabolic stress in a cognitively impaired population: Dynamic susceptibility contrast-derived oxygen parametric analysis by Dongjun Lee, Yangsean Choi, Eunseon Jeong, Ji Eun Park and Ho-Sung Kim in Journal of Cerebral Blood Flow & Metabolism
Footnotes
Funding
This study was supported by a grant (2025IE0005-1) from the Asan Institute for Life Sciences, Asan Medical Center, Seoul, Korea.
Declaration of conflicting interests
The author(s) declared no potential conflicts of interest with respect to the research, authorship, and/or publication of this article. There was no conflict of interest with Cercare.
Authors’ contributions
Yangsean Choi contributed to the study conception and design. Material preparation, data collection and analysis were performed by Eunseon Jeong, Dongjun Lee and Yangsean Choi. The first draft of the manuscript was written by Dongjun Lee and Yangsean Choi. All authors commented on previous versions of the manuscript. Ji Eun Park and Ho-Sung Kim reviewed the final manuscript. All authors read and approved the final manuscript.
Supplementary material
Supplemental material for this article is available online.
References
Supplementary Material
Please find the following supplemental material available below.
For Open Access articles published under a Creative Commons License, all supplemental material carries the same license as the article it is associated with.
For non-Open Access articles published, all supplemental material carries a non-exclusive license, and permission requests for re-use of supplemental material or any part of supplemental material shall be sent directly to the copyright owner as specified in the copyright notice associated with the article.