
Abstract
Two distinct types of scars are formed in the brain after ischemic stroke: glial scar and fibrotic scar. Dynamic collagen expression has been well-studied in peripheral tissue wound healing. However, it is less understood in the post-ischemic brain. This study investigated the spatiotemporal dynamics of type III collagen (Col III) in the lesion core of mouse photothrombotic stroke model. First, RNA-seq analysis was performed to examine the transcriptional profiling of the lesion core at 14 days post-injury (dpi). Collagen 3a1, encoding Col III, was one of the most induced genes. Gene ontology (GO) enrichment analysis revealed that inflammatory responses are primarily activated, as well as phagosome, extracellular matrix (ECM) organization, and vasculature development pathways. In the subacute stage (at 3–14 dpi), Col III immunoreactivity was higher than Col I, which surrounded the penetrating vasculatures from the meninges. Late (14–28 dpi), the fibrillar mesh of Col III was prominent in which Iba1-positive phagocytes stored lipid droplets (LDs). In vivo injection of collagen synthesis inhibitor reduced penetrating vasculatures, decreased LD accumulation, and increased the infarcted area. Collectively, these results suggest that Col III is dynamically expressed in the lesion core during fibrotic scar formation colocalizing with angiogenesis and LDs.
Introduction
Two distinct types of scars are formed in the brain after ischemic stroke: glial scar and fibrotic scar. Glial scar is formed primarily by reactive hypertrophic astrocytes that rapidly surround the infarct lesion. In contrast, fibrotic scar is formed in the lesion core surrounded by reactive glial scar.1–5
Following ischemic stroke, massive neuronal death occurs and cellular debris accumulates. Ischemic insult then triggers a coordinated multicellular neuroinflammatory response in the central nervous system (CNS). Resident cells and cytokine response are activated by damage-associated molecular patterns (DAMPs), a component of innate immune response released from infarcted regions. Circulating immune cells infiltrate to the infarcted lesion through the disrupted blood-brain barrier (BBB). In rodents, glial scarring surrounds the lesion by 2–3 weeks after injury, separating the injured area from the non-injured tissue.3,5–7 Before the astrocytic barrier is formed, activated microglial cells proliferate in the perilesional regions and accumulate in the lesion core during the first week after injury in the mouse stroke model.8,9 The lesion core then contains a mixture of infiltrating cells, including neutrophils, microglia, monocytes/macrophages, pericytes, and fibroblasts/fibroblast-like cells that induce profibrotic proteins such as TGF-β, matrix metalloproteinases (MMPs), and extracellular matrix (ECM).3–5 Due to the difficulty of differentiation, the origin of the accumulated phagocytes in pathological conditions remains controversial. Previous studies with the mouse stroke model showed that activated resident microglia predominate during the first few days with a gradual increase in invading monocytes/macrophages peaking at 1 week after stroke.8,10–12 The role of phagocytes in ischemic stroke is a double-edged sword, both beneficial and detrimental. Immature monocytes infiltrated the infarct border zone in a CCR2-dependent pathway, exacerbated brain damage, and subsequently differentiated into M2-like macrophages to resolve inflammation.13–15 M2-like microglia harbor the ability of phagocytosis to clear neuronal debris, reducing brain damage after stroke.12,16
Fibrosis is defined as the pathological deposition of collagen-rich ECM and is a common response to injuries. Inflammation is a major driving force for fibrosis. In CNS injury, fibrous scarring inhibits axonal regeneration, leading to permanent functional impairment. On the other hand, the absence of a fibrotic scar inhibits closure of the spinal transection site, suggesting a double-edged sword role in repair and regeneration.1,2,17 Although the residential CNS fibroblasts can infiltrate lesion sites, previous studies have shown that the primary source of scar-forming fibroblasts is a discrete subset of Platelet-derived growth factor β (PDGFRβ)-positive pericytes in CNS injury. Furthermore, PDGFRβ-positive fibroblast-like cells form a dense network and occupy the ischemic lesion core in the mouse stroke model.1,3,6,7,18,19 There is also evidence to suggest that fibroblast-like cells migrate from adjacent meninges into injury sites in a rodent spinal cord contusion model. 19
Collagen is a major structural ECM component and is deposited in the lesion site of ischemic stroke.3,4,19 In general, type I collagen (Col I) is a prevalent form and accounts for about 80% of the total. Col I is stiff fibrillar protein, whereas type III collagen (Col III) constitutes an elastic reticular network in hollow organs (e.g., large blood vessels). Type IV collagen (Col IV) constitutes the basement membrane (BM) and is essential for vascular stability.20,21 It is not fully understood which types of stromal cells produce collagen in the lesion core in the post-stroke brain. As mentioned above, fibroblast-like cells derived from PDGFRβ-positive pericytes3,7 as well as residential CNS fibroblasts infiltrating into lesion sites 19 can deposit fibrotic ECM in the ischemic brain.
The interaction of collagen with various cells plays an important role in biological processes, including proliferation, differentiation and migration. Collagen receptors are classified into integrins (e.g., α1β1, α2β1, α10β1, α11β1) and non-integrin transmembrane receptors (e.g., DDR, glycoprotein VI (GPVI), LAIR-1). 22 The major collagen-binding integrin are the α1β1 and α2β1 integrins. 23 α1β1 integrins are present in fibroblasts and mesenchyme, while α2β1 integrins are present in platelets, epithelium, fibroblasts, and mesenchyme. The fibrous isoforms of collagen I-III, V, and XI can preferentially interact with α2β1 integrin, which plays an important role in cell adhesion, migration, and signal transduction. 22 Furthermore, the collagen network is a metabolically active structure associated with collagen turnover. The alteration in Col I and Col III levels is characteristic in remodeling and wound healing of peripheral tissues. Col III increases in the early stages of healing, while Col I increases in the healed wound. 23 However, the expression pattern and role of Col III is poorly understood in the lesion core of post-ischemic brain.
In this study, we investigated the spatiotemporal dynamics of Col III in the lesion core using a photothrombotic mouse stroke model. RNA-seq analysis showed that collagen 3a1, encoding Col III, was one of the most induced genes in the lesion core. Since Gene Ontology (GO) enrichment analysis showed the activation of phagosome, ECM organization, and vasculature development in the lesion core, we hypothesized that Col III is associated with angiogenesis and debris phagocytosis during fibrotic scar formation. Ischemic debris contains lipid-rich “myelin debris” that is phagocytosed and processed as cytosolic lipid droplets (LDs) by microglia/macrophages. 12 We then examined the spatiotemporal dynamics of Col III in the lesion core, focusing on angiogenesis and phagocytosed myelin debris (LDs) by immunohistochemistry and in vivo experiments.
Material and methods
Mouse photothrombotic stroke model and in vivo injection to the lesion core
Experiments with animals were approved by the Institutional Animal Care and Use Committee at Chiba University (Approval number A-38). All experiments were conducted in accordance with the Guidelines for Proper Conduct of Animal Experiments by the Science Council of Japan (June 1, 2006) (https://www.scj.go.jp/ja/info/kohyo/pdf/kohyo-20-k16-2e.pdf). All experiments were also performed and reported in accordance with the Animal Research: Reporting of In Vivo Experiments (ARRIVE) guidelines 2.0. Male 6–8 weeks old C57/BL6J mice (20–25 g) were obtained from Japan SLC, Inc. A mouse photothrombotic stroke model was created as previously described. 6 Briefly, mice placed in a stereotactic frame (SR-5 M, NARISHIGE) were deeply anesthetized and injected intraperitoneally with Rose Bengal (50 μg/g) (TCI chemicals, Japan) at 5 min before illumination. To identify bregma point, the skull was exposed by a median incision of the skin. A fiber optic bundle of cold light source (CL 1500, Zeiss), centered at 2 mm laterally and posteriorly from bregma, illuminated the brain through the intact skull for 15 min initiating at 5 min after the injection of Rose Bengal.
To create a two-lesion stroke model, two fiber-optic bundles were coupled in parallel and placed 2 mm to the left and right and behind the bregma, respectively. The body temperature was controlled by a heating pad during the operation. Sham operations were performed in parallel without illumination by a light source.
Experiment with injection in the lesion core was conducted as previously described with modifications. 24 Briefly, after creating a two-lesion stroke model, the collagen synthesis inhibitor cis-4-Hydroxy-L-proline (CHP, 400 µg/g) 25 was injected into the lesion core on one side to a depth of 2 mm using Hamilton glass syringe with 31 G needle attached to the vertical bar of the stereotaxic frame (Figure 6(a)). CHP was slowly injected into the left-sided lesion over 5 min. Then, the tip of the pipette was allowed to remain in place for a further 5 min before withdrawal. As a control, the same volume of phosphate-buffered saline (PBS) was injected into the contralateral lesion. All procedures were made to minimize animal suffering and the number of animals.
RNA isolation and RNA-sequencing
Total RNAs of each mouse were extracted from the ischemic lesion core at 14 dpi with RNAiso Plus (Takara Bio., Japan). The indicator of RNA Integrity Numbers (RIN), assessed with Agilent 2100 Bioanalyzer (Agilent Technologies) was >8 in all the samples. Total RNAs from the sham operation (n = 4) and photothrombotic stroke model (n = 4) were sent to the Novogene Co., Ltd for RNA-seq analyses with illumina NovaSeq 6000 platform. RNA was purified from total RNA using poly-T oligo-attached magnetic beads. After fragmentation, the first strand cDNA was synthesized using random hexamer primers followed by the second strand cDNA synthesis. The library was ready after end repair, A-tailing, adapter ligation, size selection, amplification, and purification. Paired-end 150 sequencing was performed on illumina NovaSeq 6000 platform to an average depth of 20 million reads per sample.
RNA-seq data analysis
Data analysis
Quality control
In order to remove technical sequences (adapters, polymerase chain reaction (PCR) primers, or fragments thereof, and quality of bases lower than 20), pass filter data of FASTQ format were processed by Trimmomatic (v0.30) to be high quality clean data.
Mapping
Firstly, reference genome sequence (mm10) and gene model annotation files of relative species were downloaded from genome website (UCSC, NCBI, ENSEMBL). Secondly, Hisat2 (v2.0.1) was used to index reference genome sequence. Finally, clean data were aligned to reference genome via software Hisat2 (v2.0.1).
Expression analysis
Transcripts in FASTA format were converted from known gff annotation file and indexed properly. Then featureCounts estimated gene and isoform expression levels from the pair-end clean data.
PCA analysis
PCA (Principal Component Analysis) reduces data complexity helping to analyze sample relationship and the scales of the difference. The basic principle of PCA is to convert the original variables into a new set of independent variables (i.e., the principal components) based on significance to eliminate minor factors and noise and thereby simplify the data. Diagrams were made using two principal components as axes showing the clustering relationships between samples based on the distance between the various samples.
Differential expression analysis and GO enrichment analysis
Differential expression genes (DEGs) and GO enrichment analysis were carried out using the web-based analysis tools of EdgeR package as pairwise comparisons on genes filtered for log2 RPKM (Fragments Per Kilobase of transcript per Million) interquartile range >0.5. Web-based analysis tools were those, including GUI-TTC, 26 iDEP2.0, 27 the Database for Annotation, Visualization and Integrated Discovery (DAVID), 28 and Metascape. 29 p-value of gene (FDR-corrected) was set <0.05 to detect differential expressed ones. All software was run using default parameters, unless otherwise stated. Data was shown in Supplementary RNA-seq data. The raw RNA-seq data of this study was deposited in DNA Data Bank of Japan (DDBJ) as BioSample accession(s): SAMD00794623.
Real-time PCR assay
Total RNAs were extracted from the lesion core samples of Sham and photothrombotic (PT) stoke mice at 1, 3, 14, 28 dpi (n = 4) using RNA Iso Reagent (Takara Bio, Japan). A total 1 μg volume of RNA was reverse transcribed to produce cDNA using qPCR RT Kit (TOYOBO, Japan) after DNase treatment. Real-time PCR was performed using SYBR qPCR Mix (TOYOBO, Japan) on 7300 Real-Time PCR System (Applied Biosystems). GAPDH expression levels were used for standardization of relative mRNA expression. The sequences of the primers are as follows: Col I(Col1a1), 5′-cctcagggtattgctggacaac-3′ and 5′-cagaaggaccttgtttgccagg-3′, Col III (Col13a1), 5′-gaccaaaaggtgatgctggacag-3′ and 5′-caagacctcgtgctccagttag-3′, Gapdh, 5′-gagccaaacgggtcatcatct-3′ and 5′-gaggggccatccacagtctt-3′. The results of cycle threshold values (Ct values) were calculated by the ΔΔCt method to obtain the fold differences. Data (n = 4, each group) were expressed as fold changes (PT vs. Sham) in box plots.
Immunohistochemistry
Frozen brain tangential sections for lesion core in the horizontal plane
Brain tangential sections (Figure 5(b)) were prepared using frozen sections. After intracardiac perfusion with 4% paraformaldehyde (PFA), brains were removed, fixed in 4% PFA at 4°C overnight, replaced with sucrose and embedded in O.C.T. compound. Using a cryostat, the brain was sliced tangentially to the cortex at a thickness of 20 µm so that the lesion core was in the horizontal plane.
Paraffin-embedded section
Mice were intracardially perfused with 4% PFA. Brains were harvested, post-fixed in 4% PFA overnight at 4°C, replaced with sucrose, and embedded in paraffin. After deparaffinization, samples were sectioned at a thickness of 6–7 µm.
Immunohistochemistry and immunofluorescence assay
In immunohistochemistry, sections were permeabilized in phosphate buffered saline (PBS) with 0.2% Triton-X 100 and 5% bovine serum albumin (BSA) and incubated with a primary antibody diluted in a blocking solution (PBS containing 0.1% Triton X-100, 5% BSA) overnight at 4°C. After washed in PBS, sections were processed with Vectastain ABC Elite kit (Vector Laboratories, USA) and developed using DAB (3, 3-diaminobenzidine) substrate solution. In immunofluorescence assays, samples were incubated with Alexa Fluor 488 or 568 conjugated secondary antibodies (Invitrogen) and then stained with DAPI (4′,6-diamino-2-phenylindole) for nuclear staining. Images were obtained using laser scanning confocal fluorescence microscope Olympus FV1000 (Tokyo, Japan).
The primary antibodies used were anti-GFAP (Sigma-Aldrich, # G9269), anti-PDGRFβ (Santa Cruz, sc-374573), anti-CD31/Platelet endothelial cell adhesion molecule-1(PECAM-1) (Santa Cruz, sc-376764), anti-CD31/PECAM-1(BD Biosciences #550274), anti-Col I (Proteintech, 14695-1-AP), anti-Col III (Proteintech, 22734-1-AP), Anti-COL4A1(CSB, CSB-MA212614), anti-Perilipin (Santa Cruz, sc-390169), anti-Vimentin antibody (Proteintech, 10366-1-AP) and anti-Iba1 antibody (Proteintech, 10904-1-AP).
Semi-quantification for DAB-positive areas
For semi-quantification, the DAB-stained brain sections were analyzed by Image J software (https://imagej.net/ij/) with Immunohistochemistry (IHC) Image Analysis Toolbox 30 to semi-quantify the DAB-positive areas. The data were expressed as mean DAB-positive area (%) ± SD per total 50k pixel.
TTC staining
Coronal brain sections were cut to 2 mm thick immediately after obtaining the mouse brain. Brain sections were immersed in a 2% solution of 2,3,7-Triphenyltetrazolium chloride (TTC) (T8877, Sigma-Aldrich) in PBS for 15 min at 37°C. Normal tissue was stained red and infarcted tissue appeared white.
Lipid droplet staining
Lipid droplets were stained with lipid staining reagent (Code: LD03, Lipi-Red, Dojindo Laboratories, Japan) using frozen brain sections. The Lipi-Red working solution was added in frozen brain sections according to the manual (final concentration, 1 μmol/l), and the sections were incubated at 4°C overnight, followed by immunofluorescent staining with antibodies and nuclear staining with DAPI. The cells were observed using a confocal fluorescence microscope (Olympus FLUOVIEW FV1000) at Ex: 561 nm, Em: 565–650 nm.
Measurement of infarcted area
Post-stroke brains at 28 dpi were cut left and right along the longitudinal fissure of the cerebrum and were paraffin-embedded, respectively. Brain sections from the center of the lesion core were used to measure the infarcted area. The boundary between infarcted and non-infarcted tissue was outlined using Image J. After the defect area was outlined in Image J, the infarcted area was measured as the defect area (pixels) using Image J software (https://imagej.net/ij/).
Statistics
Significance was set at p < 0.05 in the present study. The asterisk (*) indicates a statistically significant difference. Results were shown in box plots with means ± interquartile ranges (IQRs) with minimum and maximum data as whiskers. Normal distribution was confirmed by Shapiro Wilk tests (p > 0.1 for all sample groups). In Real-time PCR assays and semi-quantitative assays of DAB-positive areas, two-way analysis of variance (ANOVA) followed by Tukey HSD(Honestly Significant Difference)test was conducted in Biocunductor in R studio. In semi-quantification of infarcted areas, normal distribution was confirmed by combination of Q-Q plot chart and Shapiro Wilk tests described in the figure legend.
Data availability
The raw RNA-seq data of this study was deposited in DNA Data Bank of Japan (DDBJ) as BioSample accession(s): SAMD00794623.
Results
Gene expression profiling in the lesion core of post-stroke brain at 14 dpi by RNA-seq
First, to examine the transcriptional profiling of the lesion core, RNA-seq analysis was performed using total RNAs collected from lesion cores of mouse photothrombotic (PT) stroke model. The time course of ischemic lesions in this stroke model was shown in Figure 1(a), where post-stroke brain sections were treated with H&E staining at 1, 3, 7, 14, 28 days post-injury (dpi), respectively. We previously showed that glial scars are formed at 7-14 dpi in the mouse PT stroke model. 6 Immunohistochemistry showed that GFAP-positive reactive astroglia surrounded the lesion core at 7 dpi (Figure 1(b)). Then, sampling for RNA-seq analysis was performed at 14 dpi when the boundaries of the lesion cores were clear and the lesion cores could be excised (Figure 1(c)).
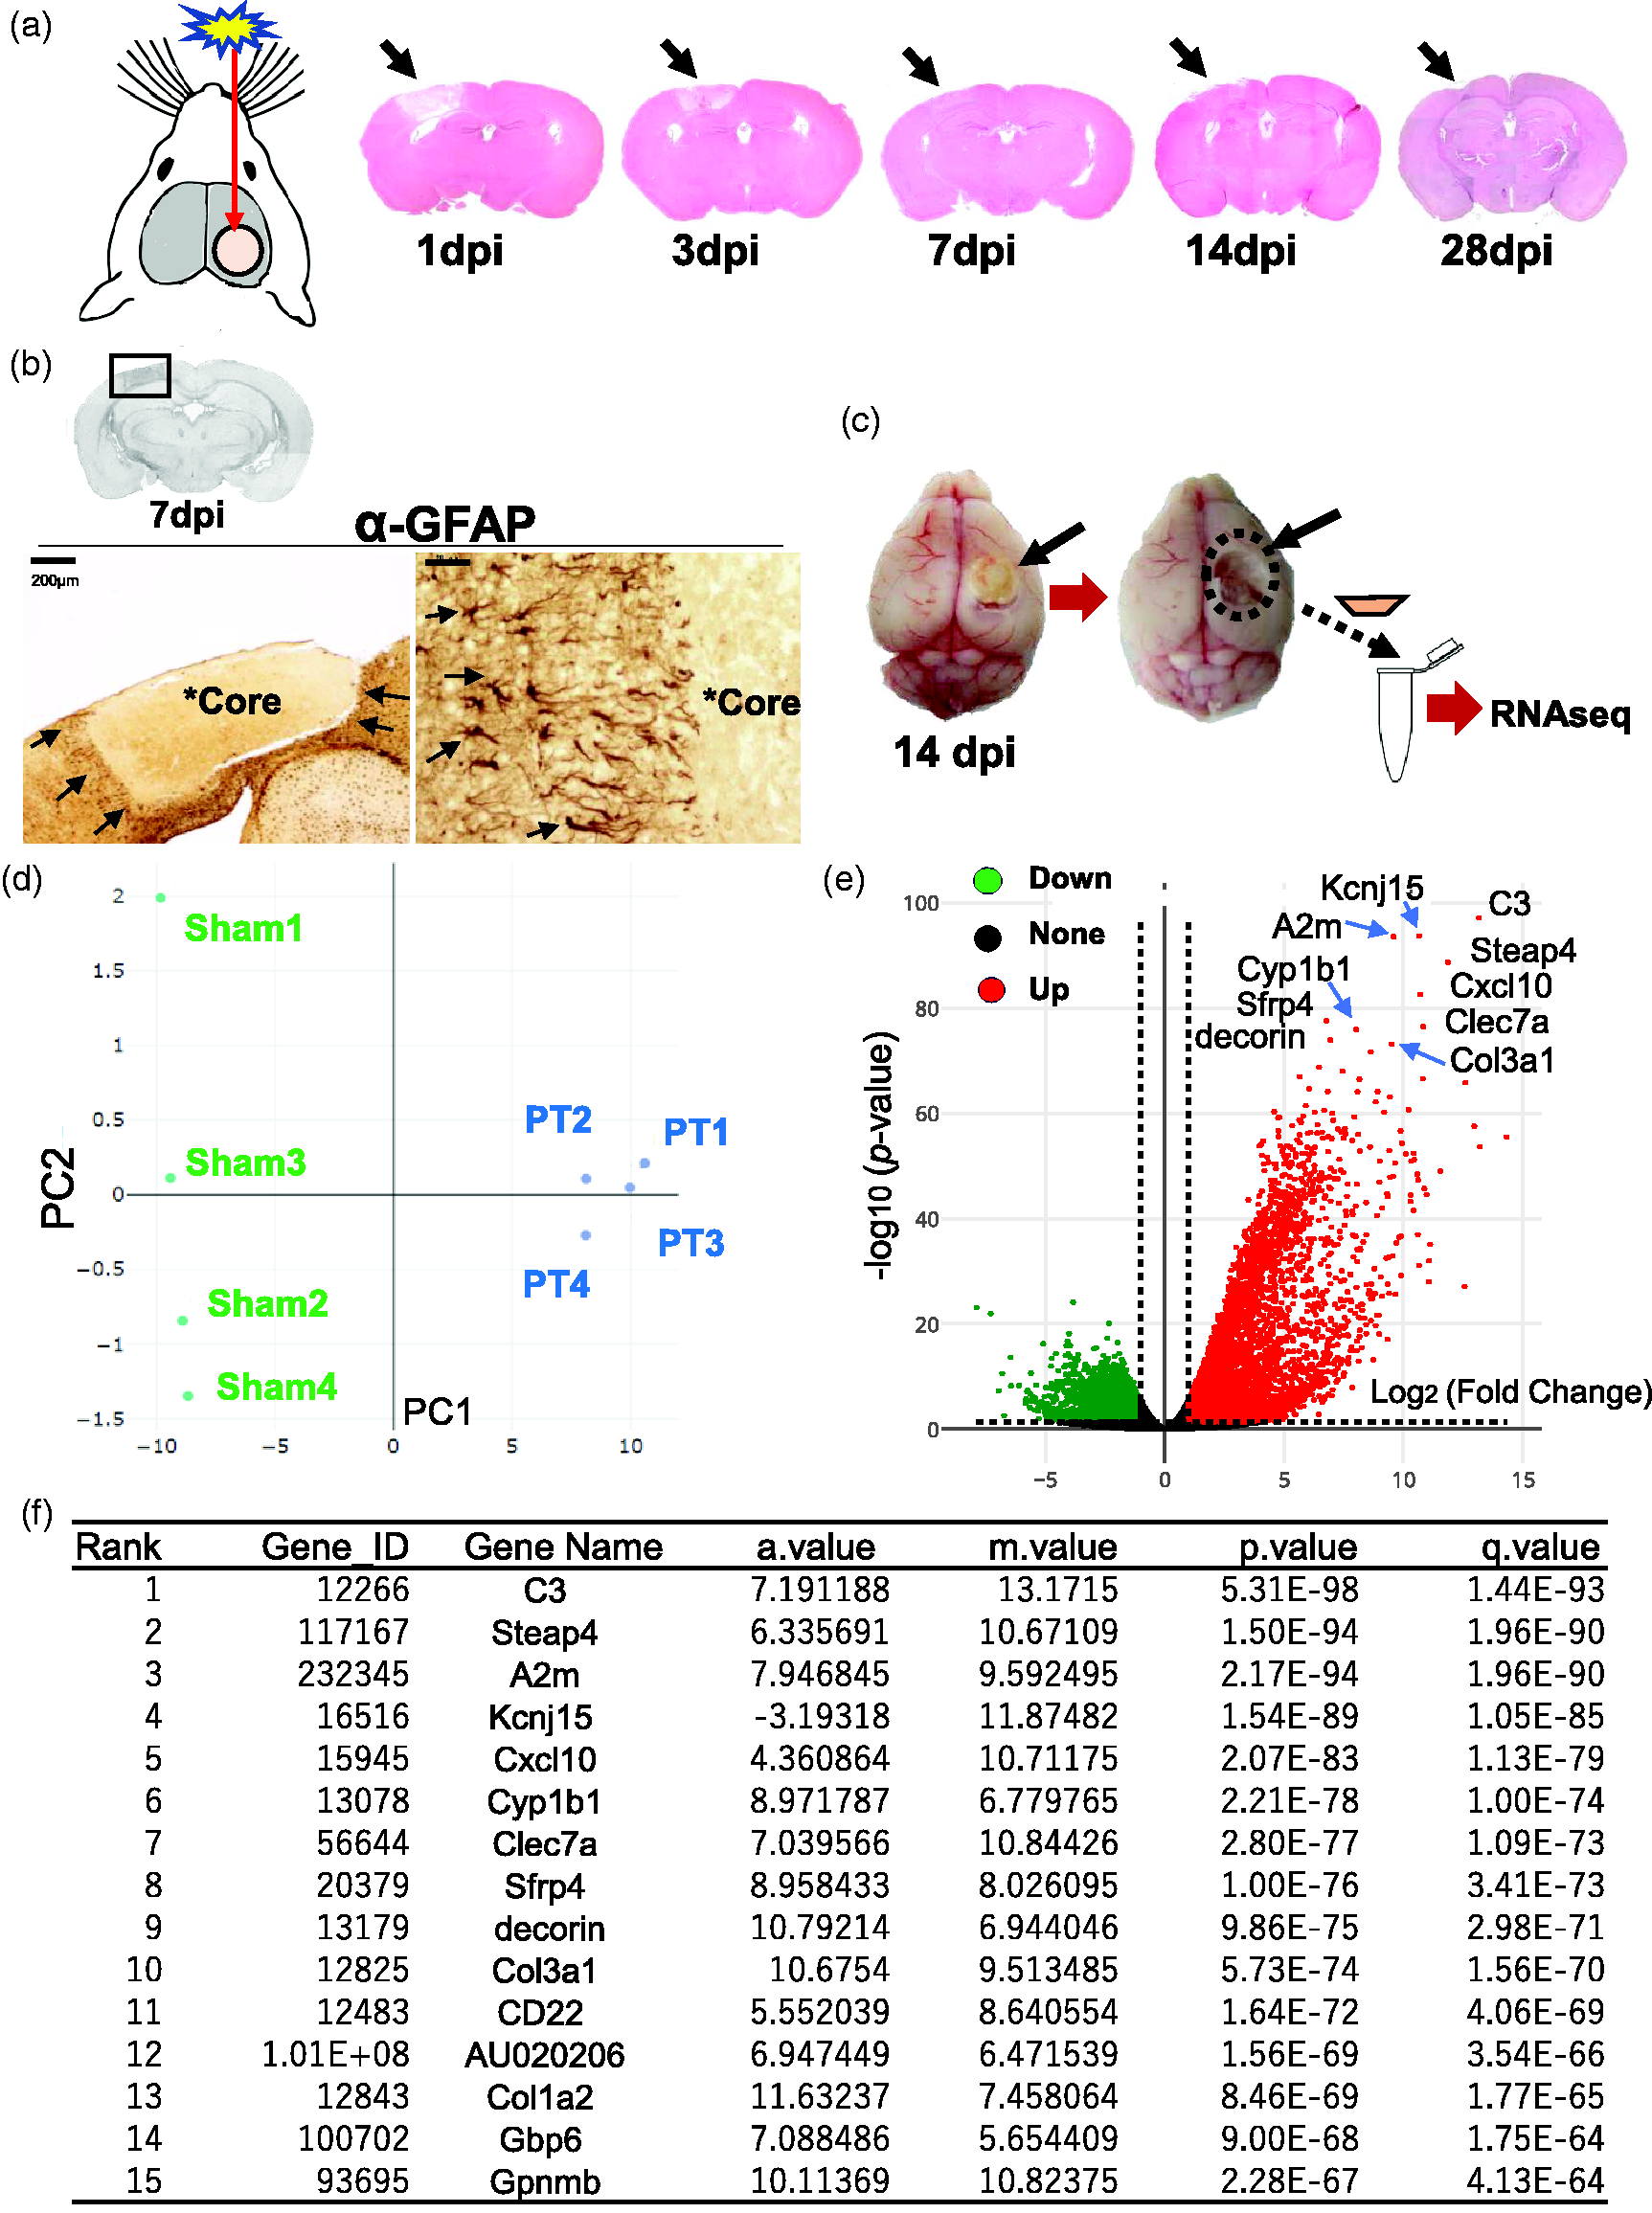
RNA-Seq transcriptome analysis in lesion core of post-ischemic brain. (a) Schematic of mouse photothrombotic (PT) stroke model. The images on the right show the time course of brain sections derived from photothrombotic stroke model mice at 1, 3, 7, 14 and 28 dpi, respectively. Post-stroke brain sections were treated with Hematoxylin and Eosin (H&E) staining. Arrows indicate the ischemic lesions. (b) Immunohistochemistry with anti-GFAP antibody on brain sections at 7 dpi, which were subject to 3,3’-diaminobenzidine (DAB) staining and H&E counterstaining. Arrows in the left image show the border of lesion core. Arrows in the right image indicate GFAP-positive immunoreactivity around the border of lesion core. Asterisks (*Core) indicate the lesion cores. Scale bar, 200 μm (left), 20 μm (right). (c) Schematic diagram showing the sampling process of lesion core for RNA-seq analysis. Continued.The lesion core in the post-stroke brain was sectioned and processed for RNA-seq analysis. (d) Primary component analysis (PCA) plot clustered 8 samples (Sham and PT, n = 4 respectively) into 2 categories dependent on principal component 1 (PC1, X-axis, 97%) and 2 (PC2, Y-axis, 1%). PT: photothrombosis; Sham: sham operation. (e) Volcano plot indicates the differentially expressed genes (DEGs) in comparison between Sham and PT, by plotting significance (p-value) versus fold-change on the y-axis and x-axis, respectively. Up- (green) and Down-regulated (blue) genes are dotted in each color. The top 10 induced genes were shown in the plot. X-axis, log2 (Fold change); Y-axis, -log10(p-value). (f) Table shows the top 15 genes induced in RNA-seq analysis of lesion core, ranked by q-value. The a.value represents the average expression level of a gene across two conditions, calculated as the mean of the log-transformed expression values. The m.value indicates the log-fold change in gene expression between two conditions, calculated as the difference between the log-transformed expression values of the two conditions. The q.values is an adjusted p-value that accounts for the false discovery rate (FDR).
In the RNA-seq analysis, principal component analysis (PCA) segregated the eight samples (Sham, n = 4; PT, n = 4) into two categories (Sham and PT) by principal components 1 (PC1, X axis, 97%) and 2 (PC2, Y axis, 1%) (Figure 1(d)). In total, we found over 8000 differentially expressed genes (DEGs) (4980 increased and 3828 decreased) in the lesion core between Sham and PT by EdgeR package (log2(fold change) > 1, FDR adjusted p < 0.05) (Supplementary RNA-seq data). Volcano plots showed changes in gene expression levels between PT and Sham with top 10 DEGs (Figure 1(e)), including Col3a1. Table (Figure 1(f)) showed the top 15 DEGs in the lesion core, including C3(Complement component 3, q.value = 1.44E-93), A2m (Alpha-2-Macroglobulin, q.value = 1.96E-90), Col3a1 (collagen type 3, a1, q.value = 1.56E-70), and Col1a2 (collagen, type 1, a2, q.value = 1.77E-65).
Gene ontology (GO) enrichment analysis in the lesion core of post-stroke brain
To examine enriched biological functional pathways in the lesion core, we conducted the Gene Ontology (GO) enrichment analysis, including biological processes (GO-BP), molecular functions (GO-MF), cellular components (GO-CC), and Kyoto Encyclopedia of Genes and Genomes (KEGG) pathways28,29 (Figure 2(a) and (b)). DEGs were significantly enriched in various immune and inflammatory pathways (e.g., T cell, Cytokine, ECM organization pathway, collagen pathway) (Figure 2(a)). In KEGG pathway, phagosome-related pathway was one of most enriched functional pathways (Figure 2(b)).
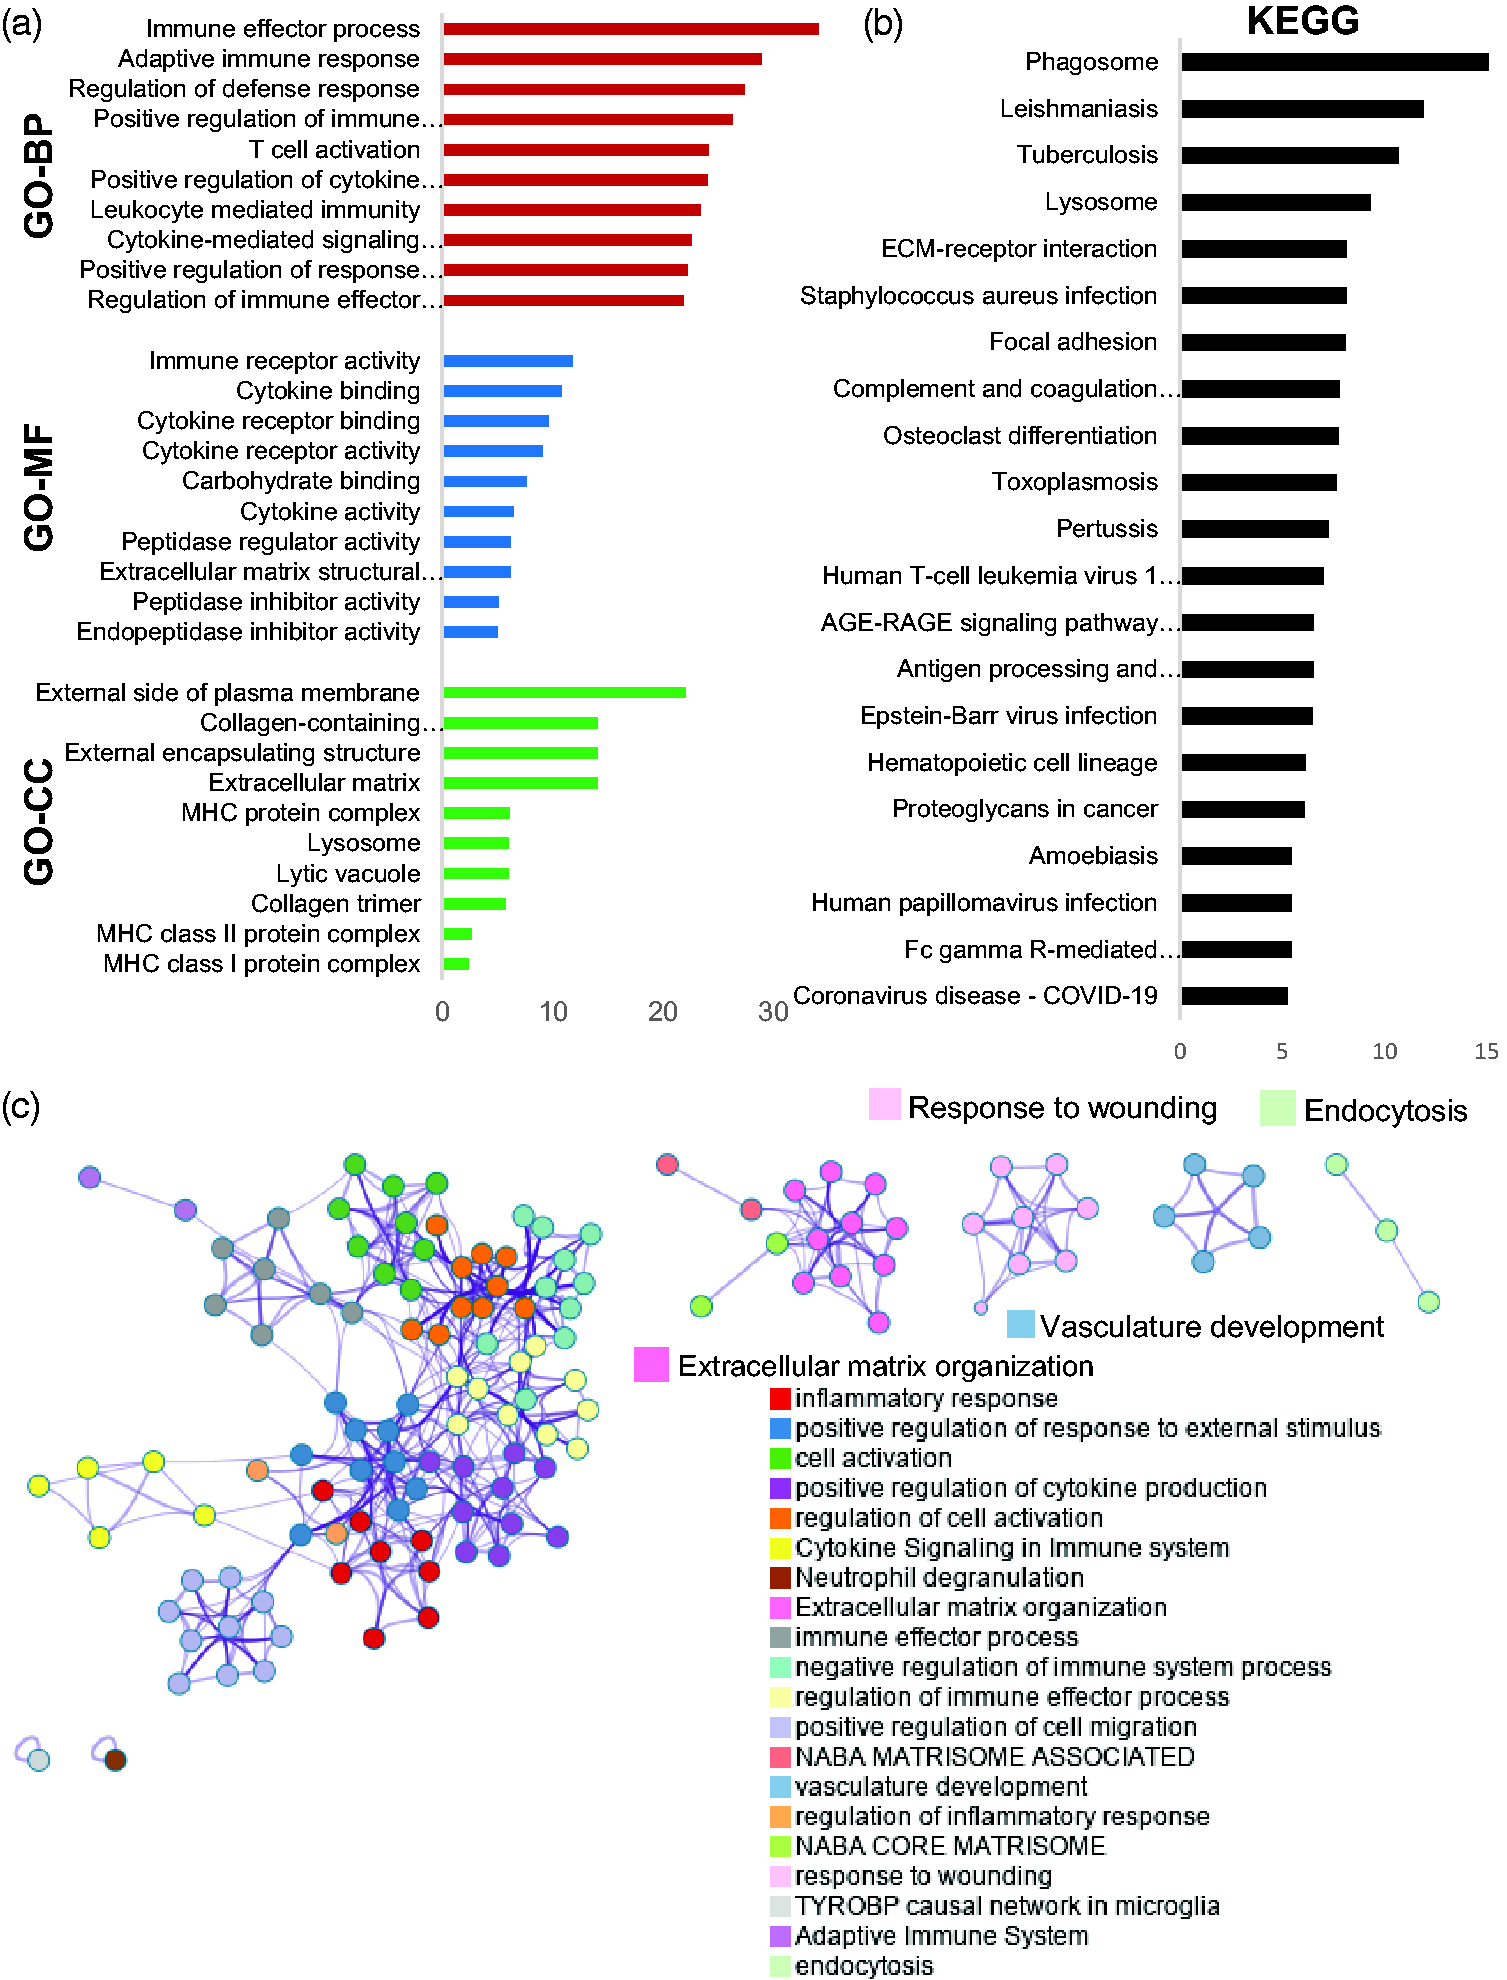
Enrichment analyses based on GO and KEGG terms for DEGs in post-ischemic brain. (a) Bar graphs representing GO enrichment analyses (GO-BP, GO-MF, GO-CC). GO-BP; Gene Ontology- Biological process, GO-MF; Gene Ontology-Molecular function, GO-CC; Gene Ontology-Cellular component. X-bar; log (p-value corrected). (b) Bar graph representing the Kyoto Encyclopedia of Genes and Genomes (KEGG) pathway analysis. X-bar; log (p-value corrected). (c) Gene ontology network analysis of clusters relied on DEGs (adjusted p < 0.01, log 2 (Fold changes) > 1), created by https://metascape.org. Each node corresponds to a gene set, and each color represents a cluster. DEGs; differentially expressed genes. X-bar; log (p-value corrected).
GO network analysis showed clusters dependent on DEGs, with each node corresponding to a set of genes (Figure 2(c)). Each color represents a cluster enriched between Sham and PT. These results showed that the various immune and inflammatory responses were primarily activated as well as those related to phagosome, ECM organization, wound healing, vasculature development, and endocytosis.
Spatiotemporal expression of collagen in the ischemic core of post-stroke brain
Then we focused on col3a1 encoding Col III, which was one of highly expressed DEGs (Figure 1(e) and (f), Supplementary RNA-seq data). We also examined the GO enrichment pathways, including phagosomes, ECM organization, and vasculature development (Figure 2(c)). To examine the spatiotemporal expression of GO enrichment pathways, paraffin-embedded brain sections at 3, 7, 14 and 28 dpi were immunostained with various antibodies (Figures 3(a) and (c)). CD31/PECAM1(endothelial marker)-positive vasculatures invaded from the meninges as early as 3 dpi and formed time-dependent vascular network-like structure in the lesion core by 7 dpi (Figure 3(a)). Iba1-positive microglia/macrophages were accumulated in the border zone at the lesion core by 7 dpi (Figure 3(a)). Some Iba1-positive microglia/macrophages appear to have migrated from the periphery of the lesion to the border zone at 3–7 dpi. Brain sections then were used to semi-quantify the 3,3’Diaminobenzidine (DAB)-positive area (%) by anti-CD31/PECAM1 and anti-Iba1 antibody, respectively (Figure 3(b)). The results showed a time-dependent increase in CD31/PECAM1 and Iba1 immunoreactivity.
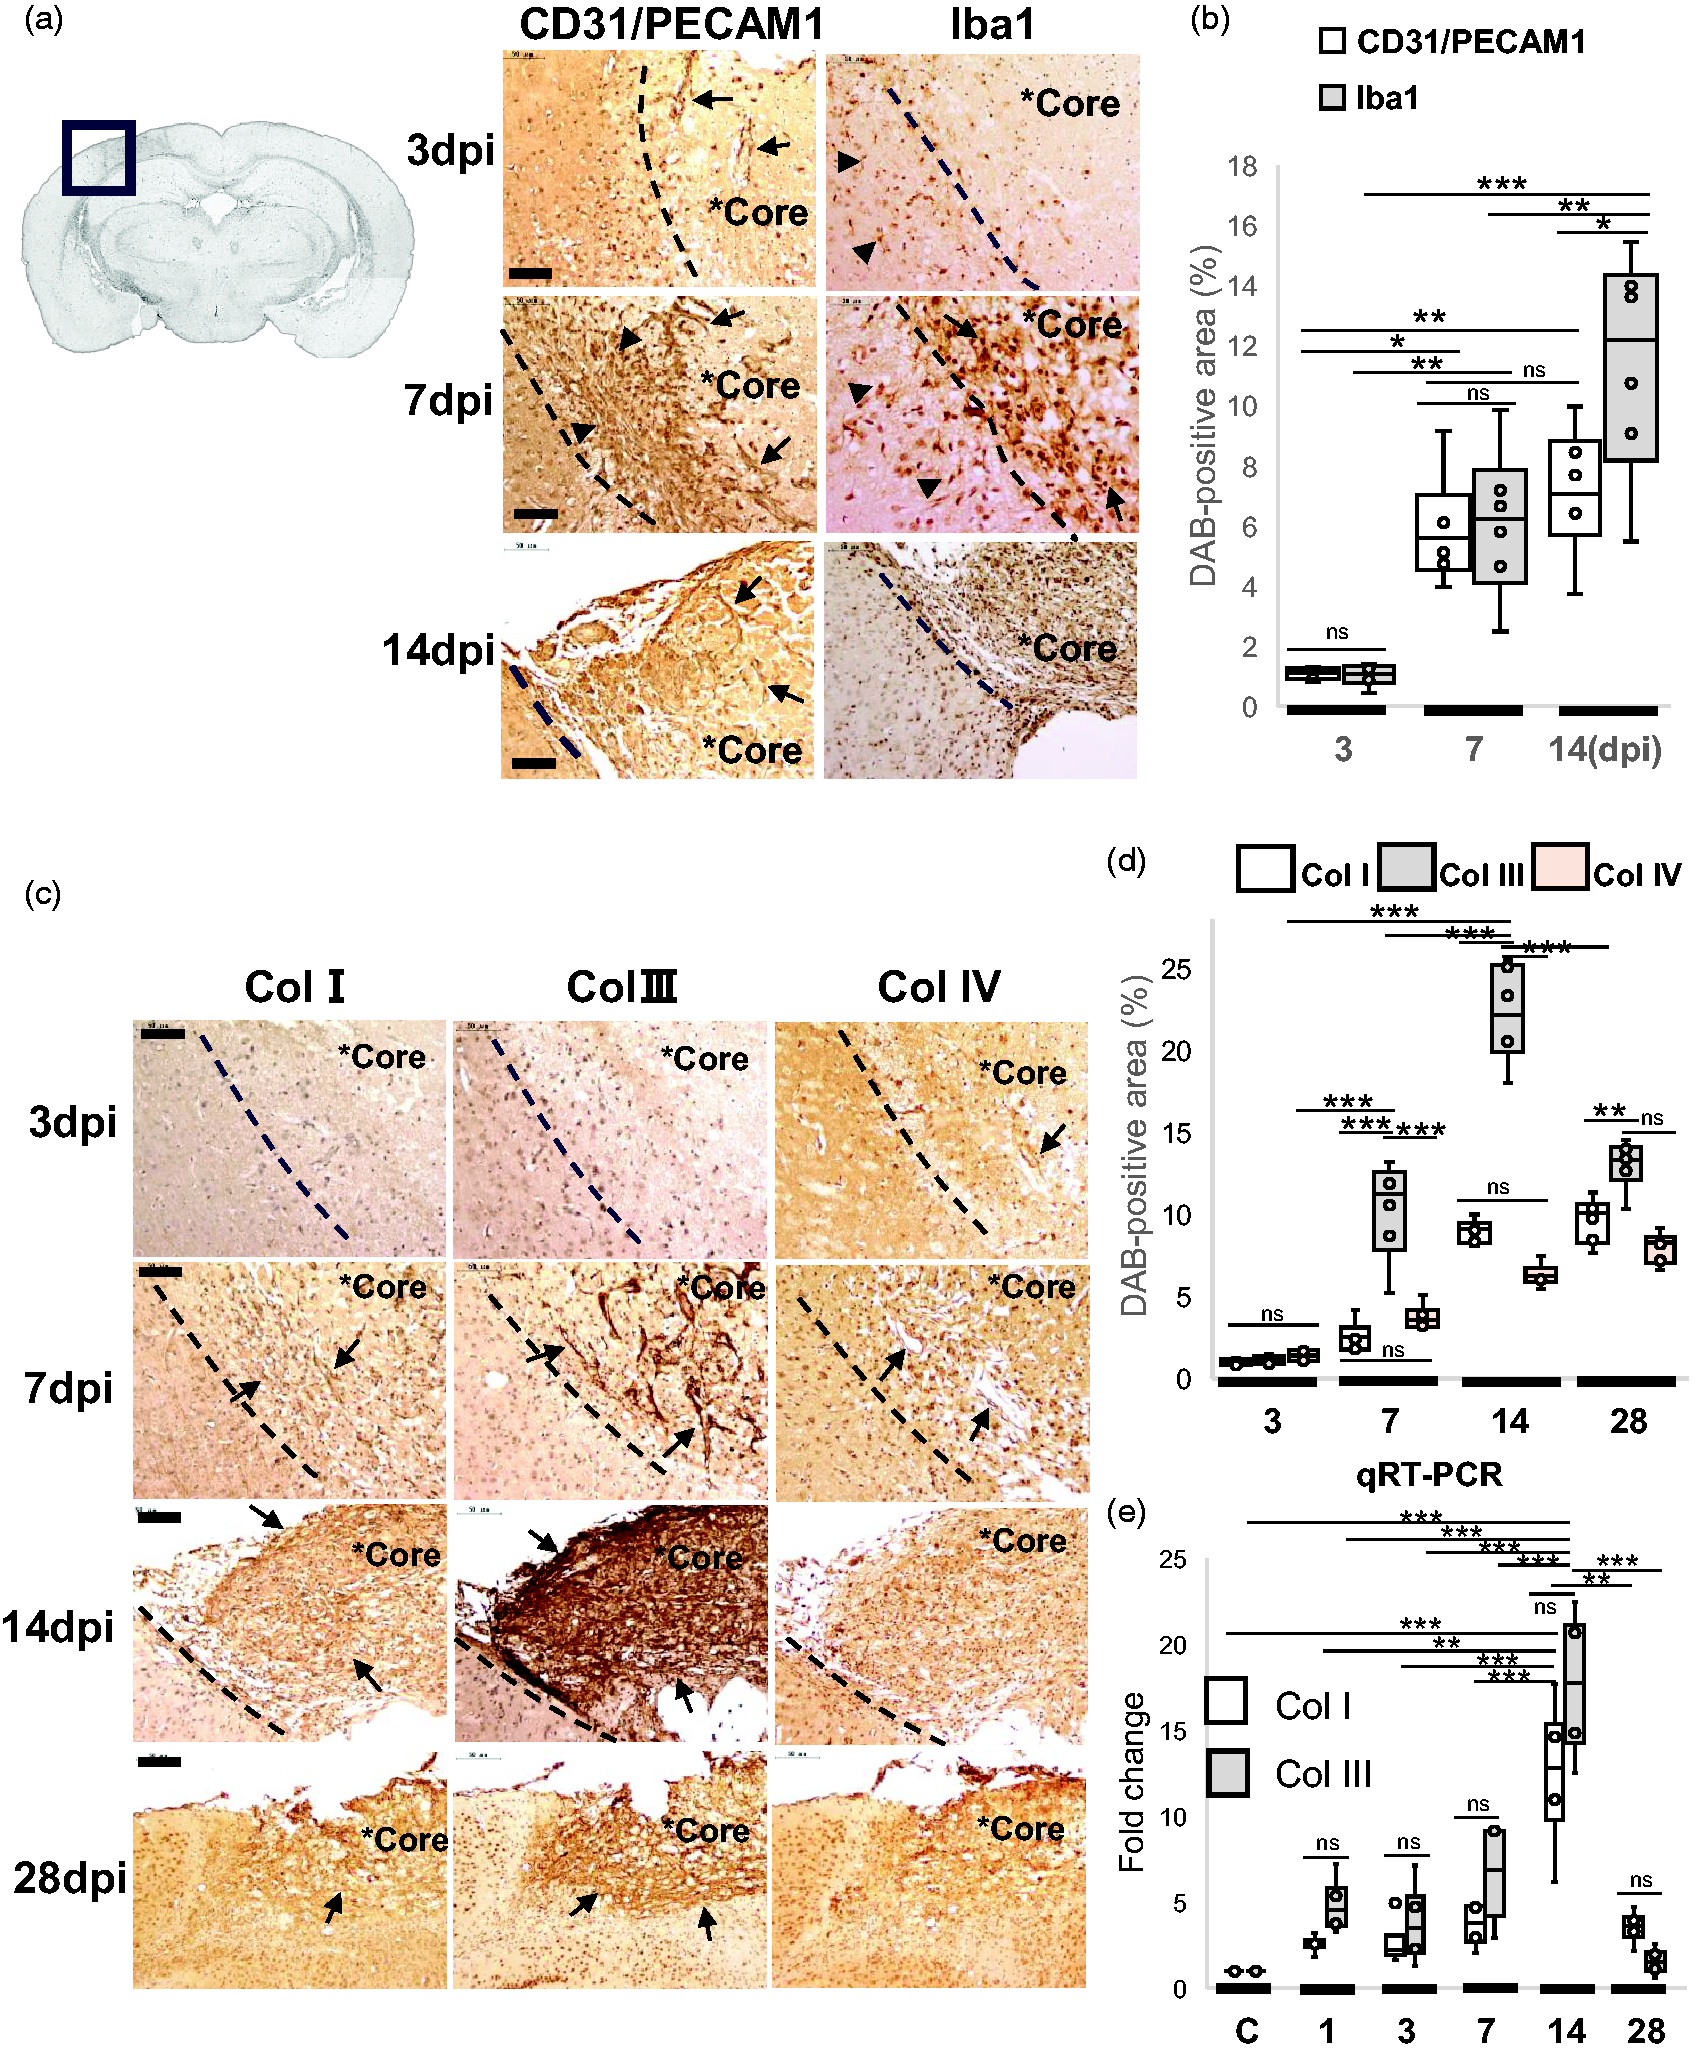
Spatiotemporal expression of collagen in the lesion core by immunohistochemistry and qRT-PCR. (a) Left image showed the paraffin-embedded brain section in gray scale at 7 dpi. Right images (column 1, 2) showed paraffin-embedded brain sections at 3, 7 and 14 dpi, respectively. Brain sections were immunostained with anti-CD31/PECAM-1 and anti-Iba1 respectively, followed by DAB staining and nuclear staining with hematoxylin. Asterisks (*Core) indicates the lesion core. Arrows (first column) indicate CD31/PECAM-1-positive vasculatures invading from the meninges, and arrowheads (first column) show vascular networks. Arrows (second column) indicate Iba1-positive round cells in the lesion core, and arrowheads (second column) show cells migrating from the periphery. Scale bar, 50 μm. (b) The box plots showed the semi-quantification of DAB-positive areas (%) with anti-CD31/PECAM-1 and anti-Iba1 antibodies in brain sections at 3, 7, and 14 dpi. Results were presented in box plots with means (lines) ± IQRs with minimum and maximum data as whiskers. The DAB-positive areas were semi-quantified by IHC Image Analysis Toolbox in Image J, respectively. Individual sample data were shown as dots (n = 6). Normal distribution was confirmed by Shapiro Wilk tests, and p values were obtained with two-way ANOVA followed by Tukey HSD. *p < 0.05, **p < 0.01, ***p < 0.001. (c) Images showing representative paraffin-embedded brain sections at 3, 7, 14, and 28 dpi, respectively. Brain sections were immuno-stained with anti-Col I, Continued.anti-Col III, and anti-Col IV antibodies, followed by DAB staining and nuclear staining with hematoxylin. Asterisks (*Core) indicates the lesion core. Arrows at 3 and 7 dpi indicate immunoreactivities along the vascular structures. Arrows at 14, 28 dpi show fibrous mesh-like structures. Scale bar, 50 μm. (d) The box plots showed the semi-quantification of DAB-positive areas (%) with anti-Col I, anti-Col III, and anti-Col IV antibodies in brain sections at 3, 7, 14, and 28 dpi. Results were presented in box plots with means (lines) ± IQRs with minimum and maximum data as whiskers. Individual sample data were shown as dots (n = 6). Normal distribution was confirmed by Shapiro Wilk tests, and p values were obtained with two-way ANOVA followed by Tukey HSD. *p < 0.05, **p < 0.01, ***p < 0.001. Y-axis; % DAB-positive area. ns, no significant. (e) The box plots showed the result of Real-time PCR assay (qRT-PCR) by ΔΔCT method. Total RNAs from the lesion cores in post-stroke brains were used for qRT-PCR analysis of collagen 1a1(Col1a1) and collagen 3a1 (Col 3a1) transcript at each time point (1–28 dpi), respectively. The y-axis shows the value of log2 (Fold changes). GAPDH was used as a reference gene. Results were presented in box plots with means (lines) ± IQRs with minimum and maximum data as whiskers. Individual sample data were shown as dots (n = 4). Normal distribution was confirmed by Shapiro Wilk tests, and p values were obtained with two-way ANOVA followed by Tukey HSD. *p < 0.05, **p < 0.01, ***p < 0.001. ns, no significant.
We then examined the spatiotemporal expression of collagens in the lesion core, including Col I, Col III, and Col IV (Figure 3(c) and (d)). Their immunoreactivities were increased in the ischemic border zones in a time-dependent manner at 7–14 dpi, respectively. In particular, Col III immunoreactivity appeared in a reticular pattern by 7 dpi (Figure 3(c)). By 14 dpi, the lesion core was filled with Col I and Col III immunoreactivity, respectively. By 28 dpi, the reticular expression pattern of Col III as well as Col I was prominent in the fibrotic scar (Figure 3(c)). Col IV is primarily localized in extracellular basement membranes.20,21 Brain sections were then used to semi-quantify the 3,3’Diaminobenzidine (DAB)-positive area (%) by anti-Col I, anti-Col III, and anti-IV antibodies (Figure 3(c) and (d)). The induction levels of Col III were higher than those of Col I at the subacute phase of 7–14 dpi. We then examined the transcriptional levels of fibrotic collagen, Col 1a1 and Col3a1, in the lesion core by real-time PCR (Figure 3(e)). The expression of Col1a1 and Col3a1 were time-dependently increased by 14 dpi. The real-time PCR result at 14 dpi was in agreement with our RNA-seq data at 14 dpi (Figure 1(f), Supplementary_RNA-seq_data), which showed the transcriptional data of collagen 3a1 (Gene ID 12825, q.value = 1.56E-70, rank 10), collagen 1a1 (Gene ID 12814, q.value = 2.89E-16, rank 1419), and collagen 1a2 (Gene ID 12843, q.value = 4.78E-64, rank 13), respectively.
Interaction between col III and angiogenesis in the lesion core of post-stroke brain
To examine the histological interaction between Col III and angiogenesis, high magnification images of paraffin-embedded brain sections at 7 dpi were shown in Figure 4(a). As shown in Figure 3(a), CD31/PECAM1-positive vasculatures were penetrating from the meninges by 7 dpi, especially in the border zone of the lesion core (Figure 4(a), left). In a similar expression pattern, Col III immunoreactivity was also observed along the penetrating vasculatures (Figure 4(a), right), especially in the border zone. Col III immunoreactivity was observed surrounding the vasculature (Figure 4(a), inset), with endothelial cells and pericyte-like cells observed (arrow in the inset).
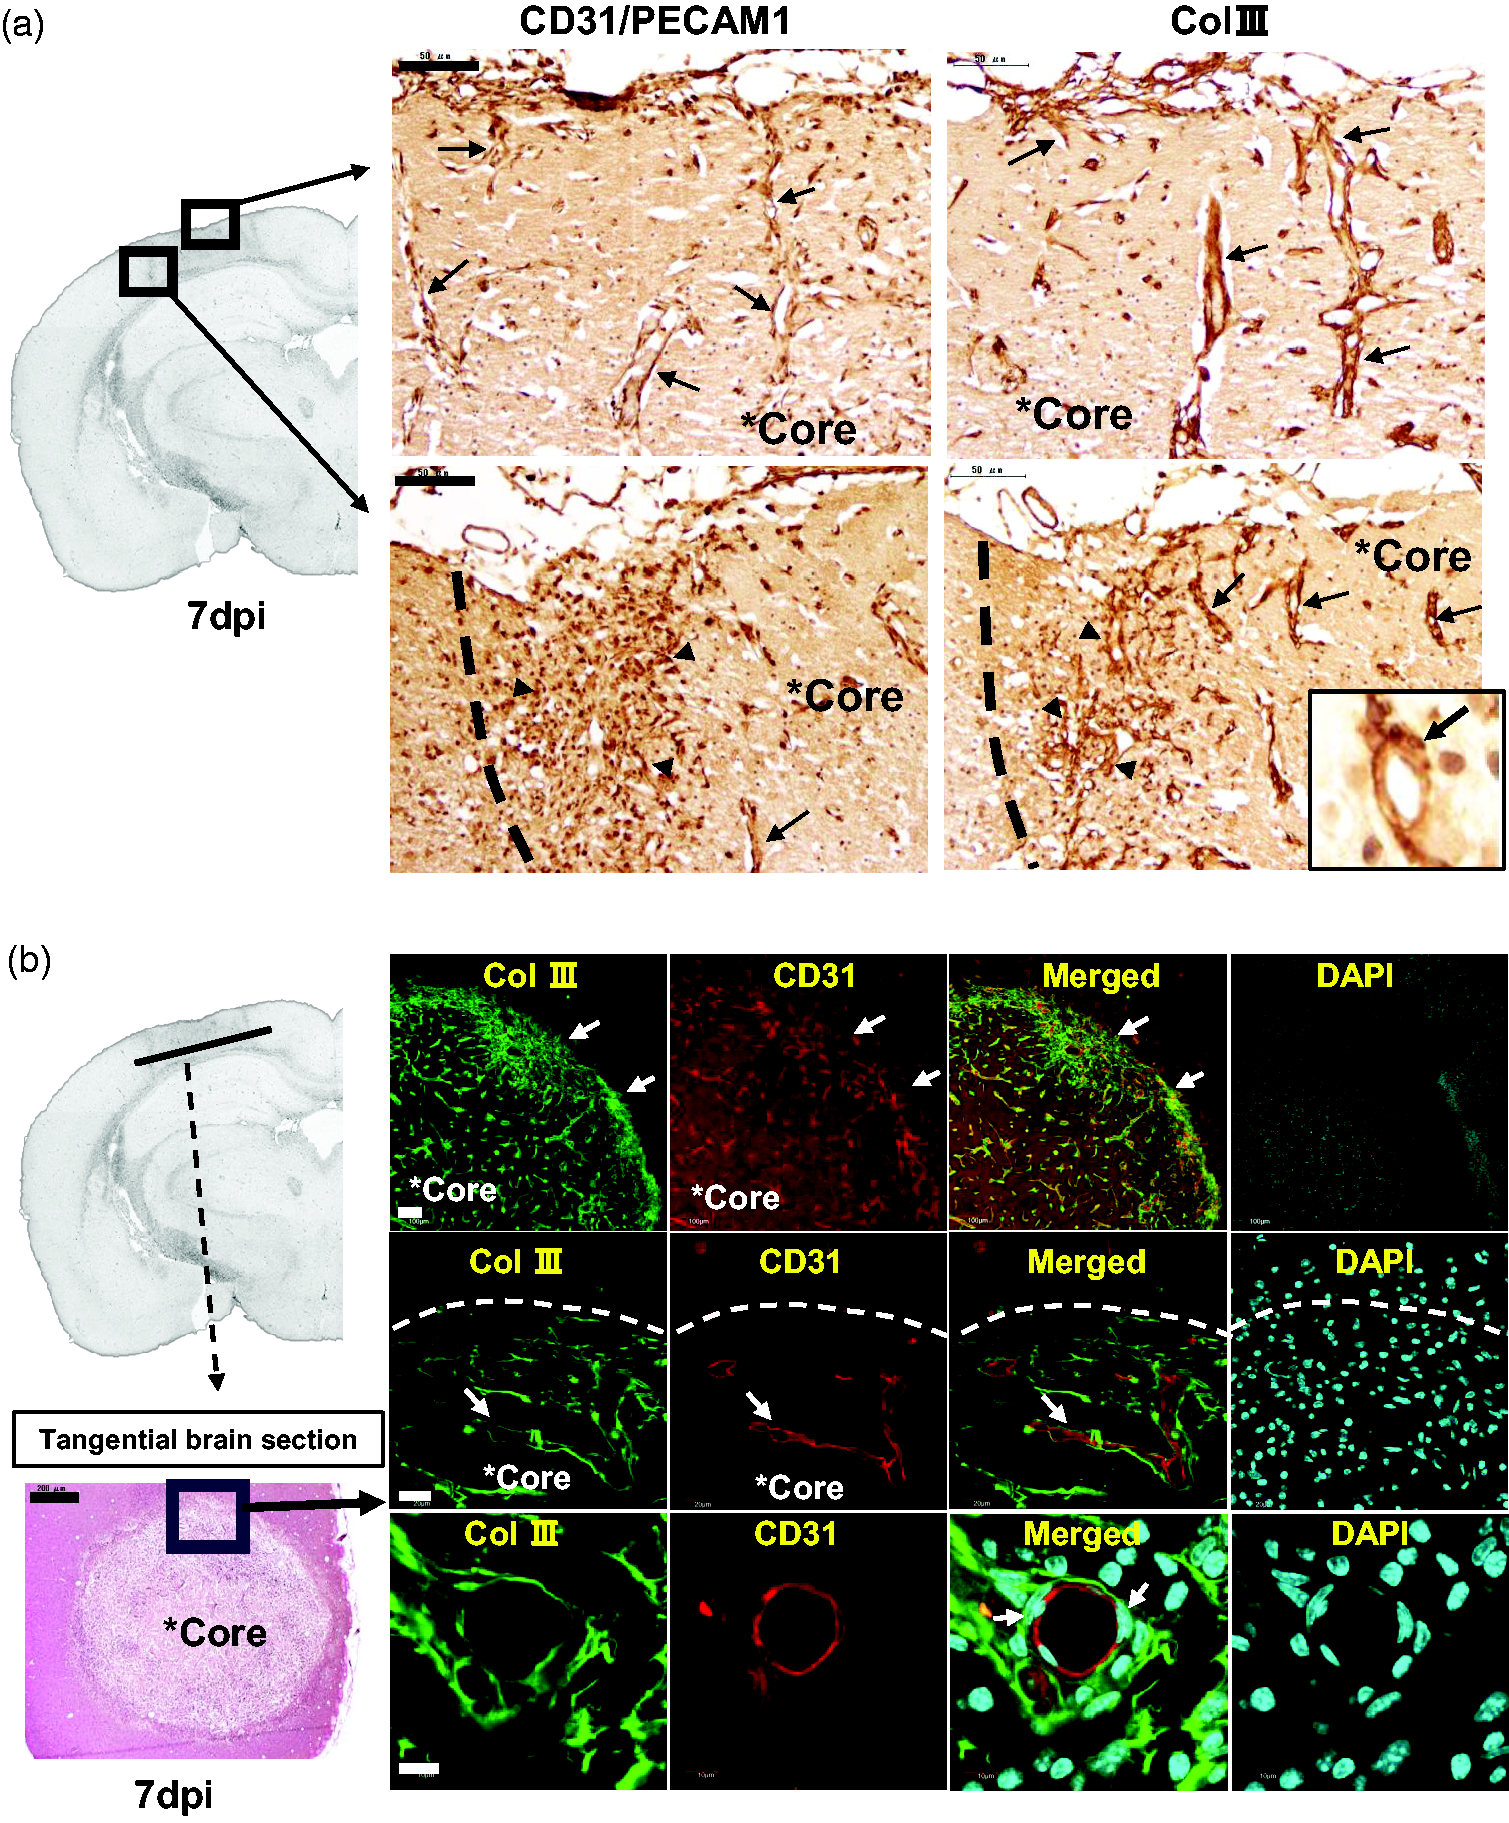
Interaction between Col III and angiogenesis in the lesion core at 7 dpi. (a) Left image showed the paraffin-embedded brain section in gray scale on ipsilateral side at 7dpi. The images on the right show magnified paraffin-embedded brain sections at 7 dpi, respectively. Immunohistochemistry was conducted with anti-CD31/PECAM-1 and anti-Col III antibodies on brain sections at 7 dpi, respectively. Sections then were subject to nuclear staining with hematoxylin. Arrows indicate immunoreactivities along the vascular structures. Arrowheads show immunoreactivities at the border of lesion core. Scale bar, 50 μm. (b) Left bottom image showed the tangential brain cryosection with H&E staining at 7 dpi, in which ischemic core is in the horizontal plane. Scale bar, 200 μm. Right images showed brain cryosections that were co-immunostained with anti-Col III and anti-CD31/PECAM-1 antibodies, followed by fluorescent secondary antibodies (Alexa Fluor 488 or 568 conjugated) and 4’,6-diamidino-2-phenylindole (DAPI) staining. Then brain cryosections were observed under confocal laser scanning microscope (Olympus FLUOVIEW FV1000). Arrows (first row) indicate the border of the lesion core. Arrows (second row) indicate Col III and CD31 immunoreactivity, respectively. Arrows (third row) indicate nuclei of pericyte-like cells around the vasculature. Scale bar, 100 μm (row 1), 20 μm (row 2), 10 μm (row 3, 4).
To further examine the interaction, we performed co-immunofluorescent staining to determine whether Col III is actually localized along the vasculatures (Figure 4(b)). Frozen brain sections were prepared by cutting the brain tangentially to the cortex so that the lesion cores were in the horizontal plane (Figure 4(b), left images). Col III-positive and CD31/PECAM1-positive immunoreactivity were observed especially in the lesion core (Figure 4(b)). Col III immunoreactivity was observed to surround CD31/PECAM1-positive vasculatures in the lesion core at 7 dpi (Figure 4(b)). In particular, pericyte-like cells were observed between Col III immunoreactivity and CD31-positive endothelial cells (Figure 4(b)). However, it is possible that this perivascular region is an artefact during processing.
Interaction between col III and myelin debris in the lesion core
Ischemic debris contains lipid-rich myelin and termed as “myelin debris”. The myelin debris is phagocytosed by microglia/macrophages and processed as cytosolic lipid droplets (LDs). 12 The histological interaction between Col III and myelin debris in the lesion core was examined immunohistochemically. The high magnification images of fibrotic scar in paraffin-embedded brain sections at 28 dpi were shown, which were immunostained with anti-Col I, anti-Col III, and anti-Col IV antibodies, respectively (Figure 5(a)). Immunoreactivity of fibrillar collagen Col I and Col III showed a reticular expression pattern (Figure 5(a)) in the lesion core respectively. Interestingly, some cells with round nuclei stained by hematoxylin were localized in the fibrotic chambers of Col I and Col III, respectively. These cells were further examined as follows.
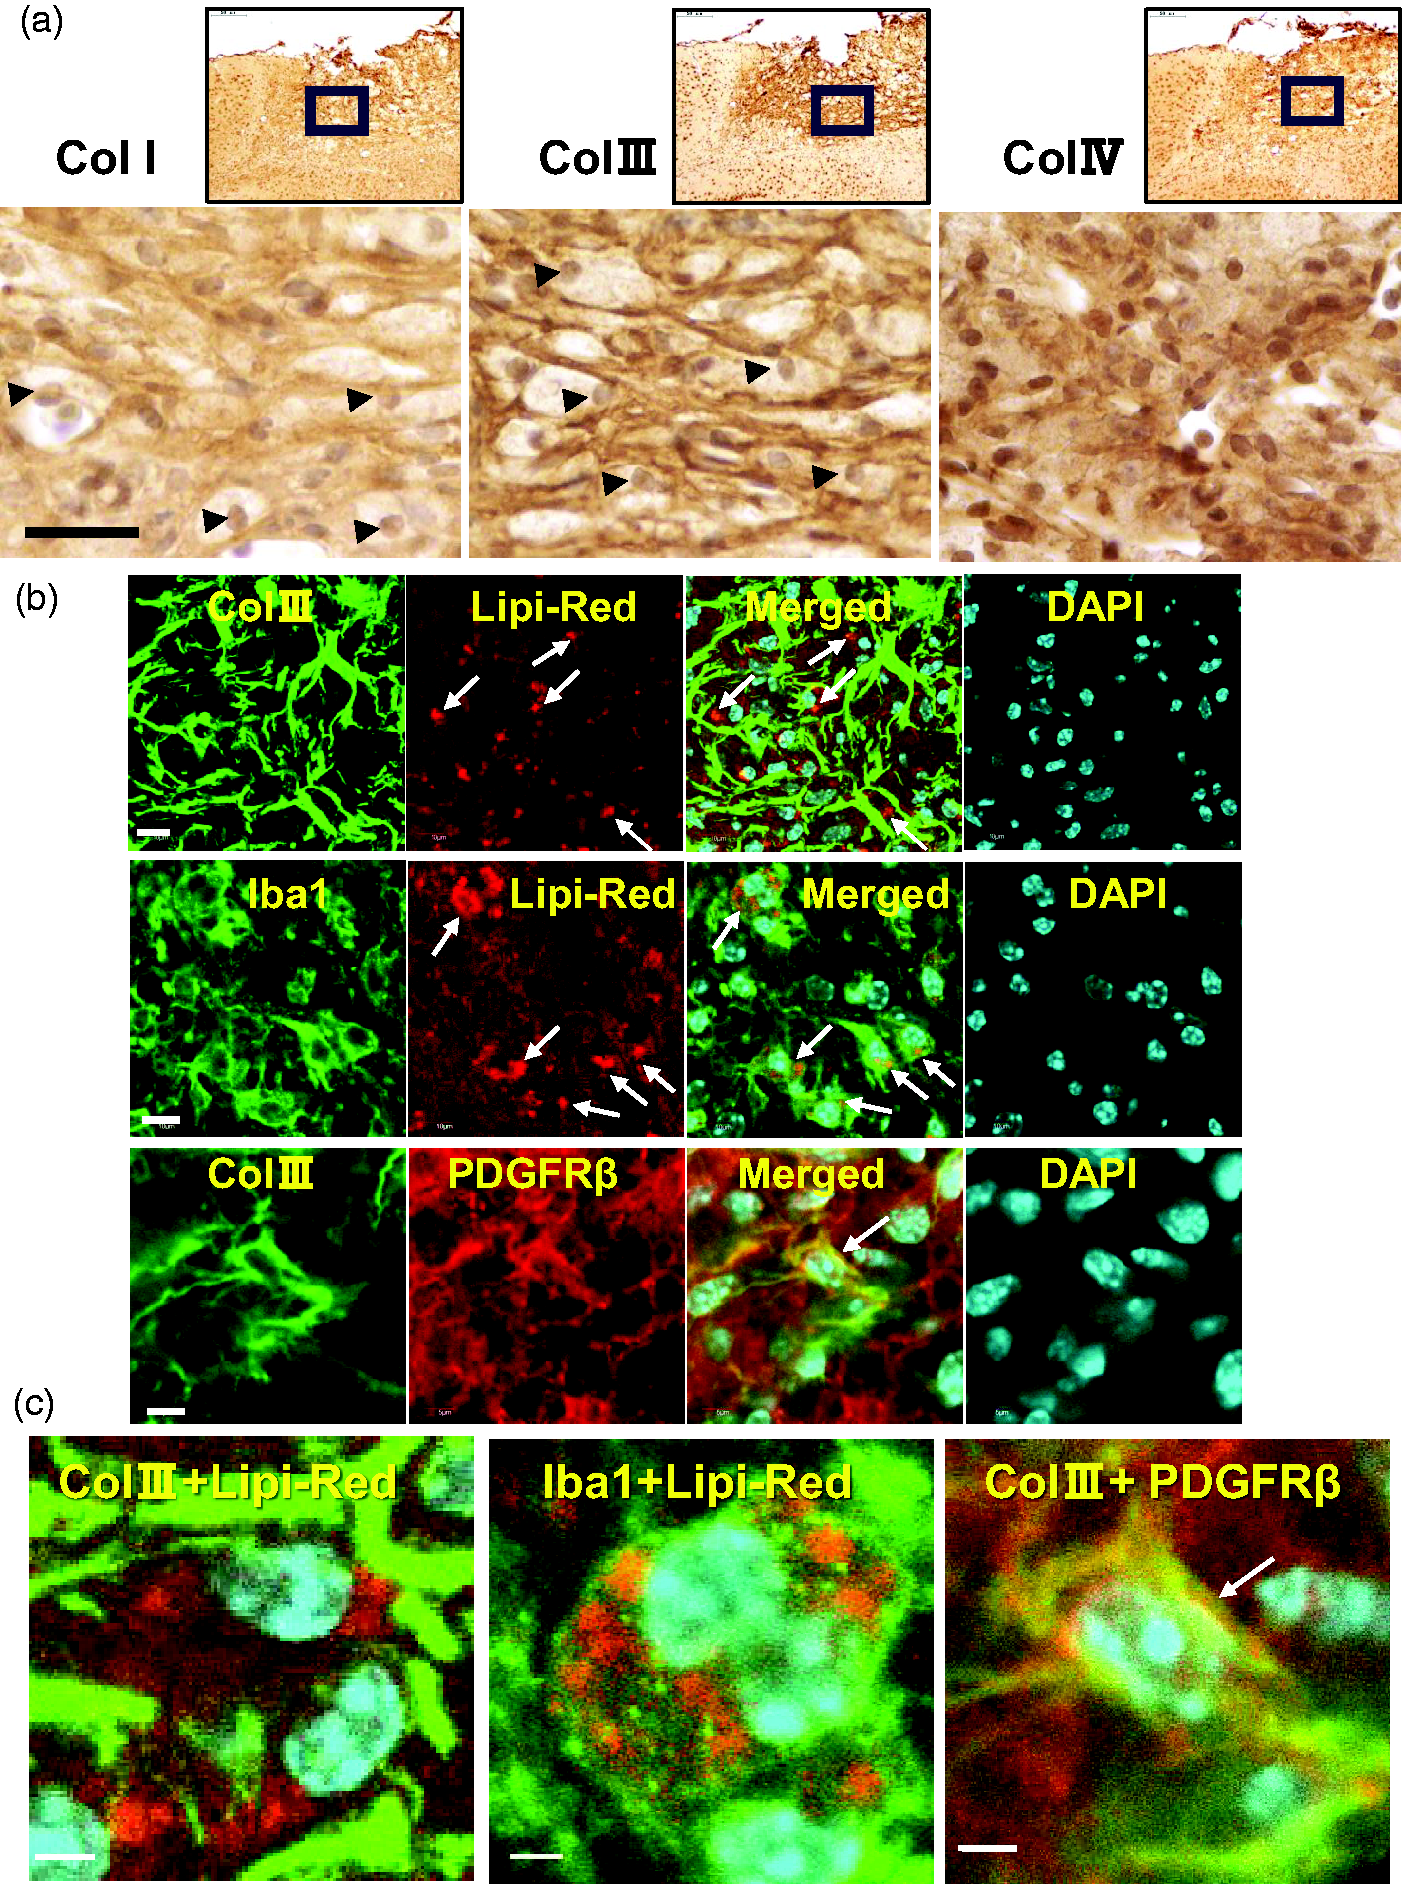
Interaction between Col III and myelin debris in the lesion core. (a) Top images showed the paraffin-embedded brain sections that were immunostained with anti-Col I, anti-Col III, and anti-Col IV antibodies at 28 dpi, respectively. Sections were then subject to nuclear staining with hematoxylin. Scale bar, 50 μm. Arrowheads indicate nuclei in the fibrous mesh. (b) Brain cryosections at 7 dpi were stained with Lip-Red reagent for lipid droplets (DPs). Then sections were fluorescent immuno-stained with anti-Col III, anti-Iba1, and anti-PDGFRβ antibodies, followed by DAPI staining respectively. The brain sections were observed under confocal laser scanning microscope (Olympus FLUOVIEW FV1000). Arrows (first and second row) indicate Lipi-Red-positive lipid droplets. Arrow (third row) shows the merge between Col III and PDGFRβ-positive immunoreactivities. Scale bar, 10 μm (left), 5 μm (right lane) and (c) Magnified images show the merged confocal images in Figure 5(b) (Col III+Lipi-Red, Iba1+Lipi-Red, Col III +PDGFRβ), respectively. Arrow (third column) shows the merge between Col III and PDGFRβ-positive immunoreactivities.
To examine the localization of LDs in the lesion core, lipid staining was performed on the frozen brain sections at 7 dpi using the Lipi-Red reagent (Dojindo Laboratories), which emits high fluorescence in LDs. Co-fluorescent staining with anti-Col III antibody and the Lipi-Red reagent showed that LDs were localized in the fibrillar mesh of Col III (Figure 5(b)). Highly magnified image was shown in Figure 5(c), in which Lipi-Red (red) were in the mesh of Col III (green). Furthermore, co-immunofluorescence stain with anti-Iba1 antibody and Lipi-Red reagent showed that LDs were stored in the cytosol of Iba1-positive phagocytes (Figure 5(b), second row). Highly magnified image was shown in Figure 5(c) (center image). Collagen can be produced by PDGFRβ-positive fibroblast-like cells in the lesion core of CNS injury, based on previous studies.1,7,16 Co-immunofluorescence staining showed that Col III immunoreactivity was partially colocalized with PDGFRβ immunoreactivity in the lesion core (Figure 5(b)). Highly magnified image was shown in Figure 5(c). Collagen-producing PDGFRβ+ fibroblast-like cells were shown to express nestin and vimentin in the rat brain injury model.4,19 Co-immunofluorescence assays showed that some PDGFRβ-positive cells were positive for anti-vimentin antibody (Supplemental Fig.S1).
In vivo injection of collagen synthesis inhibitor reduced penetrating vasculatures
To address the interaction between collagen and the vasculature, in vivo experiments were performed by injecting collagen synthesis inhibitor into the lesion core (Figure 6(a)). cis-4-Hydroxy-L-proline (CHP) is a proline analog that inhibits collagen synthesis by blocking proline hydroxylation. 31 For the in vivo injection experiments, a two-lesion stroke model was used to compare the effect between control (PBS) and CHP. First, 2,3,5-triphenyltetrazolium chloride (TTC) staining confirmed that the left and right ischemic regions were approximately the same size at 3 dpi in this two-lesion stroke model (Figure 6(a), bottom right). The experimental design was shown in Figure 6(b). After a two-lesion stroke model was created, PBS and CHP were injected twice, at 0 and 3 dpi respectively. Mouse brains were harvested at 7 dpi for the following analyses.
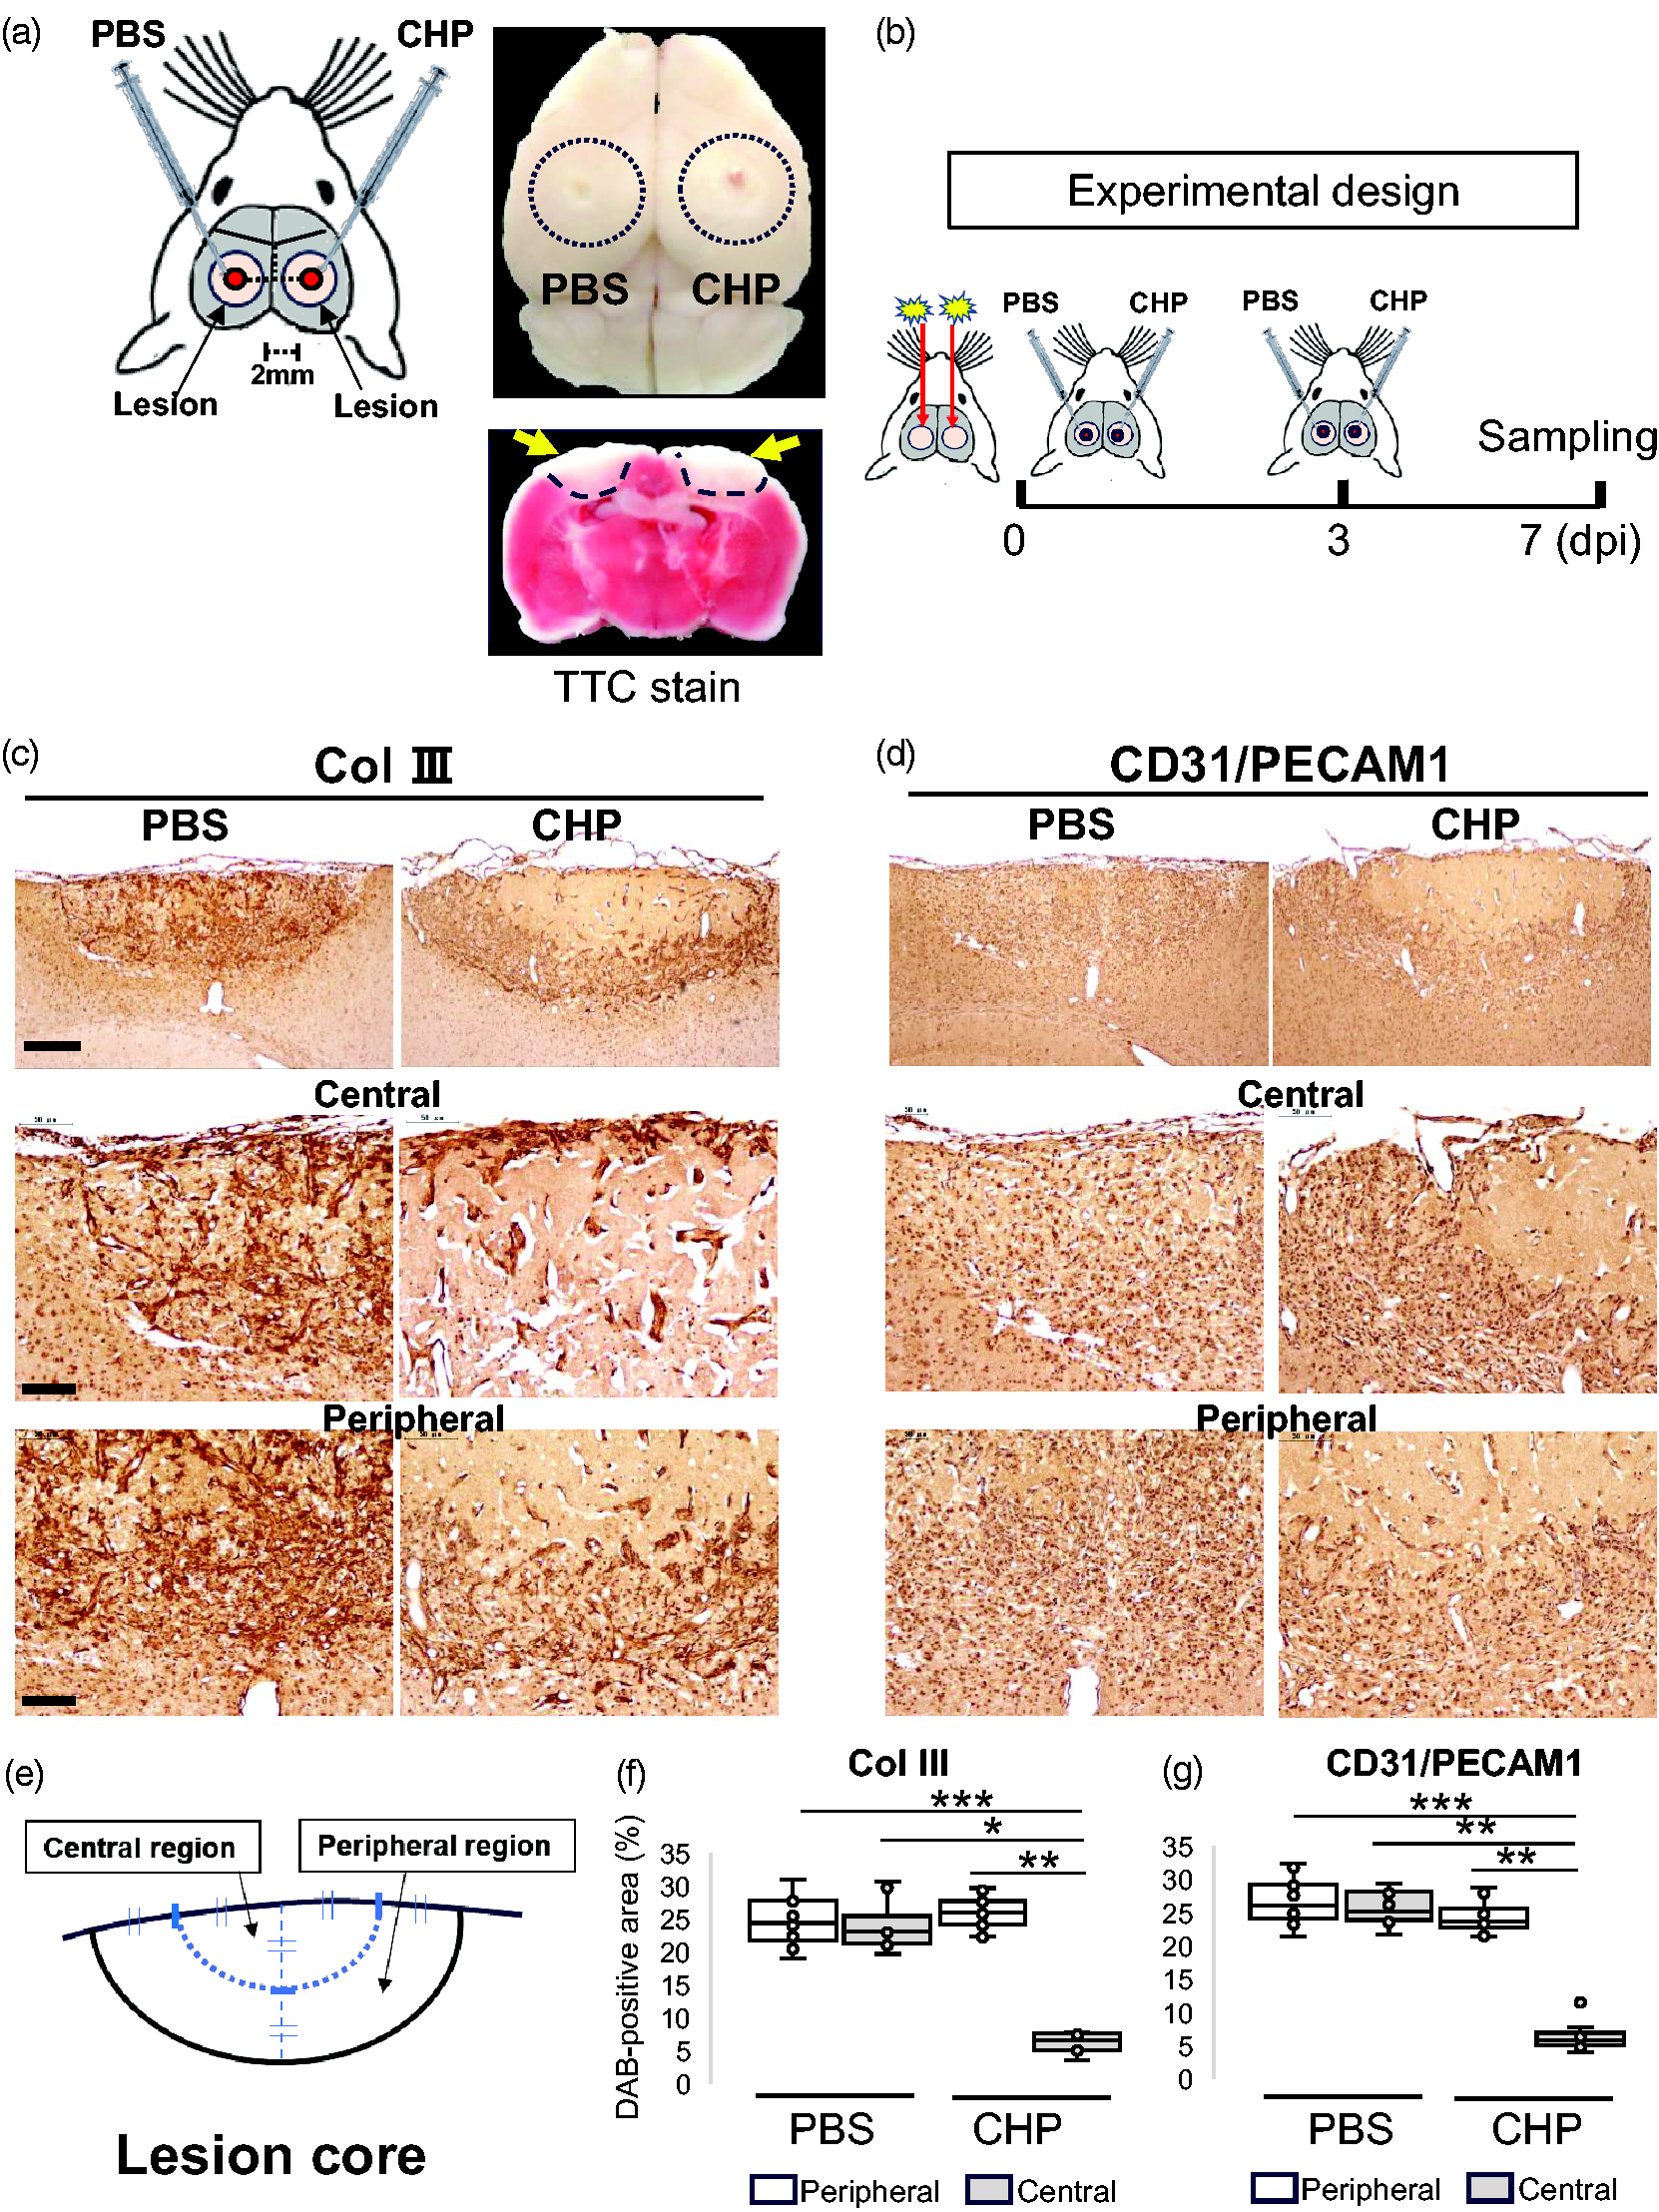
In vivo injection of collagen synthesis inhibitor using a two-lesion stroke model. (a) The schematic diagram on the left shows an experiment in which PBS and CHP were injected in the lesion core left and right respectively at 0 and 3 dpi. For injection, mice were fixed in a stereotaxic instrument with the injection point placed 2.0 mm anteriorly and 2.0 mm laterally from the bregma. The top right image shows a brain derived from a two-lesion stroke model, in which the dotted circles indicate lesions. The bottom right image shows a brain slice with 2,3,5-triphenyltetrazolium chloride (TTC) staining at 3 dpi, with the color representing the mitochondrial activity. The viable cells are stained red, while dead cells are left unstained. PBS, phosphate-buffered saline; CHP, cis-4-Hydroxy-L-proline. (b) The schematic diagram shows experimental design. After a two-lesion stroke model was created, PBS and CHP were injected in the lesion core left and right at 0 and 3 dpi, respectively. At 7 dpi, mice were sacrificed for immunostaining assays. (c)(d) Images showed brain sections that were immunostained with anti-Col III and anti-CD31/PECAM1 antibodies, Continued.respectively. Brains were derived from the two-lesion stroke model at 7 dpi, in which PBS and CHP were injected in the lesion core left and right respectively at 0 and 3 dpi. At 7 dpi, the brain was cut at the center of the scar and used for immunostaining assays in coronal brain sections. Coronal brain sections were immunnostained with anti-Col III (c) and anti-CD31/PECAM1 (d) antibodies, respectively. Sections were then subject to nuclear staining with hematoxylin. Scale bar, 100 μm (row 1), 50 μm (row 2, 3). (e) Segmentation for semi-quantification of DAB-positive area (%) on brain sections at 7 dpi. The lesion core was divided into central and peripheral regions for semi-quantification, as shown in the schematic diagram. (f)(g) The box plots showed the semi-quantification of DAB-positive areas (%) anti-Col III and anti-CD31/PECAM1 antibodies in brain sections at 7 dpi, respectively. Results were presented in box plots with medians (lines) ± IQRs with minimum and maximum data as whiskers. Individual sample data were shown as dots (n = 6). Normal distribution was confirmed by Shapiro Wilk tests, and p values were obtained with two-way ANOVA followed by Tukey HSD. *p < 0.05, **p < 0.01, ***p < 0.001. Y-axis; % DAB-positive area.
DAB-positive area (%) of anti-Col III and anti-CD31/PECAM1 antibodies were semi-quantified on the paraffin-embedded brain sections at 7 dpi, respectively (Figure 6(c) and (d)). Coronal brain sections, cut from the center of the lesion, were used for semi-quantitation. The lesion core was segmented into central and peripheral regions, and the DAB-positive area was semi-quantified in each (Figure 6(e)). Injection of collagen synthesis inhibitor CHP reduced the DAB-positive area of anti-Col III and anti-CD31/PECAM1 antibodies in the central region, respectively (Figure 6(f) and (g)).
In vivo injection of collagen synthesis inhibitor reduced LD accumulation and infarcted area
Perilipin sequester lipids by protecting LDs from intracellular lipolysis 31 and is used as a marker for cytosolic LD. To address the effect of CHP on LD accumulation, DAB-positive area (%) of anti-perilipin antibody was semi-quantified using paraffin-embedded brain sections at 7 dpi, in which PBS and CHP were injected twice at 0 and 3 dpi, respectively (Figure 7(a)). The lesion core was segmented into central and peripheral region, and the DAB-positive area was semi-quantified in each as described (Figure 6(e)). Compared with PBS injections, CHP injections reduced the DAB-positive area of anti-perilipin antibody in the central region (Figure 7(a)), suggesting an inhibitory effect of CHP on LD accumulation.
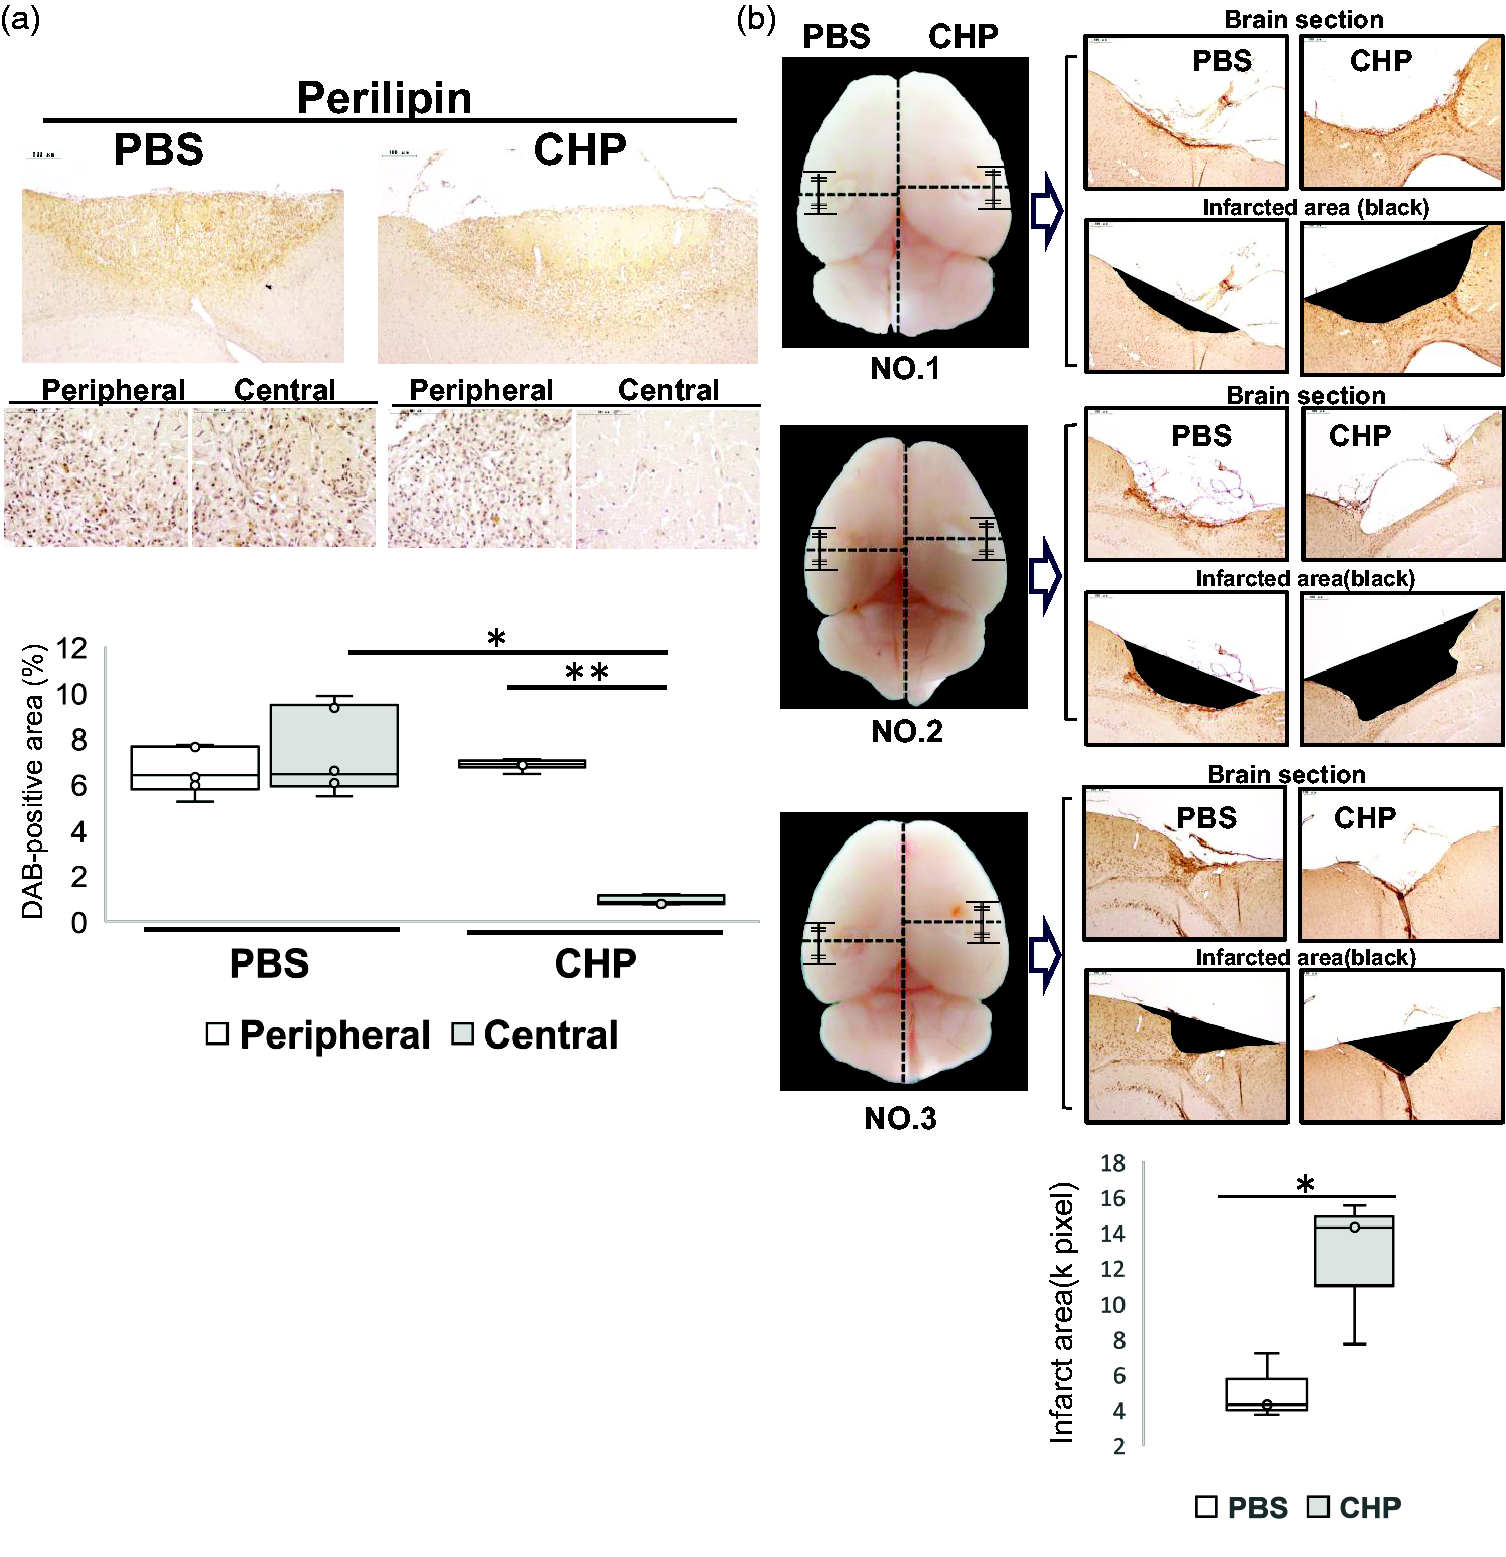
Effect of collagen synthesis inhibitor on infarcted area and LDs accumulation. (a) Brains were derived from the two-lesion stroke model at 7 dpi, in which PBS and CHP were injected in the lesion core left and right respectively at 0 and 3 dpi. At 7 dpi, the brain was cut at the center of the scar and used for immunostaining with anti-perilipin antibody in coronal brain sections. Segmentation for semi-quantification was conducted as in Figure 6(e). The box plots showed the semi-quantification of DAB-positive areas (%) with anti-perilipin antibody in brain sections at 7 dpi. Results were presented in box plots with medians (lines) ± IQRs with minimum and maximum data as whiskers. Individual sample data were shown as dots (n = 6). Normal distribution was confirmed by Shapiro Wilk tests, and p-values were obtained with two-way ANOVA followed by Tukey HSD. *p < 0.05, **p < 0.01, ***p < 0.001. Y-axis; % DAB-positive area. Scale bar, 50 μm. (b) Brains in the left column (NO. 1–3) were derived from the two-lesion stroke model at 28 dpi, in which PBS and CHP were injected twice at 0 and 3 dpi, respectively. At 28 dpi, the brain was cut at the center of the scar and was used to measure infarct areas in the coronal brain sections. The box plots showed the semi-quantification of infarct areas. Y-axis; ischemic area (k pixel). Results were presented in box plots with means (lines) ± IQRs with minimum and maximum data as whiskers. Individual sample data were shown as dots (n = 3). Normal distribution was confirmed by Q-Q plot chart and Shapiro Wilk tests (PBS, p-value = 0.484; CHP, p-value =0.486). In a two-sample t-test of unequal variances, a one-tailed test revealed statistical significance with a p-value of 0.033921. Scale bar, 100 μm.
Finally, to examine the effect of CHP on long-term scar formation, we measured the infarcted area at 28 dpi using the brain section, in which PBS and CHP were injected twice at 0 and 3 dpi respectively (Figure 7(b)). Three brain samples (NO.1-NO.3) were used for semi-quantification of infarcted area (Figure 7(b), left images). Coronal brain sections, cut from the center of the lesion core, were used to semi-quantitate the infarcted area and measured as the area of defect at 28 dpi (Figure 7(b), right images). CHP injection in the lesion core increased the area of defect at 28 dpi, compared with PBS injection (one-tailed t test p-value of 0.033921) (Figure 7(b), bottom graph).
Discussion
In the present study, we examined the spatiotemporal dynamics of Col III in the lesion core of the post-ischemic brain during fibrotic scar formation. RNA-seq analysis showed that Col3a1 was one of the most induced genes in the lesion core. GO enrichment analysis revealed that the inflammatory responses were primarily activated as well as those associated with phagosome, ECM organization, and vasculature development. We then focused on Col III that can be associated with ECM remodeling, angiogenesis and phagosome of myelin debris. Col III was induced higher than Col I in the early phase (3–14 dpi) of fibrotic scar formation by immunohistochemistry. Col III immunoreactivity was observed to surround the penetrating vasculatures from the meninges. The fibrotic mesh of Col III was prominent in the lesion core by 14–28 dpi. Iba1-positive macrophages/microglia stored LDs in the fibrillar mesh of Col III. In vivo injection of collagen synthesis inhibitor reduced Col III expression and vasculatures invading from the meninges, decreased LD accumulation, and increased infarcted area at the injection site. Collectively, our findings showed that Col III is dynamically expressed in the lesion core during fibrotic scar formation, colocalizing with angiogenesis and phagocytosed myelin debris (LDs).
The process of fibrotic scar formation in peripheral tissues consists of four stages; hemostasis, inflammation, proliferation, remodeling (maturation). 21 In this study, reticular structures of Col I and Col III were observed in the lesion core by 28 dpi, indicating that fibrotic scars are formed approximately by 28 dpi in this stroke mouse. During this period, Iba1-positive macrophages/microglia and CD31/PECAM1-positive vasculatures were accumulated especially in the ischemic border zone by 7 dpi. Iba1-positive phagocytic macrophages/microglia, storing LDs, were localized in the fibrotic mesh of Col I and Col III by 28 dpi. Based on the histological findings, fibrotic scar formation was estimated to consist of at least the inflammation (1–7 dpi), clearance (7–28 dpi) and remodeling (14–28 dpi) stages in this stroke model.
In the wound healing of peripheral tissues, the ratio of Col III to Col I is characteristic. Col III expression is higher during the healing process, while Col I expression is increased in healed wounds. 21 The gene expression is regulated by the promotors of Col I and Col III genes containing regulatory elements related to transforming growth factor beta (TGFβ). The collagen network is a metabolically active structure associated with collagen turnover. In the early stages of tissue remodeling and injury, Col III is more hydrophilic and its expression is increased because fibril formation is slower and more random. Col I builds a scaffold with thick fibers that have a low turnover rate and its maturation depends on Col III. In contrast, Col III produces fibers that are thinner, less durable, and have a higher turnover rate.21,32 Our results showed that Col III is persistently expressed during fibrotic scar formation at 14–28 dpi. The higher and persistent expression of Col III in the post-ischemic brain may contribute to the ECM remodeling and shrinkage of the lesion core.
The origin of the accumulated phagocytes in lesion core remains controversial. In the mouse stroke model, activated resident microglia predominate during the first few days, and the number of invading monocytes/macrophages gradually increases, peaking at 1-week post-stroke.8,10–12 In the present study, Iba1-positive macrophages/microglia were concentrated in the ischemic border zone at 7 dpi (Figure 3(a)). At 3–7 dpi, Iba1-positive microglia appeared to be recruited from perilesional region to the lesion core. These results were consistent with previous studies.8,10–12
It is unclear which types of stromal cells produce Col I and Col III in the lesion core in the post-stroke brain. PDGFRβ-positive fibroblast-like cells can deposit collagen in the lesion core of mouse CNS injury.1,3,7,16 PDGFRβ+ mural cells are highly reactive to inflammatory signals in ischemia. Microvascular pericytes detached from the blood vessel wall as early as 1 h after in the mouse stroke model.3,18 In this study, PDGFRβ-positive cells were partially colocalized with Col III immunoreactivity (Figure 5(c)). Collagen-producing PDGFRβ+ fibroblast-like cells have been shown to express nestin and vimentin in the lesion core of rat brain injury model.4,19 In this study, co-immunofluorescence assays showed that some PDGFRβ-positive cells were positive for anti-vimentin antibody, suggesting that PDGFRβ-positive fibroblast-like cells are one of candidates for Col III secretion. There is also evidence to suggest that fibroblast-like cells migrate from adjacent meninges into injury sites in a rodent spinal cord contusion model. 19 These studies suggest that the origin of fibroblast-like cells is dependent on injury type. Based on our histochemistry, fibroblast-like cells also may be able to migrate along infiltrating vasculature from the meninges in this stroke model. Collectively, fibroblast-like cells derived from PDGFRβ-positive pericytes3,7 as well as fibroblasts infiltrating from the meninges into ischemic lesion 19 can deposit fibrotic ECM in our stroke model.
Integrins are major collagen receptors in a variety of biological processes, including proliferation, differentiation, and migration. Fibrous isoforms of Col I and Col III can preferentially interact with α2β1 integrin present in fibroblasts and mesenchyme, which plays an important role in cell adhesion, migration, and signal transduction.22,23 Moreover, integrins are important cell adhesive receptors involved in monocyte/macrophage migration. β2 integrin family are exclusively expressed on leukocytes consisting of four members: αLβ2 (CD11a/CD18), αMβ2 (CD11b/CD18), αXβ2 (CD11c/CD18), and αDβ2 (CD11d/CD18). 22 In particular, integrins such as αDβ2 and αMβ2 regulate the migratory properties of monocyte/macrophages. 33 These β2 integrin-mediated adhesion can inhibit amoeboid and mesenchymal macrophage migration or support mesenchymal migration in tissue. Thus, the integrins influence the balance between pro-inflammatory (M1) and anti-inflammatory (M2) macrophages, affecting their movement and accumulation in damaged tissues. In the present study, Iba-1 positive phagocytes were observed to store LDs in the fibrillar mesh of Col I and Col III in the lesion core. Although the expression level of integrins is unknown, integrins such as α2β1 on the fibroblast-like cells can interact with Col I and Col III in the fibrillar mesh of the lesion core. Moreover, β2 integrin-mediated adhesion may influence migration and balance between pro-inflammatory and anti-inflammatory state in microglia/macrophages of the lesion core.
Infarcted regions are transiently infiltrated by immature angiogenic vessels in humans and experimental stroke models. 3 Angiogenesis is the formation of new blood vessels from pre-existing ones and critical for ECM remodeling and wound healing. It is carefully controlled, in which collagen can play significant roles. 18 Col IV is well known to be involved in early vascular morphogenesis and constitutes the basal membrane (BM), 17 but the role of Col III remains poorly understood in sprouting angiogenesis. In this study, we found a characteristic expression pattern of Col III around penetrating vasculatures from the meninges, which might correspond to sprouting angiogenesis.20,34 Sprouting angiogenesis is characterized by enzymatic degradation of BM and endothelial cells (ECs) activation and migration within the interstitial matrix. While the general importance of ECM in ECs migration, proliferation, survival, and angiogenesis is well studied, the relative importance and significance of specific collagen fibers in supporting these processes is less clear. Col I supports and induces ECs migration while Col IV is involved in proper lumen formation and vascular integrity, indicating the role of ECM collagens providing guidance cues for ECs migration in regenerative angiogenesis.20,35 In this study, in vivo injection of collagen synthesis inhibitor reduced the sprouting angiogenesis in the injection site as well as Col III expression. Col I maturation depends on Col III,21,32 suggesting that Col III can provide support and guidance for ECs through Col I maturation in the angiogenesis. Alternatively, Col III can serve as a distinct support and guide for ECs in the post-ischemic brain due to its properties of being thinner and less durable fiber with a higher turnover rate.
In the present study, collagen synthesis inhibitor increased the infarcted area at 28 dpi. It is hypothesized that the inhibitor reduced the myelin debris clearance and angiogenesis through inhibiting collagen synthesis, which resulted in an increase in infarcted area. Although fibrotic scar inhibits axonal regeneration in the CNS, the absence of a fibrotic scar inhibits closure of the spinal transection site in rodent spinal injury models.1,2,17 The significance of fibrotic scarring is therefore a double-edged sword, and this may also be the same in the post-stroke brain.
MCAO (Middle Cerebral Artery Occlusion) and photothrombosis (PT) are two commonly used mouse models in ischemic stroke research. 36 Both models have advantages and disadvantages and are suitable for different research purposes. The MCAO model faithfully recapitulates ischemic stroke due to occlusion of the MCA in humans and is of high clinical relevance. It affects a wider range of brain regions, thus providing a broader view of pathophysiology. However, it is technically complex, requires expertise and is prone to variation due to differences in vascular anatomy between mice. In contrast, the PT model is highly reproducible, as the size and location of the ischemic lesion can be precisely controlled through the use of light-sensitive Rose Bengal and lasers. Compared with the MCAO model, it is simpler and quicker to perform and is particularly useful for studying specific brain regions with focal ischemia. Nevertheless, it has limited clinical relevance because artificially formed thrombi are different from spontaneous strokes.
The empirical results reported herein should be considered in the light of limitations. This study is a morphological analysis only, and the molecular biological mechanism is unknown. Further studies are needed to identify the cells that produce Col III and the signaling pathways that promote its production and to analyze its relationship to other collagen family members. Identification of signaling pathways between Col III and angiogenesis or myelin debris is also needed.
In conclusion, this study showed that Col III is dynamically expressed in the lesion core colocalizing with angiogenesis and LDs, suggesting its involvement in angiogenesis and phagocytosis of myelin debris during fibrotic scar formation.
Supplemental Material
sj-pdf-1-jcb-10.1177_0271678X251366820 - Supplemental material for Dynamic expression of type III collagen in the lesion core of post-ischemic brain colocalizing with angiogenesis and lipid droplets during fibrotic scar formation
Supplemental material, sj-pdf-1-jcb-10.1177_0271678X251366820 for Dynamic expression of type III collagen in the lesion core of post-ischemic brain colocalizing with angiogenesis and lipid droplets during fibrotic scar formation by Tohru Mutoh, Keiko Kitajo and Atsushi Yamaguchi in Journal of Cerebral Blood Flow & Metabolism
Supplemental Material
sj-pdf-2-jcb-10.1177_0271678X251366820 - Supplemental material for Dynamic expression of type III collagen in the lesion core of post-ischemic brain colocalizing with angiogenesis and lipid droplets during fibrotic scar formation
Supplemental material, sj-pdf-2-jcb-10.1177_0271678X251366820 for Dynamic expression of type III collagen in the lesion core of post-ischemic brain colocalizing with angiogenesis and lipid droplets during fibrotic scar formation by Tohru Mutoh, Keiko Kitajo and Atsushi Yamaguchi in Journal of Cerebral Blood Flow & Metabolism
Footnotes
Funding
The author(s) disclosed receipt of the following financial support for the research, authorship, and/or publication of this article: This work was supported by research grants from the Japan Society for the Promotion of Science (#G21K06729).
Declaration of conflicting interests
The author(s) declared no potential conflicts of interest with respect to the research, authorship, and/or publication of this article.
Authors’ contributions
A.Y. conceived and designed the project. A.Y., T.M., K.K. performed and analyzed the experiments. A.Y. wrote the manuscript.
Supplemental material
Supplemental material for this article is available online.
References
Supplementary Material
Please find the following supplemental material available below.
For Open Access articles published under a Creative Commons License, all supplemental material carries the same license as the article it is associated with.
For non-Open Access articles published, all supplemental material carries a non-exclusive license, and permission requests for re-use of supplemental material or any part of supplemental material shall be sent directly to the copyright owner as specified in the copyright notice associated with the article.