






Abstract
Diabetic retinopathy is a leading cause of visual impairment among working-age adults. Given the multiple pathophysiologic functions of bradykinin and its links to vascular endothelial growth factor (VEGF) and atrial natriuretic peptide (ANP) signaling, we hypothesized their interconnected involvement in the development of retinal vascular permeability in early-stage diabetic retinopathy. Diabetic mice, bradykinin type 2 receptor (B2R) knock-out diabetic mice, and their non-diabetic controls underwent magnetic resonance imaging, fluorescein angiography, vascular permeability measurements, retinal ELISA, Western blot, qPCR, and immunohistochemistry, glycemic assessments, and evaluation of intraocular and blood pressure. Diabetes upregulated B2R expression without altering retinal bradykinin levels. B2R deficiency in diabetic mice unexpectedly exacerbated vascular permeability but ameliorated retinal thinning and ganglion cell loss. B2R-deficient animals had decreased VEGF and VEGF receptor-2 levels, despite increased gene expression, indicating a regulatory effect on protein synthesis. Both diabetes and B2R deficiency, especially the latter, increased ANP and guanylyl cyclase/natriuretic peptide receptor-A levels and their gene expression. This study provides new insights into the interplay between bradykinin, VEGF, and ANP in diabetic retinopathy. It highlights a regulatory role of B2R in VEGF and ANP signaling, suggesting targets for future research on vascular permeability and neuroprotection in early-stage diabetic retinopathy.
Introduction
Diabetic retinopathy (DR) is an important microvascular complication of diabetes mellitus, causing visual impairment in working-age adults.1,2 It is characterized by capillary hypoperfusion, leukostasis, and capillary degeneration, leading to retinal ischemia, microaneurysm formation, increased blood-retinal barrier (BRB) permeability, diabetic macular edema (DME), exudates, hemorrhages, and neuronal dysfunction. 3 Advanced DR stages involve ischemia-induced neovascularization and fibrovascular proliferation, risking vitreous hemorrhage and retinal detachment. 4
Preventive and therapeutic strategies such as glycemic and blood pressure control, as well as retinal laser photocoagulation, significantly reduce the incidence and progression of DR and DME.5 –7 Vascular endothelial growth factor (VEGF) plays a crucial role in DR and DME development, increasing vascular permeability, and promoting angiogenesis.8 –11 Anti-VEGF therapies have shown great success and have become a cornerstone in treating DME and proliferative DR.12 –15 However, despite these advances, not all patients respond to anti-VEGF therapy, and concerns about potential neurodegenerative effects from chronic VEGF inhibition have emerged, prompting increased efforts to identify alternative and adjunct therapeutic options.16 –21
Recent studies identified several alternative pathways involved in vascular permeability and/or neovascularization. Natriuretic peptides, acting through guanylyl cyclase/natriuretic peptide receptor-A (GC-A/NPRA) and the cGMP signaling system, protect pericytes and reduce VEGF hypersecretion from astrocytes, thus mitigating neovascularization. 22 Interestingly, while natriuretic peptides inhibit VEGF production, VEGF inhibits natriuretic peptide secretion, suggesting a complex interplay between these pathways.22 –24 Additionally, GC-A agonists, including atrial natriuretic peptide (ANP), elevated concentrations of which have been detected in the vitreous humor of DR patients, serve as natural antagonists to bradykinin, the main effector of the kallikrein-kinin system, which is highly implicated in DR and DME development through its vascular and pro-inflammatory effects.25 –29 Injecting vitreous samples from DME patients with high kallikrein and low VEGF levels into the eyes of diabetic rats increases vascular permeability which is, notably, preventable by bradykinin receptor antagonists but not by an anti-VEGF drug bevacizumab. 30 Research also indicates that while VEGF receptor-2 (VEGFR-2) inhibition does not impact bradykinin-induced retinal edema, systemic plasma kallikrein inhibition significantly reduces VEGF-induced retinal edema, suggesting both an independent role for bradykinin in DME pathophysiology and an interaction with the VEGF pathway.28,31
Given the roles and potential interconnections of VEGF, bradykinin, and ANP in the pathophysiology of DR and DME, further investigation into these factors and their interactions is warranted.23,25,28,32 This study explored the effects of bradykinin type 2 receptor (B2R) loss on the signaling pathways of VEGF and ANP and on the development of retinal vascular permeability in type 1 diabetes mellitus Ins2Akita mouse model of early diabetic retinopathy.33,34
Methods
All procedures received ethical approval from the Ethics Licensing Committee of the University of Zagreb School of Medicine and the Ethics Committee for the protection of animals used for scientific purposes of the Ministry of Agriculture Republic of Croatia (no. 380-59-10106-18-111/49). Experiments adhered to the Croatian Animal Protection Act (NN 102/17, 32/19), Amendments to the Animal Protection Act (NN 37/13), and the Guidelines on the Protection of Animals Used for Scientific Purposes (NN 55/13) in line with the European Directive 2010/63/EU and ARRIVE guidelines. 35 Experimental group assignments were randomized with a lottery drawing box. All procedures and data analyses were performed by investigators blinded to animal genotypes and experimental grouping. Key resources essential for reproducing the results are provided in Supplemental Material (Supplemental Table 1).
Experimental animals
The study involved 2–6 months old male diabetic C57BL/6-Ins2Akita/J (Akita, n = 18; RRID: IMSR_JAX: 003548), diabetic B2R knock-out B6.Cg-Ins2Akita/Bdkrb2tm1Jfh/SmiJ (Akita/B2R-KO, n = 18; RRID: IMSR_JAX: 006860), and their non-diabetic controls: wild type C57BL/6J (WT, n = 18; RRID: IMSR_JAX: 000664) and B2R knock-out B6; 129S7-Bdkrb2tm1Jfh/J (B2R-KO, n = 18; RRID:IMSR_JAX: 002641 backcrossed to C57BL/6J) mice. Mice were procured from The Jackson Laboratory (Bar Harbor, USA), bred at the Croatian Institute for Brain Research, University of Zagreb School of Medicine and backcrossed for over 15 generations. The mice were housed under standardized conditions (22 °C ± 2 °C, 12-h light–dark cycle) with free access to food and water. Genotypes were confirmed with PCR upon separation by sex at 1.5 months of age.
Assessment of glycemic status
At 2 and 6 months of age, tail blood samples were collected to measure glucose concentration, HbA1c levels, and conduct intraperitoneal glucose tolerance test (IPGTT), as previously described. 36 Blood glucose was measured before and after a 6-h daytime fasting period using the Rightest glucose meter (GM550; Bionime, Taiwan), while HbA1c levels were determined using the HbA1CNow® Self Check (PTS Diagnostics, USA). Additionally, WT and B2R-KO mice underwent IPGTT with 1 g/kg body weight of 20% glucose solution (Braun, Germany) administered via intraperitoneal injection (i.p.), followed by blood glucose measurements at 15, 30, 60, and 120 min. Akita and Akita/B2R-KO mice were exempted from the IPGTT due to risk of inducing diabetic coma.
Non-invasive measurement of blood and intraocular pressure
Blood pressure and intraocular pressure (IOP) were measured in anesthetized mice at 2 and 6 months of age, following established protocols. 36 Anesthesia was induced with 4% isoflurane (Isoflurane; Piramal Critical Care, USA) in a 70% N2/30% O2 gas mixture, then maintained at 2% isoflurane. Normothermia (38.5 °C ± 0.5 °C) was ensured using a feedback-controlled heating pad (medres—medical research GmbH, Germany). Respiratory rate (90–100 breaths/min) was monitored with an optical probe (medres—medical research GmbH, Germany). IOP was measured with a Tonolab tonometer (Icare, Finland), obtaining six measurements per eye within 5 min post-anesthesia. After the measurements, ophthalmic lubricant (Recugel®; Bausch and Lomb, Canada) was applied to prevent corneal desiccation. Blood pressure was measured using the CODA Surgical Monitor system (Kent Scientific, USA), with 20 measurement cycles, 5-s intervals between cycles, and a 20-s occlusion cuff relaxation period.
Fluorescein angiography
Fluorescein angiography was performed at 2 and 6 months of age, preceding MRI sessions, using a smartphone ophthalmoscopy setup. 36 Mice were anesthetized in a heated chamber with 4% isoflurane in a 70% N2/30% O2 gas mixture, then maintained at 2% isoflurane. For optimal visualization, vibrissae were taped and pupils were dilated with 1% tropicamide eye drops (Mydriacyl; Alcon, Switzerland). Body temperature was continuously monitored using a CODA rectal temperature probe. Artificial tears (0.4%, Vizol S; JGL d.d., Croatia) were applied, followed by a subcutaneous injection of 10 µl of 10% sodium fluorescein (NAF; Alcon, Switzerland). Images were captured with a smartphone (Samsung, South Korea) mounted onto an Olympus SZ-STU2 dissecting microscope (Olympus Corp., Japan), used in combination with a handheld 90D optical lens (Volk Optical, Inc, USA). An excitation/emission filter pair for fluorescein angiography was also mounted onto the microscope via custom adjustable holders, the excitation filter (483 nm, Edmund Optics, USA) positioned in front of the light source, and the emission filter (535 nm, Edmund Optics, USA) placed in front of the smartphone camera.
Semi-automated measurements of retinal vessel diameter, tortuosity, and capillary perfusion area were performed on fluorescein angiograms, using an open-source machine-learning plugin in FIJI/ImageJ v.1.53c. Vessel diameters were measured 0.5–1.0 disc diameters from the optic disc margin and normalized to optic disc diameter. The capillary area was analyzed in a predefined region of interest (ROI) and expressed as arbitrary units.
Magnetic resonance imaging
MRI was conducted using a 7T system (BioSpec 70/20 USR with Paravision 6.0.1; Bruker Biospin, Germany) configured in a Tx/Rx setup with an 86 mm transmit volume coil and a two-element mouse brain surface receive coil, following protocols for anatomical and angiographic imaging, data processing, and analysis as previously described.36,37 Anesthesia was induced with 4% isoflurane (Piramal Critical Care, Germany) in a 30% O2/70% N2 mixture and maintained at 1.5%–2% isoflurane. Respiratory rate was kept at 80–100 breaths/min, monitored with an optical probe (medres—medical research GmbH, Germany), and body temperature was maintained at 37 °C ± 0.5 °C with an MR-compatible rectal temperature probe and a feedback-controlled heating pump (medres—medical research GmbH, Germany). Imaging sessions followed fluorescein angiography. T2-weighted eye images were acquired using a TurboRARE sequence (TE/TR = 28/2500 ms; resolution 0.06 × 0.06 mm; slice thickness 0.4 mm; interslice distance 0.1 mm; nine slices), with the central slice bisecting the eye’s center and optic nerve sagittally to minimize partial-volume effects due to retinal curvature. T2-maps were generated using an MSME sequence (TE/TR = 9/2500 ms; resolution 0.08 × 0.08 mm; slice thickness 0.4 mm; interslice distance 0.1 mm; 25 slices), and T2 values were calculated with Paravision 6.0.1 software. Additionally, angiographic images were obtained using a 3D FLASH (3D-TOF) sequence (TE/TR = 2.1/12.0 ms, flip angle 25°, resolution 0.08 × 0.08 × 0.2 mm3). Each imaging session lasted ~60 min/mouse.
Images were analyzed semi-automatically using FIJI/ImageJ1.53i software by investigators blinded to the experimental groups. Retinal thickness was measured using a single T2-weighted MRI slice intersecting the eye’s center and optic nerve. Measurements were taken at predefined points 30° above and below the optic nerve head. Precise segmentation was performed on subsampled T2-weighted images with sub-pixel accuracy.
Quantitative measurements of T2 relaxation time (spin-spin relaxation) in individual voxels of the retina using a built-in macro in ImageJ calculated the average signal intensity across the entire retina volume using T2-weighted images and T2 maps. The T2-weighted image defined an ROI marking the eye’s edges. The displacement between T2-weighted images and T2 maps was calculated. The macro used ROIs for measuring retinal thickness at three points above and below the optic nerve, adjusted the T2 map resolution to match the T2-weighted image, and moved the ROIs according to the calculated displacement. Average T2 values were measured with integrated subsampling (factor 3) in individual ROIs and within retinal surfaces outlined by two polygonal shapes generated from the individual ROIs below and above the optic nerve.
Angiograms from 3D-TOF scans were analyzed via maximum intensity projections (MIP) to visualize and assess vasculature with high blood flow velocity. Vessel volume for each ophthalmic artery was assessed using a standardized cuboidal 3D region of interest (ROI). Analysis was performed using an open-source machine learning plugin within FIJI/ImageJ-v.1.53c, which included thresholding and image binarization, as previously described.37,38 Results were expressed as vessel volume (mm3).
Blood–retinal barrier permeability assessment using Evans blue and sodium fluorescein
Evans blue (EB; Merck, Germany) and sodium fluorescein (NAF; Alcon, Switzerland) were used to assess blood-retinal barrier permeability at 6 months of age, as described previously. 36 Permeability was indirectly assessed by measuring retinal tissue fluorescence intensity ex vivo with the IVIS® Spectrum system (Perkin Elmer, USA). Two hours before imaging, mice received a tail vein injection of 2% EB in saline (50 mg/kg). Ten minutes before imaging, 10 µl of 10% NAF was administered subcutaneously. Upon completion of the circulation period, mice were anesthetized with 2.5% tribromomethanol (Avertin; Sigma–Aldrich) at 250 mg/kg i.p., and perfused transcardially with 30 ml of phosphate-buffered saline (PBS). Retinas were isolated from enucleated eyes under subdued lighting and placed in a Petri dish with 10 µl PBS for imaging. EB fluorescence was captured at 640 nm excitation and 720 nm emission, while NAF fluorescence was recorded at 465 nm excitation and 520 nm emission.
To measure the concentration of applied dyes, EB and NAF were extracted from collected retinal samples. Retinas were placed in tubes with 100 µl of PBS at room temperature and homogenized using an ultrasonic homogenizer (Q55 Sonicator®; Qsonica, USA) with short pulses. Equal volumes of 100% trichloroacetic acid (TCA; Merck, Germany) were added to the homogenized tissue. The homogenization process was repeated, and samples were incubated for 1 h at 37 °C in an HB-96D Witeg tube heater (Witeg Labortechnik GmbH, Germany). After incubation, samples were centrifuged at 12,000g for 20 min at 25 °C. For each retina, 50 µl of the supernatant was pipetted into three wells of a 96-well plate (Falcon, USA). Fluorescence of EB was measured at excitation/emission wavelengths of 640/720 nm, and NAF at 465/520 nm. EB and NAF concentrations were calculated using standard fluorescence curves in 50% TCA.
Retinal tissue isolation for ELISA, Western blot, and qPCR
Mice were anesthetized with an i.p. of 2.5% tribromomethanol (Avertin; Sigma–Aldrich, USA) at a dose of 250 mg/kg, and transcardially perfused with PBS. Eyes were enucleated, cornea and lens removed, and retinas isolated for further processing using a modification of a previously described method. 39 Details are provided in Supplemental Methods.
ELISA
Bradykinin, VEGF, and ANP levels in retinal lysates (diluted 4×) were quantified using ELISA kits (ab100662 and ab136936; Abcam, Cambridge, UK; EIA-ANP; RayBiotech, Norcross, GA, USA). All standards and samples were assayed in duplicate, with absorbances read at 450 nm using a GloMax® plate reader (Promega, Madison, WI, USA). Concentrations were calculated according to the manufacturer’s instructions and expressed (pg/ml).
Western blot
Relative protein expression of B2R, bradykinin type 1 receptor (B1R), and GC-A was analyzed by Western blot, as previously described.40,41 See Supplemental Methods for details.
qPCR
Relative expression of genes, including genes for B1R (Bdkrb1), B2R (Bdkrb2), ANP (Nppa), GC-A/NPRA (Npr1), VEGF (Vegfa), and VEGFR-2 (Kdr), was determined using qPCR, as previously described.40,41 Details are provided in Supplemental Methods.
Immunohistochemistry and data analysis
Animals were anesthetized with 2.5% tribromoethanol, transcardially perfused, and fixed. The eyes were enucleated, processed, and analyzed as described previously.36,37 Staining for B2R, B1R, VEGF, VEGFR-2, ANP, and GC-A was performed on cryosections from four animals per group. For colocalization, second primary antibodies were used against cluster of differentiation 31 (CD31) as an endothelial cell marker, cellular retinaldehyde-binding protein (CRALBP) as a Müller cell marker, and neuronal nuclei (NeuN) as a ganglion cell marker. Nuclei were stained with DAPI. Four images per section were captured at 40× magnification using the Olympus FLUOVIEW FV3000 confocal microscope with the accompanying software FV31-SW Fluoview (Olympus, Japan). Image analysis was performed with ImageJ 1.53i. Three regions of interest (ROIs) per image were analyzed for protein expression. Colocalization was imaged at 60× magnification. Retinal ganglion cell counts were performed in ROIs enclosing the retinal ganglion cell layer. Details are provided in Supplemental Methods and Table 1.
Statistical analysis and sample size
Based on preliminary data, a power analysis using G*Power software (Heinrich-Heine-Universität Düsseldorf, Germany) determined that six animals per genotype were needed to detect significant differences in retinal thickness using a two-sided Mann–Whitney U test (power = 0.8, α = 0.05). 42 Data were analyzed using GraphPad Prism 9.4.0 (GraphPad Software, USA). Normality was assessed with the Shapiro–Wilk test. A mixed-model two-way analysis of variance (ANOVA) was used to assess baseline glucose, fasting glucose, IPGTT, HbA1c, body weight, IOP, systolic, diastolic, and mean arterial pressure, heart rate, arteriole and venule diameter and tortuosity, capillary area, ophthalmic artery volume, retinal thickness, and average T2 value, with age and genotype as variables. Post hoc comparisons between genotypes were made using Tukey’s test, and within-genotype using Šidak’s post hoc test. The expression of Bdkrb2 gene, B2R band signal intensity, and B2R+-fluorescent signal area were assessed using Student’s t-test. One-way ANOVA with multiple comparison corrections, controlling for false discovery rate at α = 0.05, was used to evaluate EB and NAF extravasation and concentration, expression of Bdkrb1, Nppa, Npr1, Vegfa, and Kdr genes, bradykinin, ANP and VEGF concentration, B2R, B1R and GC-A band signal intensity, B1R+, ANP+, GC-A+, VEGF+, and VEGFR-2+ fluorescent signals, and NeuN+ ganglion cell count. Statistical significance was set as p < 0.05.
Results
B2R deficiency modulates basic metabolic parameters and intraocular pressure in diabetes
To assess the effects of diabetes and B2R deficiency on glycemic status, body mass, IOP, and blood pressure, we examined mice at 2 and 6 months of age (Figure 1). At 2 months old, B2R-KO and WT mice were normoglycemic, while Akita, and Akita/B2R-KO mice exhibited hyperglycemia, which persisted at 6 months (p < 0.0001; Figure 1(a)). Akita and Akita/B2R-KO mice had elevated HbA1c levels (p < 0.0001), with Akita/B2R-KO mice showing worse long-term glycemic status (p < 0.01; Figure 1(b)). IPGTT results indicated altered glucose metabolism in young B2R-KO mice (Figure 1(c)). Diabetic mice had significantly lower body mass at 2 months (p < 0.01). All groups gained weight by 6 months (p < 0.0001). B2R-KO mice gained more body mass than WT (p < 0.0001), and Akita/B2R-KO more than Akita mice (p < 0.001; Figure 1(d)). IOP was higher in Akita mice compared to Akita/B2R-KO mice (p < 0.01), with no significant differences between non-diabetic groups (Figure 1(e)). Blood pressure measurements showed no differences in systolic, diastolic, and mean arterial pressures at 2 months (Figure 1(f)–(h)). At 6 months, Akita mice had lower systolic, diastolic, and mean arterial pressures compared to younger Akita and WT animals (p < 0.05 and p < 0.001, respectively), with no differences among other groups. In summary, B2R deficiency worsened long-term glycemic control in diabetic mice and promoted weight gain across genotypes. It also mitigated diabetes-induced elevation in intraocular pressure, without affecting systemic blood pressure. These results indicate that B2R modulates metabolic and IOP homeostasis in a context-dependent manner.
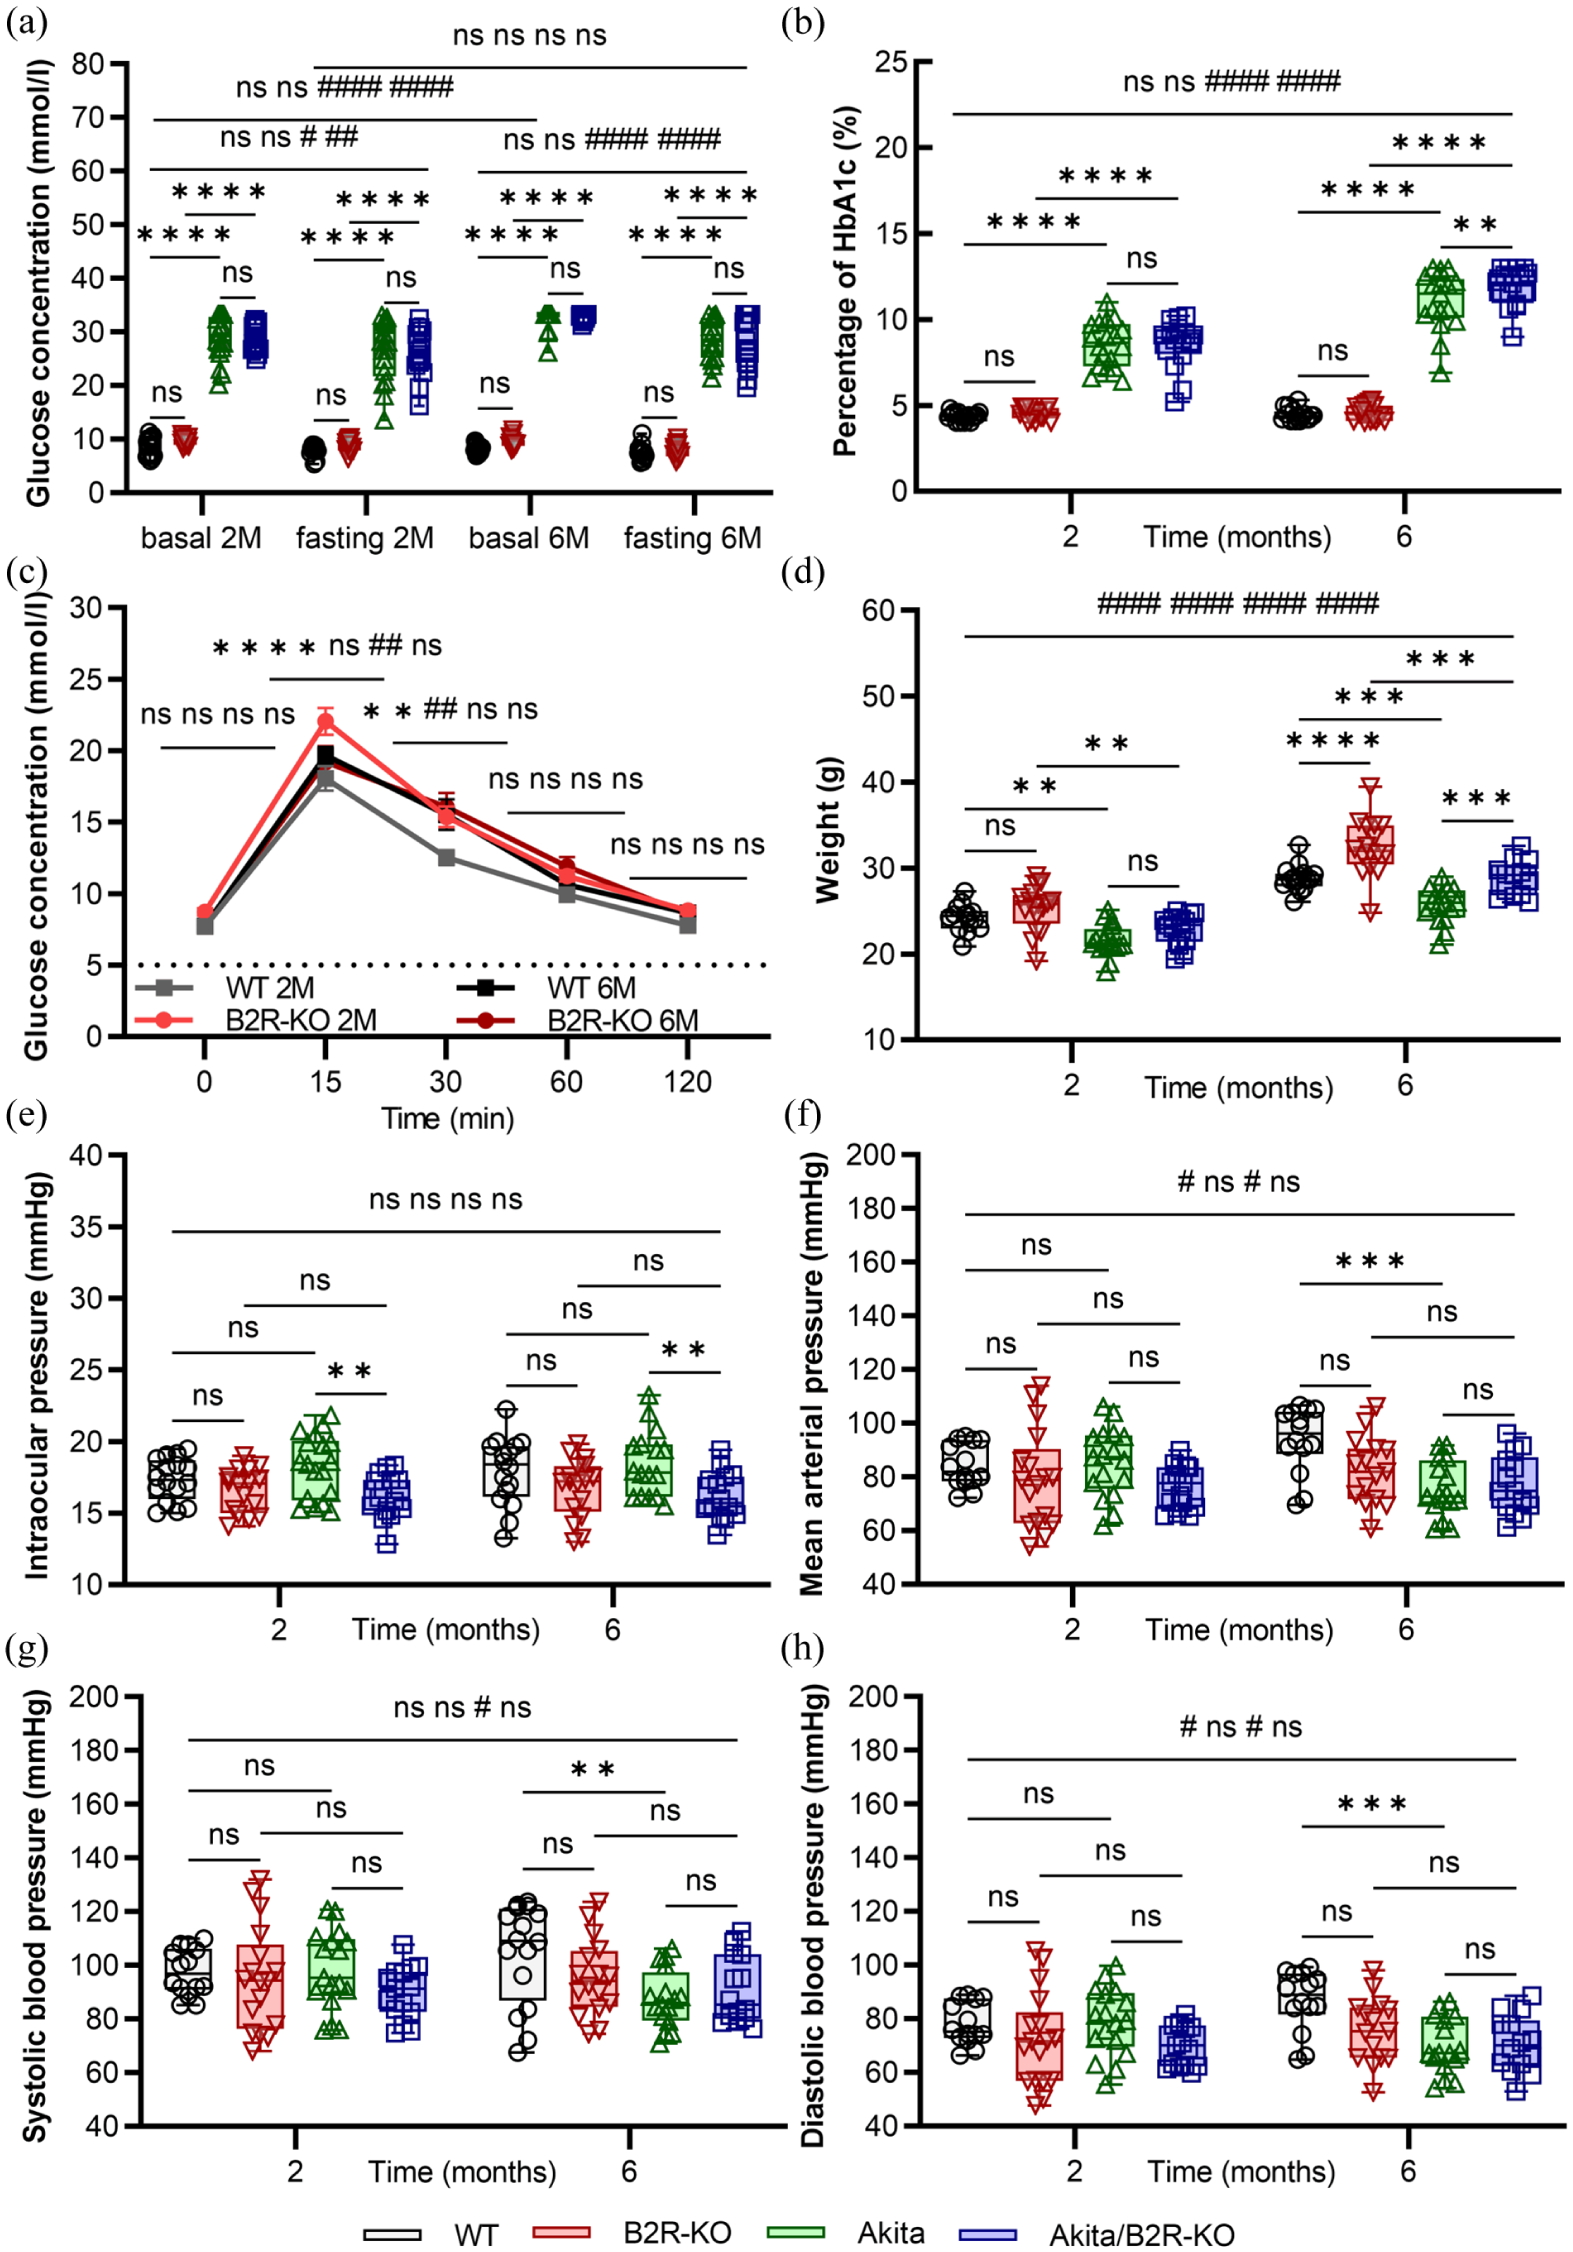
Diabetes and B2R deficiency impact glycemic status, body weight, and intraocular pressure. (a) Elevated glucose concentrations at 2 and 6 months and (b) higher percentage of HbA1c in diabetic mice, further elevated by B2R deficiency. (c) B2R deficiency alters glucose uptake, as shown by the intraperitoneal glucose tolerance test in young non-diabetic B2R mice. (d) Diabetic mice exhibit reduced body weight, while B2R deficiency significantly increases body weight in older mice. (e) B2R deficiency lowers intraocular pressure in diabetic mice. (f–h) Diabetes lowers systolic, diastolic, and mean arterial pressure in older animals. Values are presented as median and interquartile range or mean ± standard error. Statistically significant differences among genotypes, using mixed model ANOVA with Tukey’s post hoc test: *p < 0.05. **p < 0.01. ***p < 0.001. ****p < 0.0001. Differences within genotypes, using mixed model ANOVA with Sidak post hoc test: #p < 0.05. ##p < 0.01. ####p < 0.0001. ns: nonsignificant.
Both B2R deficiency and diabetes impair retinal microvascular perfusion
Fluorescein angiography showed no obvious leakage in any group (Figure 2(a)), suggesting no neovascularization or locally visible BRB disruption, though limitations of resolution and signal-to-noise ratio should be considered. The effects of diabetes and B2R deficiency were quantitatively evaluated on retinal vessel diameter and tortuosity, as well as capillary area. Capillary area analysis revealed that WT mice had a larger capillary network perfusion area than Akita and B2R-KO (p < 0.0001) mice (Figure 2(b)). Aging decreased the perfused capillary area in WT mice, but it remained larger than in Akita (p < 0.0001) and B2R-KO (p < 0.001) mice. B2R deficiency did not further affect the perfused capillary area in diabetic animals. At 2 months, WT mice had significantly wider arterioles compared to Akita mice (p < 0.05), but aging reduced arteriolar diameter in WT mice, nullifying group differences (Figure 2(c)). Arteriolar tortuosity was similar across 2 month olds but was significantly lower in 6-month-old Akita/B2R-KO mice compared to Akita (p < 0.01) and B2R-KO (p < 0.001) mice (Figure 2(d)). Venular measurements at 2 months showed wider venules in WT mice compared to Akita (p < 0.01) and B2R-KO (p < 0.05) mice, with Akita/B2R-KO mice having wider venules than Akita mice (p < 0.05). This difference disappeared with age (Figure 2(e)). Venular tortuosity showed no significant differences at either age (Figure 2(f)). In short, both diabetes and B2R deficiency were associated with a reduction in retinal capillary perfusion area and venular diameter, indicating impaired microvascular function.
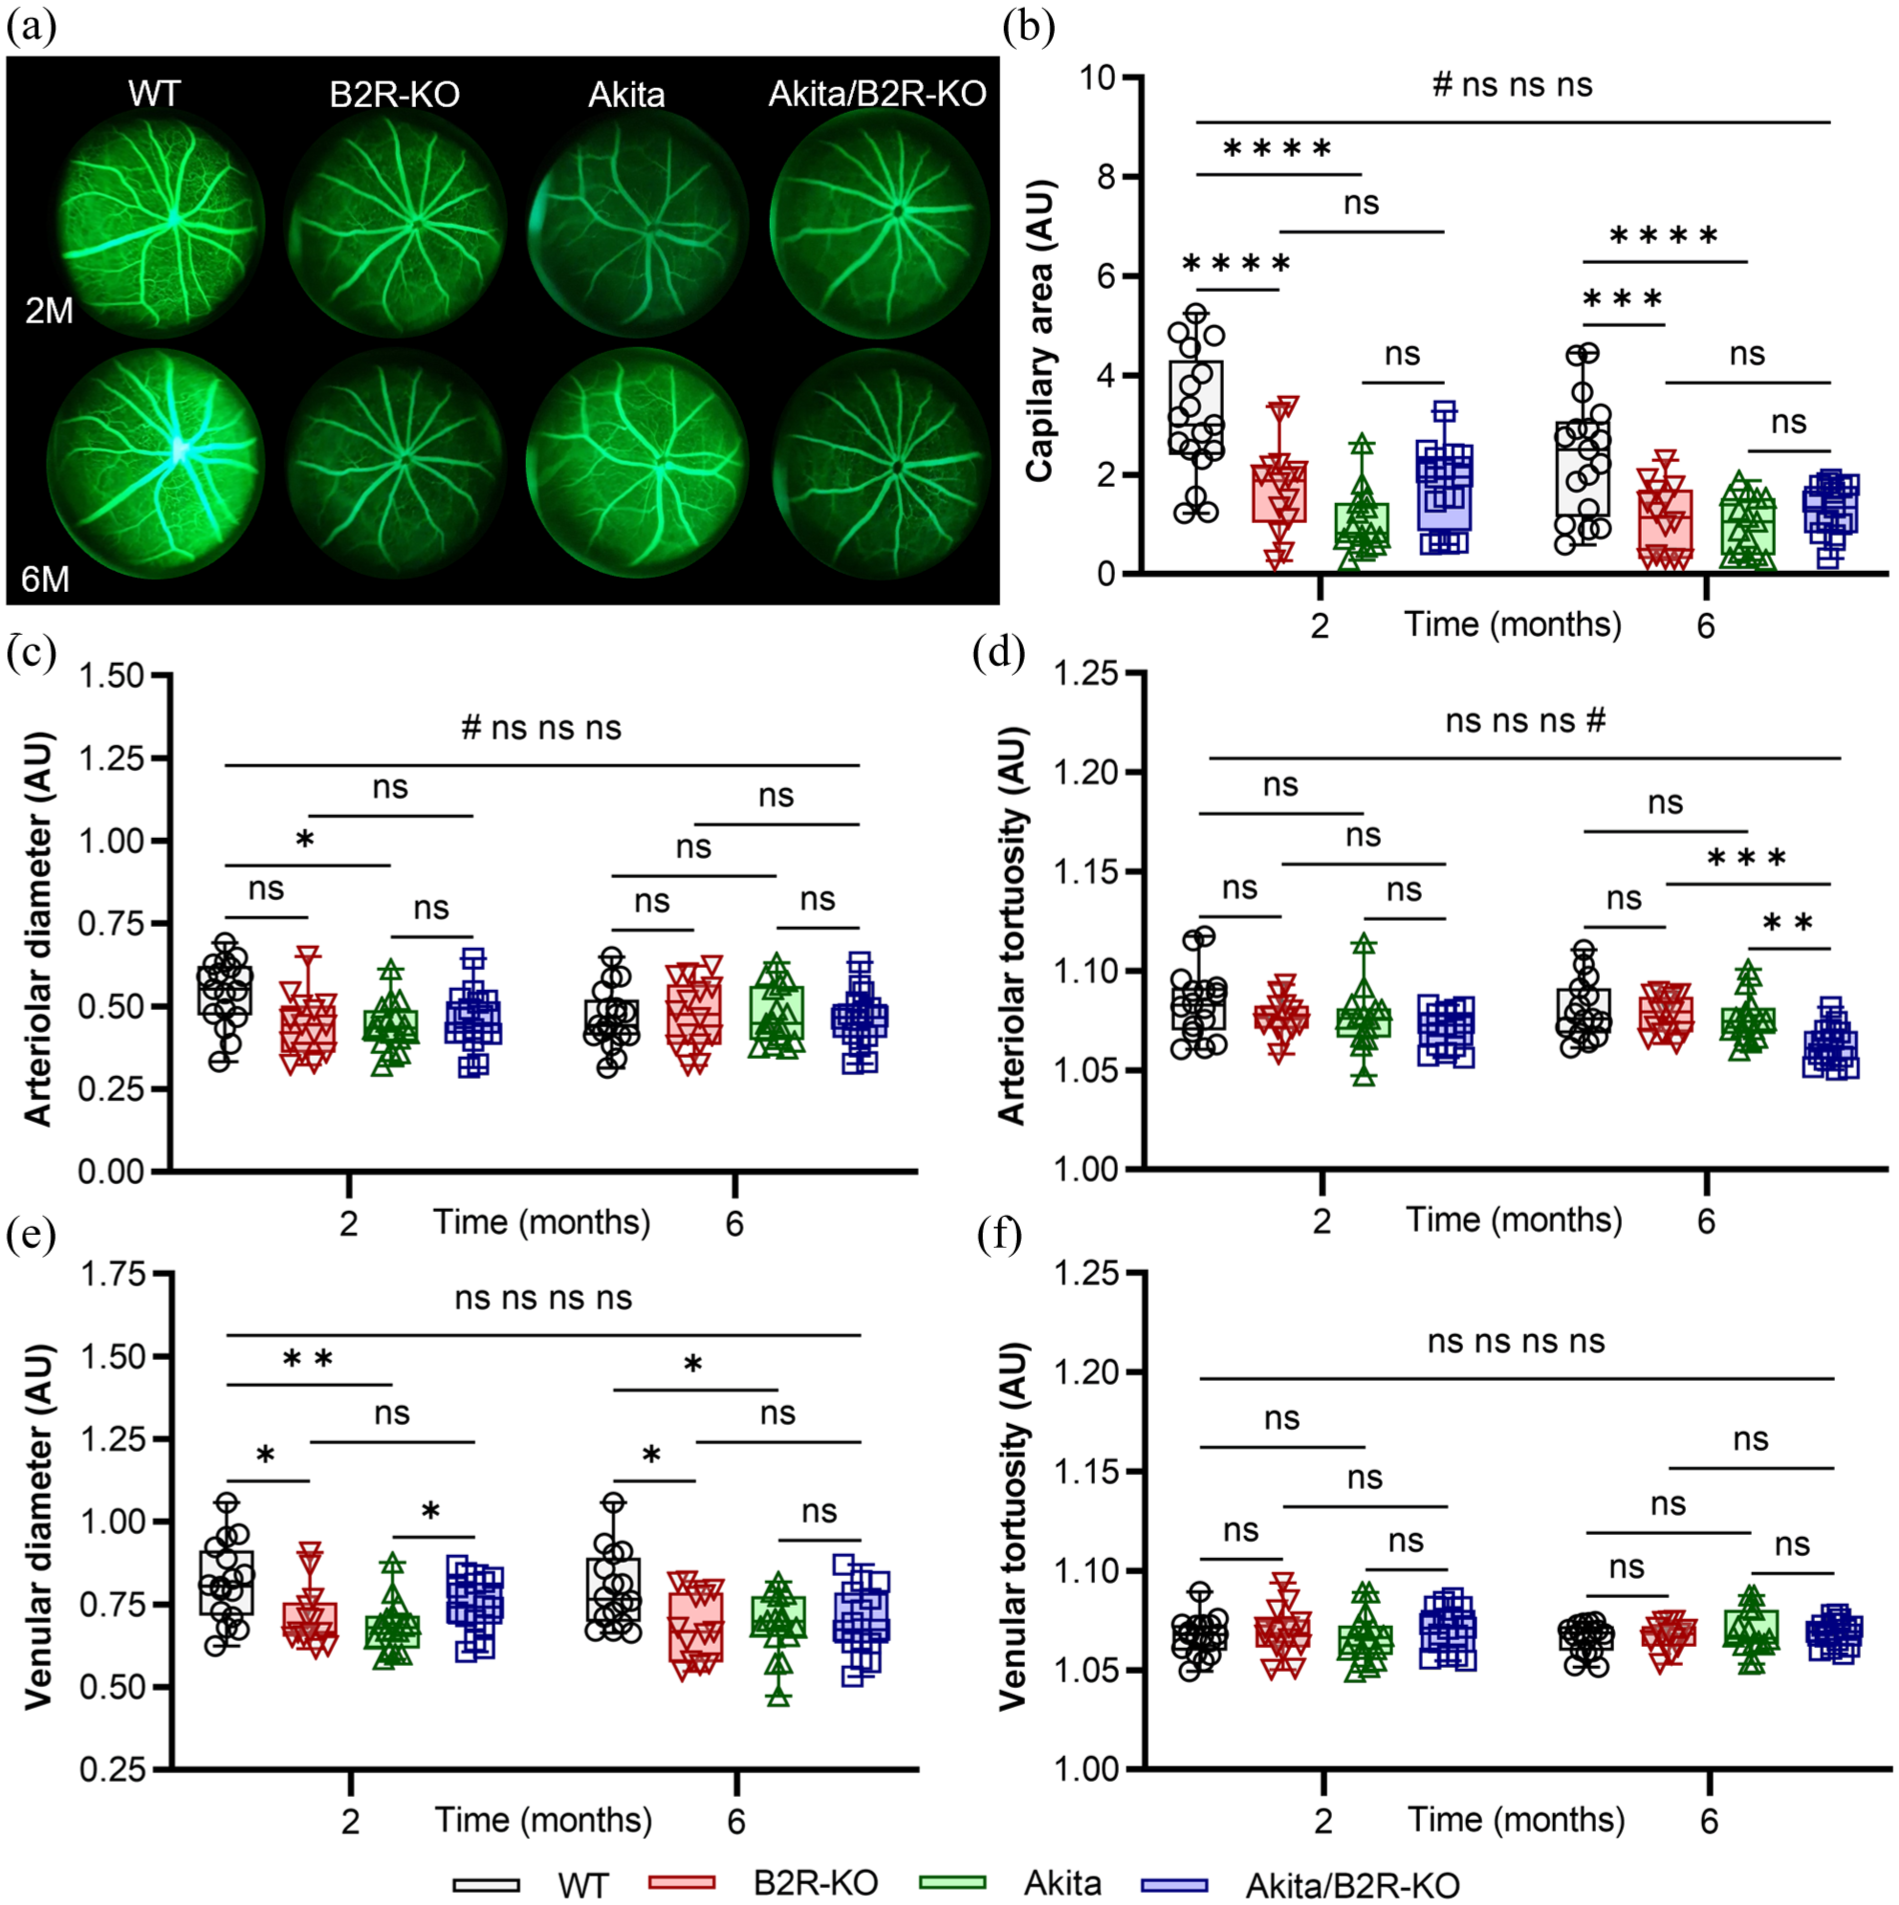
Diabetes and B2R deficiency reduce retinal venular diameter and capillary network perfusion area. (a) Representative fundus angiograms of 2- and 6-month-old animals. (b) Diabetes and B2R deficiency reduce the retinal capillary perfusion network area. (c) B2R deficiency does not affect, but diabetes reduces the diameter of retinal arterioles. (d) B2R deficiency affects retinal arteriolar tortuosity in diabetic mice with age. (e) Diabetes and B2R deficiency impact retinal venular diameter. (f) Diabetes and B2R deficiency do not affect retinal venular tortuosity. Values are presented as median and interquartile range. Statistically significant differences among genotypes, using mixed model ANOVA with Tukey’s post hoc test: *p < 0.05. **p < 0.01. ***p < 0.001. ****p < 0.0001. Differences within genotypes, using mixed model ANOVA with Sidak post hoc test: #p < 0.05. ns: nonsignificant.
B2R deficiency exacerbates vascular permeability but attenuates neurodegeneration in diabetes
The impact of diabetes and B2R deficiency on retinal morphology, edema, and ophthalmic artery perfusion was assessed using high-resolution MRI imaging (Figure 3(a)). At 6 months, mean retinal thickness was significantly lower in the Akita and non-diabetic B2R-KO groups compared to WT (p < 0.05), but higher in Akita/B2R-KO group than in Akita (p < 0.01) and non-diabetic B2R-KO groups (p < 0.01; Figure 3(b)). T2 values were lower in Akita/B2R-KO compared to Akita and non-diabetic B2R-KO groups (p < 0.05; Figure 3(c)). 3D MIP reconstructions showed significantly reduced ophthalmic artery volume in B2R-KO mice compared to WT (p < 0.05), but this was not observed in diabetic Akita/B2R-KO mice compared to Akita (Figure 3(d)).
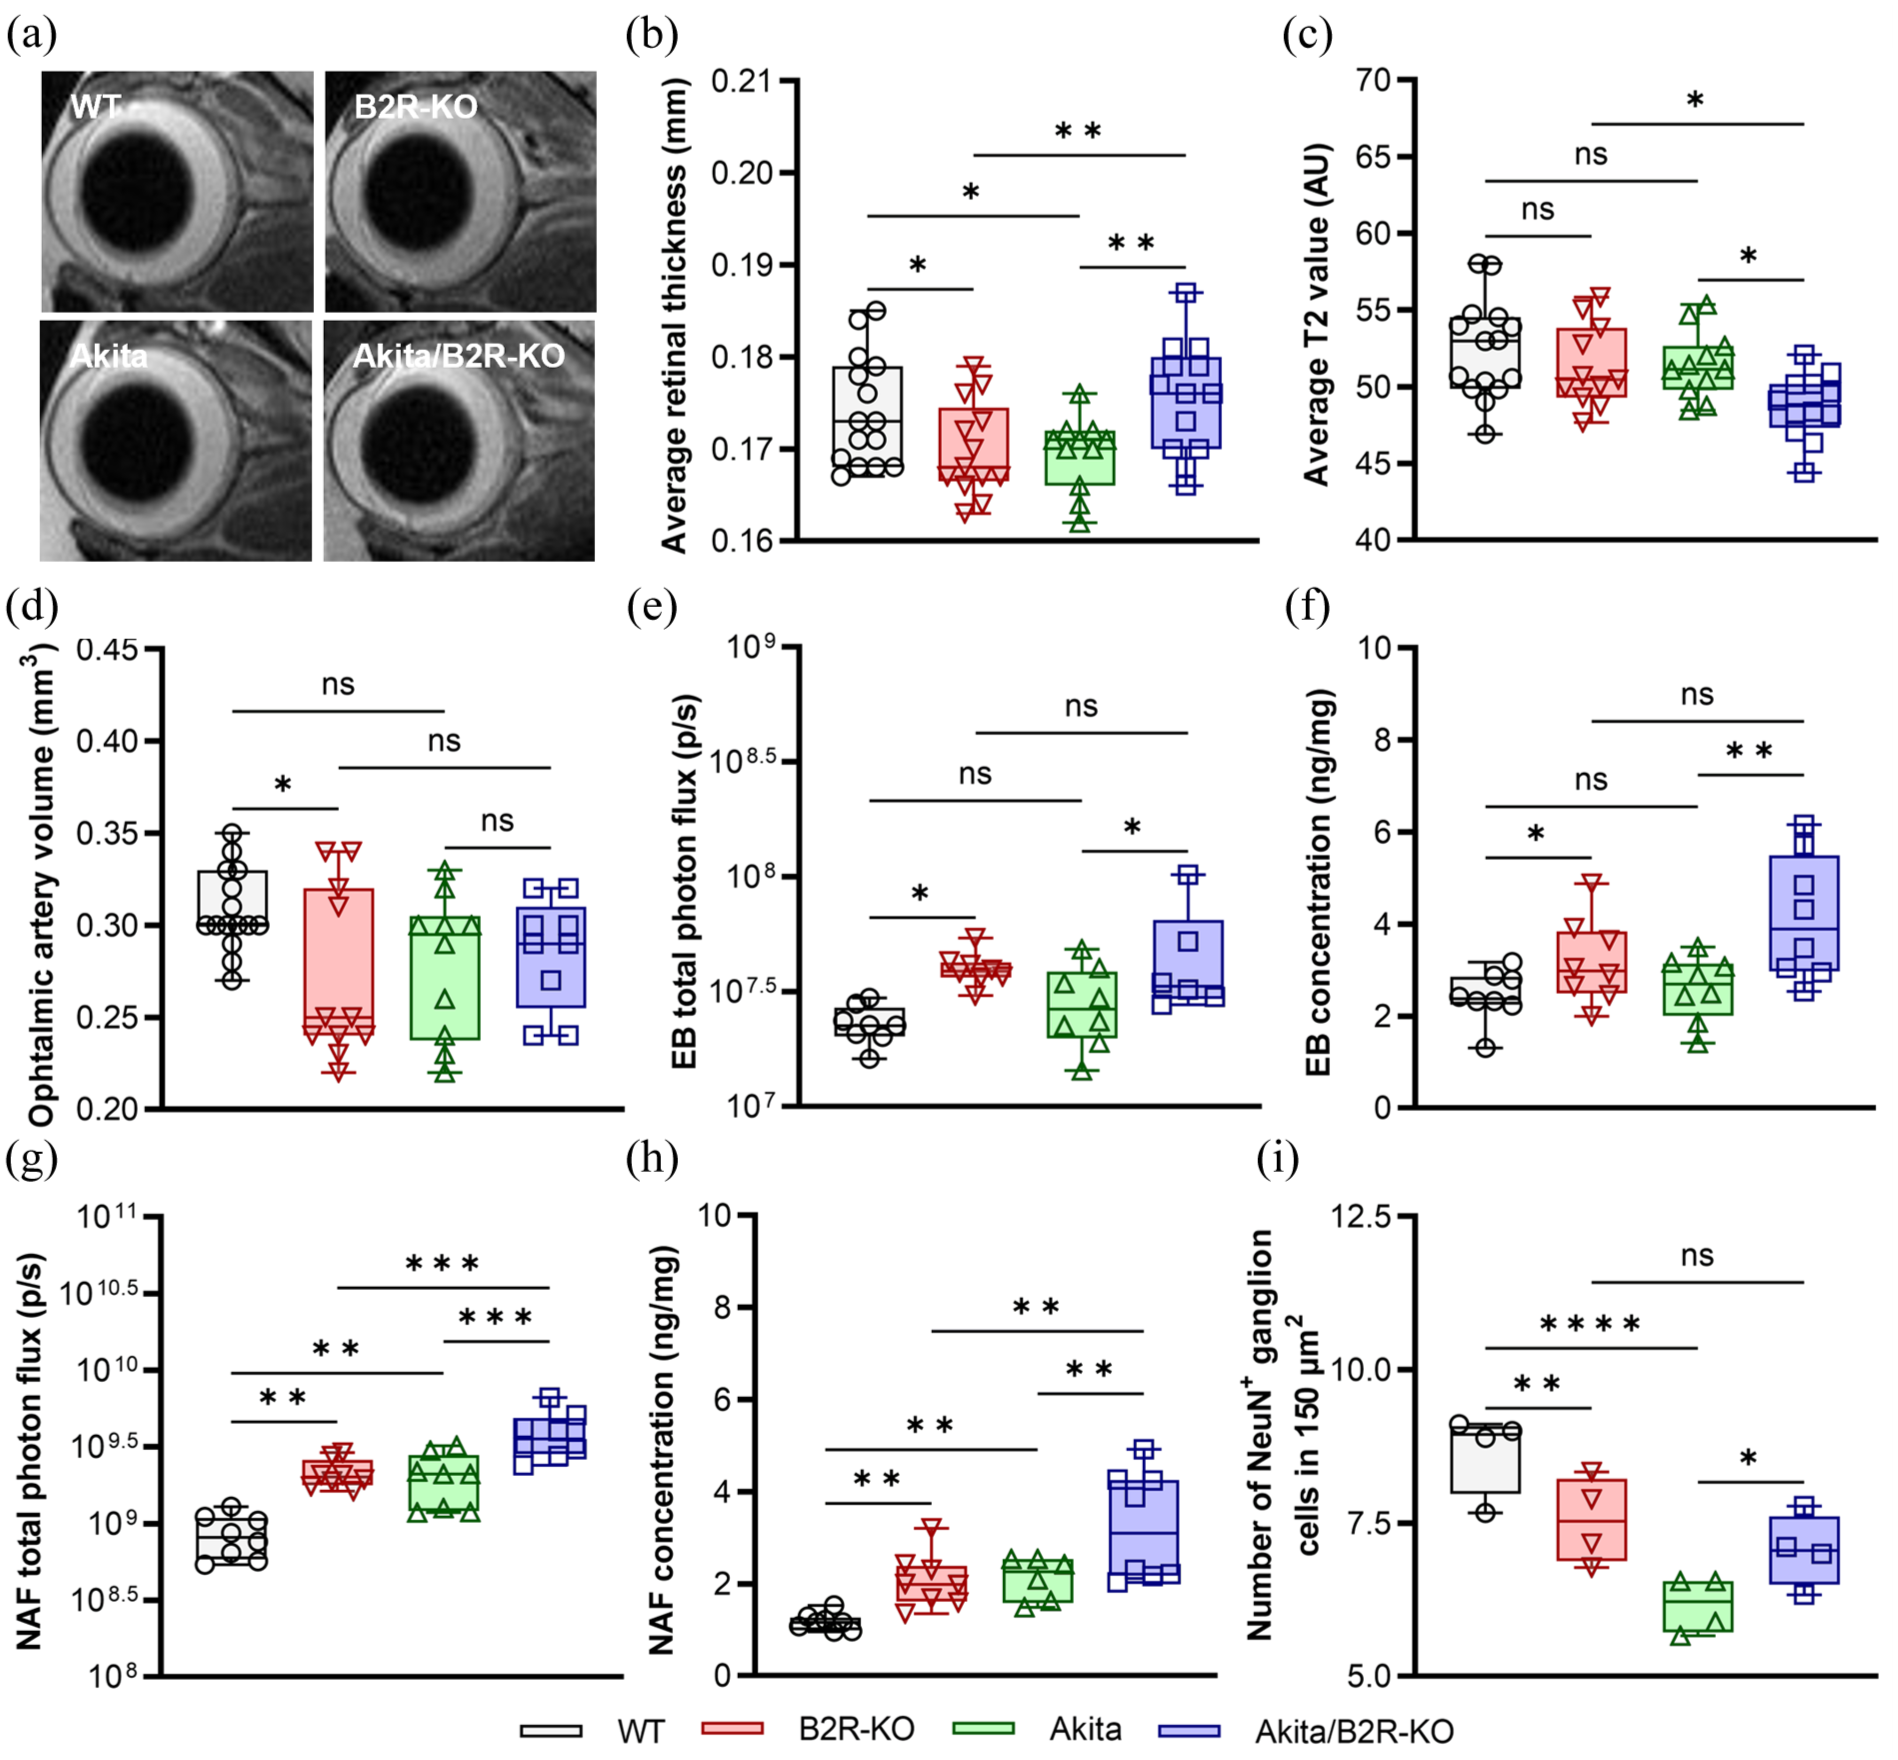
B2R deficiency exacerbates vascular permeability but ameliorates ganglion cell loss and retinal thinning caused by diabetes. (a) Representative T2-weighted images of the eye. (b) Diabetes and B2R deficiency significantly reduce retinal thickness, while B2R deficiency in diabetic animals cancels out this reduction. (c) B2R deficiency significantly reduces mean T2 values in diabetic retinas. (d) B2R deficiency reduces ophthalmic artery volume in non-diabetic mice. (e) B2R deficiency significantly increases high-molecular-weight EB extravasation, independent of the presence of diabetes. (f) B2R deficiency significantly increases retinal EB concentrations, independent of diabetes. (g) Diabetes and B2R deficiency significantly increase low-molecular-weight NAF extravasation. (h) Diabetes and B2R deficiency significantly increase retinal NAF concentrations. (i) Diabetes and B2R deficiency significantly reduce ganglion cell numbers, while B2R deficiency in diabetes mitigates this reduction. Values are presented as median and interquartile range. Statistically significant differences among genotypes, using mixed model ANOVA with Tukey’s post hoc test or with multiple comparison correction controlling the false discovery rate (α = 0.05): *p < 0.05. **p < 0.01. ***p < 0.001. ****p < 0.0001. ns: nonsignificant.
BRB permeability was assessed by EB and NAF fluorescence. Increased EB fluorescence, indicating albumin extravasation, was shown in Akita/B2R-KO and B2R-KO animals compared to controls (p < 0.05; Figure 3(e)), consistent with higher EB concentration in these groups (p < 0.01, p < 0.05; Figure 3(f)). NAF fluorescence indicated more low-molecular-weight molecule leakage in Akita/B2R-KO compared to Akita (p < 0.001) and in Akita compared to WT (p < 0.01; Figure 3(g)). B2R deficiency alone also increased NAF fluorescence (p < 0.01) but less so than in Akita/B2R-KO mice (p < 0.001), consistent with NAF concentration findings (Figure 3(h)).
Diabetes and B2R deficiency significantly reduced ganglion cell numbers (p < 0.0001, p < 0.01; Figure 3(i)), while B2R deficiency in diabetes mitigated this reduction (p < 0.05). To summarize, B2R deficiency increased blood-retinal barrier permeability in both non-diabetic and diabetic mice, as shown by enhanced leakage of both albumin-bound and small molecules. However, in diabetic mice, B2R deficiency partially protected against retinal thinning and ganglion cell loss, suggesting a complex, differential role of B2R signaling under diabetic versus non-diabetic conditions.
B2R deficiency upregulates B1R expression
To assess the impact of diabetes and B2R deficiency on retinal bradykinin concentrations quantitative ELISA was performed, revealing no differences among the groups (Figure 4(a)). qPCR, immunohistochemistry, and Western blot were used to evaluate the impact of diabetes on Bdkrb2 gene expression and B2R protein levels in Akita and WT mice, as Bdkrb2 transcription was absent in the Akita/B2R-KO and B2R-KO groups. Bdkrb2 mRNA expression was higher in Akita mice compared to WT (p < 0.05; Figure 4(b)). B2R protein expression, indicated by the B2R+ immunofluorescent signal area, was significantly elevated in Akita mice (p < 0.001; Figure 4(c) and (e)), corroborated by Western blot results (p < 0.05; Figure 4(d)). Bdkrb1 gene expression and B1R protein levels were evaluated in all study groups. Bdkrb1 mRNA expression was unchanged in Akita but higher in B2R-KO mice compared to WT (p < 0.0001) and in Akita/B2R-KO mice compared to Akita (p < 0.001; Figure 5(a)). B1R protein expression, indicated by B1R+ immunofluorescent signal area, was significantly elevated in both Akita (p < 0.001) and B2R-KO mice compared to WT mice (p < 0.01; Figure 5(b) and (d)), corroborated by Western blot results (p < 0.0001 and p < 0.05; Figure 5(c)), and further elevated in Akita/B2R-KO mice compared to both Akita (p < 0.0001 and p < 0.05) and B2R-KO mice (p < 0.0001 and p < 0.0001; Figure 5(b)–(d)). In brief, while bradykinin levels remained unchanged, diabetes increased both B2R and B1R expression, while B2R deficiency led to a strong rise in B1R expression, especially in diabetic mice, pointing to a compensatory response between the two receptors.
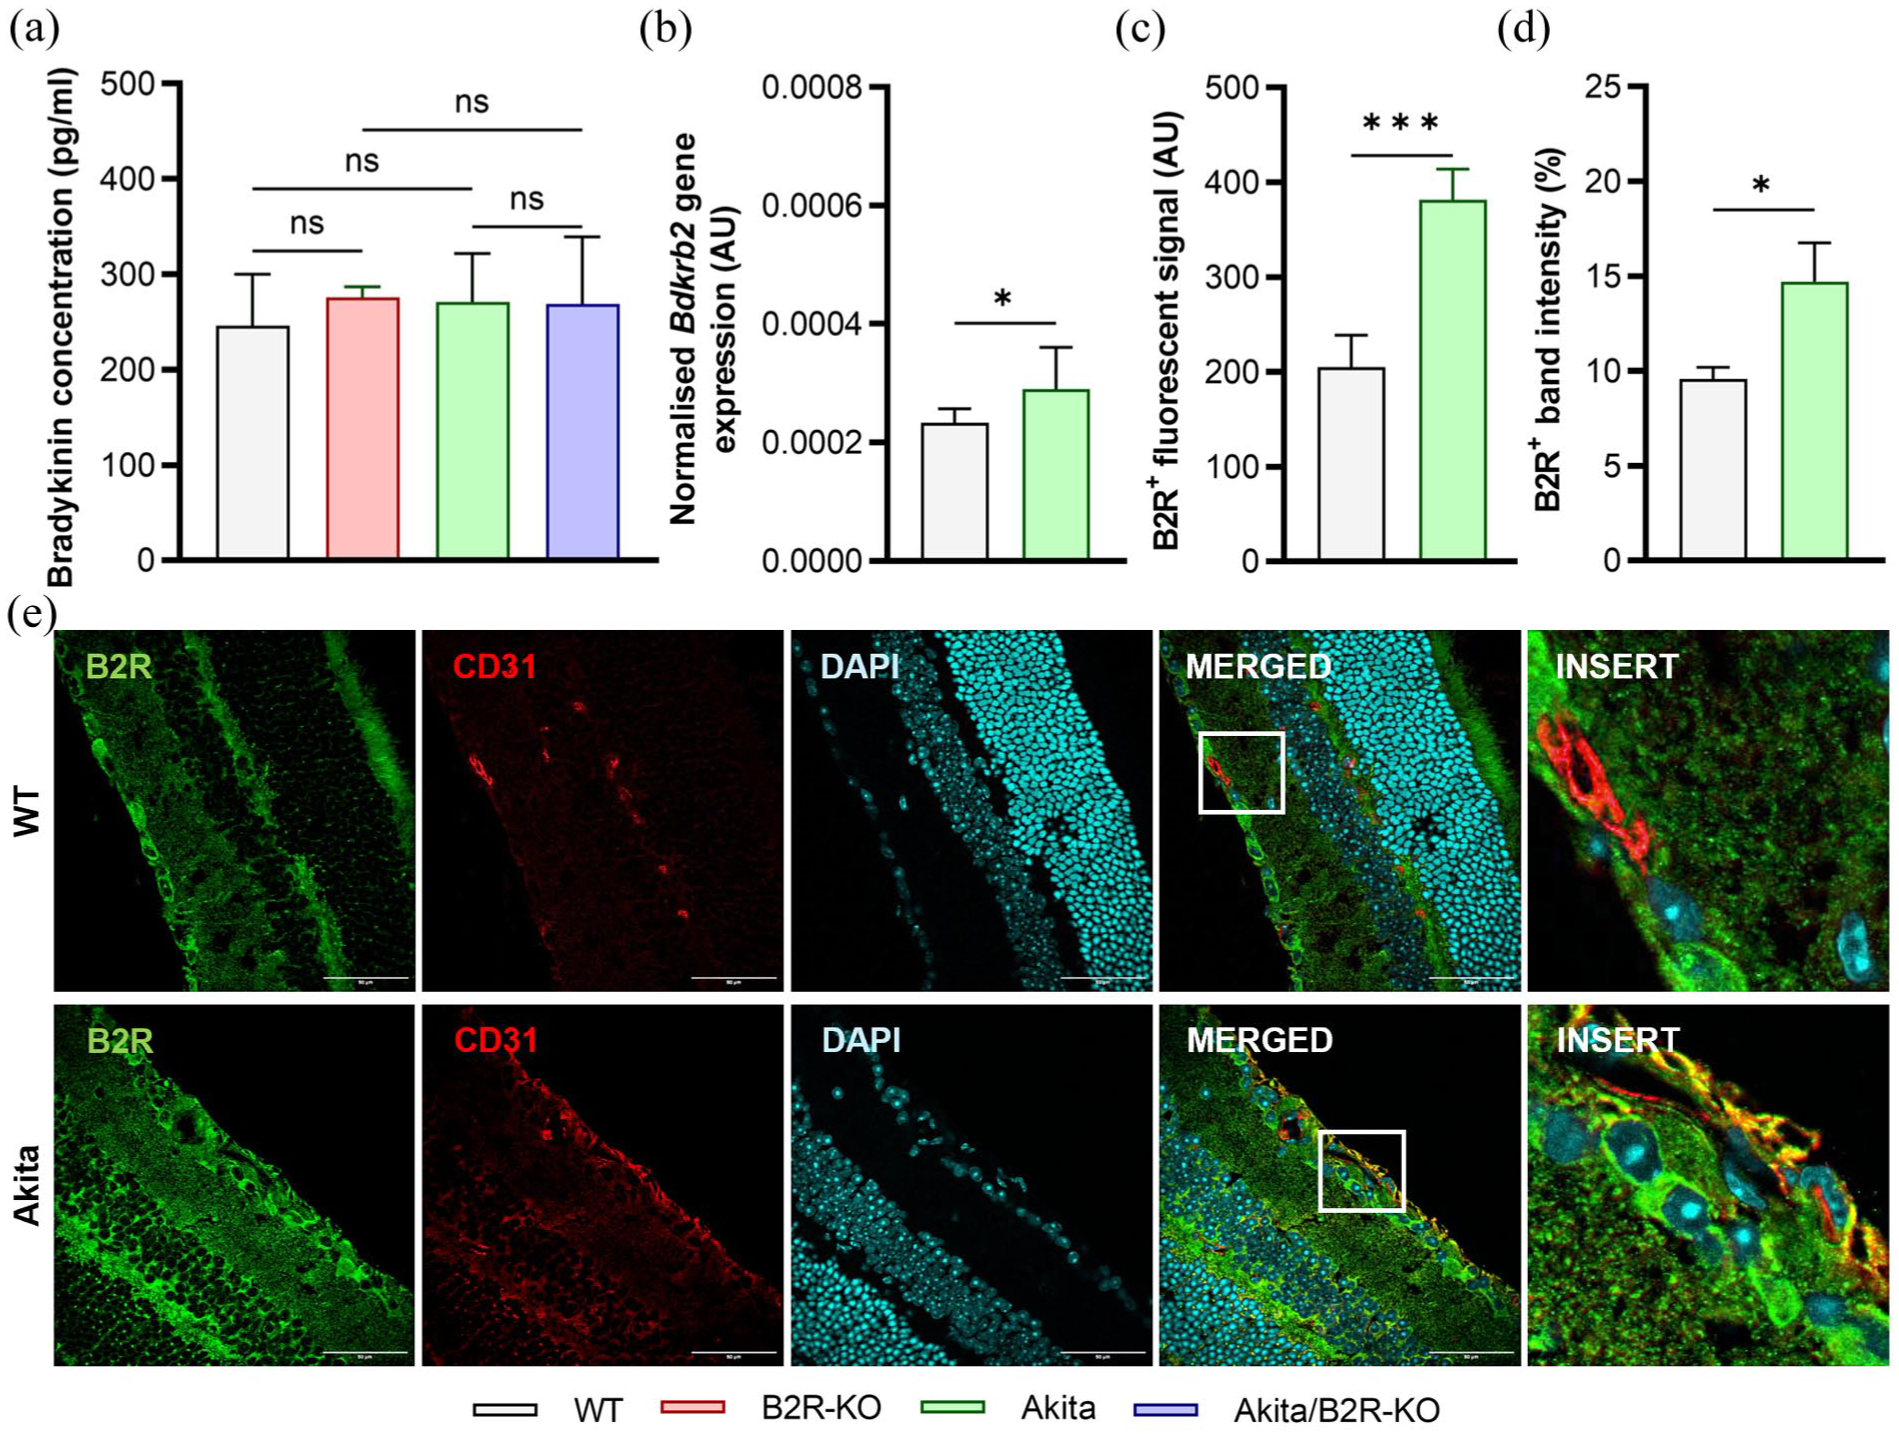
Diabetes increases B2R expression. (a) Neither diabetes nor B2R deficiency influences bradykinin concentration in the retina. (b) Diabetes increases retinal B2R gene (Bdkrb2) expression (n = 6). (c) Diabetes significantly increases the B2R+ fluorescent signal intensity in the retina (n = 4). (d) Diabetes significantly increases retinal B2R expression (n = 4). (e) Representative double immunofluorescence labeled retinal tissue sections confirm the expression of B2R (green) on endothelial cells (CD31, red). DAPI-positive nuclei (blue). Scale bar: image 50 μm, insert 10 μm. Values are presented as median and interquartile range. Statistically significant differences among all genotypes were determined using one-way ANOVA with multiple comparison corrections controlling the false discovery rate (α = 0.05), and differences between Akita and WT were determined using Student's t-test: *p < 0.05. ***p < 0.001. ns: nonsignificant.
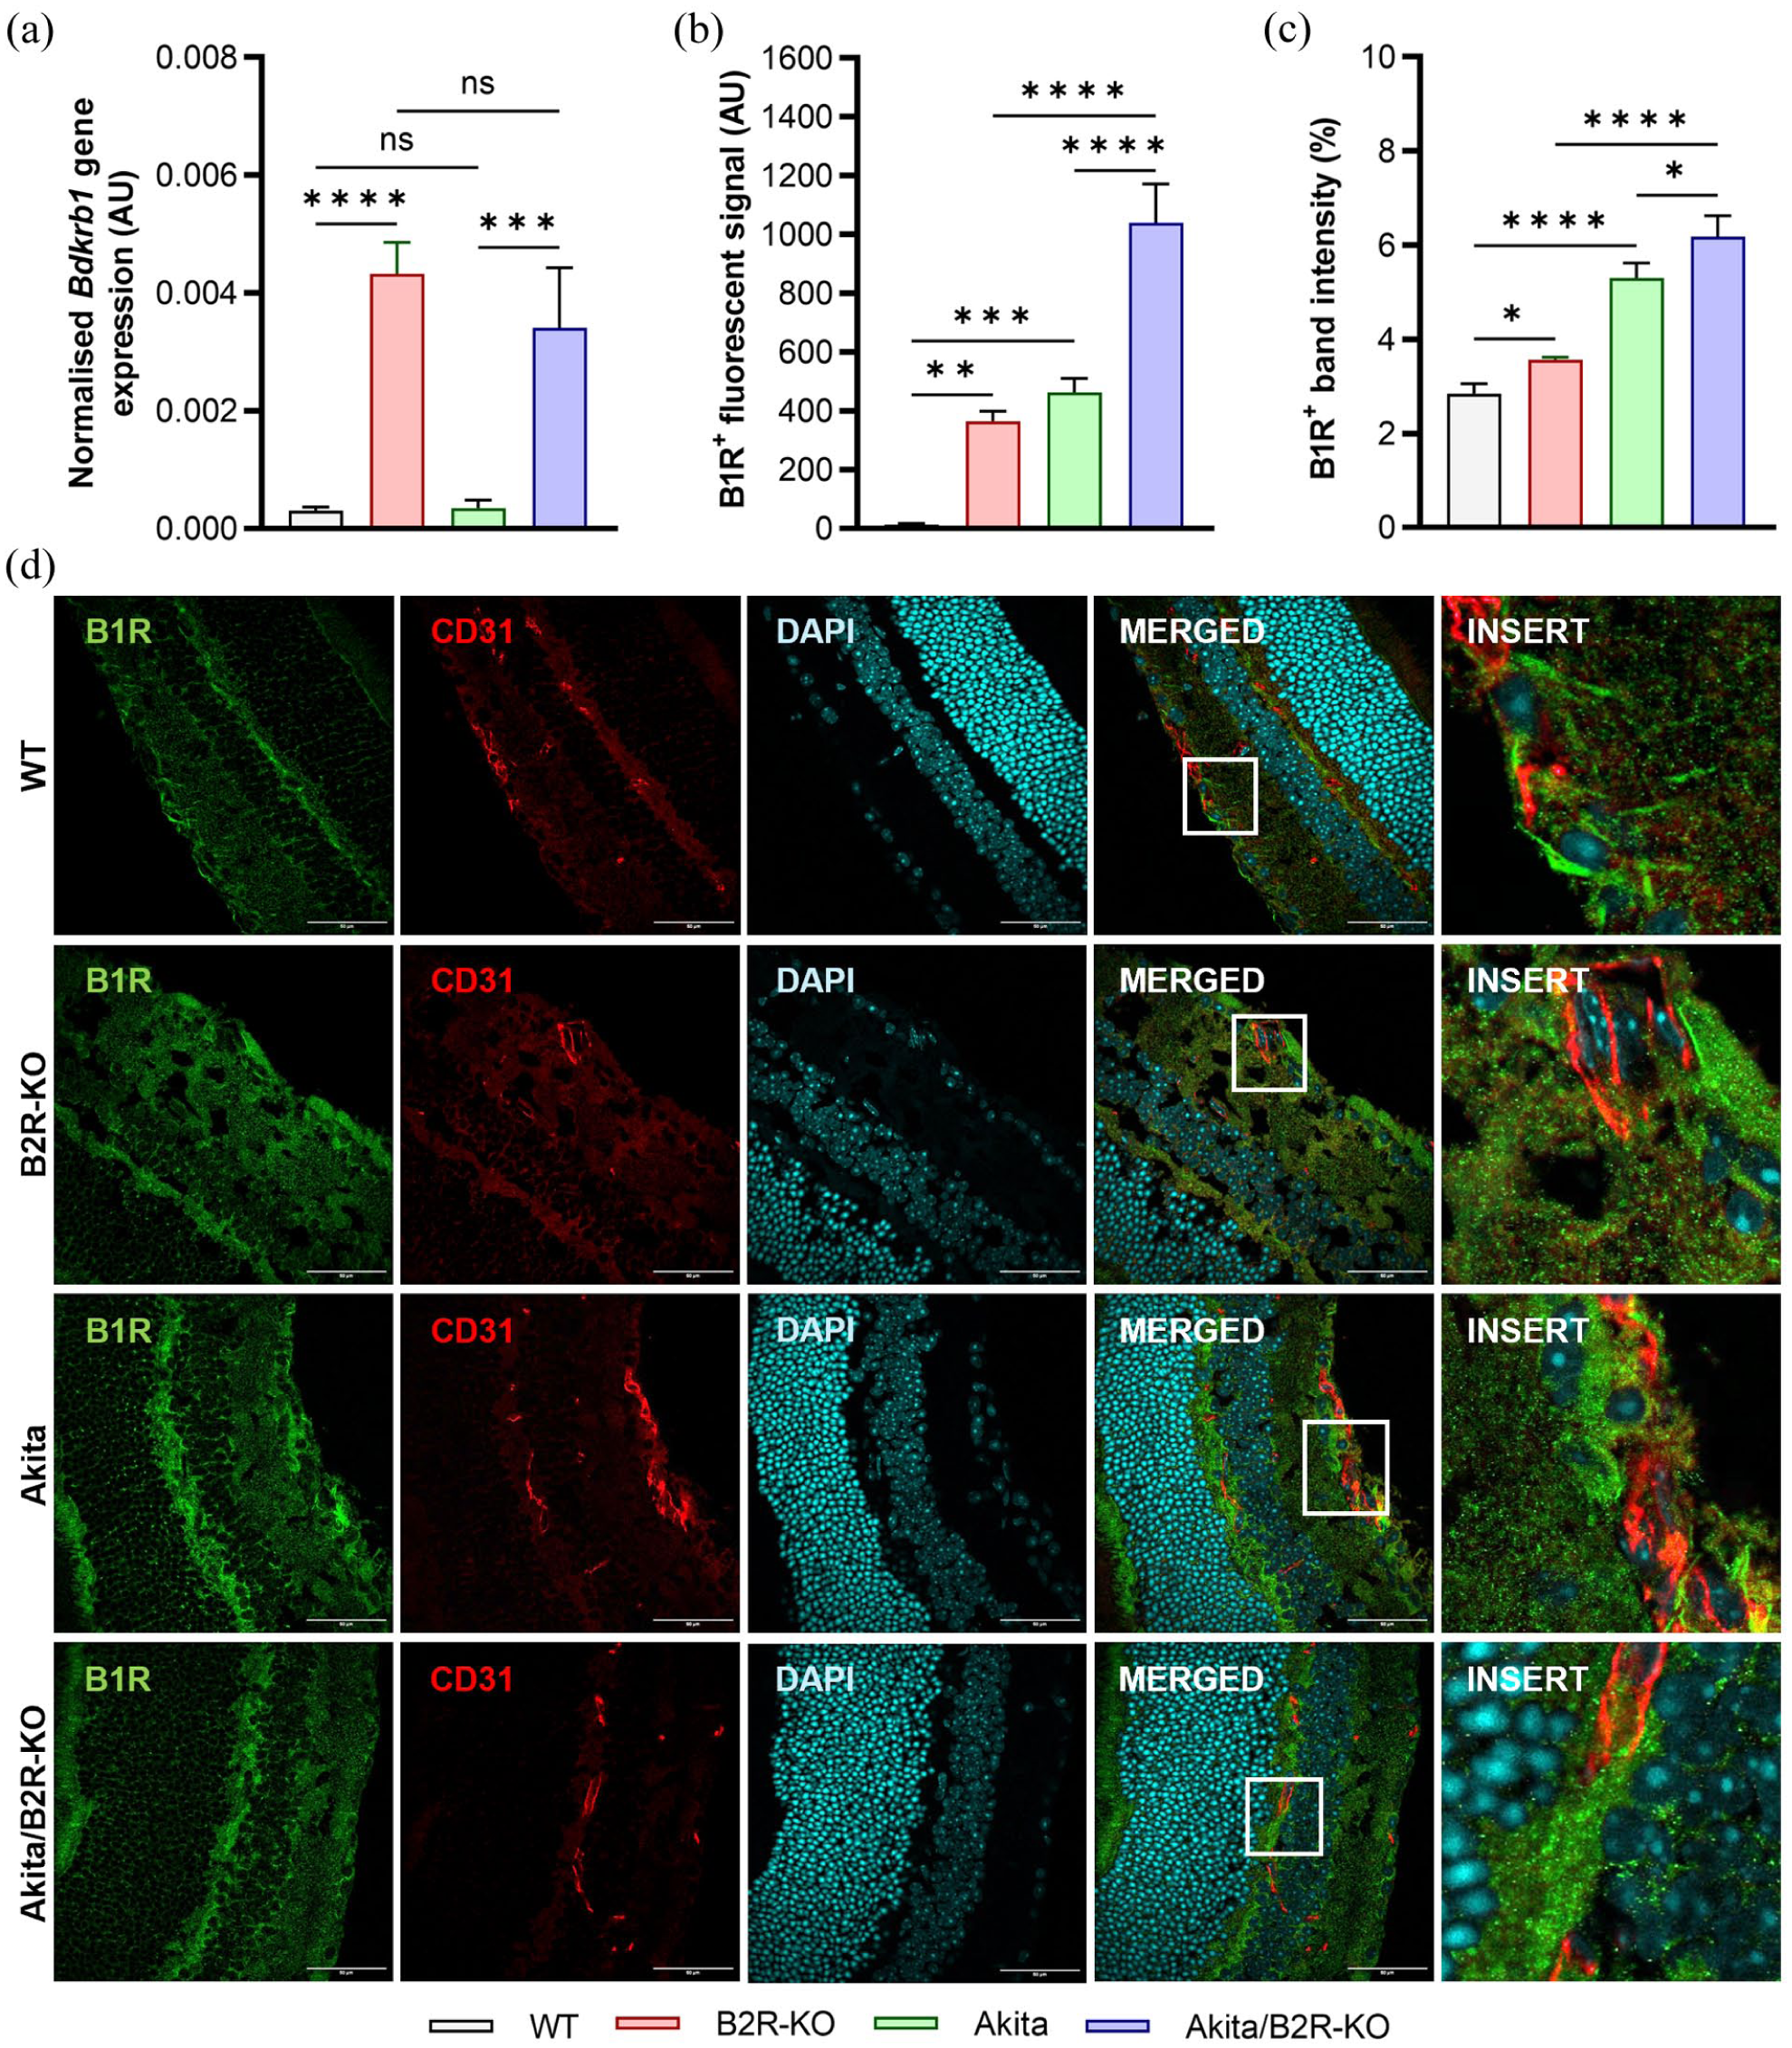
Diabetes and B2R deficiency increase B1R expression. (a) B2R deficiency increases retinal B1R gene (Bdkrb1) expression (n = 6). (b) Diabetes and B2R deficiency significantly increase the B1R+ fluorescent signal intensity in the retina (n = 4). (c) Diabetes and B2R deficiency significantly increase retinal B1R expression (n = 4). (d) Representative double immunofluorescence labeled retinal tissue sections confirm the expression of B1R (green) on endothelial cells (CD31, red). DAPI-positive nuclei (blue). Scale bar: image 50 μm, insert 10 μm. Values are presented as median and interquartile range. Statistically significant differences among all genotypes were determined using one-way ANOVA with multiple comparison corrections controlling the false discovery rate (α = 0.05): *p < 0.05. **p < 0.01. ***p < 0.001. ****p < 0.0001. ns: nonsignificant.
B2R deficiency downregulates VEGF and VEGFR-2 protein synthesis
To assess the effects of diabetes and B2R deficiency on retinal VEGF concentrations, quantitative ELISA was performed. The analysis showed significantly reduced VEGF levels in Akita/B2R-KO compared to Akita mice (p < 0.001), and in B2R-KO compared to WT mice (p < 0.01; Figure 6(a)). Interestingly, while Vegfa gene expression was significantly higher in diabetic Akita mice compared to WT controls (p < 0.001), it was even higher in B2R-KO mice compared to WT controls (p < 0.001) and in Akita/B2R-KO compared to Akita mice (p < 0.05; Figure 6(b)). VEGF protein expression, indicated by VEGF+ fluorescent signal areas, was lower in Akita/B2R-KO and B2R-KO mice compared to their controls (p < 0.0001), suggesting reduced protein synthesis (Figure 6(c) and (d)).

B2R deficiency decreases VEGF and VEGFR-2 protein expression. (a) B2R deficiency decreases VEGF concentration in the retina. (b) B2R deficiency and diabetes increase retinal VEGF gene (Vegfa) expression (n = 6). (c) B2R deficiency decreases VEGF+ fluorescent signal intensity in the retina (n = 4). (d) Representative double immunofluorescence labeled retinal tissue sections confirm the expression of VEGF (green) on endothelial cells (CD31, red). (e) Diabetes and B2R deficiency increase retinal VEGFR-2 gene (Kdr) expression (n = 6). (f) B2R deficiency significantly decreases VEGFR-2+ fluorescent signal intensity in the retina (n = 4). (g) Representative double immunofluorescence labeled retinal tissue sections confirm the expression of VEGFR-2 (green) on endothelial cells (CD31, red). Scale bar: image 50 μm, insert 10 μm. Values are presented as median and interquartile range. Statistically significant differences among all genotypes were determined using one-way ANOVA with multiple comparison corrections controlling the false discovery rate (α = 0.05): *p < 0.05. **p < 0.01. ***p < 0.001. ****p < 0.0001. ns: nonsignificant.
Concerning Kdr, VEGFR-2 gene expression, diabetes, and B2R deficiency increased mRNA levels, with higher expression in Akita/B2R-KO mice compared to Akita mice (p < 0.01), and in B2R-KO mice compared to WT mice (p < 0.0001). Interestingly, Akita/B2R-KO mice had lower Kdr expression than B2R-KO mice (p < 0.001; Figure 6(e)). VEGFR-2 protein expression was, however, reduced in Akita/B2R-KO and B2R-KO groups compared to their controls (p < 0.05; Figure 6(f) and (g)). To summarize, despite higher Vegfa and Kdr gene expression, B2R deficiency led to lower VEGF and VEGFR-2 levels in both non-diabetic and diabetic mice, pointing to a regulatory effect on protein synthesis.
B2R deficiency upregulates ANP and GC-A expression
ELISA analysis revealed that diabetes increased ANP levels in Akita compared to WT (p < 0.05) and in Akita/B2R-KO compared to B2R-KO mice (p < 0.001). B2R deficiency alone also elevated ANP in the B2R-KO group (p < 0.05; Figure 7(a)). NppA, ANP gene expression was higher in Akita compared to WT (p < 0.05) and in both diabetic and non-diabetic B2R-deficient animals compared to Akita (p < 0.01) and WT (p < 0.001) controls, respectively (Figure 7(b)). Fluorescent ANP+ signal area (Figure 7(c) and (d)) confirmed the ANP concentration analysis (Akita vs WT p < 0.05; Akita/B2R-KO vs Akita p < 0.001 and vs B2R-KO p < 0.05; B2R-KO vs WT p < 0.01). The increased ANP expression mainly colocalized with Müller cells (see Supplemental Figure 1), and less with ganglion (see Supplemental Figure 2) and endothelial cells (Figure 7(d)).
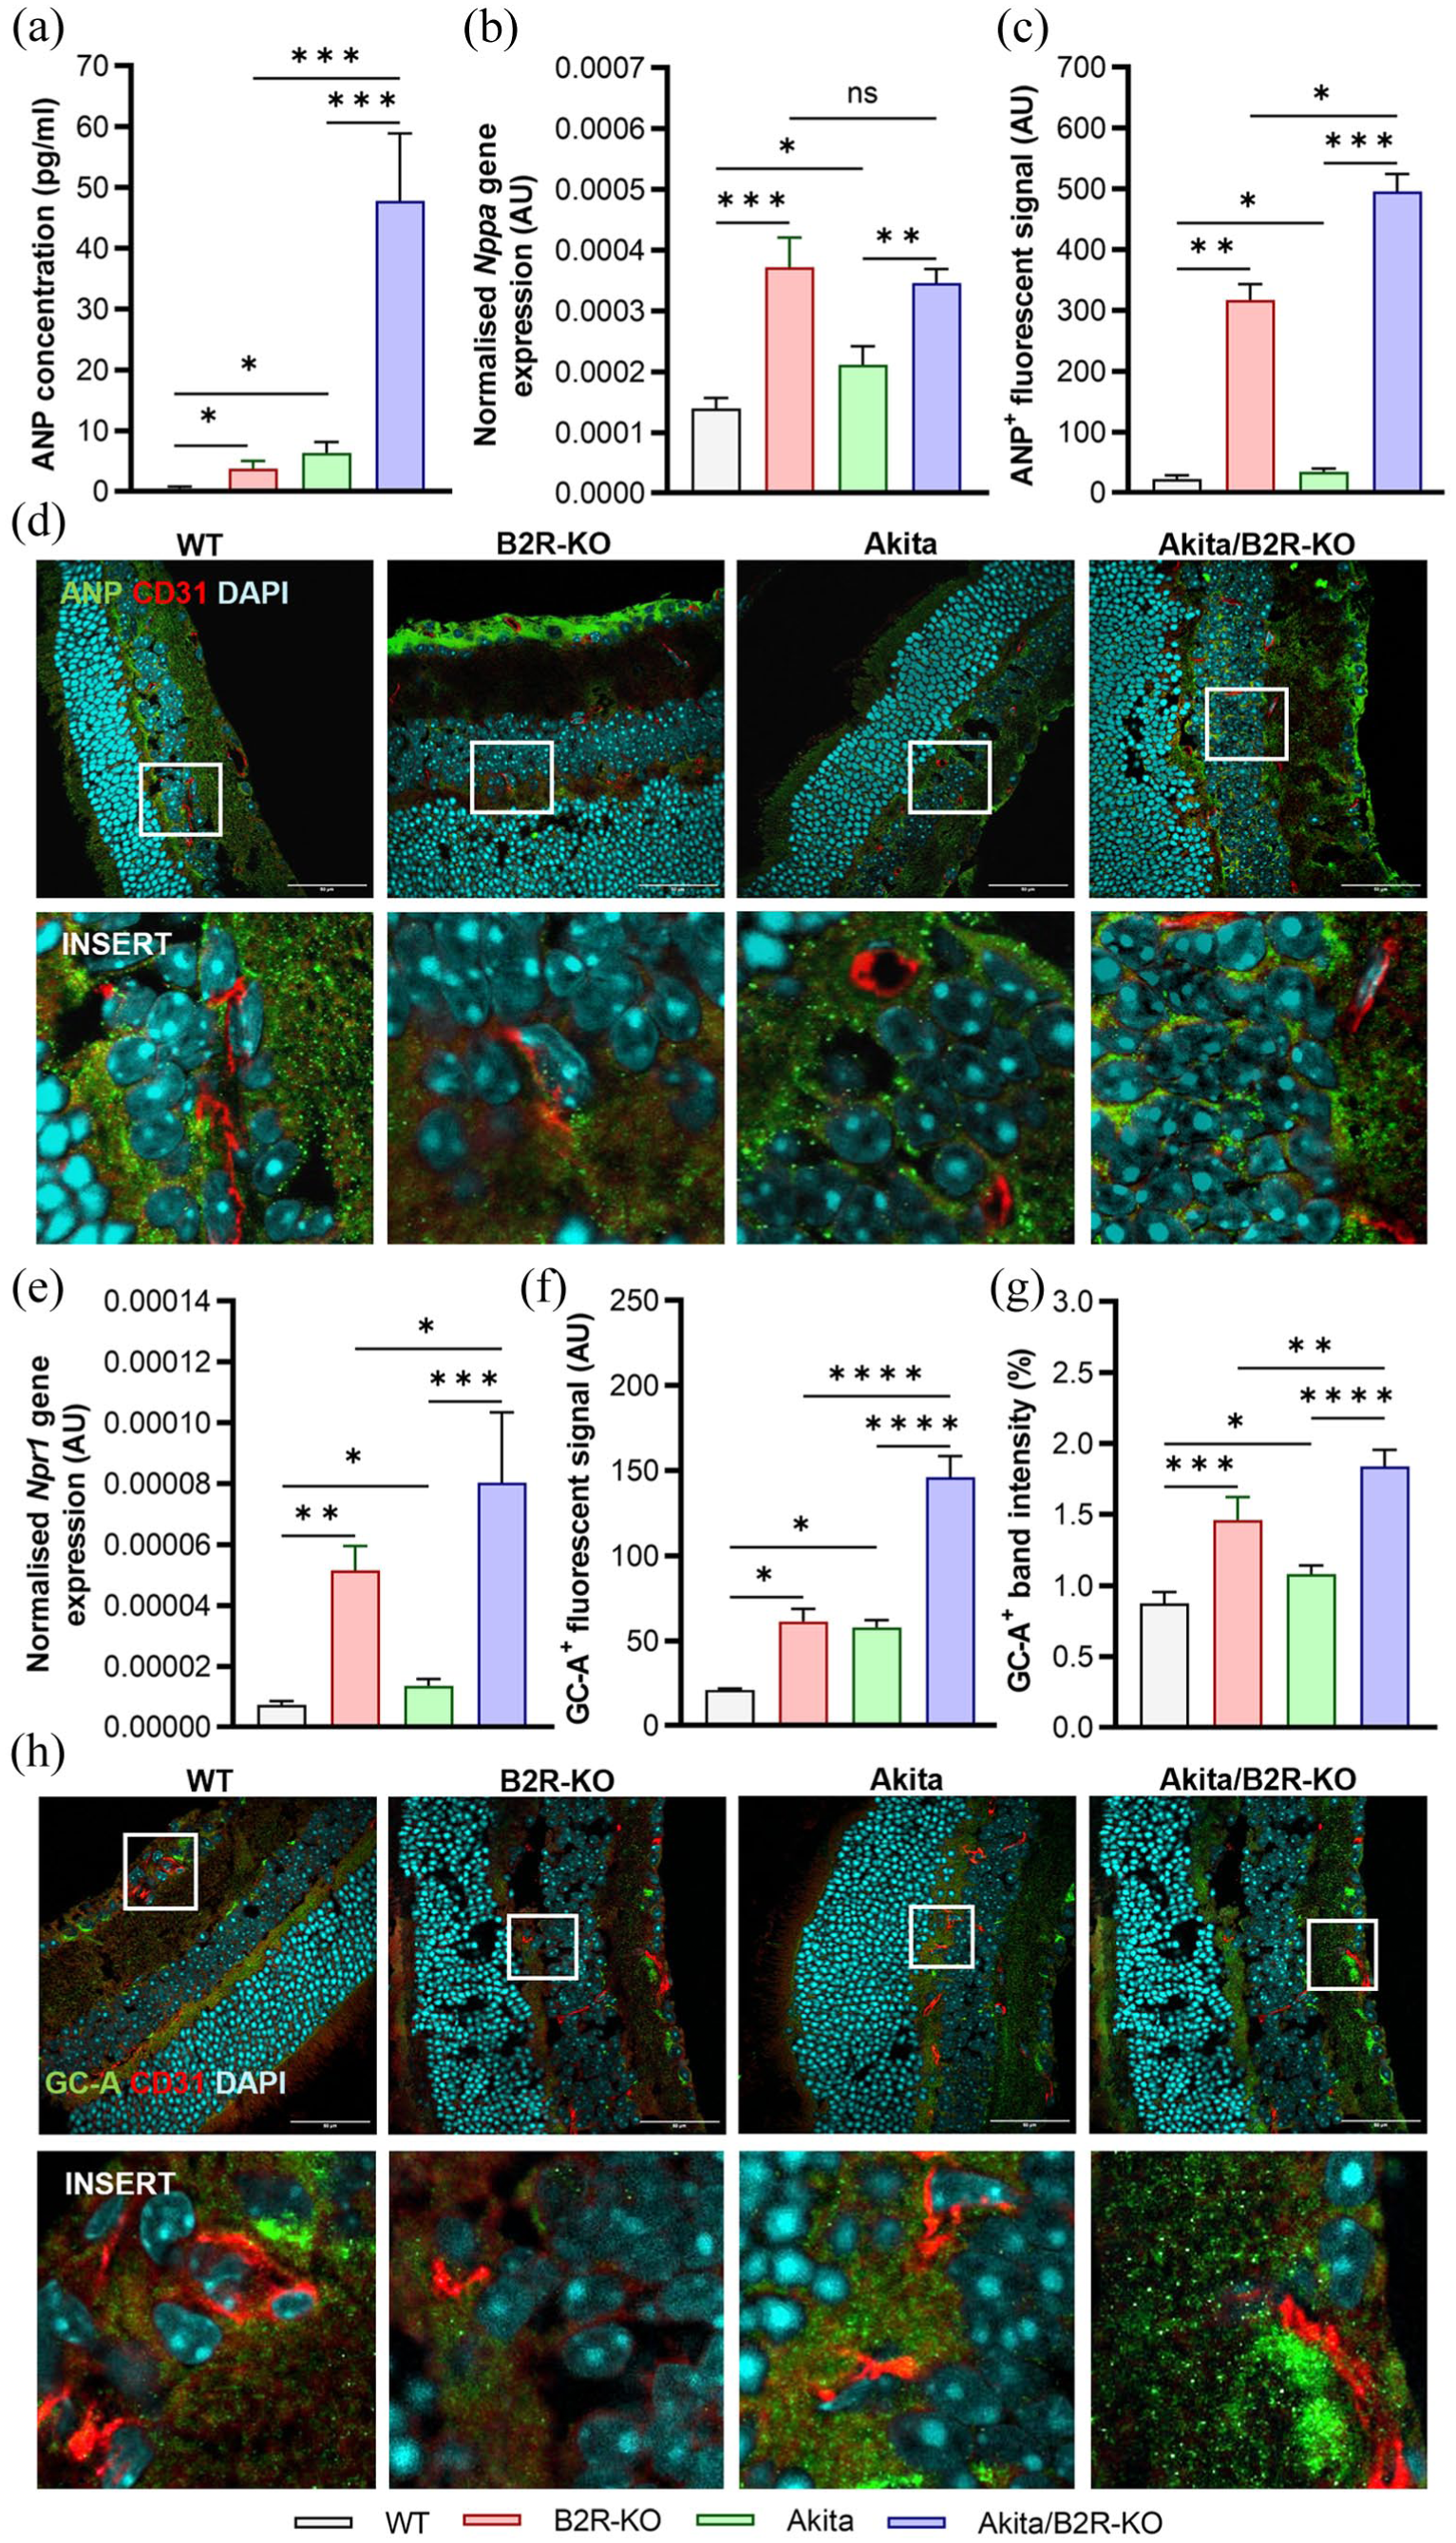
B2R deficiency increases ANP and GC-A expression, and diabetes further modulates it. (a) Diabetes and B2R deficiency increase ANP concentration in the retina. (b) Diabetes and B2R deficiency increase retinal ANP gene (Nppa) expression (n = 6). (c) Diabetes and B2R deficiency significantly increase ANP+ fluorescent signal intensity in the retina (n = 4). (d) Representative double immunofluorescence labeled retinal tissue sections confirm the expression of ANP (green) on endothelial cells (CD31, red). (e) Diabetes and B2R deficiency increase retinal guanylyl cyclase/NPR-A gene (Npr1) expression (n = 6). (f) Diabetes and B2R deficiency increase GC-A+ fluorescent signal intensity in the retina (n = 4). (g) Diabetes and B2R deficiency significantly increase retinal GC-A expression (n = 4). (h) Representative double immunofluorescence labeled retinal tissue sections confirm the expression of GC-A (green) on endothelial cells (CD31, red). Scale bar: image 50 μm, insert 10 μm. Values are presented as median and interquartile range. Statistically significant differences among all genotypes were determined using one-way ANOVA with multiple comparison corrections controlling the false discovery rate (α = 0.05): *p < 0.05. **p < 0.01. ***p < 0.001. ****p < 0.0001. ns: nonsignificant.
Similar trends were found for Npr1, GC-A gene expression. Akita mice had higher expression than WT (p < 0.05), Akita/B2R-KO mice significantly higher than both Akita (p < 0.001) and B2R-KO mice (p < 0.05), and B2R-KO compared to WT mice (p < 0.01; Figure 7(e)). The GC-A+ signal area was also greater in Akita mice compared to WT (p < 0.05), Akita/B2R-KO mice compared to both Akita (p < 0.0001) and B2R-KO (p < 0.0001), and B2R-KO compared to WT mice (p < 0.05; Figure 7(f)). Western blot analysis confirmed these immunofluorescent findings (Akita vs WT: p < 0.05; Akita/B2R-KO vs Akita: p < 0.0001 and vs B2R-KO: p < 0.01; B2R-KO vs WT: p < 0.001; Figure 7(g)). In conclusion, B2R deficiency significantly upregulated ANP and GC-A expression, likely as a compensatory or modulatory response, both in non-diabetic and diabetic animals, but more prominently in the latter. This increased expression was especially seen in Müller cells.
Discussion
We used the Akita mouse model to investigate the role of B2R deficiency in the pathophysiology of early-stage DR, with a particular focus on evaluating its effects on VEGF and ANP. The results suggest that B2R deficiency modulates both systemic metabolic responses and local retinal mechanisms, with potential implications for vascular permeability and neuroprotection.
The absence of B2R was associated with impaired glucose tolerance in non-diabetic mice, consistent with previous reports suggesting a role for B2R in maintaining insulin sensitivity. 43 Likewise, higher glycated hemoglobin levels in diabetic Akita/B2R-KO mice suggest that B2R deficiency further exacerbates systemic metabolic dysregulation in chronic hyperglycemia, potentially by interfering with insulin signaling or augmenting inflammation. 44 The paradoxical increase in body mass in aged B2R-deficient mice, including those with diabetes, implies that B2R also plays a regulatory role in energy homeostasis.43 –46 This finding is supported by a previous study in which long-term administration of a B2R antagonist icatibant in rats led to a significant increase in body mass without changes in food intake or blood glucose levels. 46 Additionally, while systemic blood pressure remained unaffected, the observed reduction of IOP in diabetic B2R-deficient mice may have reflected a B2R-mediated modulation of aqueous humor dynamics, likely linked to long-term inhibition of NF-κB, an integral part of the B2R pathway. 47 These findings collectively position B2R as a molecular node connecting metabolic and IOP regulation under diabetic conditions.
From a vascular perspective, our study underscores the complex interaction between B2R signaling and early retinal microvascular remodeling and disfunction in diabetes. The observed arteriolar and venular narrowing in Akita mice, particularly the latter, may arise from increased vascular tone or pericyte dysfunction, commonly associated with oxidative stress and chronic hyperglycemia.48 –50 With respect to B2R deficiency, the reduced venular diameter in non-diabetic B2R-KO mice suggests that endogenous bradykinin promotes basal vasodilation, potentially via nitric oxide or VEGF-like pathways. 51 Conversely, the finding of partially normalized venular diameter in B2R-deficient diabetic mice points to a context-specific role of B2R signaling in vascular tone modulation and remodeling. The reduced capillary perfusion area observed both in diabetic and in B2R-deficient animals, likely due to leukostasis and increased microvascular resistance in the former, may also reflect elevated microvascular resistance due to endothelial dysfunction in the latter, or partially stem from developmental limitations in retinal angiogenesis due to loss of B2R-mediated trophic signaling.32,34,49,50 These vascular changes, while subtle, may contribute to early neurovascular uncoupling and set the stage for downstream retinal degeneration.
In diabetic patients, high-frequency ultrasound shows compromised ophthalmic artery hemodynamics, with reduced velocities and increased vascular resistance, even in the absence of clinical retinopathy.34,52 –54 These changes suggest compromised ocular perfusion, which may contribute to the development of diabetic retinopathy. Although our study did not directly assess flow velocities, high-resolution MR angiography using maximum intensity projections dependent on blood flow velocity showed no difference in ophthalmic artery volume between Akita and wild-type mice at 6 months of age, suggesting preserved perfusion at this disease stage. This aligns with previous reports indicating that chronic hyperglycemia in Akita mice induces retinal thinning without significant perfusion deficits. 34 Interestingly, non-diabetic B2R-KO mice showed a significant reduction in ophthalmic artery volume, implying impaired perfusion. One likely mechanism is reduced nitric bioavailability due to the absence of B2R, which is known to mediate endothelial NO production. This reduction in NO may elevate vascular resistance and lower perfusion pressure within the ophthalmic circulation. 55 In diabetic animals, B2R deficiency did not affect ophthalmic artery volume, possibly due to compensatory upregulation of the bradykinin B1 receptor, as previously shown in diabetic tissues. 56
MRI-based retinal thickness measurements confirmed reduced retinal thickness in Akita mice, corroborating prior histological data on retinal neurodegeneration and thinning. 34 B2R deficiency in non-diabetic mice also led to retinal thinning, without significant changes in T2 relaxation times, suggesting structural atrophy without accompanying edema or fibrosis. However, in Akita/B2R-KO mice, retinal thickness was paradoxically greater than in both Akita and non-diabetic B2R-KO groups. Despite this apparent protective effect, reduced retinal T2 values were observed, which may reflect chronic edema, fibrosis, or osmotic imbalance.57,58 Shorter T2 times in the context of diabetes may be explained by cellular dehydration, cytoplasmic condensation, or altered intracellular water distribution, all of which reduce water mobility and lower T2 signals, even in edematous tissue. These findings, combined with reduced ganglion cell loss and increased vascular permeability in the Akita/B2R-KO group, suggest that the increased retinal thickness (compared to Akita and B2R-KO groups) may result from complex tissue remodeling rather than neuroprotection alone. Further studies will be needed to elucidate the precise molecular and cellular contributors to the reduced T2 relaxation times observed in diabetic B2R-deficient mice.
With respect to vascular permeability, fluorescein angiograms surprisingly appeared to show no obvious vascular leakage in any study group. However, it is likely that limitations in resolution or signal-to-noise ratio (e.g. in the context of diffuse, uniform fluorescein diffusion) may have hindered its visualization, given that BRB dysfunction was clearly demonstrated using NAF and EB assays. Diabetic Akita mice showed increased leakage of low-molecular-weight tracers, consistent with selective impairment of tight junction integrity due to prolonged hyperglycemia.34,47,59 In contrast, B2R deficiency markedly increased extravasation of both low- and high-molecular-weight (i.e. albumin-bound) molecules, with the most pronounced effect observed in Akita/B2R-KO mice. These findings suggest that, in the absence of B2R, compensatory upregulation of B1R may drive vascular hyperpermeability through pro-inflammatory signaling and enhanced transcellular and paracellular transport.56,60,61 Preclinical studies have implicated B1R in promoting BRB breakdown, cytokine release, and leukocyte infiltration, particularly under diabetic conditions, highlighting a possible shift in bradykinin receptor balance that exacerbates barrier dysfunction.60 –62 The increased extravasation of both albumin-bound and low-molecular-weight tracers in B2R-deficient mice, even in the absence of diabetes, indicates that B2R contributes to maintaining baseline BRB integrity. This may involve regulation of tight junction proteins, transcytosis, or pericyte–endothelial interactions, all of which are vulnerable to inflammatory signaling cascades. 59
However, in diabetic Akita/B2R-KO mice, despite increased vascular permeability, B2R deficiency was associated with partial protection against retinal thinning and ganglion cell loss. This suggests a compensatory neuroprotective effect that may arise from reduced pro-inflammatory VEGF signaling or from altered cytokine environment favoring neuronal survival.18,28,30 –32,63 These findings highlight the paradoxical, context-dependent role of B2R. While its deficiency weakens vascular barriers, it may simultaneously attenuate neurodegenerative processes through modulation of inflammatory or trophic factor signaling. Interestingly, these findings were coupled with somewhat unexpected patterns of VEGF and VEGFR-2 expression. While previous studies have shown elevated VEGF levels in DR linked to ERK1/2 pathway activation, our study found no significant difference in retinal VEGF levels in Akita mice compared to WT mice, despite increased Vegfa gene expression. 64 Similarly, while diabetes has been shown to upregulate VEGFR-2 expression, we observed increased Kdr gene expression but no changes in VEGFR-2 receptor levels.65,66 A possible explanation for these differences could be the lack of insulin-stimulated VEGF expression in hypoinsulinemic Akita mice.67 –69 Regarding the effect of B2R deficiency, while Vegfa mRNA levels were elevated in both diabetic and non-diabetic B2R-deficient mice, VEGF protein expression was reduced, suggesting a regulatory effect on protein synthesis in the absence of B2R. B2R signaling is known to enhance VEGF synthesis via ERK1/2 activation, and its absence could therefore disrupt this pathway.28,64 Similarly, although Kdr (VEGFR-2) gene expression was increased in B2R-deficient groups, protein levels were lower, reinforcing the notion of impaired translation or receptor turnover. Taken together, these findings suggest a regulatory mechanism wherein B2R supports VEGF and VEGFR-2 bioavailability, contributing to the delicate balance between angiogenesis, edema, and neuronal viability in early DR.
Moreover, the upregulation of ANP and its receptor GC-A in diabetic and B2R-deficient retinas points to an additional compensatory pathway modulating vascular tone, fluid homeostasis, and neuroprotection.70 –72 ANP is known to antagonize VEGF-mediated permeability and inhibit inflammatory cascades, and its elevated expression, particularly in Müller glia, may serve as a local protective mechanism in response to B2R loss or hyperglycemia-induced stress. 22 The strong colocalization of ANP with Müller cells suggests a glia-mediated paracrine signaling loop that may stabilize the retinal microenvironment under pathological conditions. Upregulation of NppA and Npr1 genes, alongside increased protein levels of ANP and GC-A confirmed by immunofluorescence and Western blotting, implies transcriptional activation likely triggered by altered bradykinin or cytokine signaling. These findings collectively point to ANP/GC-A signaling as a candidate pathway compensating for B2R loss, modulating retinal fluid balance, reducing inflammation, and potentially preserving neural tissue.
Lastly, the coordinated increase in B1R expression in B2R-deficient animals, further amplified in the presence of diabetes, suggests a receptor shift within the kallikrein–kinin system.28,60,73 –75 Our study further supports the idea that diabetes affects the kallikrein–kinin system by altering receptor expression rather than bradykinin concentration. Although retinal bradykinin levels remained unchanged, diabetes significantly upregulated both B1R and B2R gene expression, consistent with prior findings showing that bradykinin levels are not tightly regulated by B2R-mediated feedback. 76 While B2R is constitutively expressed and typically associated with vasodilation and cytoprotection, B1R is inducible and often mediates pro-inflammatory effects. 45 The upregulation of Bdkrb1 and increased B1R protein levels may represent a maladaptive response that contributes to chronic inflammation, vascular dysfunction, or oxidative stress.56,74,76 Alternatively, in the specific context of B2R deficiency and diabetic stress, B1R activation may partially substitute for lost B2R signaling, providing a secondary modulatory mechanism for vascular and neural responses.44,56 The net effect of this receptor shift remains complex and likely depends on ligand availability, cellular context, and disease stage.
Beyond structural alterations and regulating BRB permeability, our data demonstrate that B2R signaling plays a complex role in regulating retinal neurodegeneration in early-stage diabetic retinopathy. Akita mice exhibited reduced retinal ganglion cell counts, confirming prior studies showing ganglion cell loss within 3 months of diabetes onset. 77 B2R deficiency alone also led to ganglion cell loss in non-diabetic animals, reinforcing previous evidence that bradykinin, acting through B2R, has a neuroprotective, anti-apoptotic role in the central nervous system.78,79 However, in diabetic Akita/B2R-KO mice, B2R deficiency unexpectedly mitigated ganglion cell loss. This paradoxical finding may be explained by compensatory mechanisms involving elevated ANP levels or upregulated B1R expression, both previously implicated in neuroprotection.80 –82 The elevated levels of ANP observed in B2R-deficient groups, particularly in diabetic animals, may contribute to the preservation of retinal structure through multiple neuroprotective mechanisms. Acting via its receptor GC-A, ANP activates the cGMP signaling cascade, which is known to promote neuronal survival through the downstream activation of cGMP-dependent protein kinase I (cGKI) and the Akt/Bcl-2 anti-apoptotic axis. 22 In the retina, this pathway has been shown to protect ganglion cells from excitotoxic injury, particularly under stress conditions such as those mediated by glutamatergic signaling or hyperglycemia.80,81 Additionally, ANP can indirectly enhance retinal integrity by reducing astrocytic overproduction of VEGF, suppressing pro-inflammatory cytokines such as IL-6 and MCP-1, and mitigating VEGF-induced vascular leakage.22,83,84 These effects may partly explain how B2R deficiency, despite the increased vascular permeability potentially driven by compensatory B1R activation, results in preserved retinal thickness and improved ganglion cell survival in diabetic mice. The reduced VEGF expression observed in B2R-deficient animals further supports the notion that ANP/GC-A signaling may even compensate for VEGF depletion by promoting alternative neuroprotective pathways. Taken together, these findings suggest a complex interplay in which ANP mitigates inflammation and supports neuronal survival in early diabetic retinopathy, with B2R acting as a potential regulator of the ANP/GC-A axis.70 –72
Several limitations of this study should be acknowledged. A key limitation is the exclusive use of male mice, which restricts the generalizability of our findings given the well-documented sex- and hormone-related differences in diabetic retinopathy progression.85 –88 Clinical and experimental evidence suggests that premenopausal females may be protected against early retinal damage due to estrogen-mediated mechanisms, while postmenopausal status and ovariectomy are associated with increased disease severity. 88 Future studies should therefore include female and ovariectomized mice to better elucidate the interplay between bradykinin signaling, inflammation, and sex hormones in the pathogenesis of diabetic retinopathy. Additionally, while our findings provide insights into the role of B2R in early diabetic retinopathy, we did not include therapeutic interventions using B2R agonists or antagonists, which would be essential to directly evaluate the translational potential of modulating this pathway. Moreover, while the Akita model is valuable for studying early neurovascular changes in type 1 diabetes, its lack of proliferative retinopathy features limits insights into late-stage disease, and its relevance to type 2 diabetes remains uncertain given distinct metabolic and inflammatory profiles.33,34,89 Finally, although in vivo imaging was used to reduce animal numbers in line with the principles of 3Rs, future studies incorporating age-matched histological analyses will be important to validate MRI findings and assess layer-specific retinal changes. Addressing these limitations through interventional studies, later-stage models, and sex-specific analyses will be critical to advancing the clinical relevance of B2R-targeted strategies in diabetic retinopathy.
Collectively, our findings identify B2R as a key regulator in early diabetic retinopathy, modulating glucose metabolism, vascular permeability, and neuronal survival likely through its influence on VEGF/VEGFR-2, ANP/GC-A, and B1R signaling pathways. Using the Akita mouse model, we demonstrated that B2R deficiency reduced VEGF and VEGFR-2 protein levels while markedly enhancing ANP and GC-A expression, suggesting a shift from angiogenic to neuroprotective signaling. This may result from both the direct loss of B2R-mediated VEGF induction and the compensatory upregulation of the ANP/GC-A axis. Moreover, the observed increase in B1R expression further implicates a compensatory network that, while potentially neuroprotective, could compromise vascular integrity. These results establish a framework in which B2R sustains retinal homeostasis, and its absence alters the balance between neuroprotection and vascular stability. Targeting this axis may offer novel therapeutic strategies aimed at preserving retinal function in early-stage diabetic retinopathy.
Supplemental Material
sj-pdf-1-jcb-10.1177_0271678X251377570 – Supplemental material for Bradykinin type 2 receptor deficiency alters vascular endothelial growth factor and atrial natriuretic peptide levels in early-stage diabetic retinopathy
Supplemental material, sj-pdf-1-jcb-10.1177_0271678X251377570 for Bradykinin type 2 receptor deficiency alters vascular endothelial growth factor and atrial natriuretic peptide levels in early-stage diabetic retinopathy by Marin Radmilović, Helena Justić, Anja Barić, Martina Ratko, Iva Šimunić, Zoran Vatavuk, Aleksandra Dugandžić and Marina Dobrivojević Radmilović in Journal of Cerebral Blood Flow & Metabolism
Footnotes
Acknowledgements
Magnetic resonance imaging was done at the Laboratory for Regenerative Neuroscience—GlowLab, University of Zagreb School of Medicine (RRID:SCR_022701). We thank Siniša Škokić for the technical support.
Author contributions
Marin Radmilović designed research, performed fluorescein angiography imaging and analysis; blood and intraocular pressure measurements, wrote the manuscript. Helena Justić assessed glycemic status, performed extravasation imaging and analysis, magnetic resonance data analysis. Anja Barić performed qPCR and analysis, magnetic resonance imaging. Martina Ratko performed ELISA, immunohistochemistry and analysis. Iva Šimunić performed magnetic resonance angiography analysis, fluorescein angiography image postprocessing. Zoran Vatavuk drafting and interpretation of data. Aleksandra Dugandžić design and interpretation of data. Marina Dobrivojević Radmilović design, statistical analysis, and revision. All authors reviewed, edited and approved the manuscript.
Funding
The authors disclosed receipt of the following financial support for the research, authorship, and/or publication of this article: This work was funded by the Croatian Science Foundation project BRADISCHEMIA (UIP-2017-05-8082).
Declaration of conflicting interests
The authors declared no potential conflicts of interest with respect to the research, authorship, and/or publication of this article.
Ethical considerations
All animal handling and procedures were approved by the Ethics Licensing Committee of the University of Zagreb School of Medicine and the Ethics Committee for the protection of animals used for scientific purposes of the Ministry of Agriculture Republic of Croatia (no. 380-59-10106-18-111/49).
Consent to participate
Not applicable.
Consent for publication
All authors give their consent and approval for the publication of this manuscript.
ORCID iDs

Data availability statement
Key resources that are essential to reproduce the results are provided in the Supplemental Material (Supplemental Table 1). The raw data used and/or analyzed are available from the corresponding authors upon request.
Supplemental material
Supplemental material for this article is available online.
References
Supplementary Material
Please find the following supplemental material available below.
For Open Access articles published under a Creative Commons License, all supplemental material carries the same license as the article it is associated with.
For non-Open Access articles published, all supplemental material carries a non-exclusive license, and permission requests for re-use of supplemental material or any part of supplemental material shall be sent directly to the copyright owner as specified in the copyright notice associated with the article.
