






Abstract
Glucose-6-phosphate dehydrogenase (G6PD) deficiency, the most common hereditary enzyme defect in the world, may be involved in cerebrovascular abnormalities suggested by clinical research. However, whether and how G6PD deficiency impairs cerebral vasculature is poorly understood. We therefore aimed at determining the role of G6PD in brain vasculature. By evaluating cerebrovascular imaging data from stroke patients, we found patients with G6PD deficiency exhibited greater morphological variability in the circle of Willis (CoW) with reduced frequency of the anterior communicating artery, bilateral A1 segments, but a higher incidence of fetal posterior cerebral artery (fPCA). To further confirm G6PD deficiency was associated with cerebrovascular abnormalities, we used pharmacological inhibitor to suppress G6PD activity in zebrafish embryos and utilized CRISPR/Cas9 technology to generate g6pd homozygous knockout and endothelial cell-specific knockout zebrafish lines. We found all of these models demonstrated varying degrees of cerebrovascular morphological abnormalities and impairment of cerebrovascular angiogenesis. Transcriptomic data analysis and in vitro experiments further elucidated that G6PD deficiency led to dysfunctional angiogenic response and induced apoptosis. Altogether, we first demonstrated that G6PD deficiency may be associated with CoW variants in stroke patients and impairing cerebrovascular morphology and angiogenesis during zebrafish development.
Keywords
Introduction
Glucose-6-phosphate dehydrogenase (G6PD) deficiency, the most common hereditary enzyme defect in the world, caused by mutations in G6PD gene, is associated with various clinical effects including neonatal jaundice, acute hemolytic anemia and cardiovascular disease.1,2 G6PD is also linked with increased risk of cerebrovascular abnormalities.3 –7 Our previous studies showed G6PD deficiency increased the risk of intracranial atherosclerotic stenosis (ICAS) and poor prognosis in stroke patients.3,4 It is reported that G6PD deficiency is associated with cerebral vasculopathy in children with sickle cell anemia (SCA), presenting as abnormal high velocities examined by transcranial Doppler (TCD). 5 Other studies also show that G6PD deficiency increases the risk of stroke in SCA patients.6,7 These studies suggest that G6PD deficiency may play an important role in cerebral vascular diseases. However, whether G6PD deficiency impacts cerebral vasculature is rarely studied.
The cerebrovascular system is highly sensitive to metabolic or genetic perturbations particularly during cerebrovascular development and angiogenic processes, and several metabolic pathways have been shown to influence angiogenesis.8 –11 G6PD is the first rate-limiting enzyme in the pentose phosphate pathway (PPP), which is essential for regulating energy consumption and glucose metabolism. 12 Nicotinamide adenine dinucleotide phosphate and ribulose-5-phosphate produced in PPP maintain cellular redox homeostasis and provide the basis for biological synthesis. 13 Furthermore, in vitro studies have demonstrated the proangiogenic effects of G6PD and mouse Matrigel plug assay model has shown that G6PD deficiency disrupts tube formation in vivo.14,15 Given the foregoing, we hypothesized that G6PD might be involved in cerebrovascular development and cerebrovascular pathology.
Herein, we first utilized the exhaustive cerebrovascular imaging data from stroke patients to investigate the influence of G6PD deficiency on cerebrovascular pathology. Subsequently, given the advantages of zebrafish, including the transparency allowing for continuous in vivo cerebrovascular imaging and high genetic manipulability, we generated G6PD-deficient zebrafish models to investigate whether G6PD deficiency could alter cerebrovascular morphology and its potential effects on cerebrovascular development.
Material and methods
Patient recruitment and eligibility
We prospectively enrolled 2357 consecutive patients with acute ischemic stroke at three clinical centers in South China between October 1, 2019 and June 30, 2023. Inclusion criteria included (1) ischemic stroke within 14 days with evidence of acute infarction on magnetic resonance imaging (MRI). Hyperintense lesions in the diffusion weighted imaging (DWI) and low apparent diffusion coefficient (ADC) were considered as acute ischemic lesions; (2) age ⩾18 years and (3) the circle of Willis (CoW) was assessed by magnetic resonance angiography (MRA), CT angiography (CTA), or digital subtraction angiography (DSA). Patients were excluded if they had any of the following: (1) a modified Rankin Scale score ⩾2 prior to stroke, which was obtained by interviewing either the patient or their family members about medical history at admission; (2) cerebral hemorrhage, vascular malformation, tumor, abscess, or other major nonischemic brain disease such as Parkinson disease or Alzheimer disease or (3) physical limitations or subjective inability to comply with CoW examination. This study was conducted at three clinical centers in South China, including the First Affiliated Hospital of Sun Yat-sen University, Huidong People’s Hospital and Xunwu People’s Hospital. The study was approved by the ethics committees of the centers (FAH-SYSU-IEC-[2023]946) and conformed with the Declaration of Helsinki. Written informed consent was obtained from all patients.
Clinical characteristics collection and outcome measures
Baseline information and stroke risk factors were collected at admission as soon as possible. The risk factors were defined according to a previous study. 16 Hypertension was defined as a medical history of hypertension or diagnosis at discharge. Diabetes was defined by a 75 g oral glucose tolerance test or a medical history of diabetes. Hyperlipidemia was defined as a cholesterol level >5.2 mmol/L, triglycerides >1.7 mmol/L, low-density lipoprotein ⩾3.4 mmol/L, or high-density lipoprotein <1.03 mmol/L, or current treatment with a lipid-lowering drug. A current smoker was defined as a patient who had smoked continuously for 6 months with ⩾1 cigarette/day. Alcohol intake (any dose of alcohol, ⩾1 time/week) and history of stroke/transient ischemic attack (TIA) were defined by subjects’ self-report. G6PD activity was measured spectrophotometrically at 340 nm by the increase of NADPH. G6PD deficiency was defined as G6PD enzyme activity <1300 U/L or as a G6PD/6-phosphogluconate dehydrogenase ratio <1.0. 17 The stroke patients were accordingly divided into the G6PD-deficient group or the G6PD-normal group based on G6PD enzyme activity level. Outcome measures were assessed for patients by the modified Rankin Scale (mRS) for 3-month functional impairment after stroke as described previously, with favorable outcome defined as mRS 0–1 and unfavorable outcome as mRS 2–6. 4
Assessment of CoW morphology
The CoW was assessed by MRA, CTA, and DSA, and the anatomical structures of the CoW were divided into the anterior and posterior sections. The absence or hypoplasia (<0.8 mm) of any structure in each of the two parts was considered an incomplete CoW and classified by section. 18 In the anterior circulation, absence or hypoplasia of the anterior communicating artery (AcomA) or either the first segment of anterior cerebral artery (A1 segment) was considered an incomplete anterior CoW (A-CoW). In the posterior circulation, absence or hypoplasia of the posterior communicating artery (PcomA) or the first segment of posterior cerebral artery (P1 segment) was considered an incomplete posterior CoW (P-CoW).
We also assessed the frequency of two CoW variants that occur most commonly in anterior and posterior circulation, respectively. 19 The most frequent variants in A-CoW is the absence or hypoplasia of either A1 segment (Supplemental Figure 1(a)), and in P-CoW is the fetal posterior cerebral artery (fPCA), which is defined as PComA significantly larger than the ipsilateral P1 segment (Supplemental Figure 1(b)). When diameter of the PComA was similar to ipsilateral P1 segment, the PComA was considered normal. The severity of CoW abnormalities was assessed using a validated scoring system from previous studies, where scores range from 0 to 6, and severe CoW abnormality is defined as a score between 0 and 2.20,21 In addition, to evaluate the potential contribution of atherosclerosis to CoW morphology, atherosclerotic stenosis was assessed using neurovascular imaging. Significant atherosclerotic stenosis was defined as 50%–99% stenosis or occlusion of at least one major intracranial artery, including the internal carotid artery and middle cerebral artery. 22 The vascular morphology was defined by two neurologists (JL and YC) in blinded and independent fashion, and disagreements were resolved by a third reader (JZ.) who decided the final value.
Zebrafish lines and husbandry
Embryos and adult fish were maintained and raised as described previously. 23 Wild-type lines and Tg(kdrl:eGFP)s843 transgenic line were obtained from the Zebrafish Model Animal Facility (Sun Yat-sen University, Guangzhou, China). 24 The adult zebrafish were maintained with an automatic fish housing system at 28 °C and the zebrafish embryos were treated with 0.003% 1-phenyl-2-thiourea (Sigma, P7629) from 24 h post fertilization (hpf) to prevent pigmentation. The G6PD-deficient zebrafish embryos including pharmacological inhibitor group (n = 6), F0 crispants (n = 5), homozygous mutants (n = 6), and endothelial cell-specific knockout lines (n = 7), along with their respective control groups, were employed for confocal imaging and exploration of cerebrovascular phenotypes. All procedures involving experimental animals were approved by the Institutional Animal Ethical Committee of Sun Yat-sen University (SYSU-IACUC-2023-002102), and all experiments were conducted in accordance with the Guide for the Care and Use of Laboratory Animals and reported in compliance with the ARRIVE (Animal Research: Reporting in Vivo Experiments) guidelines.
Chemical treatment
6-Aminonicotinamide (6-AN, MCE, HY-W010342) was dissolved in zebrafish culture medium from 2 days post fertilization (dpf) onward (3 mM) to inhibit G6PD enzyme activity. 25 Tg(kdrl:eGFP)s843 embryos randomly received zebrafish culture medium with or without 6-AN. The medium was refreshed once a day and phenotypes were characterized at 3–5 dpf.
G6PD activity assessment in zebrafish embryos
G6PD activity was evaluated using a G6PD activity assay kit (Solarbio, BC0265) according to the manufacturer’s instructions. Briefly, zebrafish embryos were collected and lysed in lysis buffer. Cell lysate was centrifuged, and the supernatant was used in the assay. G6PD activity was measured spectrophotometrically at 340 nm by the increase of NADPH in the presence of glucose-6-phosphate.
CRISPR/Cas9-mediated mutation of zebrafish g6pd
The g6pd knockout zebrafish (F0) were generated using the clustered regularly interspaced short palindromic repeats (CRISPR)/Cas9 system as previously reported. 26 Single guide RNA (sgRNA) sequence (5′-GAGAAGGGGAGGCAAAACTG-3′) against exon 10 of g6pd was designed using CHOPCHOP and g6pd sgRNA was synthesized with the MAXIscript T7 kit (Ambion, AM1312M). 27 The synthesized sgRNA and Cas9 protein (NEB, M0386T) were mixed and microinjected into one-cell-stage embryos. The g6pd gene mutations in F0 embryos were examined by sequencing analysis after in vivo confocal imaging of the midbrain vasculature. The primers used for PCR amplification of the region around the mutation were (forward: 5′-GCAGTGCATTGCTCTTTTAAGTT-3′; reverse: 5′-TTGCAACACAATGACTGAAGTG-3′) and the primer used for Sanger sequencing was 5′-GCAGTGCATTGCTCTTTTAAGTT-3′. To obtain homozygous mutants, F0 injected embryos were raised to adulthood and screened for the mutation and subsequently bred to produce the F1 generation. Heterozygous mutants harboring the mutation were then outcrossed with the Tg(kdrl:eGFP)s843 transgenic line. The crossed lines were further incrossed to observe the vascular development in homozygous mutant embryos during 3–5 dpf. Genotyping was performed after in vivo confocal imaging of the brain vasculature.
CRISPR/Cas9 vector system for endothelial-specific gene disruption in zebrafish
The CRISPR-based vector system for tissue-specific gene inactivation in zebrafish has been described previously. 28 We generated a vector in which the kdrl promoter drives Cas9 expression for endothelial-specific g6pd gene disruption. The kdrl promoter and validated g6pd sgRNA target sequences were cloned into the pDestTol2CG2-eGFP-U6-gRNA backbone (MiaoLingBio, China). The plasmid and Tol2 mRNA were mixed and microinjected into one-cell-stage embryos. F0 embryos showing mosaic expression of cmlc2:eGFP were raised to adulthood and outcrossed with the Tg(kdrl:eGFP)s843 transgenic line. F1 embryos with eGFP-positive hearts were sorted, and in vivo confocal imaging of the midbrain vasculature was performed.
In vivo confocal imaging and image analysis
The embryos were embedded in 1.2% low melting agarose without anesthesia at room temperature and were imaged to observe the whole cranial vessels using a Zeiss Lightsheet Z.1 microscope during 3–5 or at 14 dpf. The raw images and the reconstruction of the three-dimensional skeleton of the midbrain vasculature were processed with Imaris (Bitplane) with surface and filament tracing. The total length and segment number in the midbrain were used to quantify the vessel elongation and angiogenesis of the vascular network. 29 Diameters of the major cerebral vessels were measured in Imaris based on the internal endothelial diameters, excluding regions containing endothelial cell nuclei. Zebrafish with premature death or severe deformities were excluded from the analysis and were euthanized according to ethical guidelines. The assessment and data analysis were conducted by experimenters blinded to the group allocation.
Cryo-sectioning, imaging, and image analysis of the adult zebrafish brain
Adult zebrafish were first anesthetized, after which their brains were carefully dissected and immediately placed in freshly prepared 4% paraformaldehyde for fixation at room temperature for 2 h. Following fixation, the brain tissues were transferred into a 30% sucrose solution in PBS and incubated at 4 °C overnight for cryoprotection. Subsequently, the samples were cryo-sectioned into 100 μm thick slices. Brain vascular images were acquired by scanning the sections using a Leica DM6B fluorescence microscope. For each sample, three representative sections were selected, and vascular parameters within the regions of interest were quantified using AngioTool software, including vessel length per unit area and vessel area percentage. 30 Additionally, the diameters of cortical perforators and cortical capillaries were measured using ImageJ software. Assessment and analysis were performed blinded to group allocation.
Transcriptomics data of G6PD knockdown in HUVEC retrieval and analysis
We downloaded raw sequencing data from the SRA (PRJNA669230), a dataset that performed RNA sequencing on HUVECs following lentiviral G6PD knockdown. 25 The Q20, Q30, and GC contents were calculated, and the low-quality-reads were removed. 31 Alignment of preprocessed reads was performed with HISAT2 (v2.0.4) to the reference genome of Homo sapiens 38 (GRCh38). 32 FeatureCounts (v1.5.0) was used to count the read numbers mapped to each gene and differentially expressed genes (DEGs) were selected with the edgeR package.33,34 A p value of 0.05 and fold change (FC) of 1.2 were set as the thresholds for significantly differential expression. Gene Ontology (GO), Kyoto Encyclopedia of Genes and Genomes (KEGG) and Reactome enrichment analyses of DEGs were performed with the online tool Metascape with a minimum count of 3 and an enrichment factor (the ratio between the observed counts and the counts expected by chance) larger than 1.5. 35 Dot plots and heatmaps were plotted by Bioinformatics, an online platform for data analysis and visualization. 36
Cell culture and siRNA transfection
Commercially available bEND3 cells (ETHPHON, YCL-0041) were cultured in high glucose DMEM supplemented with 10% fetal bovine serum (FBS), 2 mM L-glutamine and 1% penstrep (100 IU/ml penicillin and 100 μg/ml streptomycin). Recombinant human VEGF165 (Sino Biological, 11066-HNAH) was dissolved in culture medium to promote angiogenesis (5 ng/mL). The silencer small interfering RNA (siRNA) and control siRNA (siNC) were designed and synthesized by Tsingke Biotechnology Company. BEND3 cells were seeded in a six-well plate and cultured in 2 mL of complete medium. When the cells grew to 70%–80% confluence, the medium was replaced with 2 mL of serum-free DMEM. Then, the cells were transfected with 5 µl of siRNA and 5 µl of Lipofectamine 3000 transfection reagent (Invitrogen, L3000001) in 500 µL of OptiMEM (Gibco, 31985070). The serum-free DMEM was changed to complete DMEM after 8 h. The siRNA sequences were as follows: G6pd siRNA#1, 5′-GAAGAGUUGUACCAGGGUGAU-3′; G6pd siRNA#2, 5′-GACUCACAGUGGACGACAU-3′.
RNA extraction and qRT–PCR analysis
Total RNA was isolated and purified from cells using SteadyPure Universal RNA Extraction Kit (AGBIO, AG21017). The RNA samples were reverse transcribed into cDNA using a PrimeScript First Strand cDNA Synthesis Kit (Takara, RR047A). qRT–PCR was performed on a QuantStudio 5 Real-Time PCR System (Thermo Fisher) using the SYBR Green detection method (AGBIO, AG11702). The relative RNA amount was normalized with β-actin (Actb1). The primers used for real-time PCR are as follows. G6pd primers: forward: 5′-CACAGTGGACGACATCCGAAA-3′, reverse: 5′-AGCTACATAGGAATTACGGGCAA-3′. Actb1 primers: forward: 5′-GTACTCTGTGTGGATCGGTGG-3′, reverse: 5′-AAACGCAGCTCAGTAACAGTCC-3′.
In vitro analysis of endothelial cell function
Cell proliferation assay: Cell proliferation rate was evaluated using EdU In Vitro Imaging Kit (RiboBio, C10310-1). bEND3s were harvested and reseeded in 24-well plates for an additional 24 h after siRNA transfection. Cells were cultured with EdU solution for 24 h with or without VEGF165 treatment and then rinsed with PBS. Cells were fixed with 4% paraformaldehyde for 30 min and washed with 2 mg/ml glycine solution for 5 min, after which cells were permeabilized with 0.5% Triton X-100 in PBS for 10 min. Next, cells were incubated with staining reaction solution for 30 min in the dark. Hoechst 33342 (blue) was used for nuclear staining. Cell apoptosis analysis: Cell apoptotic rate was determined using one-step TUNEL apoptosis assay kit (Beyotime, C1090). BEND3s were harvested and reseeded in 24-well plates for an additional 24 h after siRNA transfection. Cells were fixed with 4% paraformaldehyde for 30 min, washed with PBS, and permeabilized with 0.3% Triton X-100 in PBS for 5 min. Next, the cells were incubated with TUNEL reaction mixture for 60 min in the dark and then washed with PBS. Hoechst 33342 (blue) was used for nuclear staining. Wound healing assays: Cells were seeded in six-well plates and transfected with siRNA. When the cells nearly reached confluence, a sterile 10 μl pipette tip was used to make a scratch line on the monolayer of confluent cells. Subsequently, the cells were washed three times with 1× PBS. At 0 and 24 h, the wound areas were observed and recorded using an inverted microscope. The percentage of the cells that had migrated to fill the wound was determined by calculating the ratio of the wound width at 24 h to the wound width at 0 h using ImageJ software.
Statistical analysis
Statistical analysis was performed using the GraphPad Prism 9.0 (GraphPad Software) and SPSS 25.0 (IBM SPSS, Inc.). Data were presented as mean ± standard deviation (SD) for variables with normal distribution. Continuous variables were compared using an unpaired Student’s t-test for normally distributed data and Mann–Whitney U test for non-normally distributed data (for comparisons of two groups). Between-group differences were analyzed using one-way analysis of variance (ANOVA) with Tukey’s multiple comparison test for multiple comparisons. Categorical variables were presented as proportions and were compared using the chi-squared test. A p < 0.05 was used to indicate statistically significant differences.
Results
G6PD deficiency increases anatomical variants of the CoW in stroke patients
Leveraging the advantages of the comprehensive cerebrovascular imaging data from stroke patients, we subsequently included a total of 2357 patients with stroke and G6PD deficiency was identified in 195 (8.27%) patients. There was no difference in the age, gender distribution, prevalence of hypertension, diabetes, smoking, and drinking between G6PD deficiency and normal groups. Patients with G6PD deficiency had higher rates of unfavorable outcome (mRS 2–6) at 3 months (62.1% vs 53.1%, p = 0.016). The baseline characteristics of included patients were shown in Supplemental Table 1.
ICAS and incomplete CoW were associated with poor prognosis in stroke patients.19,37 –39 Our previous studies showed that G6PD deficiency increased the risk and burden of ICAS in stroke patients. 3 In this study, as shown in Table 1, by evaluating the image data of MRA, CTA, or DSA, we found that G6PD-deficient patients had a lower presence of AComA (48.7% vs 56.2%, p = 0.043), and bilateral A1 segments (80.5% vs 89.7%, p < 0.001) in the A-CoW, compared with G6PD-normal patients. Approximately one-fifth of the G6PD-deficient patients had absent or hypoplastic A1 segments, which was more common than patients with G6PD normal level (19.5% vs 10.3%, p < 0.001). The prevalence of incomplete A-CoW was significantly higher in G6PD-deficient patients than in those with G6PD normal level (52.8% vs 43.9%, p = 0.017). In the P-CoW, none of the presence of bilateral PcomAs, the P1 segment, or incomplete P-CoW were significantly different between two groups. However, the fPCA was more frequently observed in patients with G6PD deficiency (31.8% vs 23.5%, p = 0.010). To further explore the relationship between G6PD deficiency and the severity of CoW abnormality, we evaluated CoW morphology using a previously established scoring system, with severe abnormality defined as a score of 0–2.20,21 The proportion of patients with severe CoW abnormality was significantly higher in the G6PD-deficient group compared to those with normal G6PD enzyme activity (81.5% vs 71.9%, p = 0.004). In addition, to help differentiate congenital from acquired influences on CoW morphology, particularly the potential confounding effect of atherosclerosis, we examined whether significant stenosis in the internal carotid artery (ICA) and middle cerebral artery (MCA) was associated with CoW abnormalities. 40 The prevalence of CoW abnormalities was 74.4% (270/363) in patients with atherosclerotic stenosis and 72.5% (1205/1661) in those without, with no statistically significant difference (OR = 1.10, 95% CI: 0.85–1.42, p = 0.477).
The anatomical variants of the CoW in stroke patients with different G6PD statuses.
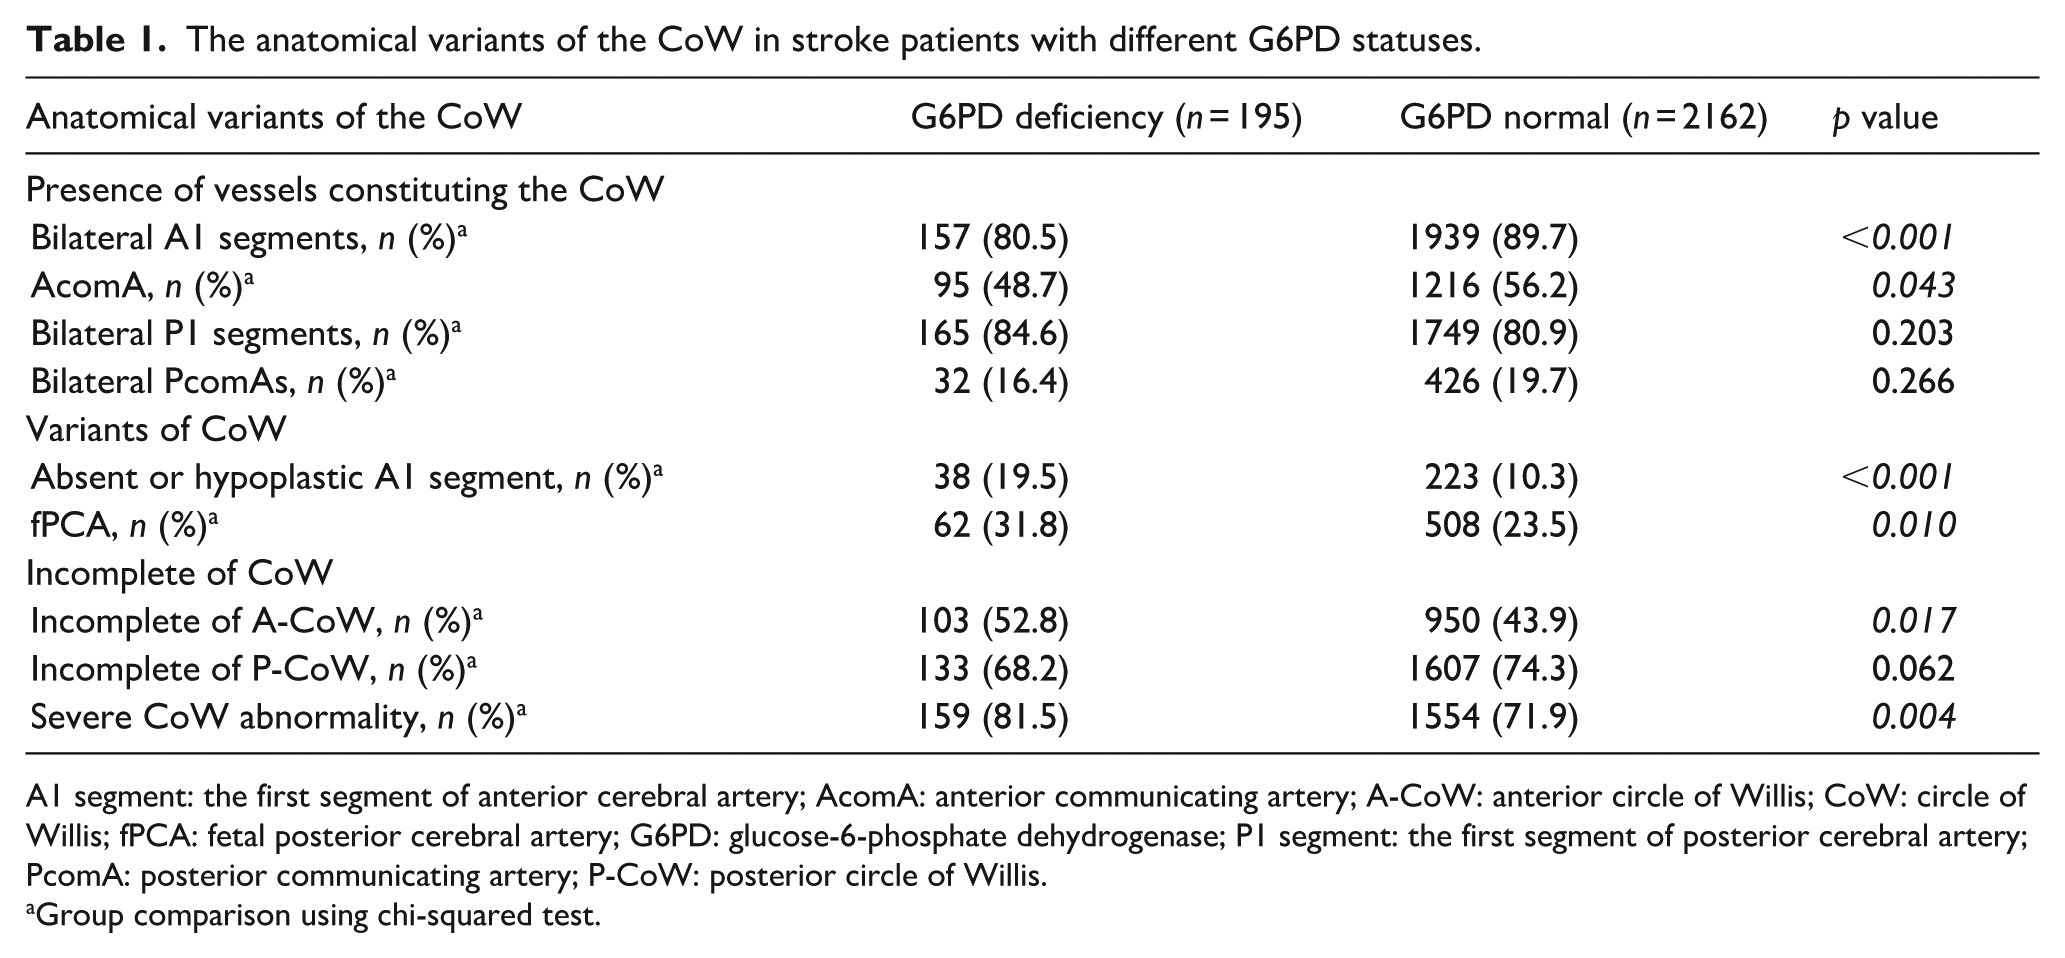
A1 segment: the first segment of anterior cerebral artery; AcomA: anterior communicating artery; A-CoW: anterior circle of Willis; CoW: circle of Willis; fPCA: fetal posterior cerebral artery; G6PD: glucose-6-phosphate dehydrogenase; P1 segment: the first segment of posterior cerebral artery; PcomA: posterior communicating artery; P-CoW: posterior circle of Willis.
Group comparison using chi-squared test.
Collectively, these results suggested that G6PD deficiency increased anatomical variants of the CoW in stroke patients and G6PD might be a candidate gene involved in the cerebrovascular morphology and development.
G6PD deficiency impairs cerebrovascular morphology and angiogenesis in zebrafish during development
Given the association between G6PD deficiency and increased variants in the CoW, we used the zebrafish model to further investigate whether G6PD deficiency has an impact on cerebrovascular patterning or development. The zebrafish is a well-established vertebrate model for in vivo studies of vascular pathology due to its transparency and genetic tractability. 29 We first used pharmacological inhibitor to mimic the G6PD-deficient conditions in zebrafish. Tg(kdrl:eGFP)s843 zebrafish embryos were treated with 6-AN (an inhibitor of G6PD and oxidative PPP) and the vascular network of trunk and brain areas was measured. 24 While the pharmacological inhibitor had no influence on vascular development or patterning of trunk region (Supplemental Figure 2), the cerebrovascular development and morphology underwent significant damage (Figure 1). We performed confocal imaging of the main cerebrovasculature including Willis loop vessels in 5 dpf zebrafish embryos and found abnormally dilated cerebrovasculature in zebrafish embryos treated with G6PD inhibitor. Most of Willis loop vessels including basilar artery (BA), posterior communicating segment (PCS), metencephalic artery (MtA), and basal communicating artery (BCA) presented obvious dilation (Figure 1(a) and (b)). In addition to Willis loop vessels, we also found dilation in dorsal cranial vessels including dorsal longitudinal vein (DLV), posterior cerebral vein (PCeV), middle cerebral vein (MCeV) and mesencephalic vein (MsV).

G6PD inhibition impairs cerebrovascular morphology and development of zebrafish embryos. (a, b) Representative images and relative diameter of the Willis loop and dorsal cranial vessels in embryos with G6PD inhibition compared to Ctrl embryos at 5 dpf. Scale bar, 50 μm. n = 6. (c) Top: representative image of a Tg(kdrl:eGFP)s843 embryo showing the brain blood vasculature (green). The dashed lines delineated the midbrain position. Bottom: 3-D reconstruction of the basal communicating artery (blue), midbrain vasculature (white), and choroidal vascular plexus (red) in the brain. Scale bar, 50 μm. (d–f) Representative images and relative total vessel length and segment number of midbrain vasculature at 3–5 dpf. White arrow, vascular dilation; red arrows, vessel aplasia. Scale bar, 50 μm. n = 6. Data are shown as mean ± SD. Unpaired Student’s t-test or Mann–Whitney test. *p < 0.05. **p < 0.01. ***p < 0.001.
The midbrain vasculature, defined as the vessel network between the BCA and choroidal vascular plexus (CVP) in zebrafish midbrain (Figure 1(c)), undergoes angiogenesis and vessel pruning processes during zebrafish development. The vessel elongation and new vessel addition through angiogenesis can be objectively quantified by the total length and segment number of midbrain vasculature, making the midbrain vasculature an excellent model for evaluating cerebrovascular development. 29 Thus we further performed in vivo long-term serial confocal imaging and 3-D reconstruction of the midbrain vasculature during 3–5 dpf in zebrafish. We also observed vascular dilation and hypoplasia in midbrain vasculature of zebrafish treated with G6PD inhibitor (Figure 1(d)). Compared with the normal development of the midbrain vasculature in control embryos, pharmacological blockade of G6PD led to impaired brain vascular development, as evidenced by markedly reduced total vessel length and segment number during 3–5 dpf (Figure 1(e) and (f)). These data are consistent with previous observations of anatomical variations in the CoW and arterial stenosis in G6PD-deficient patients.
To confirm the results of our pharmacological experiments, we utilized the CRISPR/Cas9 technique to generate g6pd mutants. Consistent with the pharmacological experiments, g6pd mutations (Supplemental Figure 3(a)) created by coinjecting g6pd sgRNA and Cas9 nuclease also caused a significant impairment of the cerebrovascular development during 3–5 dpf in F0 embryos. This was characterized by obvious vascular dilation, hypoplasia or stenosis in Willis loop vessels and dorsal cranial vessels (Figure 2(b) and (c)), and impaired angiogenesis in the midbrain area (Figure 2(d)–(f)).
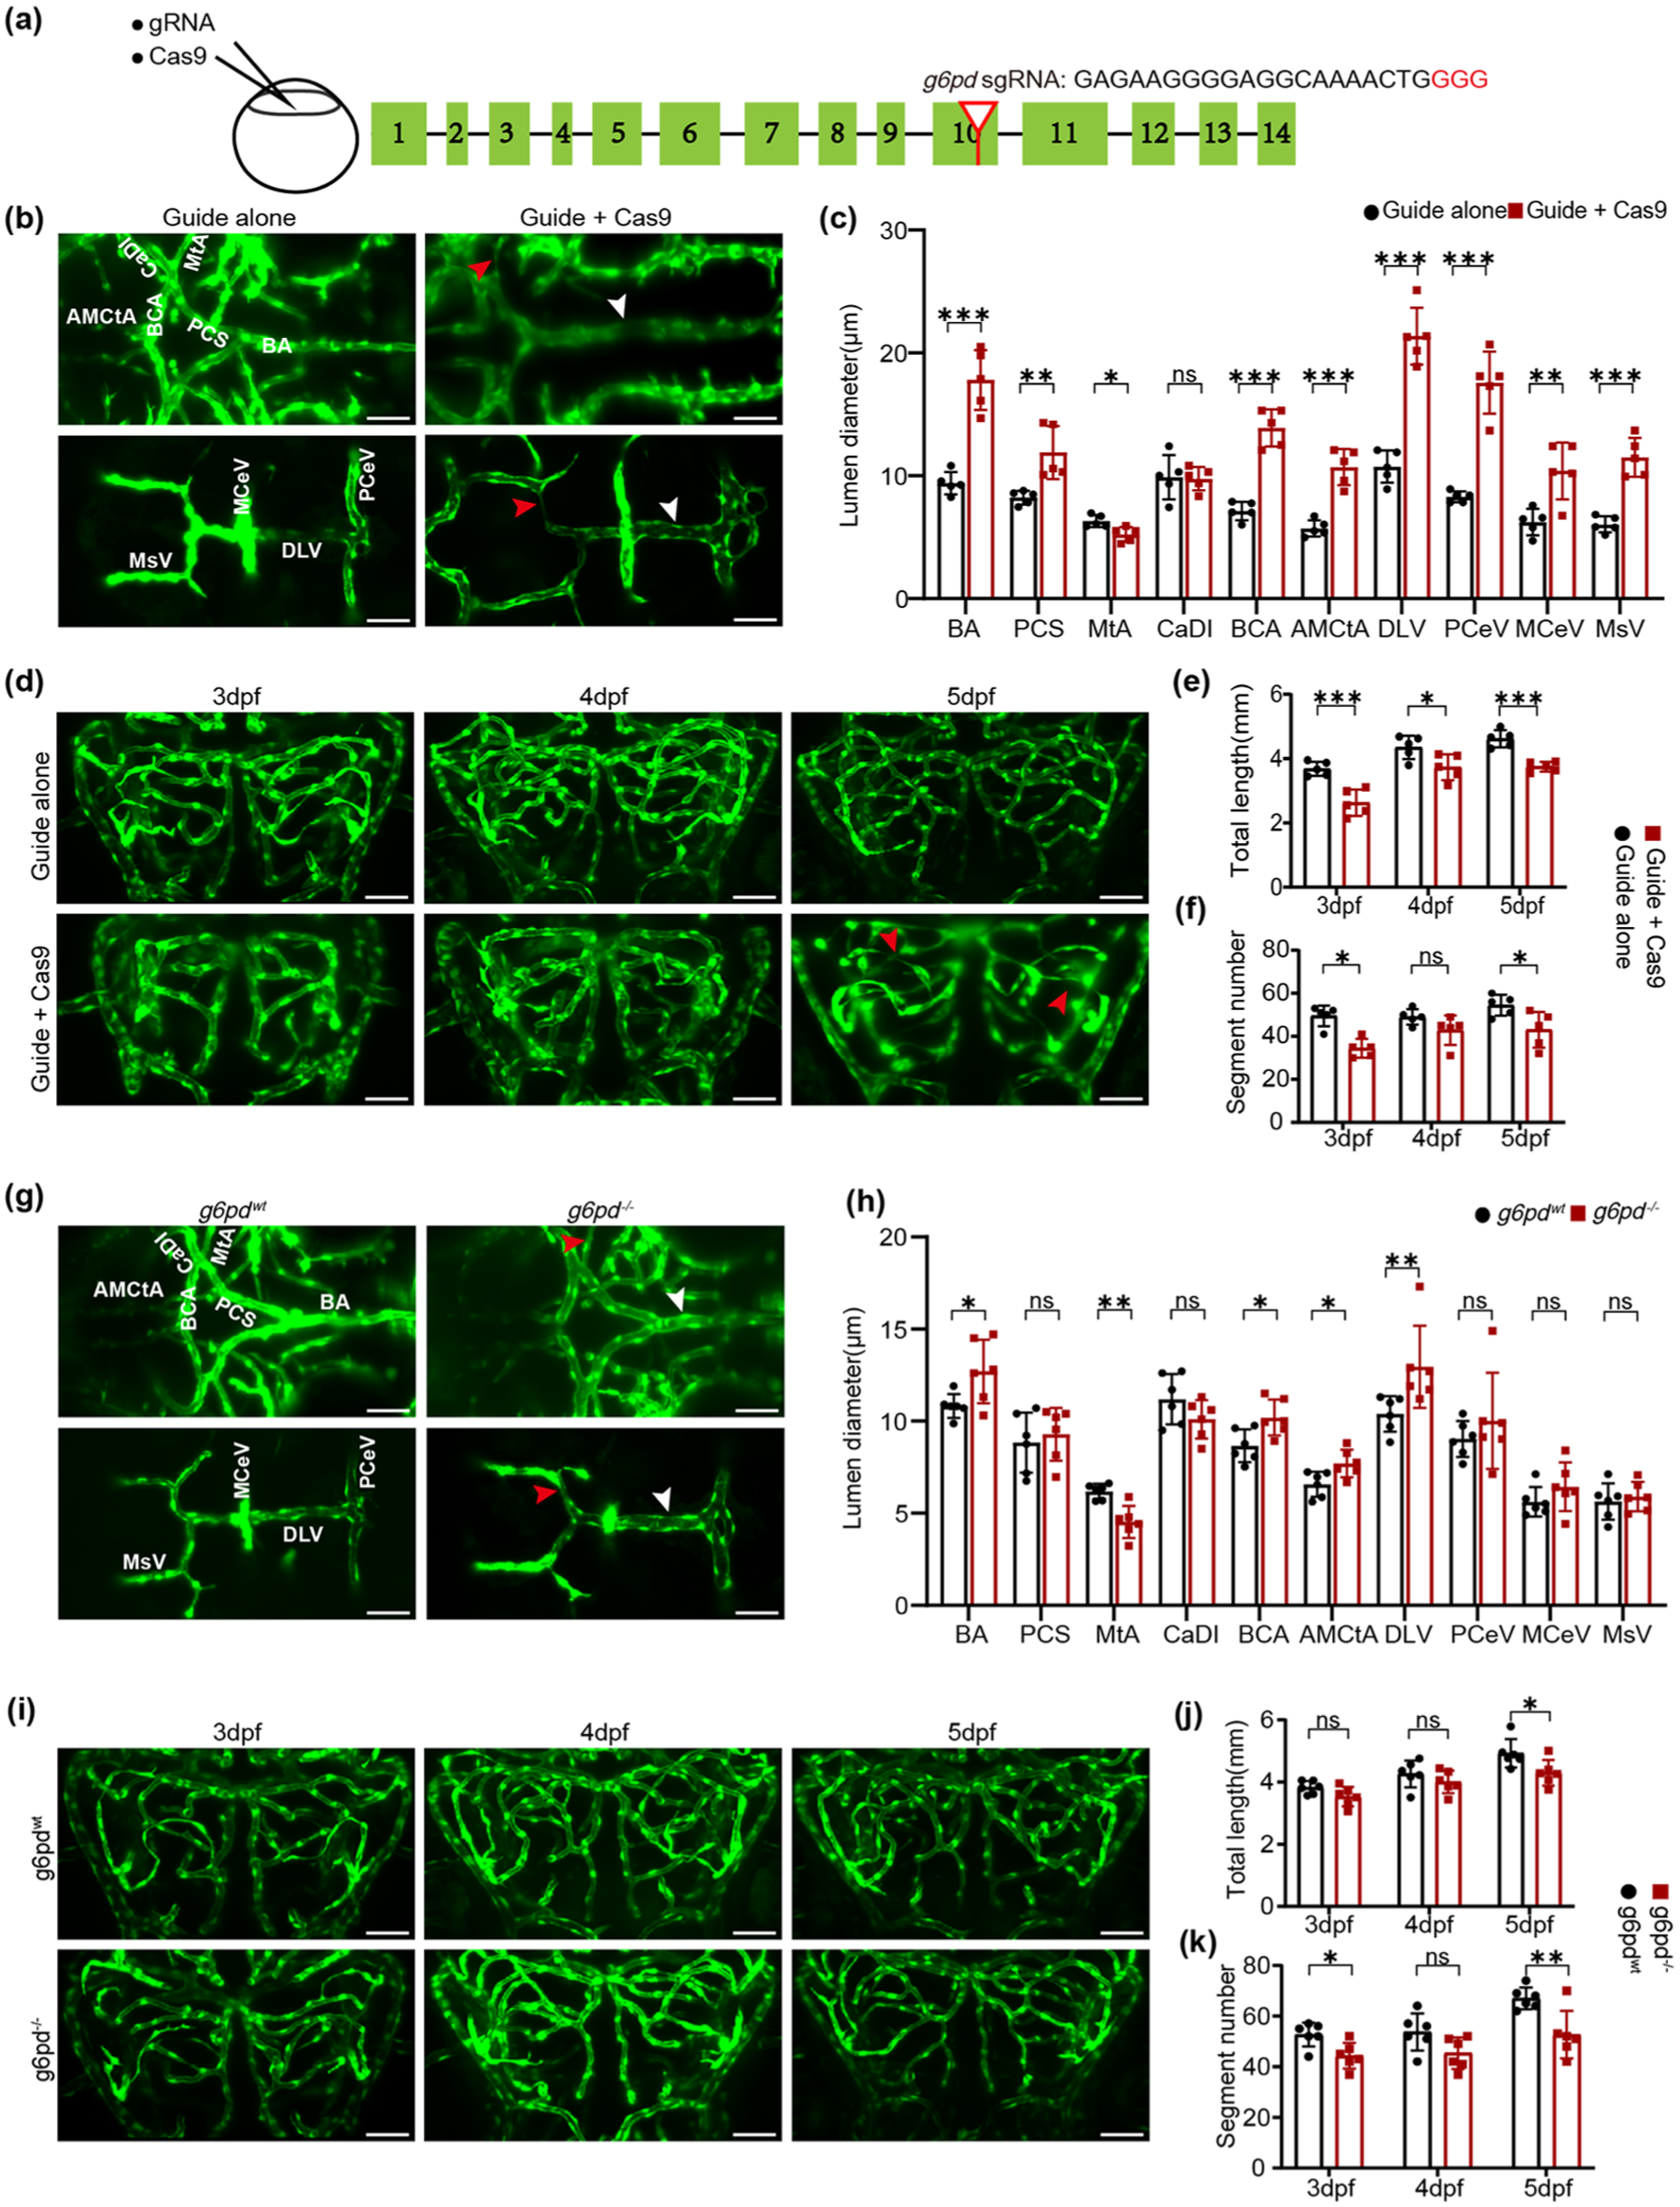
g6pd mutants exhibit impaired brain vasculature during development. (a) Schematic of the zebrafish g6pd gene and the CRISPR targeted sequence. Exons are shown as green boxes. (b, c) Representative images and relative diameter of the Willis loop vessels and dorsal cranial vessels in Guide alone and Guide + Cas9 embryos at 5 dpf. Scale bar, 50 μm. n = 5. (d–f) Representative images and relative total vessel length and segment number of midbrain vasculature in Guide alone and Guide + Cas9 embryos at 3–5 dpf. Scale bar, 50 μm. n = 5. (g, h) Representative images and relative diameter of the Willis loop vessels and dorsal cranial vessels in g6pd−/− compared to g6pdwt embryos at 5 dpf. Scale bar, 50 μm. n = 6/group. (i–k) Representative images and relative total vessel length and segment number of midbrain vasculature in g6pd−/− compared to g6pdwt embryos at 3–5 dpf. Scale bar, 50 μm. n = 6. Data are shown as mean ± SD. Unpaired Student’s t-test or Mann–Whitney test. *p < 0.05. **p < 0.01. ***p < 0.001. White arrows, vascular dilation; red arrows, vessel aplasia or stenosis.
To further investigate the role of g6pd in cranial vessels and reduce the potentially off-target effects, we generated a g6pd−/− mutant line with a 5-bp deletion that resulted in a frameshift mutation that leads to premature stop codon in exon 10. The presence of mutations in g6pd homozygous mutant embryos was confirmed by sequencing (Supplemental Figure 3(b) and (c)). The g6pd zebrafish mutants experienced significant mortality and only about 5% survived to adulthood, which was characterized by reduced body mass. To validate our previous experimental findings, we crossed the mutant lines with Tg(kdrl:eGFP)s843 and performed in vivo long-term serial confocal imaging of the cerebrovasculature during 3–5 dpf. The g6pd homozygous mutants also exhibited cerebrovascular morphological alterations and angiogenesis defects (Figure 2(g)–(k)), but with a milder phenotype compared to embryos treated with the pharmacological inhibitor and F0 crispants, possibly due to the compensatory effect of the stable lines. Taken together, these results have indicated that G6PD deficiency impairs cerebrovascular morphology and angiogenesis in developing zebrafish.
EC-specific g6pd inactivation impairs cerebral angiogenesis in zebrafish
We analyzed public transcriptomics data comparing endothelial cells (ECs) to smooth muscle cells (SMCs) in zebrafish, 41 and found that g6pd and phosphogluconate dehydrogenase (pgd), another critical gene encoding an enzyme involved in the PPP, were mostly expressed in ECs (Figure 3(a)). Using single-cell RNA sequencing data from prenatal human brain, 42 we also found that G6PD mRNA expression in ECs was higher than that in mural cells (Supplemental Figure 4(a)). Immunohistochemistry staining from Human Protein Atlas database showed stronger G6PD protein expression in endothelial cells than in neuronal or glial cells in the human cortical sections (Supplemental Figure 4(b)). Notably, single-cell RNA sequencing of acute and subacute phases after experimental stroke revealed distinct changes in G6pd mRNA expression in mouse ECs compared to other cell types, with increased levels at 2 and 14 days after stroke (Supplemental Figure 4(c)). 43 Furthermore, brain endothelial G6pd expression level was downregulated in aged mice compared to young groups after stroke, especially in ECs characterized by arterial markers and genes involved in metabolic reprogramming and proliferation, presenting age-related gene expression impairment (Supplemental Figure 4(d)). 43 These data from various species and diverse conditions, including developmental and pathological states, have indicated G6PD is primarily expressed in endothelial cells rather than other vascular cells and suggest a physiological role of endothelial G6PD.
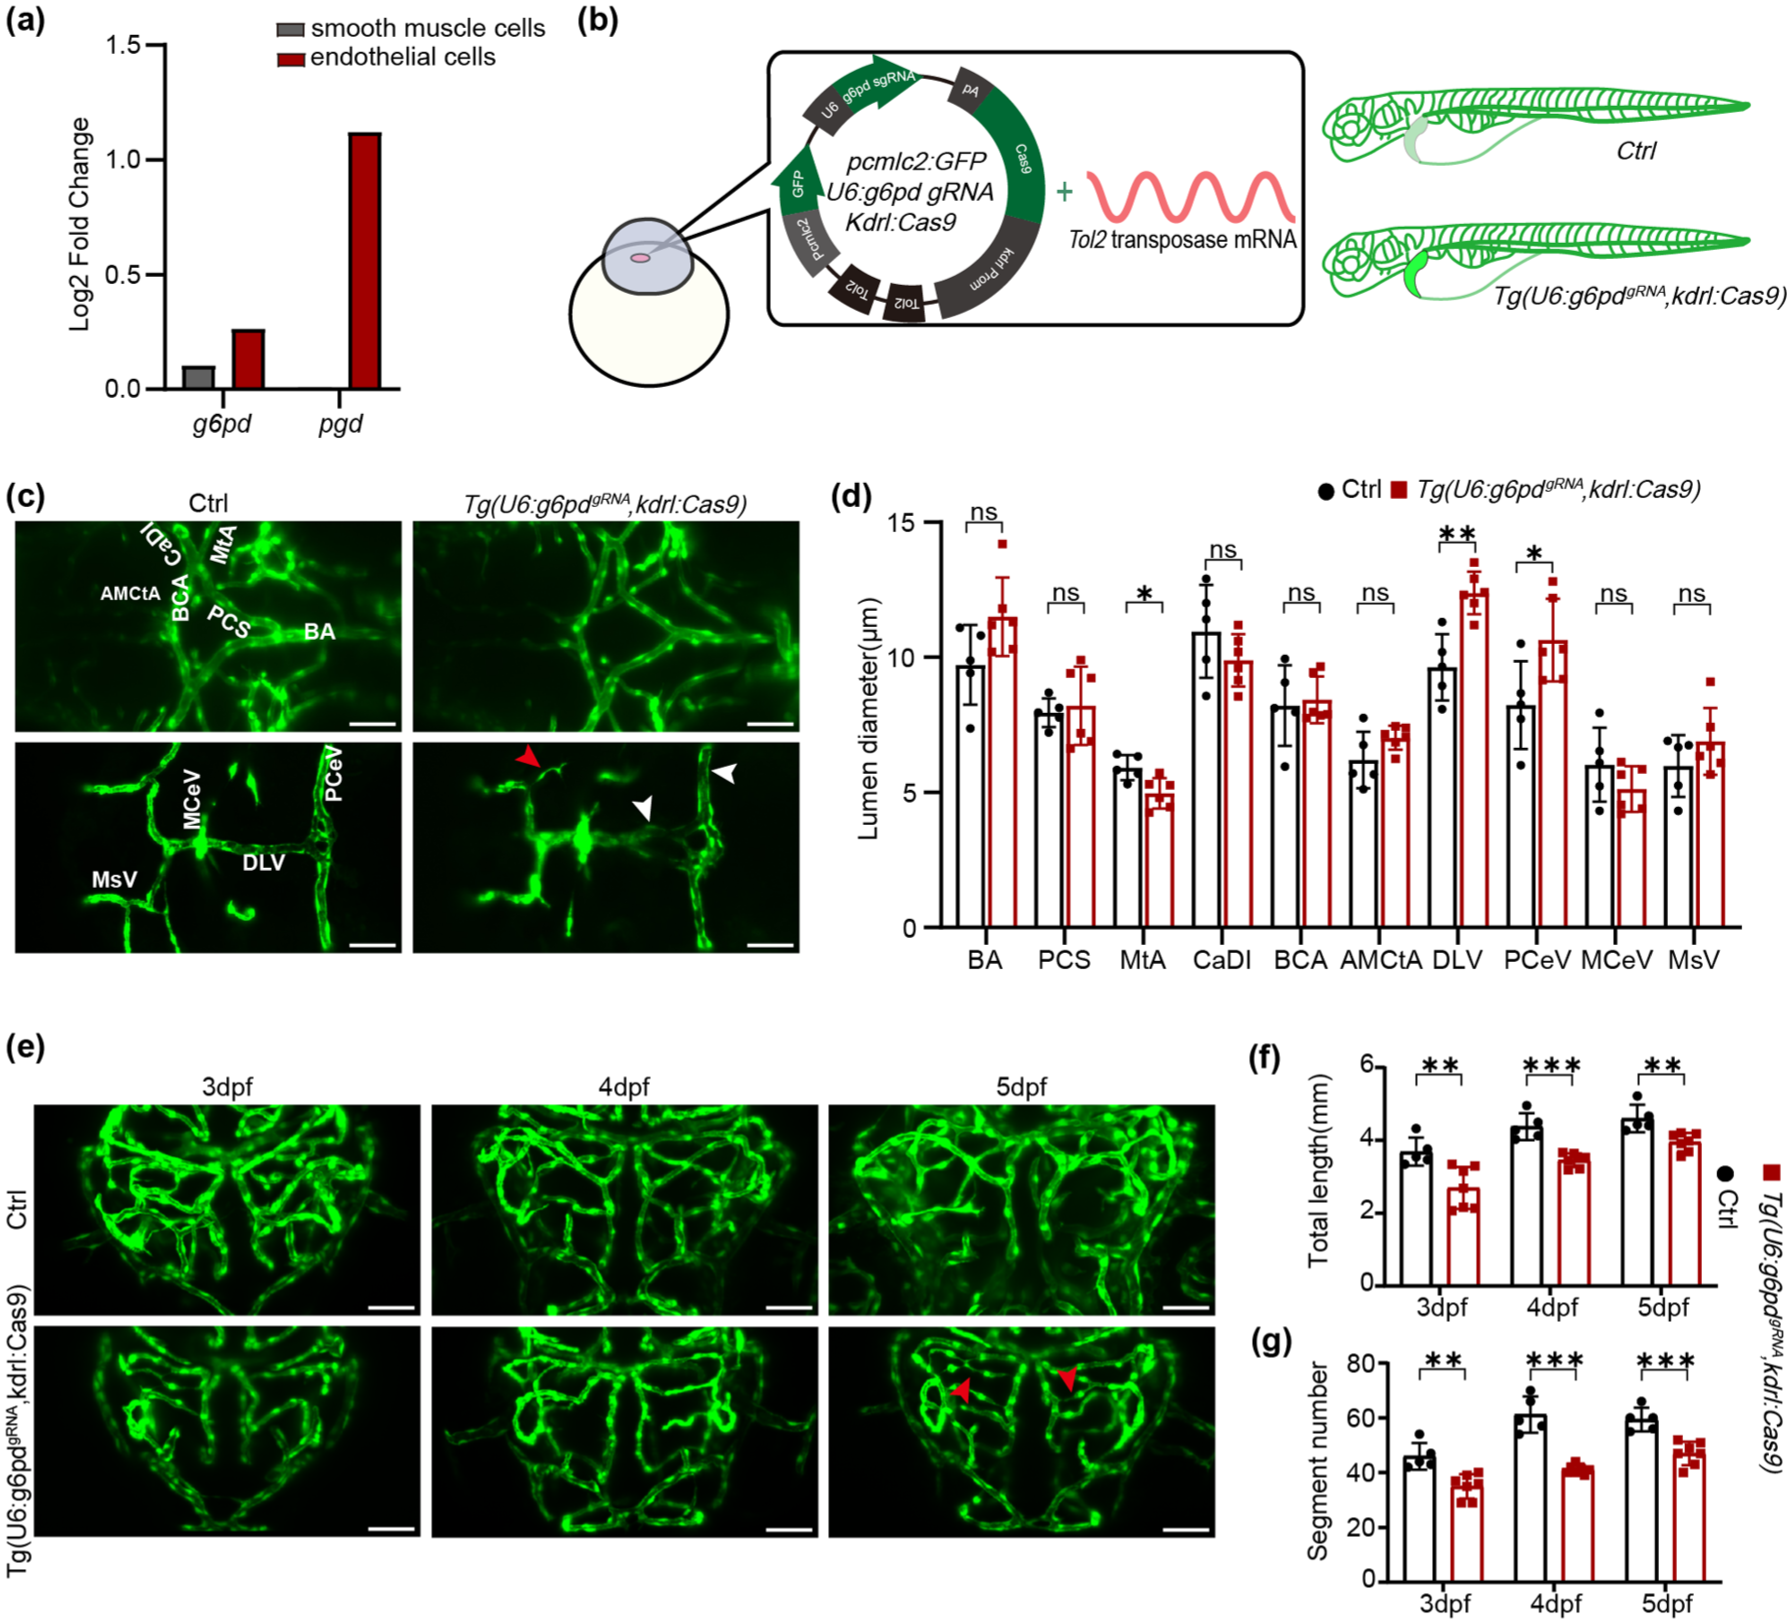
Endothelial g6pd disruption impairs cerebrovascular angiogenesis. (a) Log2 fold changes of g6pd and pgd in zebrafish vascular cells obtained from Whitesell et al. 41 (b) Left, schematic of EC-specific CRISPR-based Knockout of g6pd; right, schematic of the injected embryos with eGFP-positive heart. (c, d) Representative images and relative diameter of the Willis loop vessels and dorsal cranial vessels in EC-specific g6pd knockout (Tg(U6:g6pdgRNA;kdrl:Cas9)) embryos compared to Ctrl at 5 dpf. Scale bar, 50 μm. n = 5 or 6. (e–g) Representative images and relative total vessel length and segment number of the midbrain vasculature in Tg(U6:g6pdgRNA;kdrl:Cas9) compared to Ctrl embryos at 3–5 dpf. Scale bar, 50 μm. n = 5 or 7. Data are shown as mean ± SD. Unpaired Student’s t-test or Mann–Whitney test. *p < 0.05. **p < 0.01. ***p < 0.001. White arrows, vascular dilation; red arrows, vessel aplasia or stenosis.
Thus, we hypothesized that the inactivation of G6PD in ECs impaired cerebrovascular morphology and angiogenesis. By using a CRISPR/Cas9 vector system in zebrafish (Figure 3(b)), we generated EC-specific g6pd knockout mutants (Tg(U6:g6pdgRNA;kdrl:Cas9)). We continued to observe some morphological changes in the Willis loop vessels and dorsal cranial vessels including the stenosis of MtA and dilation of DLV and PCeV in Tg(U6:g6pdgRNA;kdrl:Cas9) embryos (Figure 3(c) and (d)). The selectively inactivated g6pd in ECs during zebrafish development resulted in impaired midbrain vascular morphology and angiogenesis at 3–5 dpf (Figure 3(e)–(g)). To assess whether cerebrovascular abnormalities caused by g6pd disruption persist beyond the embryonic stage, we further examined the brain vasculature at the larval stage and the adult stage (Supplemental Figure 5). Zebrafish with EC-specific g6pd inactivation exhibited significant reductions in both total vessel length and the number of vessel segments at the larval stage (Supplemental Figure 5(a)–(c)). In addition, adult zebrafish with endothelial g6pd disruption showed significantly decreased cerebrovascular length and density (Supplemental Figure 5(d)–(f)), with the diameters of cortical perforators and cortical capillaries remaining unchanged (Supplemental Figure 5(g) and (h)). These results suggest that endothelial g6pd disruption exerts long-term effects on brain vascular development and maintenance.
G6PD knockdown leads to dysfunctional angiogenic response and apoptosis in ECs
The zebrafish experiment highlighted the crucial role of endothelial G6PD in the cerebral vasculature development. To better understand the underlying mechanism, we analyzed publicly available transcriptomics data between G6PD shRNA-treated and scramble shRNA-treated HUVECs. 25 After gene annotation and quality control, a differential expression analysis was performed with edgeR package. 34 A total of 2747 DEGs were identified as shown in Figure 4(a). Biological process enrichment analysis based on GO terms was conducted to explore the possible role of G6PD, which revealed that genes associated with blood vessel development, morphogenesis and angiogenesis were significantly enriched. Meanwhile, genes associated with the positive regulation of programmed cell death and apoptotic process were also enriched (Figure 4(b)). Reactome pathway enrichment analysis and KEGG analysis also showed that genes belonging to vascular maturation-related pathways such as ECM organization, ECM-receptor interaction, and apoptosis were significantly enriched (Figure 4(c) and (d)). These results suggested that G6PD knockdown mainly disturbed the vessel development and apoptosis signaling. Furthermore, genes associated with VEGF pathway were significantly enriched including increased expression of VEGF receptor VEGFR2 (Figure 4(e) and (f)). Thus, we subsequently performed in vitro experiments to examine the role of G6PD in VEGF-mediated endothelial cell proliferation. BEND3 cells were transfected with siRNA to mimic a loss-of-function condition of G6PD in cerebrovascular endothelial cells. The siNC- and siG6PD-treated bEND3 cells were stimulated with VEGF for 24h and cell proliferation was evaluated by EdU staining. Compared with siNC-treated cells, the siG6PD-treated bEND3 cells demonstrated a significantly decreased cell proliferation ratio in basal and VEGF-stimulated conditions. Furthermore, the siG6PD-treated bEND3 cells were resistant to VEGF stimulation as the cell proliferation ratio remained unchanged whether to add VEGF or not (Figure 5(b) and (c)). Wound healing assays were used to evaluate cell migration, and the siG6PD-treated bEND3 cells showed a significantly decreased migration area at 24h compared to siNC-treated bEND3 cells (Figure 5(d) and (e)). We also evaluated apoptosis using TUNEL staining, and found that siG6PD-treated bEND3 cells showed a higher apoptotic rate compared to siNC-treated cells (Figure 5(f) and (g)).

Bioinformatics analyses in G6PD knockdown ECs. (a) Volcano plot showing 2747 DEGs between G6PD shRNA-treated and scramble shRNA-treated HUVECs, including 1537 upregulated (red) and 1210 downregulated (green) DEGs. (b) GO term biological process analysis in the G6PD-related DEGs. (c) Reactome enrichment analysis of pathway significantly enriched in the G6PD-related DEGs. (d) KEGG enrichment analysis of pathway significantly enriched in the G6PD-related DEGs. (e) Dot plots of the Reactome enrichment analysis on the DEGs of angiogenesis pathway in EC. (f) Heatmap for VEGF pathway and apoptosis related genes of Scramble shRNA and G6PD shRNA ECs.

Endothelial G6PD knockdown impairs proliferation and migration but increases cell apoptotic rate. (a) Two designed siRNA sequences were used to mimic G6PD loss-of-function conditions, which were confirmed by qRT-PCR analyses. n = 4 or 5/group. Data are shown as mean ± SD. One-way ANOVA followed by Tukey test. (b, c) Representative images and relative quantification of EdU-positive cells in bEND3 treated with siNC, siG6PD, siNC and VEGF, or siG6PD and VEGF. Hoechst 33342 was used for nuclear staining. Scale bar, 50 μm. n = 6. Data are shown as mean ± SD. One-way ANOVA followed by Tukey test. (d, e) Representative images and relative quantification of wound healing assay to measure bEND3 migration. Scale bar, 100 μm. n = 12 or 13/group. Data are shown as mean ± SD. unpaired Student’s t-test. (f, g) Representative images and relative quantification of TUNEL-positive cells in bEND3 treated with siNC and siG6PD. Scale bar, 100 μm. n = 6. Data are shown as mean ± SD. Unpaired Student’s t-test. **p < 0.01. ***p < 0.001.
Discussion
In this study, we evaluated cerebrovascular imaging data of G6PD-deficient patients from a stroke cohort and found that patients with G6PD deficiency exhibited more variability in the CoW, with a lower presence of AComA and bilateral A1 segments, but higher incidence of fPCA. To confirm that G6PD deficiency is associated with cerebral vasculature abnormalities, we generated several G6PD-deficient zebrafish models, including pharmacological inhibition, g6pd F0 crispants and g6pd homozygous mutants, and found all of them presented varying degrees of vascular dilatation, hypoplasia and impairment of cerebrovascular angiogenesis. Since transcriptome analysis indicated that g6pd is primarily expressed in ECs, we generated EC-specific g6pd knockout zebrafish and found that selective inactivation of g6pd in ECs impaired brain angiogenesis and vascular morphology during development, with cerebrovascular abnormalities persisting into adulthood, suggesting that g6pd within ECs might play a critical role in cerebrovascular development. Public transcriptomic data analysis and in vitro experiments further corroborated that G6PD deficiency led to angiogenesis dysfunction and induced activation of apoptotic signaling pathways in ECs. Taken together, these findings provide insight into the congenital basis of cerebrovascular anatomical variations. Given its high global prevalence, G6PD deficiency may contribute to cerebrovascular risk. Our results highlight a potential link between G6PD deficiency and cerebrovascular pathology, providing a basis for further investigation into the developmental mechanisms underlying these abnormalities, potentially informing future therapeutic strategies for conditions such as intracranial atherosclerosis and stroke.
An estimated 400 million people are affected by G6PD deficiency globally, which is more prevalent in African Americans, Asians and people from the Mediterranean region. 1 Populations with G6PD deficiency exhibit higher incidences of cardiovascular and cerebrovascular events. 2 In this study, our results showed that the morphology of CoW varied significantly between patients with different G6PD status. Patients with G6PD deficiency demonstrated a lower presence of AcomA, bilateral A1 segments, complete anterior CoW and higher proportion of fPCA. To further evaluate cerebrovascular involvement, we quantified CoW abnormality severity using a validated scoring system and found that severe abnormalities were more frequent in the G6PD-deficient group. This supports a potential association between reduced G6PD activity and increased structural vulnerability in the brain vasculature. Atherosclerotic stenosis of major arteries, particularly the ICA and MCA, is common in stroke populations and may influence cerebral vascular architecture. To clarify whether the anatomical differences observed in the CoW were primarily congenital or potentially influenced by such acquired vascular changes, we analyzed the relationship between CoW variants and significant atherosclerotic stenosis in these arteries. However, our analysis showed no significant difference in the prevalence of CoW abnormalities between patients with and without such stenosis. This suggests that atherosclerosis is unlikely to be the primary contributor to the CoW variants observed in this cohort. Supporting this, patients with G6PD deficiency in our study had similar rates of hypertension and diabetes, and a lower prevalence of hyperlipidemia compared to those with normal G6PD activity, further indicating that these vascular anomalies are less likely secondary to conventional vascular risk factors. In addition, CoW variants have been reported in more than half of the population, and are attributed to genetic, environmental, or other factors.19,44,45 The most prevalent variants are the fPCA followed by the absence of the AcomA. 45 It is worth noting that these two variants are mainly caused by hereditary differences, since they are also prevalent in infants and children.46,47 Thus, in our study, the higher proportion of fPCA and absence of the AcomA in G6PD-deficient patients may not be acquired, but could be primarily determined during the embryonic stage, suggesting that G6PD deficiency may affect brain vasculature in humans.
Previous studies show that pharmacological inhibition of G6PD has no impact on vascular formation or morphology, with unaltered numbers of ECs and vessel diameter in the dorsal aorta (DA) of the zebrafish embryos. 25 Our data was consistent with these results. G6PD inhibition exerted no influence on the length of intersegmental vessels or the diameter of DA and posterior cardinal vein (PCV). However, the formation of cerebral vasculature did not follow the same pattern as that observed in zebrafish trunk. Pharmacological inhibition of G6PD resulted in significant disruption of cerebrovascular morphology and angiogenesis in zebrafish embryos, presenting as marked vascular dilation, hypoplasia or stenosis in Willis loop vessels and impaired angiogenesis in the midbrain. The phenotypes were further confirmed in the g6pd F0 mutants. These data matched our findings of increased anatomical variations in the CoW of the G6PD-deficient patients. Similarly, another study observed that G6PD (-) embryos of G6PD heterozygous mutant mice present dramatically dilated blood vessels and hemorrhages in the mesenchyme of the head. 48 The g6pd homozygous mutants also exhibited cerebrovascular morphological alterations and angiogenesis defects, but with a milder phenotype compared to embryos treated with pharmacological inhibitors and F0 crispants. This may be due to the compensatory effect triggered by mRNA bearing a premature termination codon. 49 Other potential underlying mechanisms include unexpectedly non-mutagenic lesion, maternal contribution and off-target effects. 50 Together, all the G6PD-deficient zebrafish models demonstrated varying degrees of cerebral vasculature morphological abnormalities and dysfunctional angiogenesis, suggesting G6PD contributes to the cerebral vasculature during zebrafish development.
The public transcriptomics data show that g6pd is mostly expressed in ECs of zebrafish. 41 Single-cell RNA sequencing data from human embryonic vasculature and post-stroke mouse models both reveal the transcriptional specificity of G6PD in ECs.42,43 Another study confirms that g6pd and pgd are expressed almost exclusively in ECs rather than SMCs by fluorescence-activated cell sorting (FACS) analyses in zebrafish embryos. 25 Moreover, the G6PD-driven oxidative PPP has been reported to control vascular mural cell coverage and maintain SMC survival.25,51 In this study, taking advantage of a CRISPR/Cas9 vector system for tissue-specific gene disruption in zebrafish, we generated EC-specific g6pd knockout mutants. Selective inactivation of g6pd in ECs impaired brain angiogenesis and morphology during zebrafish development, suggesting that g6pd within ECs might play a critical role in cerebrovascular development. In addition, the sustained vascular defects observed in adult zebrafish with endothelial-specific g6pd disruption further support its essential role in both the development and maintenance of the cerebrovascular system, and highlight its potential contribution to the pathogenesis of congenital or progressive vascular disorders.
G6PD has been proven to have proangiogenic effects in vitro and in pathological models.14,15,52,53 Previous studies show that G6PD deficiency significantly impairs vascular endothelial cell proliferation, migration and tube formation in vitro, and disrupts formation of tubes and networks in the mouse Matrigel plug assay.14,15 Recently, two in vivo studies show the importance of G6PD and PPP in muscle angiogenesis.52,53 G6PD also participates in the process of apoptosis. Studies have shown that G6PD inhibition leads to the stabilization of p53 and induction of pro-apoptotic signaling.13,54 In line with these studies, the enrichment analysis of transcriptomics data in G6PD knockdown ECs showed that genes related to angiogenesis and apoptosis signaling were among the most significantly enriched. Furthermore, our public transcriptomic analysis found that VEGF pathway was significantly enriched and identified differential expression of VEGF pathway genes. However, our results showed that siG6PD-treated bEND3 cells were resistant to VEGF stimulation and had a greater apoptotic rate, suggesting that G6PD knockdown leads to impaired angiogenic signaling, dysfunctional angiogenesis and apoptosis, which could be the underlying mechanism contributing to cerebrovascular defects.
There are some limitations in our present study. First, the anatomical characteristic of CoW was evaluated mostly by MRA in our study, which would underestimate the size of vessels, and we included only patients with stroke. Future studies in healthy and younger populations are warranted. Second, we did not perform genetic analysis of G6PD variants, which limited our ability to investigate genotype–phenotype correlations. Future studies incorporating both enzymatic and genetic assessments of G6PD deficiency are needed to elucidate its mechanistic role in cerebrovascular development. In addition, the cerebrovascular observation in the zebrafish experiments was based solely on endothelial cell labeling. Although the transgenic line used provided clear visualization of cerebrovascular abnormalities, future studies incorporating zebrafish lines labeling additional vascular components, as well as validation in mammalian models, are needed for a more comprehensive characterization of the vascular phenotypes observed. Finally, the molecular mechanisms underlying cerebrovascular abnormalities resulting from G6PD deficiency require further study.
In conclusion, we showed that G6PD deficiency was associated with anatomical variants of the CoW in stroke patients, and we first demonstrated that G6PD deficiency altered cerebrovascular morphology and impaired angiogenesis during zebrafish development. These findings highlight the clinical relevance of the relationship between G6PD deficiency and the pathophysiology of cerebrovascular diseases, and improve understanding of cerebrovascular development, stimulating research into new therapeutic options for cerebrovascular diseases such as intracranial atherosclerosis and stroke.
Supplemental Material
sj-docx-1-jcb-10.1177_0271678X251377678 – Supplemental material for G6PD deficiency is implicated in Circle of Willis variants in stroke patients and impairs brain vasculature in zebrafish
Supplemental material, sj-docx-1-jcb-10.1177_0271678X251377678 for G6PD deficiency is implicated in Circle of Willis variants in stroke patients and impairs brain vasculature in zebrafish by Yuangui Cai, Jianle Li, Yicong Chen, Zilin Ou, Jiating Wei, Xiya Long, Zhiyi Xiong, Miaoxian Yang, Yingxin He, Hailin Yan, Tingna Zhu and Jinsheng Zeng in Journal of Cerebral Blood Flow & Metabolism
Footnotes
Acknowledgements
We extend our sincere appreciation to the patients and their families who have contributed to this study. We thank Lanying Lin for assistance with the zebrafish husbandry and Dongxian Wang (Institute of Precision Medicine, The First Affiliated Hospital, Sun Yat-sen University) for assistance with the confocal imaging system.
Funding
The author(s) disclosed receipt of the following financial support for the research, authorship, and/or publication of this article: This work was supported by grants from the Natural Science Foundation of China (82371308, 82130035, 82401521, 82101399), Sun Yat-sen University Clinical Research 5010 Program (2018001), Guangdong Provincial Clinical Research Center for Neurological Diseases (2020B1111170002), the Guangdong Provincial Key Laboratory for Diagnosis and Treatment of Major Neurological Diseases (2020B1212060017), Guangdong Province International Cooperation Base for Early Intervention and Functional Rehabilitation of Neurological Diseases (2015B050501003 and 2020A0505020004), Guangdong Provincial Engineering Center for Major Neurological Disease Treatment, Guangdong Provincial Translational Medicine Innovation Platform for Diagnosis and Treatment of Major Neurological Disease, Guangzhou Clinical Research and Translational Center for Major Neurological Diseases (201604020010).
Author contributions
Yuangui Cai and Jianle Li collected the data, analyzed the results, and drafted the manuscript. Yuangui Cai, Jiating Wei, Xiya Long, Miaoxian Yang, and Zhiyi Xiong conducted the animal and in vitro experiments. Jianle Li, Yicong Chen, Zilin Ou, Yingxin He, Hailin Yan, and Tingna Zhu contributed to patient recruitment and assessment of cerebrovascular imaging data. Jinsheng Zeng conceived the study and edited the manuscript.
Declaration of conflicting interests
The authors declared no potential conflicts of interest with respect to the research, authorship, and/or publication of this article.

Data availability statement
The datasets generated and analyzed during the current study are available from the corresponding author on reasonable request. In our article we included publicly available gene expression data deposited in GEO with the accession code PRJNA669230.
Supplemental material
Supplemental material for this article is available online.
References
Supplementary Material
Please find the following supplemental material available below.
For Open Access articles published under a Creative Commons License, all supplemental material carries the same license as the article it is associated with.
For non-Open Access articles published, all supplemental material carries a non-exclusive license, and permission requests for re-use of supplemental material or any part of supplemental material shall be sent directly to the copyright owner as specified in the copyright notice associated with the article.
