
Abstract
Synaptic vesicle glycoprotein 2A (SV2A) PET imaging enables the estimation of synaptic density in the brain. The most widely used SV2A tracer, 11C-UCB-J, shows age-related effects in healthy volunteers (HV) and its short radioactive half-life limits clinical applicability. 18F-SynVesT-1 has a longer half-life, but its quantification and dependence on age/sex need further validation. In this study, 40 HV aged 24–85 (21F/19M) underwent 90-min 18F-SynVesT-1 PET–MR with arterial sampling. Distribution volumes (VT) and distribution volume ratios (DVR) were estimated using one-tissue (1TC) and two-tissue (2TC) compartment models, and Logan graphical analysis (LGA). 1TC and LGA showed strong agreement with 2TC VT (R2 ⩾ 0.97). Standardised uptake value ratios (SUVR) were evaluated across different time windows, using the centrum semiovale (CSO) and cerebellar (pseudo-)reference regions. SUVRCSO 60–90 min correlated best with DVRCSO. The thalamus and cingulate cortex showed age-related decreases in 18F-SynVesT-1 DVRCSO (~2%/decade). Ten subjects (52 ± 21 years; 5F/5M) also underwent 11C-UCB-J PET for a head-to-head comparison. 18F-SynVesT-1 showed lower cortical VT (−7% ± 9%) but higher DVRCSO (37% ± 4%). This study shows that 18F-SynVesT-1 can be reliably quantified by SUVR in healthy volunteers, and correlates well with 11C-UCB-J. These findings support the broader application of 18F-SynVesT-1. This study was registered on clinicaltrial.gov (NCT05384353).
Introduction
Synaptic vesicle glycoprotein 2A (SV2A) is a presynaptic protein, that is, expressed in most synapses of the human brain. 1 Positron emission tomography (PET) imaging of SV2A has been regarded as a proxy for measuring synaptic density in vivo. 2 The most widely published SV2A PET tracer is 11C-UCB-J. 3 11 C-UCB-J binding was shown to be negatively correlated with age in the caudate nucleus but not influenced by sex.4 –6 11C-UCB-J imaging studies have demonstrated lower SV2A binding in multiple neurodegenerative disorders 7 such as Alzheimer’s,8,9 Parkinson’s 10 and Huntington’s disease 11 and showed that tracer binding was significantly associated with clinical symptoms.12 –14 However, the short radioactive half-life of 11C-UCB-J (about 20 min) is suboptimal for widespread research and potential clinical use. To overcome this, a UCB-J derivative labelled with 18F, 18F-SynVesT-1, was developed. 15 A first-in-human evaluation in eight healthy volunteers (HV) demonstrated that 18F-SynVesT-1 displays excellent kinetics and binding properties in the human brain and that its regional distribution volumes (VT) and binding potentials (BPND) are comparable to those of 11C-UCB-J. 15 In this pilot study, a one tissue compartment model was found to fit the kinetic profile of 18F-SynVesT-1 best. In a subsequently published subset of seven HV, a two-parameter variant of a simplified reference tissue model (SRTM2) that uses a global value for the washout time constant in the reference region was found to produce little bias for calculation of BPND. 16 However, both studies included a low number of participants and to the best of our knowledge, a validation in an independent and larger HV cohort has not been performed. Moreover, the influence of age and sex on 18F-SynVesT-1 binding has not been investigated.
This study included 40 HV (aged 24–85) who underwent dynamic 18F-SynVesT-1 PET-MR scanning with full kinetic modelling. First, we validated which kinetic model was most suitable for quantification of 18F-SynVesT-1 and whether a Logan graphical analysis (LGA) would result in an appropriate fit of the data as well. Second, we assessed which SUVR time windows and (pseudo-)reference regions most closely matched full kinetic quantification. Third, we investigated the association of 18F-SynVesT-1 binding with age and sex. Finally, we directly compared 18F-SynVesT-1 and 11C-UCB-J in a subset of 10 HV with regard to VT and kinetic microparameters.
Methods
Participants
Adult HV aged 18–85 were recruited through local newspapers and internet advertisements between June 2022 and January 2025. Inclusion and exclusion criteria are given in the Supplementary Material. In short, participants had no history of any major internal, neurological or psychiatric disease, no history of substance abuse and they were not a first-degree relative of a person with a neurological or psychiatric history.
All participants with mini-mental state examination (MMSE) scores lower than 28 were excluded and participants aged >50 underwent amyloid PET imaging with 18F-NAV4694 for subcohort characterisation. These images were visually interpreted by an experienced reader (KVL) in a binary fashion to determine amyloid positivity.
The study was approved by the ethics committee UZ/KU Leuven and was conducted according to the latest version of the Declaration of Helsinki. The study was registered on clinicaltrials.gov (NCT05384353). All participants gave written informed consent prior to study enrolment.
PET data acquisition and processing
All HVs underwent a 90-min 18F-SynVesT-1 PET-MR (mean injected activity: 145 ± 12 MBq; molar activity: 332 ± 191 GBq/μmol; injected mass dose: 0.27 ± 0.17 μg). Ten participants additionally underwent a 90-min 11C-UCB-J PET-MR (mean injected activity: 262 ± 60 MBq; molar activity: 340 ± 167 GBq/μmol; injected mass dose: 0.62 ± 0.34 μg). 18F-SynVesT-1 and 11C-UCB-J were administered as a bolus injection. Arterial blood samples were drawn every 10 s from 10 to 90 s, every 15 s from 90 s to 3 min; and then at 3.5, 5, 6.5, 8, 12, 15, 20, 25, 30, 45, 60, 75 and 90 min for both tracers. Arterial blood and plasma samples were counted with a calibrated well counter. Additional arterial blood samples were collected at 3, 8, 15, 30, 60 and 90 min for metabolite analysis.
All PET images were acquired using a 3T General Electric (GE) Signa PET-MR system with time-of flight PET acquisition. Dynamic scan data were reconstructed in 30 frames (6 × 15 s, 3 × 30 s, 3 × 60 s, 3 × 3 min, 15 × 5 min) with corrections for attenuation, normalisation, scatter, deadtime and radioactive decay. Simultaneously with the PET acquisition, a 3D T1-weighted MRI was acquired using a 32-channel head coil. Standardised uptake values (SUV) were generated, and motion correction was performed by rigid co-registration of all frames to an average of the early frames (PMOD v4.1; Zurich, Switzerland). Subsequently, PET images were co-registered to the corresponding T1-weighted MRI (PMOD v4.1) and segmented with the CAT12 toolbox of Statistical Parametric Mapping (SPM12; Wellcome Trust Centre for Neuroimaging). PET volumes of interest (VOIs) were defined based on tissue probability maps, the Neuromorphometrics atlas and the Mori atlas (for the pons). A centrum semiovale (CSO) reference region VOI was determined as previously described. 17 The following 12 grey matter regions were selected for further analysis: frontal, parietal, occipital and temporal cortex, cingulate (anterior and posterior combined), insula, hippocampus, amygdala, putamen, caudate, thalamus and cerebellar (CBL) cortex. Regional tissue time-activity curves (TACs) were generated and weighted for decay and frame duration for fitting (PMOD v4.1). Whole blood and plasma curves were linearly interpolated. Metabolite fractions (intact parent tracer) were fitted using a sigmoid curve. For 18F-SynVesT-1, regional VT values were computed using one and two-tissue compartment (1TC, 2TC) models and LGA. For LGA, a t* of 30 min post injection and fixed vB of 0.05 were used. For 11C-UCB-J, a 1TC model was used as previously validated.18,19 Additionally, parametric VT images were created using LGA and were used for further analyses including distribution volume ratios (DVR). DVR was calculated as VT (target region)/VT (reference region). The CSO was used as the main validated reference region to compute regional DVR. Since the CSO is not completely devoid of specific binding, we regarded this as a pseudo-reference region and therefore BPND was not calculated. Exploratively, the pons and three different cerebellar regions (CBL white matter, CBL cortex and whole CBL) were tested as potential pseudo-reference regions to assess their validity when using an SUVR simplification. Mean SUVR were calculated using 15- and 30-min windows across each reference region and assessed at timepoints in 5-min increments post-injection, in comparison to DVR values derived from the parametric VT images. Partial volume correction (PVC) was applied to SUVR and parametric LGA images using a region-based voxelwise technique. 20
Statistical analysis
Statistical analyses were performed in RStudio 4.3.2 (R Foundation for Statistical Computing, Vienna, Austria) and Python 3.11.
F-tests were performed with 1TC as the nested model for all fits (12 regions for 40 subjects = 480 fits). Additionally, Akaike information criterion (AIC) values were compared between 1TC and 2TC models. To compare micro- and macroparameters between kinetic models, a Wilcoxon signed rank test was used, because of the outliers that can occur in these comparisons (e.g. very high percentage standard error (%SE) for individual fits).
Results and differences between parameters were expressed in mean or median depending on the normality distribution of the underlying data. Coefficients of variation (CoV) were calculated by dividing the standard deviation by the mean of the DVR.
Linear regression models were used to compare kinetic model parameters of different models and both tracers and to assess the relationship with age. Next to visual assessment of scatter and residual plots, normality and homoscedasticity were formally assessed by Shapiro-Wilk tests and Bruesch–Pagan tests. Outlier VT values (determined as values ⩾50) were excluded from these regression analyses. For the comparison of parametric VT images obtained using LGA and SUVR-derived estimates from different time windows, voxelwise linear regressions were performed separately for each SUVR time window. Each regression included all voxels within subject specific grey matter masks, obtained by thresholding the grey matter probability map at 0.5. These were taken together in a single population-level fit between SUVR and DVR. Based on this global fit, residual values were calculated for every voxel in each subject, and these residuals were then averaged across subjects to generate parametric residual maps reflecting regional deviations from the overall population relationship.
VOI-based analyses were considered significant below a p value of 0.0042 (Bonferroni corrected for 12 regions).
Results
Demographics
We included a total of 40 HVs. The median age was 60 years (range 24–85), and the cohort included 19 males. The mean MMSE score was 30 ± 0.6; four subjects (age 53–77, 3M/1F) were cognitively unimpaired but positive for amyloid-β pathology on 18F-NAV4694 PET. For the 10 subjects who underwent both 18F-SynVesT-1 and 11C-UCB-J (age 58 ± 19; 5M/5F), the average time between both scans was 12 ± 5 weeks.
18F-SynVesT-1 kinetic modelling
A 2TC model resulted in better fits with lower AIC values compared to a 1TC model in all regions except for the amygdala, putamen and caudate. Examples of fitted TACs for frontal cortex, hippocampus, cerebellum, putamen and CSO are shown in Figure 1. F-tests favoured a 2TC model in 72% of fits. While a 1TC model could reliably estimate VT, K1 and k2 with %SE <10% in all regions and subjects, a 2TC model sporadically failed to fit VT and K1, yet still with %SE <10% in 98% (VT) and 96% (K1) of regions. Moreover, k2, k3 and k4 could not be reliably estimated by the 2TC model. The %SE of VT,2TC in the CSO was >10% in 45% of cases, while VT,1TC was always reliably estimated (%SE ⩽3%), only allowing for reliable DVRCSO calculations with 1TC.
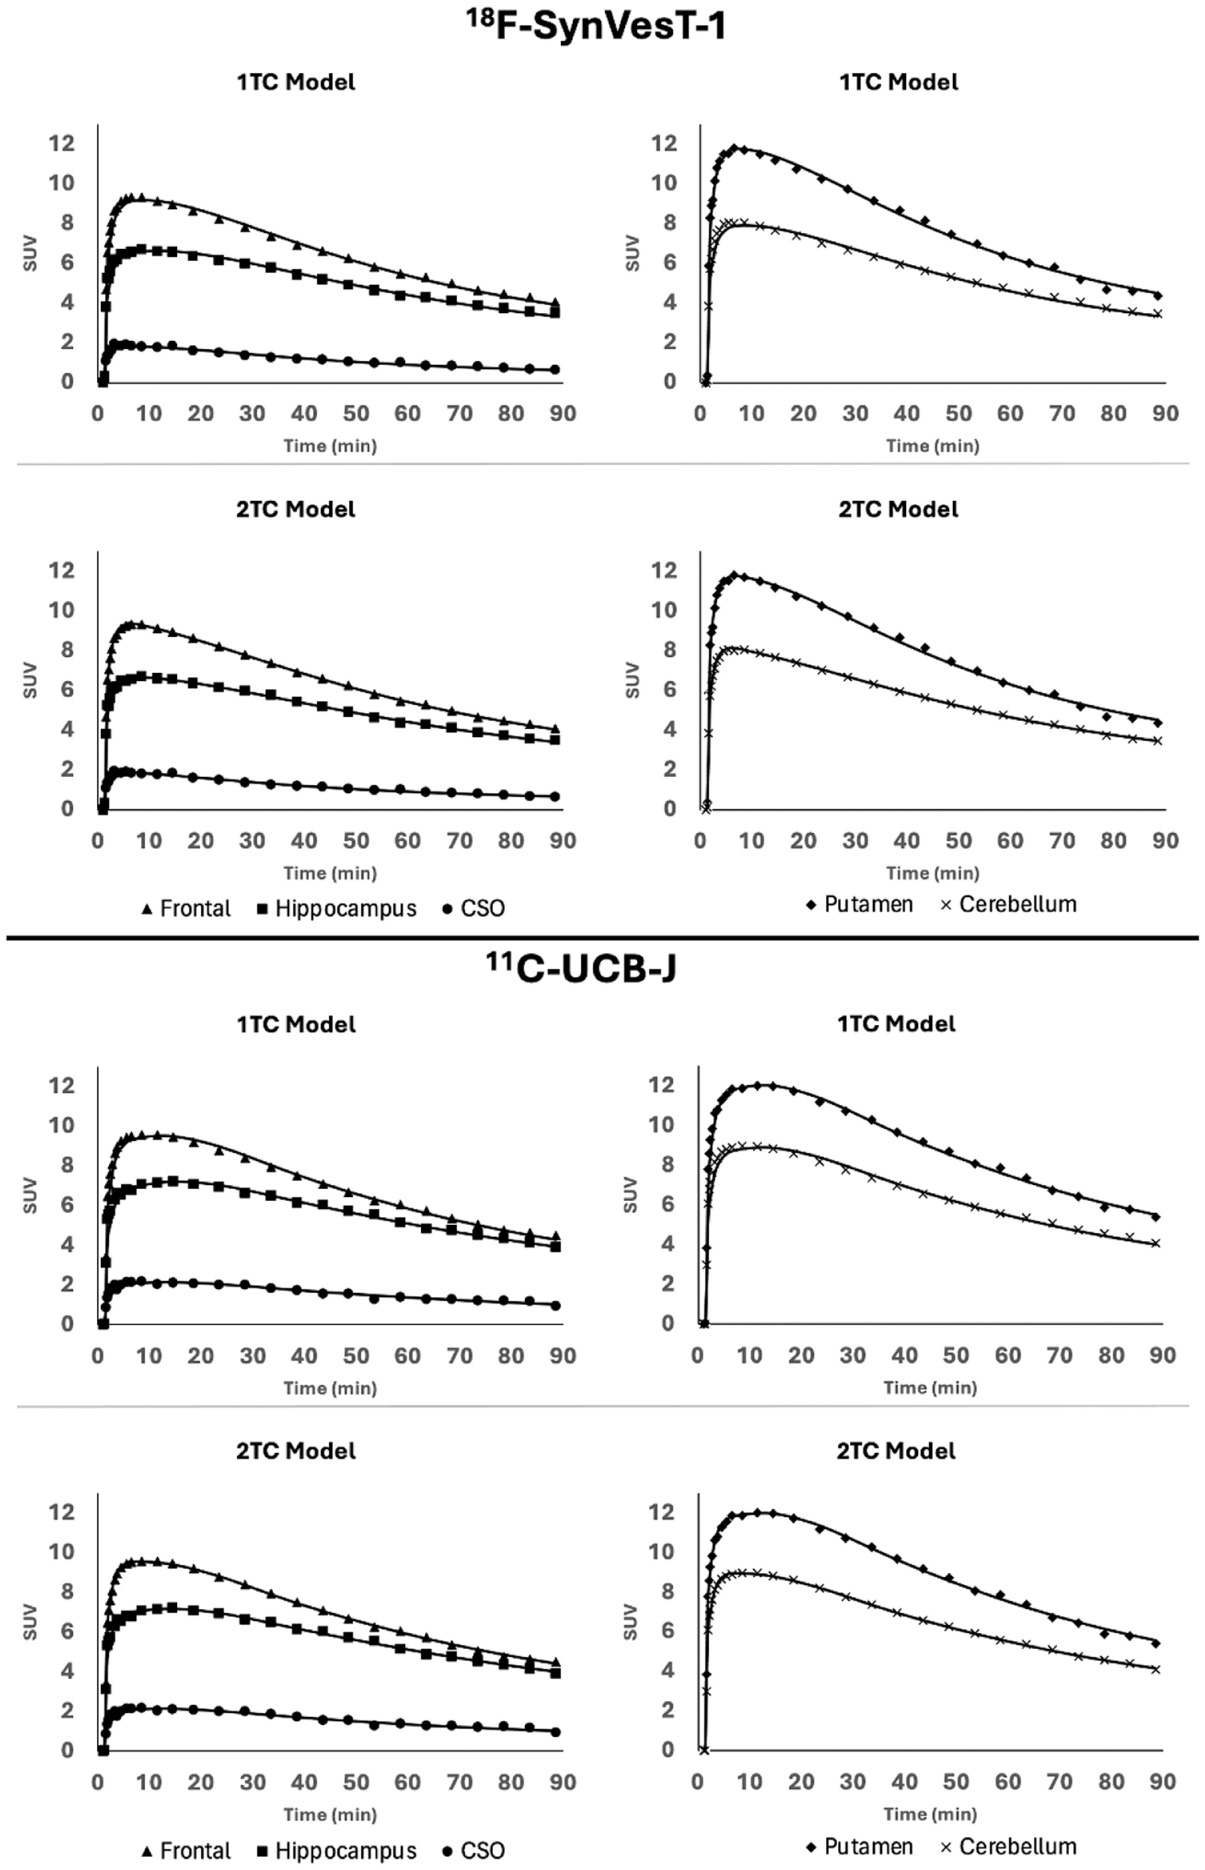
Fitted time activity curves with one- and two-tissue compartment model from one representative subject for 18F-SynVesT-1 and 11C-UCB-J.
VT,1TC was highly correlated to VT,2TC (slope 0.99, R2 = 0.97; outlier values (1.5% of fits) were excluded from this analysis; Supplementary Figure 1(A)). The 1TC model showed a modest underestimation of K1 compared to the 2TC model (slope 1.09, R2 = 0.91; no excluded outliers; Supplementary Figure 1(B)). Mean 18F-SynVesT-1 values of VT,1TC, DVRCSO,1TC, K1,1TC and k2,1TC for each VOI for the 40 HV can be found in Supplementary Table 1.
VT,LGA values were overall slightly higher compared to VT,1TC (median percent increase ranging from 0.1% (putamen) to 4% (cerebellar cortex), p < 0.004 in 10 out of 12 VOIs), and showed comparable %SE in most regions. Regression analysis confirmed that VT,LGA could reliably estimate VT,1TC values (slope 0.99, R2 = 0.99). Also, VT,2TC correlated very well with VT,LGA (slope 0.99, R2 = 0.98; after excluding seven outlier values; Supplementary Figure 2). Because of its robustness, the LGA method was used to calculate parametric images for VT,LGA and DVRCSO,LGA. Given the strong agreement with VT,2TC and the more robust estimation of microparameters obtained via the 1TC, we opted to use 1TC and LGA for subsequent analyses.
Time stability of 18F-SynVesT-1 SUVR
We compared SUVRCSO at different time windows (15- and 30-min intervals) with DVRCSO. A voxelwise linear regression within a whole brain grey matter mask was performed for each of these time windows. Parametric images of the regression residuals were computed to investigate the spatial distribution of the variance and to identify potential regional kinetic differences.
The SUVRCSO time window with the least bias based on slope was around 50–65 min (slope = 0.99). Earlier SUVRCSO time windows had slopes above 1 (underestimation of high-binding regions compared to DVRCSO) and later windows had slopes below 1 (overestimation of high-binding regions). The latest SUVRCSO time window of 60–90 min p.i., that was often used in previous studies,15,21,22 had the lowest variance with an R2 of 0.93 within the whole grey matter VOI (Supplementary Table 2).
Parametric residual images (Figure 2) showed that the medial frontal cortex, temporal cortex, anterior cingulate cortex, insula, precuneus and amygdala had relatively high positive residual scores, especially in the early time windows. Regions with negative residual scores included mainly the cerebellar cortex, the lateral frontal cortex and the caudate. Of note, the thalamus had relatively high residual scores, negative in the early time windows and positive in the later time windows. Especially around time window 50–80 min, there were different residuals within the thalamus (Figure 2). When residuals were calculated based on a perfect fit (y = x), it became apparent that DVRCSO in the anterolateral part of the thalamus was increasingly underestimated by SUVRCSO at later time windows (Supplementary Figure 3).
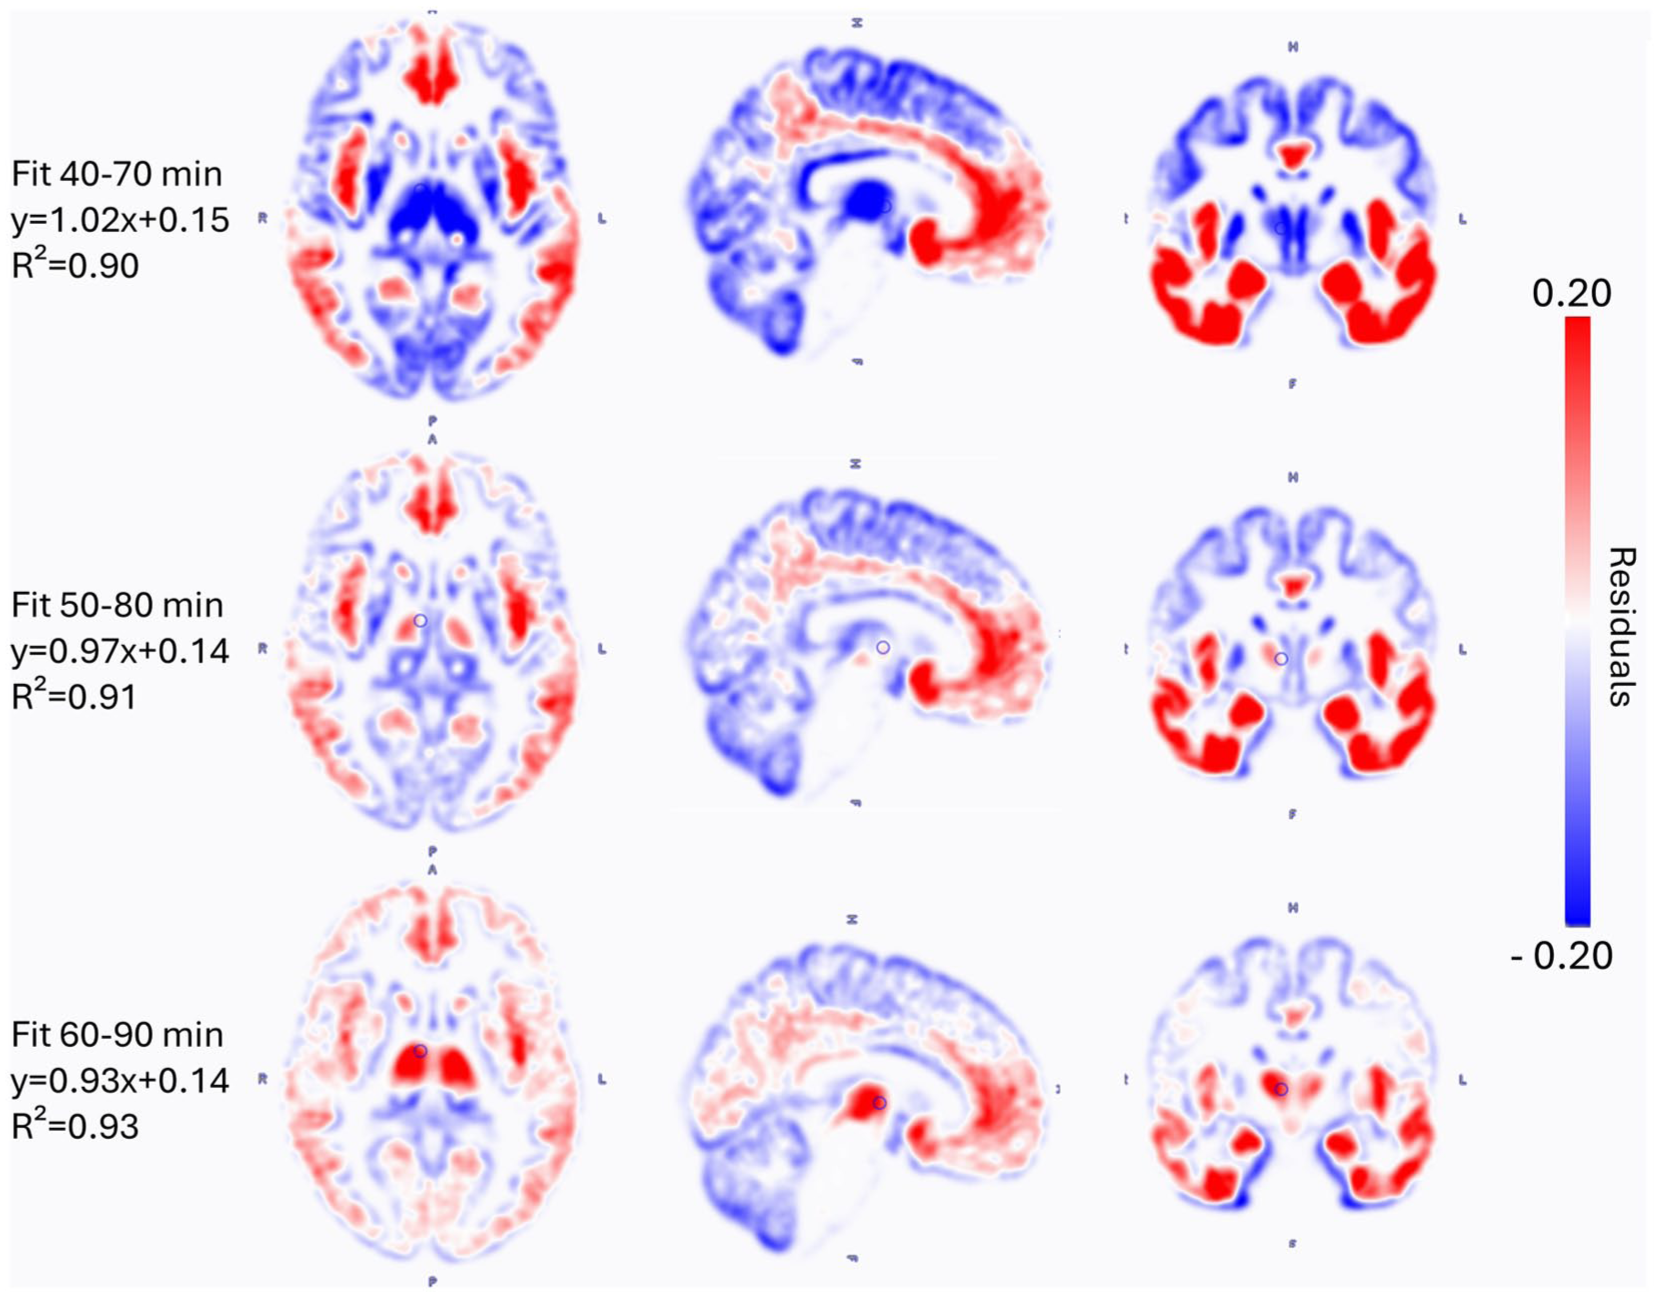
Parametric residual images comparing 18F-SynVesT-1 SUVRCSO (x) to DVRCSO (y) on a voxel-level at different timeframes post-injection. Blue regions represent negative residuals (overestimation of DVRCSO by SUVRCSO using the provided fit). A 3 mm gaussian smoothing was applied. Residuals were calculated within a grey matter mask.
Comparison of simplified SUVR measures using various reference regions
Since the CSO region is variable depending on WM and cortical anatomy and prone to noise effects, CoV for the DVR outcome variables for CBL and pons as (pseudo)reference region were also calculated. CoV were slightly higher for DVRCSO and DVRPNS compared to DVRCBL (Supplementary Table 3).
A comparison of SUVR with DVRLGA images for each reference region using a voxelwise linear regression within a whole grey matter mask was performed for each of the evaluated SUVR time windows (30-min intervals). Also here, the latest time windows always yielded the highest R2 (Supplementary Table 4). Using the 60–90 min time window, the whole CBL (slope 1.03, R2 = 0.98) and CBL cortex (slope 1.03, R2 = 0.98) yielded almost identical results. CBL white matter gave a slope of 0.97, R2 = 0.96. Using the pons as reference region resulted in a slope of 0.82, R2 = 0.92. Voxelwise parametric residual images had similar variance patterns as for DVRCSO.
18F-SynVesT-1 binding in relation to age and sex
Using parametric LGA images with PVC, linear regressions showed non-significant correlations of 18F-SynVesT-1 VT,LGA values with age in the cingulate cortex (slope −0.09; R2 = 0.14; p = 0.016) and thalamus (slope −0.06; R2 = 0.14, p = 0.017), corresponding to a reduction per decade (RPD) of 2.5% (mean VT = 30.5) and 2.7% (mean VT = 17.6), respectively. Correlation plots are shown in Supplementary Figure 4. Significant correlations were found between age and DVRCSO in the cingulate cortex (RPD of 2.0%; p = 0.004) and thalamus (2.2%; p = 0.0002).
No sex differences were found for VT,1TC or DVRCSO with or without PVC. Unpaired t-tests showed systematically higher K1,1TC (±10%; p = 0.01–0.16, depending on the region) and k2,1TC (±12%; p ⩽ 0.03) values in grey matter regions in females compared to males. This was not the case for microparameters in white matter regions. More detailed results on 18F-SynVesT-1 binding in relation to age and sex are shown in Supplementary Tables 5 to 7.
18F-SynVesT-1 head-to-head comparison to 11C-UCB-J
Using a 1TC model, reliable estimates of VT,1TC, K1,1TC and k2,1TC were obtained for both 18F-SynVesT-1 and 11C-UCB-J. VT,1TC values in a composite cortical VOI for 18F-SynVesT-1 were 7% ± 9% lower than those for 11C-UCB-J (p = 0.02), while VT,1TC in CSO was 32% ± 6% lower (p < 0.001). Although K1,1TC did not differ significantly between the tracers, 18F-SynVesT-1 showed higher k2,1TC values in the cerebral cortex (13% ± 16%; p = 0.03) and in the CSO (57% ± 22%; p < 0.001). A detailed summary of regional results is provided in Table 1.
Head-to-head comparison of SYNV1 and UCB-J kinetic parameters using a 1TC model (mean ± SD, n = 10). No partial volume correction was performed.
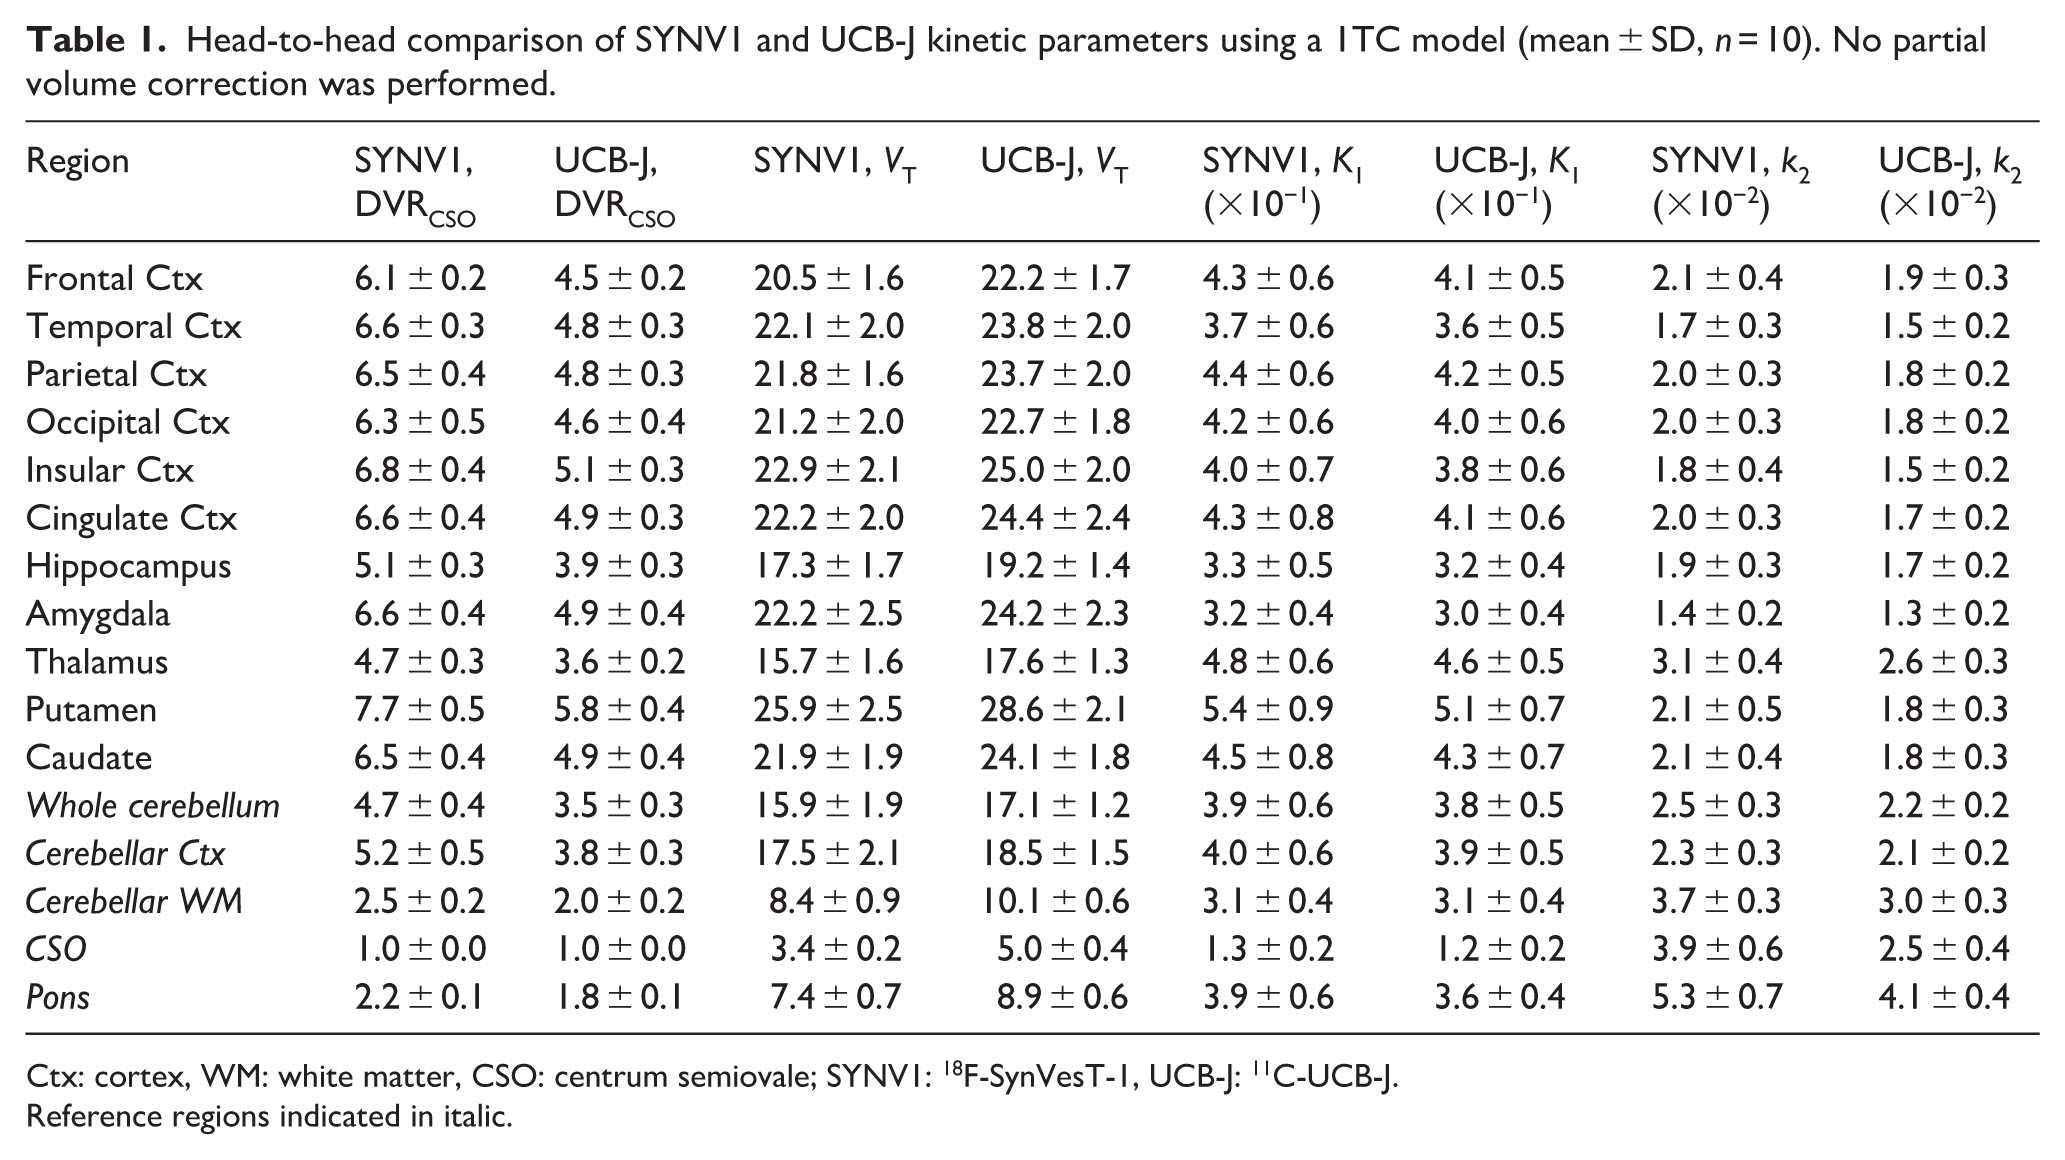
Ctx: cortex, WM: white matter, CSO: centrum semiovale; SYNV1: 18F-SynVesT-1, UCB-J: 11C-UCB-J.
Reference regions indicated in italic.
Consequently, cortical DVRCSO values derived from the 1TC model were on average 37% ± 4% higher with 18F-SynVesT-1 compared to 11C-UCB-J (p < 0.001; Figure 3). Notably, the cortical CoV in DVRCSO was 7% lower for 18F-SynVesT-1 compared to 11C-UCB-J in this paired cohort, mainly determined by the frontal cortex (−19%), hippocampus (−22%), caudate (−19%) and amygdala (−14%). However, for other regions, 18F-SynVesT-1 had a higher CoV (e.g. thalamus (+10%), putamen (+6%), parietal cortex (+6%) and cerebellar cortex (+5%)).
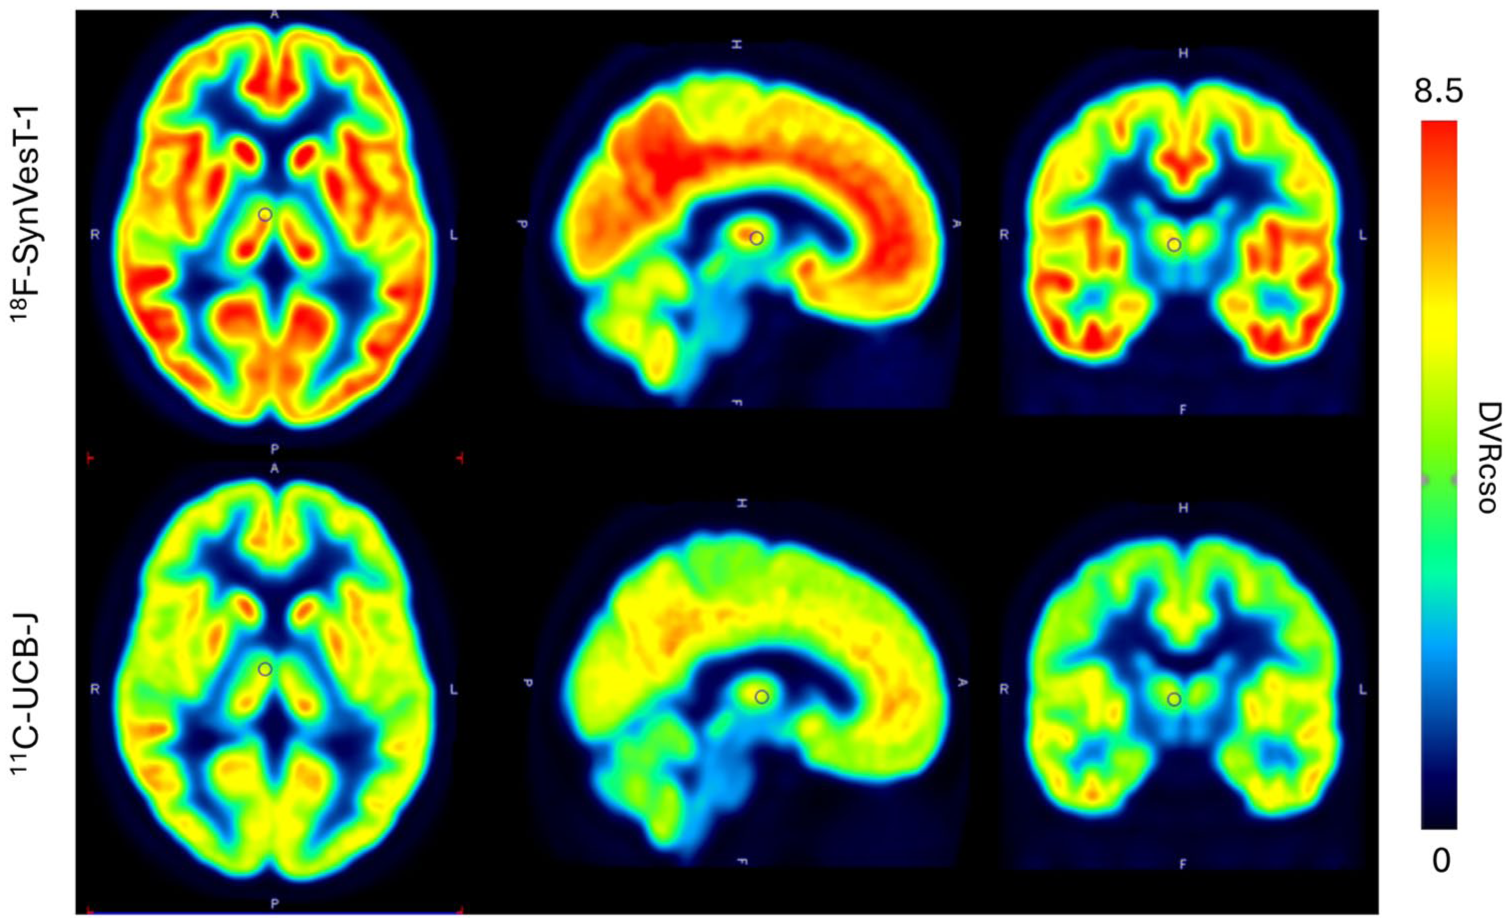
Mean DVRCSO parametric image of 10 healthy subjects that underwent both 18F-SynVesT-1 and 11C-UCB-J PET.
Regression analysis showed that VT,1TC and DVRCSO of 18F-SynVesT-1 were strongly correlated with these respective parameters for 11C-UCB-J, with a slope of 0.88 (R2 = 0.71) for VT,1TC and a slope of 0.72 (R2 = 0.93) for DVRCSO (Figure 4). Regression analyses for DVRCSO for each individual VOI showed consistent findings (Supplementary Table 8 and Supplementary Figure 5).
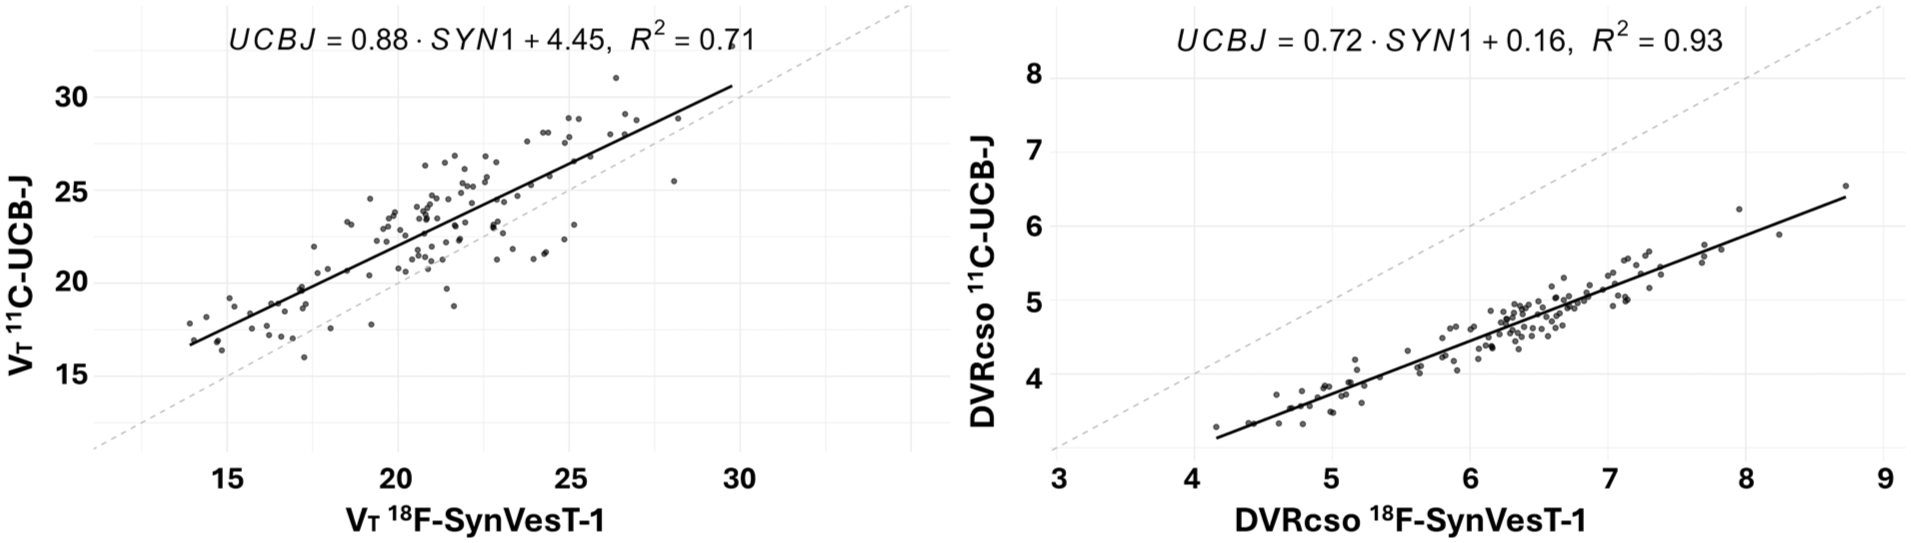
Linear regression for 1TC VT and DVRCSO values between 18F-SynVesT-1 and 11C-UCB-J. Each data point represents one region of one subject.
Discussion
We evaluated the kinetic properties of 18F-SynVesT-1 binding and simplified quantification measures in a cohort of 40 HVs and compared kinetic and binding parameters to ¹¹C-UCB-J in a subcohort of 10 HVs. Consistent with prior studies, the 2TC model emerged as the preferred approach for 18F-SynVesT-1 when only taking AIC and F-tests into account. However, 2TC only estimated the VT and K1 parameters reliably with occasional outliers in 3%–4% of fits and could not reliably estimate k2, k3 and k4. In line with Naganawa et al., we conclude that the 1TC model is the most useful model for quantification of 18F-SynVesT-1 data. 15 K1,1TC estimates were slightly lower than K1,2TC which may represent a slight underestimation of K1 by the 1TC model due to a lower fit accuracy in the presence of two kinetically distinct tissue compartments (fast exchange and slower binding). This can also be seen from model fits (Figure 1), where the 1TC model systematically slightly underfits the early upward slope of the tissue time–activity curves.
As for simplified quantification of 18F-SynVesT-1, DVRCSO could be reliably approached by SUVRCSO at later time windows from 55 min p.i. onwards. The early time windows tended to underestimate DVRCSO, whereas later time windows accounted for the variance more effectively (R2 up to 0.93) but generally overestimated the binding, especially in high-binding regions. This is consistent with a WM reference region with relatively fast kinetic properties compared to cortical GM.
Interestingly, parametric maps indicated that the anterolateral thalamus region showed increasing underestimation of DVRCSO by SUVRCSO at later time windows (Supplementary Figure 3). This pattern suggests that this particular thalamic subdivision may exhibit faster kinetic properties compared to the WM CSO and that the CSO, even though mostly devoid of SV2A, 15 is not entirely representative of the non-specific binding throughout the entire brain. This was also reported for 11C-UCB-J by Rossano et al., 23 who calculated a parametric image of the non-displaceable uptake (VND) displaying substantial heterogeneity across the brain. They reported that CSO VT exceeded the VND in the grey matter but did not specify regional details on the thalamus or its subregions. Future 18F-SynVesT-1 blocking studies on high-resolution scanners will have to elucidate our finding.
The CSO was previously validated as the region with the least amount of specific binding and thus has been used as a reference region for SUVR calculation. However, it is a small region, sentitive to noise, partial volume effects, white matter hyperintensities and motion. Therefore, we explored SUVR simplification using four different pseudo-reference regions. The different cerebellar regions seem to provide very similar results, while the DVRpns could be estimated less adequately using SUVR. Furthermore, the results indicate that the intersubject variability is lower when using cerebellar pseudo-reference regions compared to pons and also compared to CSO. Cerebellar pseudo-reference regions may thus be used for calculation of SUVR with minimal bias compared to DVR 24 in HV but might not be a suitable pseudo-reference region in all patient populations.
After PVC, age correlations with DVRCSO in the thalamus and cingulate cortex, corresponding to a RPD of around 2% remained significant after correction for multiple comparisons. This is in contrast with previous studies investigating the age-dependency of 11C-UCB-J, where the caudate nucleus showed a significant decrease in synaptic density with increasing age.4 –6 To the best of our knowledge, the correlation of 18F-SynVesT-1 binding with age has not been studied previously. Long-term follow-up in an independent cohort will be needed to corroborate this finding.
We found no sex difference in VT or DVR, although females had faster kinetics than males in grey matter regions. This could be consistent with a higher cerebral blood flow in females as reported previously. 25 Of note, the previous studies investigating microparameters for 18F-SynVesT-1 were performed in male-dominated cohorts.15,16
In contrast to the findings of Naganawa et al., 16 our k2 value in the CSO was relatively high for 18F-SynVesT-1 compared to the other regions of interest. This could be due to differences in the definition of the CSO. For example, the volume of our CSO template is 2.9 mL which resulted in this group into a minimal volume of 1.5 mL in patient space. The CSO template used by Naganawa et al. 16 was reported to have an initial volume of 2 mL, leading to even smaller volumes in patient space and thereby potentially increasing the sensitivity to noise. Moreover, this could potentially also be due to differences in attenuation and scatter correction between the different scanners. Taken together, our results support the use of the CSO as a reference region with faster washout kinetics.
Lastly, this study also confirmed that VT values for 18F-SynVesT-1 were slightly lower than those observed for ¹¹C-UCB-J, which is mainly due to a higher k2 value for 18F-SynVesT-1. Because of lower VT,CSO for 18F-SynVesT-1, DVRCSO were 34%–42% higher for 18F-SynVesT-1 compared to 11C-UCB-J. Naganawa et al. also showed that 18F-SynVesT-1 VT values were lower than those for ¹¹C-UCB-J while 18F-SynVesT-1 showed higher BPND. 15 The differences across the mean BPND values for all assessed VOIs as reported by Naganawa et al. are ranging from 14% to 24% which is slightly lower than the difference in DVRCSO we report here. Differences in reference regions and scanners could potentially explain this discrepancy. Nonetheless, 18F-SynVesT-1 DVRCSO values were well correlated to ¹¹C-UCB-J DVRCSO (slope 0.72, R2 = 0.93). These findings suggest that both tracers bind specifically to the same target, with 18F-SynVesT-1 exhibiting higher affinity. 15 The k2 value in CSO was also notably higher for 18F-SynVesT-1 than for 11C-UCB-J. This can be explained by the slightly lower lipophilicity of 18F-SynVesT-1 and a suggested lower affinity to the non-displaceable component. 26 The spatial patterns of residual differences between SUVRCSO and DVRCSO were similar between 18F-SynVesT-1 and 11C-UCB-J (Supplementary Figure 6). The CoV of DVRCSO in a composite cortical VOI was 7% lower for 18F-SynVesT-1 compared to 11C-UCB-J. This might indicate that 18F-SynVesT-1 can show higher sensitivity to detect SV2A changes compared to 11C-UCB-J.
Limitations of our study include the absence of patient data, which restricts these findings to HV. Moreover, our analyses did not account for plasma protein binding, which was shown to increase with age and to influence 11C-UCB-J VT values. 6 The resolution of the PET system that was used in this study is lower than that of the High Resolution Research Tomograph which was used in the previous study. 15 This lower resolution may introduce more partial volume effect that could influence the quantification especially in the CSO. To further investigate this as well as to assess the distinct kinetic properties and age-related changes within the thalamus, high-resolution PET systems27,28 should be considered.
To conclude, 18F-SynVesT-1 PET allows reliable quantification of SV2A binding as proxy for synaptic density in healthy individuals. Simplified quantification using SUVR methods is most robust using later timeframes such as 60–90 min post injection. The kinetic profile and binding parameters of 18F-SynVesT-1 show strong correlation with 11C-UCB-J. This study demonstrates that 18F-SynVesT-1 is a clinically useful alternative for SV2A imaging with excellent kinetic properties.
Supplemental Material
sj-docx-1-jcb-10.1177_0271678X261454164 – Supplemental material for Quantification of 18F-SynVesT-1 binding in healthy ageing and head-to-head comparison with 11C-UCB-J
Supplemental material, sj-docx-1-jcb-10.1177_0271678X261454164 for Quantification of 18F-SynVesT-1 binding in healthy ageing and head-to-head comparison with 11C-UCB-J by Greet Vanderlinden, Charles Carron, Jolien Van Opstal, Marie Cohilis, Wim Vandenberghe, Michel Koole and Koen Van Laere in Journal of Cerebral Blood Flow & Metabolism
Footnotes
Acknowledgements
We thank the research technologists Kwinten Porters, Jef Van Loock and Nele Eecloo for data acquisition, the PET radiopharmacy team of UZ Leuven for their skilled contributions and all volunteers for their participation in this study.
Author contributions
KVL and GV contributed to study design. KVL supervised study progression and obtained funding. GV performed data acquisition. GV, CC, JVO and MC performed data processing. MK, KVL, GV, CC and JVO contributed to interpretation of the results. GV, CC and JVO drafted the manuscript. MK, KVL, MC and WV critically reviewed the manuscript.
Funding
The authors disclosed receipt of the following financial support for the research, authorship and/or publication of this article: This study was supported by a grant from the Belgian Alzheimer Research foundation (SAO-FRA 2021/0004). GV and JVO are supported by a Research Foundation Flanders (FWO) grant (1292326N and 1S06625N, respectively).
Declaration of conflicting interests
The authors declared the following potential conflicts of interest with respect to the research, authorship and/or publication of this article: MK and KVL have performed contract research through KU Leuven for Merck, Johnson & Johnson, UCB, Syndesi, Eikonizo, GE Healthcare, Cerevel, BMS and Curasen. KVL is an advisory board member of Enigma.
Ethical considerations
The study was approved by the ethics committee UZ/KU Leuven (S66111) and was conducted according to the latest version of the Declaration of Helsinki.
Consent to participate
All participants gave written informed consent prior to study enrolment.
Data availability statement
Anonymised data will be deposited in an access-controlled file server used by the academic research PET imaging group, which will be shared on reasonable request from any qualified investigator on approval by the Ethics Committee of the local university hospital.
Supplemental material
Supplemental material for this article is available online.
References
Supplementary Material
Please find the following supplemental material available below.
For Open Access articles published under a Creative Commons License, all supplemental material carries the same license as the article it is associated with.
For non-Open Access articles published, all supplemental material carries a non-exclusive license, and permission requests for re-use of supplemental material or any part of supplemental material shall be sent directly to the copyright owner as specified in the copyright notice associated with the article.