
Abstract
[18F]FDG functional PET (fPET) enables investigation of dynamics in glucose metabolism occurring within seconds. However, the physiological mechanisms supporting rapid metabolic changes necessitate further attention to allow accurate interpretation. This work highlights candidate mechanisms driving [18F]FDG signal changes at high temporal resolution, offering complementary insights to existing interpretations. At rest, metabolic demands are closely matched by glucose supply across the blood-brain barrier (BBB), regulated by glucose transporter 1 (GLUT1). During neuronal activation, glucose transport and phosphorylation by hexokinase are elevated to meet increased energy requirements. Simulations indicate that rapid [18F]FDG signal increases are primarily driven by BBB transport, with subsequent increases in hexokinase activity. Mechanisms supporting increased BBB transport include elevated glucose concentration gradient towards the brain and changes in GLUT1 intrinsic properties, but only minor effects of blood flow. Conversely, moment-to-moment fluctuations in [18F]FDG used for metabolic connectivity, reflect temporally synchronized supply, mediated jointly by blood flow and BBB transport. We emphasize that the coupling between BBB transport and metabolism underpin the [18F]FDG fPET signal. Considering alterations of GLUT1 and subsequent metabolism in numerous brain disorders, stimulation-induced energy demands and metabolic connectivity represent a promising opportunity to investigate the underlying pathophysiological processes.
Introduction
[18F]FDG is the most commonly used radiotracer world-wide for positron emission tomography (PET). 1 This is due to its high clinical relevance in numerous medical fields 2 and the widespread availability given by the simple synthesis with an isotope half-life that allows transportation and commercial production.
Routine clinical use in brain imaging employs a bolus application, followed by a resting period of about 30–60 min and subsequent scanning for 10–15 min. 3 Although this yields a static image, it is widely used as a surrogate for overall brain glucose metabolism, typically reported as the standard uptake value (SUV) or SUV ratio (SUVR). This interpretation is based on phosphorylation of the radiotracer and subsequent irreversible trapping in the cell (i.e., k4 = 0 in a 2-tissue compartment model (2TCM), Figure 1). We acknowledge however that this assumption may not hold entirely for certain applications such as long scan times.
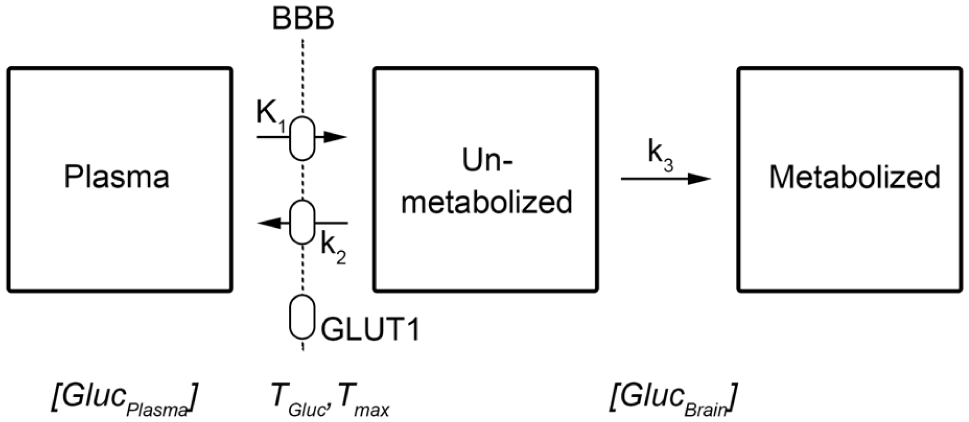
Schematic description of the irreversible two-tissue compartment model, that is, k4 = 0. Similar to glucose, the radiotracer [18F]FDG crosses the blood-brain barrier (BBB) via facilitated transport by the glucose transporter 1 (GLUT1, 55 kDa), described by rate constants k1 and k2. The uptake mechanism is in contrast to most other radiotracers, which cross the BBB via passive diffusion. Within the brain interstitium (unmetabolized compartment), glucose and [18F]FDG are taken up by neurons (GLUT3) and astrocytes (GLUT1, 45 kDA). Within the cells they are subsequently metabolized by hexokinase (k3). The italic variables at the bottom refer to those of equation (3), being the concentration of glucose in plasma ([GlucPlasma]) and brain ([GlucBrain]), as well as the maximum (Tmax) and actual transport rate of glucose (TGluc) across the BBB.
While a dynamic PET scan with a bolus application allows for identification of individual rate constants through compartment modeling of the radiotracer kinetics, it will in most cases still yield a static outcome image of the cerebral metabolic rate of glucose (CMRGlu). This can be derived from the influx constant Ki, which in turn is a macroparameter obtained from the individual rate constants:

These rate constants describe the transport across the blood-brain barrier (BBB, K1 and k2), and the phosphorylation in the cell through the conversion of [18F]FDG to [18F]FDG-6-phosphate by the enzyme hexokinase (k3), that is, the first step of glucose metabolism 1 (Figure 1). In most practical applications, SUV, SUVR, and CMRGlu images reflect brain metabolism at resting state, with k3 showing the strongest correlation with these metrics at the above mentioned time scale. 4 This offers the possibility to identify (non-acute) pathological alterations for example, caused by epilepsy, tumors, injuries as well as neurodegenerative and psychiatric disorders.
Further advancement of dynamic PET enables the quantification of different cognitive or emotional states within a single PET scan.5 –7 Similar to functional magnetic resonance imaging (fMRI) this is achieved through presentation of for example, visual paradigms in a block design, thus yielding the term functional PET (fPET). The approach requires administration of radiotracers like [18F]FDG as a (bolus +) constant infusion to provide free radiotracer throughout the experiment, which is then able to be metabolized according to the current metabolic demands.6,8 Task-related metabolism is commonly approximated by a ramp function,6,7 implying a steady-state during the stimulation period. While this assumption is not strictly met, it provides a practical approximation5,6 that has been shown to yield robust estimates when radiotracer uptake has stabilized. 9 Another assumption of the approach is that the neuronal response and glucose metabolism are related in a linear and time-invariant manner, as in fMRI. 10 This posits that changes in the neuronal response also translate to changes in metabolism with respect to amplitude and temporal coupling.11,12
As the temporal resolution for this approach has substantially improved from PET image frames of 1 min5,6 down to 3 s, 13 acute adaptations in glucose metabolism become increasingly relevant. It is therefore essential to determine the assumptions and interpretations that apply to [18F]FDG fPET imaging at such a short time scale and to identify the possible neurophysiological mechanisms that underpin rapid changes in metabolic demands. This work aims to highlight major driving factors responsible for fast-acting changes in glucose metabolism and their links to the corresponding [18F]FDG signals measured with fPET in vivo. Although conceptual parallels are drawn to rate constants of the 2TCM, fPET is not assumed to unambiguously resolve their individual contribution to such rapid effects. Instead, this work uses simulations to explore plausible scenarios linking neurophysiological processes to observed signal dynamics, without implying uniqueness of the underlying parameter combinations. We will specifically focus on aspects applicable to short-term changes, which should be seen in addition to (not instead of) previous knowledge that explained glucose metabolism derived from steady-state kinetics obtained with conventional PET imaging. As such, the proposed concepts may in practice mostly apply to fPET imaging. This work follows a targeted approach in which key physiological mechanisms are synthesized from the literature and subsequently examined using analytical simulations of the irreversible 2TCM. The simulations are not intended as an independent methodological contribution, but rather serve to illustrate how different combinations of rate constants can reproduce experimentally observed [18F]FDG signal dynamics under physiologically plausible assumptions. Rather than providing a systematic review, we focus on mechanisms that are directly relevant to short-term changes in glucose metabolism at the temporal resolution of fPET. This knowledge will then be transferred to scenarios of acute stimulation-induced changes in [18F]FDG glucose metabolism. Finally, we propose that also moment-to-moment fluctuations in the fPET signal at resting state represent meaningful information. These enable computation of molecular connectivity, or more specifically metabolic connectivity when using [18F]FDG,14 –16 but are subject to an even more refined interpretation. In sum, this work provides a neurophysiological account of the rapid dynamics in glucose metabolism elicited through cognitive or emotional processing as well as metabolic connectivity at resting-state, which can be imaged with [18F]FDG fPET.
Simulations
To characterize [18F]FDG uptake and metabolism induced by stimulation and moment-to-moment fluctuations, simulations were carried out using the irreversible 2TCM. The arterial input function and rate constants at resting-state were adopted from our previous work, using a typical bolus + infusion radiotracer administration protocol at a ratio of 20:80%, 13 with K1 = 0.11 ml/cm3/min, k2 = 0.167 min−1, k3 = 0.074 min−1, k4 = 0 min−1. These values are also in close agreement with previously published data. 17 As outlined above, further key modeling assumptions include approximation of steady-state during task periods, linear and time-invariant coupling between neuronal activity and glucose metabolism as well as simplified representation of stimulation effects using ramp functions. The aim of the simulations is to explore which combinations of changes in rate constant can reproduce experimentally observed fPET signal characteristics, particularly the ramp-like response during stimulation and oscillatory fluctuations at rest. Given that true physiological changes in rate constants are not directly observable, the simulations are designed to identify plausible mechanistic scenarios rather than to estimate unique parameter sets. Accordingly, the simulations should be interpreted as illustrative and hypothesis-generating, rather than predictive or quantitatively validated.
Stimulation-specific changes in rate constants were introduced after 8 min to allow equilibration and lasted 36 s. Proceeding from our previous simplified simulation where changes in rate constants were stationary, 13 the changes here were modeled as time-dependent variables. The model was implemented analytically in Matlab by solving the corresponding differential equations, while also considering the rate constants’ newly introduced time variance. Since the true changes in rate constants during neuronal activation are unknown, we explored which different sets of rate constants are able to characterize a ramp function during activation, similar to the one commonly used in fPET general linear model analyses.6,8 For combined changes of rate constants (case 5 and 6 below) a minimization procedure was employed. The simulations were constrained to (i) reproduce experimentally observed increases in Ki ~27% 13 (see below), and (ii) approximate the temporal profile of a ramp-like stimulation response. We would like to emphasize, that the presented parameter combinations are not unique. Multiple, potentially distinct, configurations of rate constant changes may produce similar [18F]FDG signal dynamics, limiting the ability to infer specific physiological mechanisms from the simulations alone. If possible, we assumed an increase in the individual constants’ values as this was deemed most likely from a physiological point of view. The following cases were explored:
∆K1 = 5%
∆k2 = 5%
∆k3 = 5%
∆K1: ∆k2: ∆k3 = x: −5x: 0, with x = 5%
∆K1: ∆k2: ∆k3 = x: 0: 4.38x, with x = 6.81%
∆K1: ∆k2: ∆k3 = x: 1.18x: 1.72x, with x = 19.89%
Cases 1–3 characterize changes in the [18F]FDG signal due to variation of individual rate constants alone. In case 4 only BBB-related transport rates are increased (i.e., ∆k3 = 0). Note that from a mathematical view (but not an experimental one, see below), an increase in K1 alone without changes in k3 would be sufficient to cause an increase in overall metabolism Ki (see equation (1)). Case 5 assumes that neuronal activation leads only to increases in supply and metabolism of glucose and [18F]FDG with a constant reverse transport (i.e., ∆k2 = 0). The rationale of case 6 is that BBB transport is generally increased maintaining a constant ratio between K1 and k2 (i.e., ∆K1 = ∆k2). To provide a more comprehensive picture of the effects of changes in rate constants, we also explored various other combinations (Supplemental Figure S1).
For metabolic connectivity, oscillating moment-to-moment fluctuations were simulated on top of basis radiotracer uptake (i.e., with K1 = 0.11 ml/cm3/min, k2 = 0.167 min−1, k3 = 0.074 min−1, k4 = 0 min−1). That is, changes in rate constants as in case 6 above (i.e., with ∆K1: ∆k2: ∆k3 = x: 1.18x: 1.72x) were repeatedly introduced for 30 s periods as observed in previous work, 18 with the respective variations alternating between positive and negative algebraic signs. Furthermore, the contribution of k3 was investigated by varying K1 and k2 only, with ∆k3 = 0.
Finally, we indirectly assess the influence of blood flow, assuming that changes in CBF would lead to changes in the fractional volume of blood vB in the common operational equation used in PET imaging:

with CPET, CT, and CWB representing the radiotracer concentration in the PET image, tissue and whole-blood, respectively. vB was changed according to the relationship established by Grubb et al., 19 yielding 8.85% change in CBV following increases in CBF by 25%.11,20 –22 This was implemented for both, stimulation-induced changes (single stimulation block of 36 s) as well as resting-state fluctuations (repeatedly alternating changes of 30 s). These changes were modeled in analogy to BOLD signal changes, with a boxcar function for stimulation-induced changes and a sine-like change for resting-state fluctuations, respectively. In the simulations, only the vB part scaling CWB was changed, as we assume that rapid CBF changes do not translate into corresponding changes in CT on such a short time scale.
Basal glucose metabolism in the human brain
The human brain accounts for about 20% of the body’s energy demands under resting conditions, with glucose being the primary fuel. Since glucose is only scarcely stored in the brain (except for e.g., glycogen storage in astrocytes, see below), a constant supply from blood is mandatory to maintain brain function.12,23 Glucose as well as [18F]FDG pass the BBB through facilitated transport via the glucose transporter 1 (GLUT1) carrier protein (although at different Michaelis–Menten constants KM).24 –26 The transport mechanism is required because of the hydrophilic nature of both compounds, which makes [18F]FDG different to most other radiotracers which cross the BBB via passive diffusion. Throughout the manuscript, GLUT1 refers to the form with a molecular mass of 55 kDa with highest expression at the BBB (Figure 1), while the 45 kDa form is expressed at astrocytes.24,26
Glucose transport rate or velocity across the BBB (TGluc) can be described with the Michaelis–Menten equation, taking into account the difference in glucose concentration between blood plasma ([GlucPlasma]) and brain ([GlucBrain], equation (3)). 27 At rest, TGluc has been estimated to be about 37 µmol/100 g/min (i.e., 37% of its maximum value Tmax = 1 µmol/g/min, see Dienel12,27 –30 for assumptions).
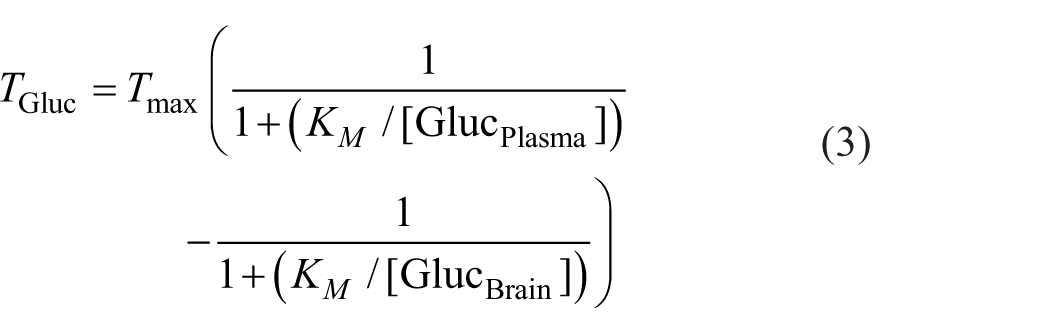
with Tmax being the maximal glucose transport rate across the BBB and KM the Michaelis–Menten constant. This confirms the well-known fact that under normal resting conditions TGluc is not the limiting factor (rather, conversion by hexokinase is Furler et al., 31 Robinson and Rapoport 32 ), but it can become so during stimulation (see Leybaert, 27 Barros et al., 29 Rothman et al. 33 and below).
As highlighted previously, 27 the interesting point is that the transport velocity of glucose across the BBB TGluc closely matches its metabolic rate CMRGlu at about 30 µmol/100 g/min.6,12,27,34 In other words, at resting-state the delivery of glucose just satisfies the actual demands,12,27,29 which is plausible given the limited storage in the form of glycogen29,35 and the neurotoxicity of excessive glucose concentrations. 36 These facts in turn imply that acute increases in metabolic demands also require an increase in supply across the BBB as discussed in the next sections.
Stimulation-specific changes in [18F]FDG
We and others have repeatedly shown that stimulation-induced regional increases in CMRGlu as obtained with [18F]FDG in awake humans are stable at about 20%–25% from baseline metabolism across various experimental settings.6,27,33,37 –39 It is acknowledged that this is lower than the often referenced 50%, 40 but such a large change might be even beyond the maximum calculated transport rate of glucose. 33 Furthermore, recent work has reported increases in regional cerebral blood flow (CBF) of about 25%,11,20 –22 that is, a similar range as compared to CMRGlu. Thus, the initially described coupling mechanisms between CMRGlu and CBF 40 still apply.
Simulation results for task effects
In line with studies that used other techniques than PET imaging,38,41 –43 our recent work has demonstrated that such increases in [18F]FDG may occur almost instantly upon neuronal stimulation. 13 To assess the contribution of individual rate constants and CBF, we carried out simulations of the 2TCM (Figure 2). Simulated changes in vB as presumably induced by CBF yielded instant step-wise changes in the [18F]FDG signal upon start and end of the stimulation, which did not resemble experimentally observed effects (Supplemental Figure S2; Figure 2(c)). Rather, initial increases in the [18F]FDG signal required changes in K1 (and potentially k2), that is, parameters that characterize BBB transport (Figure 2(a)). Furthermore, in the simulation a combination of changes in rate constants that also included changes in k3 were required to match experimental data (Figure 2(b) and (c)). Thus, changes in k3 were necessary for the [18F]FDG signal to return to baseline metabolism after the stimulus has ceased (i.e., slope = 0 in the task-specific time activity curve (TAC), Figure 2(b)), indicating that [18F]FDG is truly phosphorylated by hexokinase after transport into the brain. In line, previous work has elegantly shown that only an increase in both glucose transport across the BBB and its phosphorylation by hexokinase yields an increase in overall energy increase.29,30
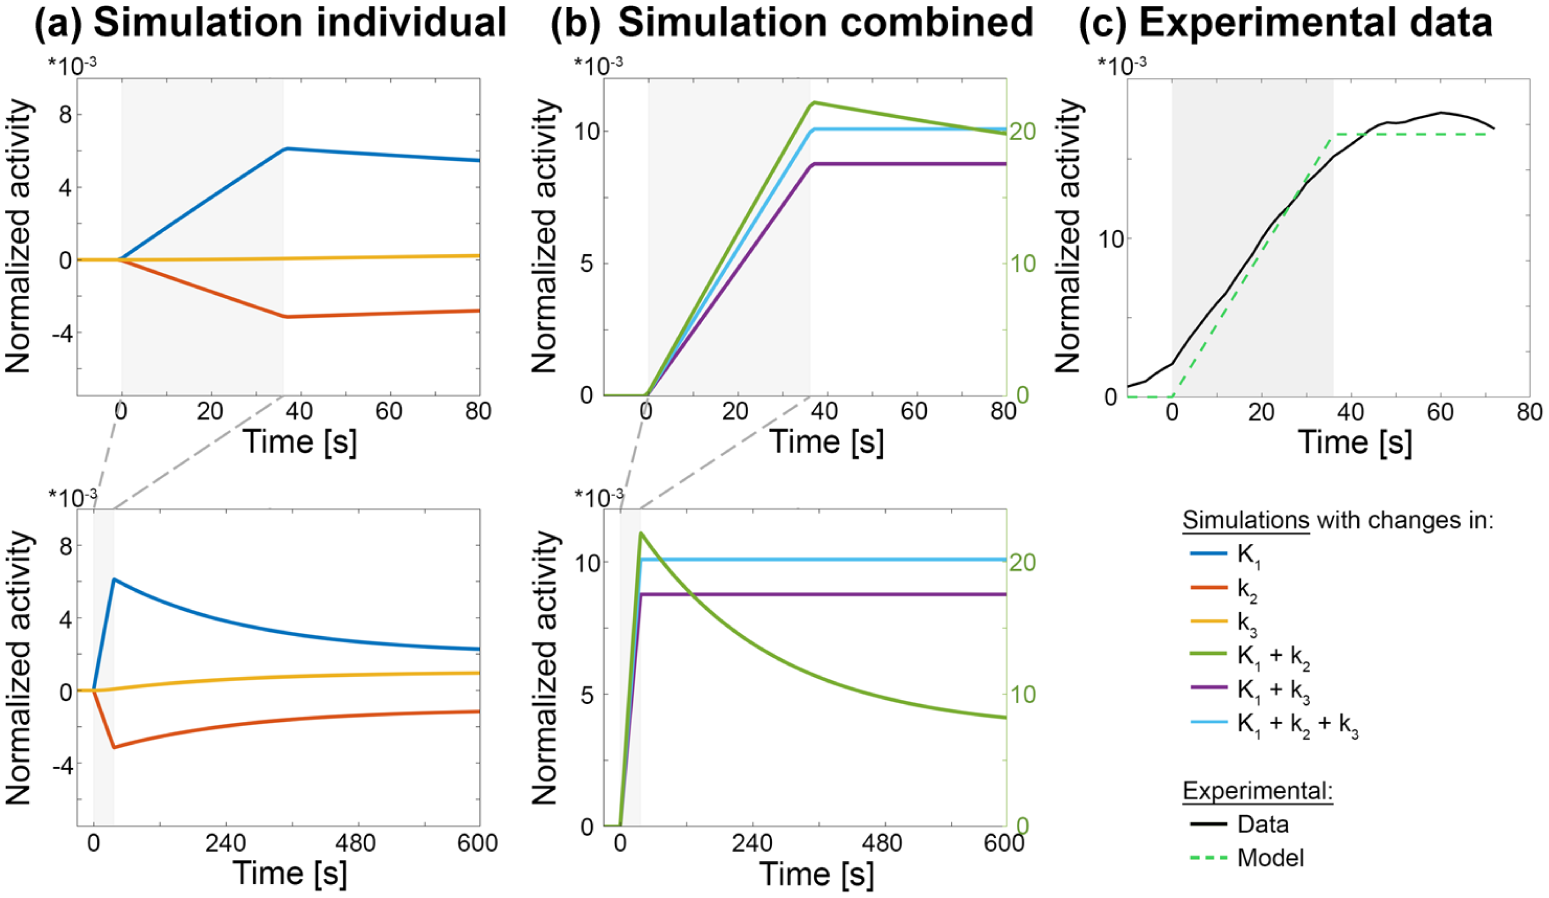
Simulated and experimentally observed changes in the [18F]FDG signal upon neuronal activation. Simulations comprised changes in individual rate constants alone (dark blue, red, orange) as well as combinations thereof (green, purple, light blue). All time courses represent stimulation-specific effects, that is, after removing baseline radiotracer uptake, and were normalized by baseline radiotracer uptake. (a) Simulated increases in individual rate constants indicate that changes in K1 (dark blue) and k2 (red) lead to instant, near-linear changes in the fPET signal with subsequent return to baseline, whereas changes elicited by k3 (orange) require more time to take effect. (b) Combinations of changes in K1 and k3 (purple) or K1, k2, and k3 (light blue) were simulated to obtain a ramp function, that is typically used to model task-specific changes in glucose metabolism (dashed green line in (c)). 6 Interestingly, changes in K1 and k2 alone (i.e., without changing k3, green) resulted in a considerably different shape which is not compatible with experimental data, although such changes would mathematically be sufficient to yield changes in overall Ki. (c) Experimentally observed changes in the [18F]FDG fPET signal (black) show a rapid increase during the task, which returned to baseline when stimulation ceases. 13 None of the individual rate constants (a) were able to explain the experimentally observed signal changes, but only their combination which included changes in k3 (b) yielded a comparable effect. Task duration for simulations and experimental data was from 0 to 36 s (grey box). See section simulation for corresponding parameter settings.
This coupling of events may seem trivial, but it is particularly relevant for interpreting the rapid changes observed with fPET. To summarize the essential aspects underpinning the tight coupling of BBB transport and hexokinase activity upon neuronal activation, (i) at rest glucose supply matches the actual demands (TGluc–CMRGlu), (ii) there is almost no storage capacity for glucose in the brain, and (iii) independent simulations have shown that increases in BBB transport and hexokinase activity are both required to increase the actual metabolism. Again, these results imply that an acute surge in metabolic demands during neuronal activation must consequently also be matched by an increased supply. Previous work has already emphasized that glucose transport across the BBB represents an essential factor at rest 44 and during stimulation.27,33,45 Of note, even earliest studies assessing task-specific glucose metabolism imaged BBB transport at least to some extent.46,47 That is, task performance was carried out during the bolus injection of [18F]FDG, with the initial part of the TAC being mainly determined by K1 and k2.
Candidate mechanisms for BBB transport
Although glucose metabolism itself has been studied extensively, the corresponding supply has received relatively little attention. There are several candidate mechanisms available that may (or may not) explain such an increase in supply. Importantly, with respect to the [18F]FDG signal, all of these mechanisms will to some extent affect its transport via the BBB (K1 and k2) and subsequently its metabolism by hexokinase (k3). These mechanisms likely occur in parallel, but it is currently not fully known, which of them is imperative and/or limiting.
Cerebral blood flow (CBF)
The increase in CBF upon neuronal activation is well established and represents the basis of blood-oxygen level dependent (BOLD) fMRI. Among others, 48 such changes occur at the level of the capillary bed by decreasing its resistance to and heterogeneity of flow, indicating a functional recruitment by increasing the fraction of high-flow capillaries.49 –52 For PET imaging, changes in blood flow are often associated with K1. This assumption is valid for radiotracers that cross the BBB via passive diffusion and have a high extraction fraction. However, as mentioned above glucose and [18F]FDG are subject to a facilitated transport mechanism via GLUT1. As such, glucose transport and metabolism are not particularly sensitive to variation in blood flow, 53 which is also reflected in the low permeability surface area product 54 and extraction fraction of about 10%12,27,30,55 –57 (Supplemental Figure S3). Experimental work using a hypercapnia challenge also showed that [18F]FDG uptake is not influenced by supraphysiological changes in CBF even if higher than 100%. 5 Furthermore, moderate transient changes in blood glucose concentrations did not affect blood flow responses to stimulation,58,59 indicating that CBF is not regulated in a metabolism-dependent feedback loop, but rather through neurotransmitter signaling.60,61 This does not invalidate previous observations showing associations between CBF and CMRGlu. Rather, it suggests that these may be correlated, but only due to their common causal dependency on neuronal activation. Altogether, this indicates that changes in CBF are an accompanying but not sufficient condition for increased CMRGlu, thereby representing a minor contribution to changes in the [18F]FDG signal.
Glucose concentration gradient
The BBB is not freely permeable for glucose, maintaining a concentration gradient of about [GlucPlasma] = 5 mmol/L in blood plasma versus [GlucBrain] = 1 mmol/L in brain extracellular space at rest.12,25,27 During neuronal activation, glucose phosphorylation is accelerated, 26 which decreases brain glucose concentration [GlucBrain] by about 20%.27,38,39,62,63 Leaving everything else constant in equation (3), such an increase in the concentration gradient between blood and brain alone would increase glucose transport across the BBB (TGluc) by 14%. 27 As noted previously, this effect derived from the law of mass action is still insufficient to explain CMRGlu changes in full. 28 Interestingly, the mentioned decrease in [GlucBrain] is very much within the range of regional changes observed with [18F]FDG fPET,6,33,37 thereby providing the possible interpretation of fPET signal changes representing just the amount of glucose that is needed to satisfy the increased demands.
Intrinsic properties of GLUT1
Another aspect to modify BBB transport of glucose is given by changes in its permeability, which has also been described as neurobarrier coupling. 27 This is realized by adaptations of the intrinsic properties of GLUT1 upon activation, resulting in an increased Tmax of equation (3).64,65 Although rather little is known about the exact changes, potential mechanisms may include conformational changes between occluded and open states66,67 as well as “unmasking” of already available binding sites.64,68,69 Interestingly, the increases in Tmax occurred without relevant changes in Km.64,70 Furthermore, GLUT1 appears in clusters, which are dissolved during activation resulting in increased glucose transport. 71 Regarding the temporal scale, one study reported rapid changes in GLUT1 Tmax within 10 s. 72 However, this concerned the astrocytic GLUT1 transporter (45 kDa), which differs from that of the BBB (55 kDa), so it remains to be investigated whether these effects translate to BBB transport. In any case, slightly delayed increase in the transport is also in line with the above mentioned decrease in brain glucose concentration. 38 Unfortunately, quantitative estimations at short time scales are hardly available so far. One study demonstrated an increase in Tmax by 30%–40%. However, this was obtained after the induction of seizures, 73 thus being a supraphysiological stimulus.
Number of GLUT1
Finally, a possibility to increase the transport rate of glucose is to increase the number of GLUT1 carrier proteins at the BBB surface. This likely occurs through redistribution of GLUT1 from the intracellular pool (which accounts for up to 40% of total GLUT1) to the membrane surface.24,27 However, the time-scale at which this occurs has been described to be mostly within the range of minutes to hours. 27 Thus, increased expression of GLUT1 at the BBB may be relevant for subsequent adaptations to sustained neuronal activation, but probably represents a minor factor in the adaptations to meet acute metabolic demands. Also, the above changes in Tmax may even occur without variations in the number of glucose transporters 64 and mRNA. 74
In sum, these findings suggest that the majority of increases in glucose supply upon neuronal activation are related to an increased concentration gradient towards the brain, followed by changes of the intrinsic properties of GLUT1, whereas increases in blood flow only play a minor role. Thus, the increased supply reflects the fast increase of the [18F]FDG signal, which is then followed by its metabolism via hexokinase.
Resting-state dynamics of [18F]FDG
The assessment of resting-state functional connectivity as derived from BOLD fMRI and EEG75,76 has made a convincing case that spontaneous fluctuations of brain signals represent biologically meaningful information even in the absence of specific stimulation. This has substantially changed our understanding about the interaction between brain regions, organized in hierarchical networks each underpinning different physiological functions.77 –79
Although the concept to compute connectivity with PET data was introduced decades ago,80,81 the computation of molecular connectivity has received particular attention in recent years,14,16,82 due to the ability to obtain reliable high temporal resolution PET data. In analogy to BOLD fMRI functional connectivity, molecular connectivity refers to the correlation of fluctuations of signal time courses between brain regions. 14 It has been shown that the computation of metabolic connectivity with [18F]FDG data also features structured network organization.15,16 However, the interpretation and the underlying neurophysiological mechanisms of such rapid signal fluctuations in the fPET signal without external stimulation have not been established.
Moment-to-moment fluctuations in [18F]FDG
There are various approaches available to compute moment-to-moment fluctuations from [18F]FDG fPET data,9,14 –16,83 but all with the common aim to remove the cumulative part of the TAC reflecting the irreversible uptake of the radiotracer. The most illustrative approach is a bandpass filter, due to the straightforward interpretation in terms of the signals’ frequencies.
Simulation results for metabolic connectivity
Simulations were carried out to assess potential contributions to the observed signal changes. Simulated changes in individual rate constants were first Fourier transformed, with focus on the frequency range of 0.01 < f < 0.1 Hz, 15 commonly used for BOLD fMRI functional connectivity. The corresponding frequency spectra indicate that the [18F]FDG signal underlying these fluctuations is primarily determined by K1 and k2 reflecting transport across the BBB, rather than k3 (Figure 3(a)), as the effect of changes in k3 was simply too slow (Figures 2(a) and 3(a)). Next, combined changes in rate constants were simulated and subsequently band-pass filtered in the 0.01–0.1 Hz frequency range. This procedure effectively removed the irreversible radioligand uptake, leaving only oscillating changes in the signal, both in experimental and simulated data (Figure 3(b) and (c)). Notably, the resulting oscillations resulting from the simulations were almost identical, regardless of whether changes in k3 changes were included. However and in contrast to task-induced changes, simulated variations in vB (reflecting presumed CBF changes) lead to similar oscillations in the [18F]FDG signal (Figure 3(b)).
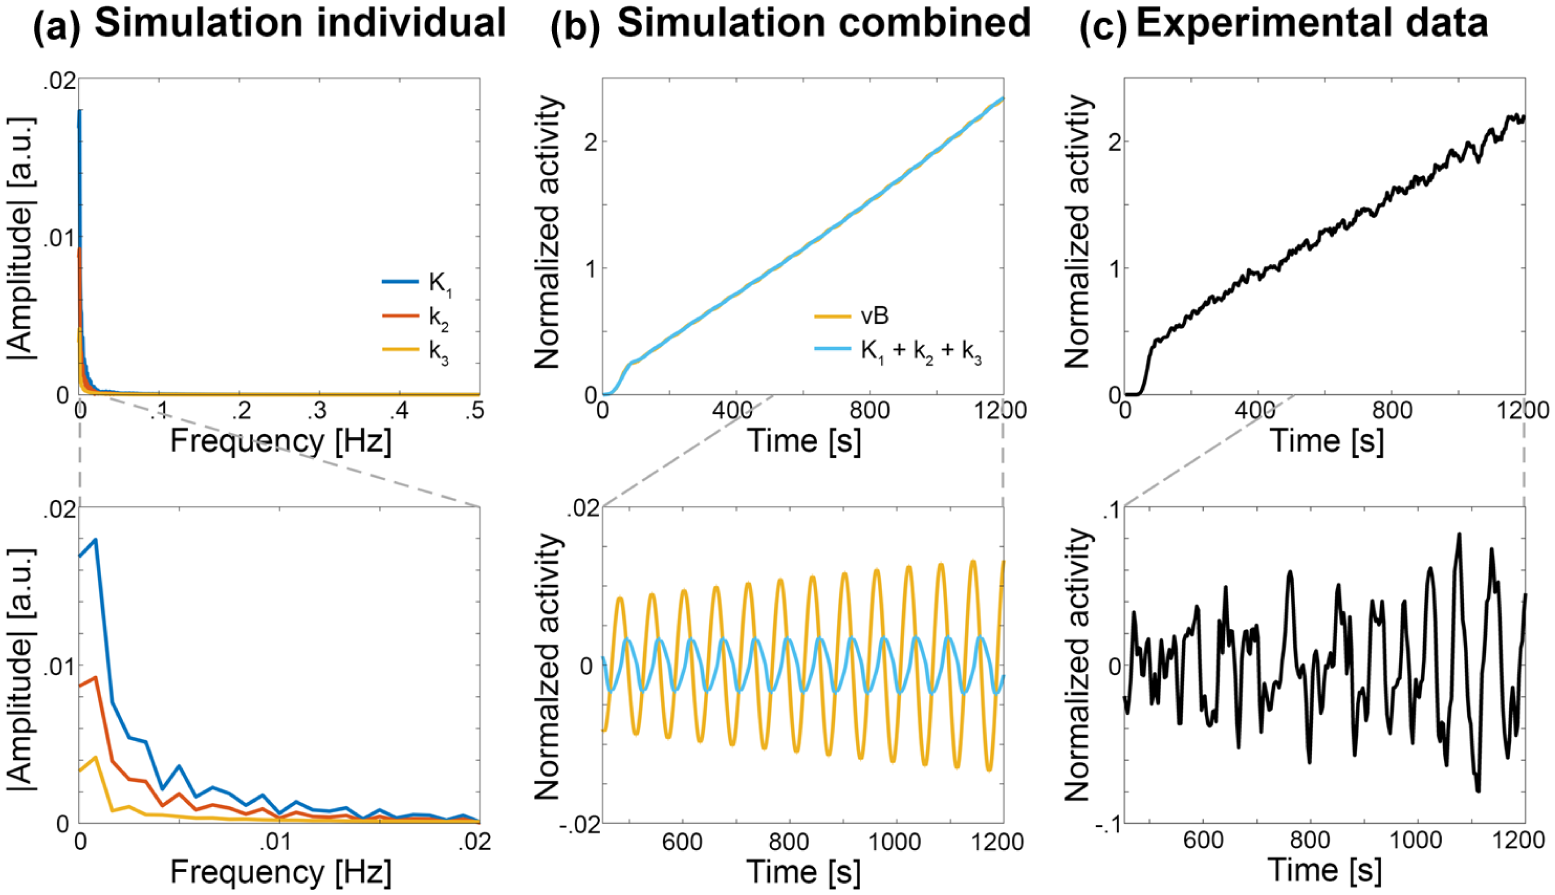
Simulated and experimentally observed changes in the [18F]FDG signal at resting state. (a) Frequency spectra of stimulation-specific changes in the TACs after simulated increases in individual rate constants as shown in Figure 2(a), (i.e., after removing baseline radiotracer uptake). The excerpt (lower panel) indicates that changes in K1 (dark blue) and to some extent k2 (red) comprise frequency components beyond 0.01 Hz, but not k3 (orange). (b) Combined changes in K1, k2, and k3 (light blue) exhibit oscillating changes on top of a steady baseline uptake. Rate constants were changed at the same ratio as in Figure 2(b; light blue). After applying a bandpass filter these oscillating changes remain (lower panel). Of note, omitting changes in k3 in this simulation showed virtually identical results, indicating that k3 does not contribute to these changes. Such oscillatory fluctuations were also obtained when varying the blood volume component vB in the 2TCM (orange), indicating that CBF indeed plays a relevant role for resting-state metabolic fluctuations. However, the exact ratio of contributions between changes in rate constants and CBF still remains unknown and as such the amplitudes may change. (c) Experimentally observed changes in the [18F]FDG fPET signal of a representative subject. 84 Application of a bandpass filter leaves oscillating changes also for experimental data (lower panel), which represent the basis for metabolic connectivity.
Several aspects however warrant further investigation and experimental validation. For instance, it remains to be clarified to what extent CBF variations translate into vB changes at the capillary level. Furthermore, the employed 2TCM has been developed for modeling tracer kinetics in steady-state, whereas rapid fluctuations may require additional refinements. Consequently, the precise contributions of individual rate constants and CBF remains uncertain and the amplitudes of the effects shown in Figure 3(b) may change under different modeling assumptions. These findings should therefore be interpreted cautiously, as the relative contributions of transport, phosphorylation, and blood flow may vary substantially depending on the underlying modeling assumptions. Nevertheless, it seems unlikely that metabolic connectivity obtained with [18F]FDG exclusively reflects CBF-related effects, since independent studies have reported substantial differences between BOLD-derived functional connectivity and [18F]FDG-based metabolic connectivity in terms of overall network structure15,16 and alterations in aging. 85
Potential interpretation of metabolic connectivity
From a more general view, it seems plausible that the observed fluctuations reflect adaptations through a regulatory circuit, aiming to maintain a constant supply of glucose which matches the current consumption, that is, slight increases and decreases from a steady baseline according to the actual changes in demand. In the hypothetical case that every brain region has equal metabolic demands, this oscillation would be uniform across the entire brain. However, since the brain is never truly at rest 86 and different brain regions are involved in processing distinct stimuli, its metabolic demands also vary across space and time, resulting in a regional variability in this regulatory signal. If two brain regions have equal metabolic demands simultaneously, then also their time courses would be similar and thus correlated, irrespective of their baseline metabolism. These regions can be considered to be metabolically coupled through their common acute changes in metabolic demands,80,81 which are in turn matched by corresponding changes in CBF and BBB transport. Recent work on high-temporal resolution fPET data showed a distinct network-specific organization of metabolic connectivity as computed from [18F]FDG signal fluctuations.15,18 However, the exact neurobiological underpinnings still need to be established. Although it might be surprising that k3 does not seem to play a direct role in metabolic connectivity, it is of course still relevant. As emphasized throughout this manuscript and within the concept of neurobarrier coupling, 27 changes in BBB transport are initially triggered by neuronal activation, subsequently leading to increased glucose consumption and thus increases in k3 (see above).
Limitations, outlook, and conclusions
Numerous studies with simulations and experimental data demonstrate that stimulation-induced increases in glucose metabolism require BBB transport for subsequent phosphorylation by hexokinase. We emphasize that changes in BBB transport may not be seen independently from hexokinase activity, as neuronal activation triggers both in order to match energy supply and demand, that is, these mechanisms are strongly coupled. In terms of [18F]FDG fPET imaging this implies that several rate constants (especially K1 and k3) are involved in this process (see Supplemental Figure S4 for association between rate constants). The adaptations supporting neuronal activation are mainly provided by an increased glucose BBB gradient towards the brain and functional changes in the intrinsic properties of GLUT1 molecules, while blood flow plays only a minor role for stimulation-specific effects. Conversely, moment-to-moment fluctuations in the [18F]FDG signal used for metabolic connectivity seem to reflect the regulation of metabolic supply through CBF and across the BBB to match the underlying demands.
As a limitation, current models may not yet be sufficient to characterize such rapid changes in glucose metabolism and the corresponding [18F]FDG signal. That is, the Michaelis–Menten equation is valid for the steady-state, an assumption that does not hold for acute changes in neuronal activation. Thus, several variables (e.g., Tmax, [GlucBrain]) become time-variant, which requires a different mathematical solution. For the simulations of the 2TCM, time-dependent rate constants were used, but the changes were only assumed to occur during the task effect at a fixed rate, while temporally varying changes and those beyond the stimulation period are possible. A further limitation is the non-identifiability of the model, as multiple combinations of time-varying rate constants can produce indistinguishable [18F]FDG TACs. Although our examples cannot cover the full simulation space, we provided results within a physiologically plausible and thus representative range of changes. Still, a full validation of the model against experimental data remains to be conducted in future work. Finally, we acknowledge that other sources apart from glucose may also be used for energy production. For instance, glycogen is stored in astrocytes, but its turnover is slower than that of glucose. 30 Furthermore, recent modelling suggested that glycogenolysis takes place in astrocytes to spare glucose for neuronal energy metabolism upon activation.33,35 This model also seemed to explain fluctuations in lactate, 87 which may however not represent a major energy source under normal conditions. 88 Nevertheless, the current work outlines potential neurophysiological underpinnings of rapid changes in the [18F]FDG signal, It is important to note that the described mechanisms do not replace previous assumptions and interpretations of [18F]FDG imaging, rather they should be seen as additional considerations specifically relevant for short-term changes imaged with fPET.
Future work may build upon this information to investigate if known pathological alterations of brain glucose metabolism can be characterized in more detail. For instance, decreases in GLUT1 transporters at the BBB explain hypometabolism, which occurs before the onset of cognitive dysfunction and amplifies neurodegenerative processes,89 –91 alterations that are also found in Parkinson’s disease.55,92 Further, increased GLUT1 phosphorylation in major depressive disorder was alleviated in patients who remitted after treatment. 93 Thus, BBB transfer by GLUT1 may represent a promising therapeutic target for various disorders to rescue brain glucose metabolism.25,94
Finally, the herein proposed concepts may at least partly translate to other targets such as dopamine and serotonin synthesis, imaged with 6-[18F]FDOPA 95 and [11C]AMT fPET, 96 respectively, as numerous of the presented aspects apply in a similar manner. These include facilitated transport across the BBB (via the L-type amino acid transporter 1),97,98 a low extraction fraction from blood 99 as well as tight coupling of BBB transport 100 and neurotransmitter synthesis enzymes101 –104 with neuronal activation. Future application of this approach may therefore provide novel insights into neurotransmitter dysfunction in psychiatric disorders.
Supplemental Material
sj-docx-1-jcb-10.1177_0271678X261455750 – Supplemental material for [18F]FDG functional PET revisited: A new perspective on the temporal dynamics of brain glucose metabolism
Supplemental material, sj-docx-1-jcb-10.1177_0271678X261455750 for [18F]FDG functional PET revisited: A new perspective on the temporal dynamics of brain glucose metabolism by Andreas Hahn, Pia Falb, Matej Murgaš, Sebastian Klug, Murray B. Reed, Godber M. Godbersen, Magdalena Ponce de León, Christian Milz, Marcus Hacker, Dan Rujescu and Rupert Lanzenberger in Journal of Cerebral Blood Flow & Metabolism
Footnotes
Acknowledgements
We thank the graduated team members and the diploma students of the Neuroimaging Lab (NIL, head: RL) as well as the clinical colleagues from the Department of Psychiatry and Psychotherapy for clinical and/or administrative support. In detail, we would like to thank L. Silberbauer, and G. Gryglewski for medical support, L. Rischka for acquisition and analysis support. The scientific project was performed with the support of the Medical Imaging Cluster of the Medical University of Vienna.
Author contributions
Conceptualization: AH and RL. Methodology: PF, AH, MBR, and MM. Software: PF. Writing – original draft: AH, MM, and PF. Writing – review and editing: All authors. Funding acquisition: AH, RL, and CM. All authors discussed the implications, revised the manuscript and approved the final version.
Declaration of conflicting interests
The authors declared the following potential conflicts of interest with respect to the research, authorship, and/or publication of this article: RL received investigator-initiated research funding from Siemens Healthcare regarding clinical research using PET/MR. He is a shareholder of the start-up company BM Health GmbH since 2019. DR served as consultant for Janssen, received honoraria from Gerot Lannacher, Janssen and Pharmagenetix, received travel support from Angelini and Janssen, and served on advisory boards of AC Immune, Roche and Rovi. M. Hacker received consulting fees and/or honoraria from Bayer Healthcare BMS, Eli Lilly, EZAG, GE Healthcare, Ipsen, ITM, Janssen, Roche, and Siemens Healthineers. All other authors report no conflict of interest in relation to this study.
Funding
The authors disclosed receipt of the following financial support for the research, authorship, and/or publication of this article: This research was funded in whole or in part by the Austrian Science Fund (FWF; Grant DOI 10.55776/KLI610, 10.55776/KLI1151 and 10.55776/PAT5436523, PI: A. Hahn, Grant DOI 10.55776/KLI1006, PI: RL). For open access purposes, the author has applied a CC BY public copyright license to any author-accepted manuscript version arising from this submission. CM is a recipient of a DOC Fellowship (27221) from the Austrian Academy of Sciences at the Department of Psychiatry and Psychotherapy, Medical University of Vienna.
ORCID iDs
Supplemental material
Supplemental material for this article is available online.
References
Supplementary Material
Please find the following supplemental material available below.
For Open Access articles published under a Creative Commons License, all supplemental material carries the same license as the article it is associated with.
For non-Open Access articles published, all supplemental material carries a non-exclusive license, and permission requests for re-use of supplemental material or any part of supplemental material shall be sent directly to the copyright owner as specified in the copyright notice associated with the article.