
Abstract
Many infants with mild hypoxic–ischemic encephalopathy (HIE) are treated with therapeutic hypothermia despite the lack of robust preclinical and clinical data that hypothermia is safe and effective. The aim of this study was to determine if hypothermia is neuroprotective after mild hypoxia–ischemia (HI). Chronically instrumented near-term fetal sheep (0.85 gestation) were randomized to sham control (n = 8) or to HI induced by 10 min of bilateral carotid artery occlusion followed by normothermia (HI-normothermia, n = 8) or 72 h of hypothermia started 6 h after the end of HI (HI-hypothermia, n = 8) and recovered for 7 days. Mild HI was associated with reduced electroencephalographic power compared with sham controls until 78 h after HI. HI was associated with a loss of neurons and an increase in microglia within the hippocampus, while HI-hypothermia restored numbers of neurons and microglia back to sham control. There was no difference in the number of total oligodendrocytes between groups. HI-hypothermia was associated with a significant decrease in mature oligodendrocyte number and myelin basic protein area fraction compared with sham control, despite no change in HI-normothermia. Hypothermia for 72 h is significantly neuroprotective within the hippocampus but potentially delays white matter maturation when started 6 h after mild HI.
Introduction
There is now substantial evidence that infants with mild hypoxic–ischemic encephalopathy (HIE) have material risks of brain injury and adverse neurodevelopmental outcomes. 1 For example, in the Prospective Research in Infants with Mild Encephalopathy (PRIME) study, 52% of infants had ⩾1 abnormality in the early aEEG, brain MRI or neurological exam at discharge from the neonatal intensive care unit, and by 2 years of age 16% of infants with mild HIE were diagnosed with disability.2,3 Consistent with this, in a recent large population study in Sweden, mild HIE was associated with greater risk of cerebral palsy, epilepsy, and death by 3 years of age. 4 In turn, this growing evidence for adverse outcomes for many infants with mild HIE has promoted therapeutic creep, such that an increasing number of infants with mild HIE are treated with therapeutic hypothermia.5–7
There is little preclinical evidence on hypothermia after “milder” HI insults in the neonatal brain, mainly limited to studies using the Rice Vannucci Model in post-natal day 7 rats, when brain development is broadly equivalent to late preterm human infants. 8 For example, pups that received hypothermia for 5 h starting immediately after mild-moderate but not severe HI had reduced area of hemispheric infarction compared with normothermia for the same duration, with partial protection when hypothermia was delayed until 3 h after HI. 9 By contrast, in the same model hypothermia immediately after “mild–moderate” HI for 5 h did not improve histological, MRI, or behavioral outcomes compared with normothermia. 10 Currently, there is no large animal evidence on whether an established clinical protocol of delayed hypothermia is effective after milder HI.
Clinically, some studies have suggested that infants with mild HIE treated with hypothermia had a lower incidence of brain injury on MRI scans.11–13 However, a small pilot from the larger Optimizing the Duration of Cooling in Mild Encephalopathy (COMET) trial reported that whole body hypothermia for either 48 or 72 h in infants with mild HIE did not improve cerebral magnetic resonance (MR) biomarkers, compared with infants treated with normothermia. 14 This study was limited by its small size and potential confounding associated with a complex randomization strategy. 15 Regardless, the main limitation of the clinical evidence of hypothermia for mild HIE is simply the lack of systematic randomized control trials.15,16
Therefore, the aim of the current study was to determine if hypothermia induced by head cooling initiated 6 h after mild HI and continued for 72 h is neuroprotective in near-term fetal sheep, using a protocol, that is, known to induce selective hippocampal damage. 17 At this age, brain development is similar to human infants at term. 18
Material and methods
Ethical approval
All procedures were approved by the Animal Ethics Committee of the University of Auckland, in accordance with the New Zealand Animal Welfare Act 1999 and the University of Auckland’s Code of Ethical Conduct for the use of animals for teaching and research, approved by the Ministry of Primary Industries, Government of New Zealand. All procedures were compliant with the ARRIVE guidelines for reporting animal research. 19
Surgical procedures
Time-mated pregnant Romney ewes were acclimatized for 7 days in the holding room prior to surgery, at a constant temperature of 16 °C ± 1 °C and 50% ± 10% humidity on a 12 h light/dark cycle. At 125–126 days gestation 24 ewes underwent sterile surgery for instrumentation of the Romney/Suffolk fetus. For 18 h prior to surgery, ewes had access to water but not food. Prior to surgery ewes were administered long acting oxytetracycline at 1 mL/10 kg (20 mg/kg; Phoenix Pharm, Auckland, New Zealand) intramuscularly (i.m.) for prophylaxis. Anesthesia was induced with intravenous (i.v.) propofol (5 mg/kg; AstraZeneca Limited, Auckland, New Zealand) into the brachial vein prior to maintenance with 2%–3% isoflurane (Bomac Animal Health, NSW, Australia) through an endotracheal tube. Ewes received a constant isotonic saline infusion throughout surgery through the brachial vein. Trained anesthetic staff continuously monitored the depth of anesthesia, maternal heart rate blood pressure, oxygen saturation, and end tidal carbon dioxide.
After sterilization of the surgical field a midline skin incision over the abdomen was made, followed by a laparotomy along the linea alba and an incision in the uterus to expose the fetus. Customized polyvinyl catheters were placed within the fetal brachial arteries for blood sampling and to measure mean arterial blood pressure (MABP). Another polyvinyl catheter was attached to the lateral side of the right shoulder for measurement of the amniotic pressure. Electrocardiogram (ECG) electrodes (AS633-7SSF; Cooner Wire Co., Chatsworth, CA, USA) were attached subcutaneously onto the right shoulder and the left fifth intercostal space, for monitoring of fetal heart rate (FHR).
Bilateral incisions were made on the fetal neck exposing the carotid arteries. All vertebral-occipital anastomoses attached to the carotid arteries were ligated. In house made inflatable carotid artery occluders made from silicon tubing (Degania Silicone, Kibbutz Degania Bet, Israel) were placed bilaterally around the carotid arteries, for induction of ischemia after surgery. An ultrasonic flow probe (3S Transonic systems, Ithaca, NY, USA) was placed around the right carotid artery, inferior to the carotid occluder to measure carotid artery blood flow (CaBF).
A thermistor (Incu-Temp-1; Mallinckrodt Medical, St. Louis, MO, USA) was placed within the esophagus to measure core body temperature. An additional thermistor was placed over the parasagittal dura ~30 mm anterior to lambda, to measure extradural brain temperature.
Two pairs of electroencephalogram (EEG) electrodes (made from seven stranded stainless-steel wire, AS633–7SSF; Cooner Wire Co.) were placed on the dura through burr holes over the parasagittal parietal cortex (10 and 20 mm anterior to lambda and 10 mm lateral of the medial longitudinal fissure). Burr holes were sealed and electrodes secured in place with bone wax and cyanoacrylate glue. A reference earth wire was sutured into the skin over the fetal occiput. Two pairs of electrodes were sewn into the nuchal muscle, to measure fetal electromyogram (EMG) activity. A cooling cap made in house from silicon tubing (3 × 6 mm; Degania Silicone) was secured over the fetal head for the induction of hypothermia.
On completion of fetal instrumentation, the fetus was returned to the uterus with the amniotic fluid lost during surgery replaced with 0.9% saline (∼500 mL at 39 °C), and the uterine incision closed. Gentamicin (80 mg, Pharmacia and Upjohn, Rydalmere, New South Wales, Australia) was administered into the amniotic cavity for prophylaxis. The incision with the linea alba and skin were closed, and 0.5% bupivacaine plus adrenaline (AstraZeneca Ltd., Auckland, New Zealand, 10 mL) was injected into the skin around the incision as a local analgesic. All leads from the fetus were exteriorized through the maternal flank. A long saphenous vein on the ewe was catheterized to allow for post operative care and euthanasia. All fetuses received the same instrumentation, with successful instrumentation and recovery of the fetus determined by the return of normal biochemical and physiological parameters by 129 ± 1 days gestation. Failure of preparation occurred in <10% of fetal surgeries.
Post operative care
Following surgery, ewes were housed in individual metabolic cages with other sheep in a climate-controlled room (16 °C ± 1 °C and 50% ± 10% humidity) on a 12 h light/dark cycle, with access to food and water ad libitum. Through the saphenous vein, ewes were given benzylpenicillin sodium (600 mg; Novartis, Auckland, New Zealand) for 4 days, and gentamicin (80 mg; Pharmacia & Upjohn) daily for 2 days after surgery. Fetal and maternal catheters were kept patent, through a continuous infusion of heparinized saline (20 U/mL at a rate of 0.20 mL/h). Fetal arterial blood samples were taken daily to monitor for health, for blood gas and base excess, glucose and lactate measurements (ABL90 Flex Plus; Radiometer, Auckland, New Zealand).
Experimental protocol
Fetuses of both sexes were randomized 2 h before the start of occlusion/sham occlusion to sham control (n = 8), HI-normothermia (n = 8), or HI-hypothermia (n = 8) using a random number generator at 129 ± 1 days gestation. Following randomization, HI was induced in the ischemia groups, through temporary inflation of the carotid artery occluders with sterile saline for 10 min. A successful occlusion was confirmed by a rapid fall in CABF (to zero) and EEG activity, followed by a delayed increase in cerebral impedance. The duration of HI was shorter than the 30 min used in other studies to induce a severe HI insult.20,21 Fetal blood samples were taken before occlusion, 2, 4, and 6 h after occlusion then daily for the duration of the experiment.
In fetuses randomized to HI-hypothermia, cooling began 6 h after HI by circulating cold water through the cooling coils for 72 h. In line with previously published studies the targeted extradural temperature was 31 °C–33 °C for the first 6 h.20,21 No water was circulated in the cooling coils of sham controls or HI-normothermia fetuses.
Seven days after HI, the ewe and fetuses were killed with an overdose of sodium pentobarbitone (9 g i.v. to the ewe; Pentobarb 300; Chemstock, Christchurch, New Zealand) and fetal sex was recorded. Fetal brains were perfusion fixed via cannulation of both carotid arteries with heparinized saline (20 IU/mL) and then 10% phosphate-buffered formalin. Brains were then post-fixed by immersion in 10% phosphate-buffered formalin for 1 week and then embedded in paraffin in preparation for immunohistochemistry.
Neurophysiological analysis
Physiological and neurophysiological parameters were calculated as 1 min means, then converted to 1 h means. Fetal MABP was corrected for maternal movement by subtraction of amniotic pressure.
Total EEG power (µV2) was calculated on the power spectrum between 1 and 20 Hz.22,23 EEG spectral edge frequency was calculated as the frequency below which 90% of EEG power was present. 22 The power spectra was calculated using fast Fourier transform of the EEG on sequential epochs, using a 10 s Hanning window to minimize spectral leakage, with the proportion of each spectral band (delta (0–3.9 Hz), theta (4–7.9 Hz), alpha (8–12.9 Hz), and beta (13–22 Hz)) calculated as percentage of the total power across all bands.
Immunohistochemical analysis
Coronal slices were cut using a microtome (10 µm thick; Leica Jung RM2035, Wetzlar, Germany) starting at the level of the dorsal hippocampus. Slides were dewaxed in xylene and rehydrated in decreasing concentrations of ethanol and then washed in phosphate-buffered saline (PBS, 0.1 mol/L). Slides were placed in citrate buffer in an antigen retriever (2100 Antigen Retriever, Aptum Biologics Ltd., Southampton, England) for 2 h which was heated up to 121 °C. Endogenous peroxidase activity was blocked through incubation in 1% H2O2 in methanol (or PBS for Olig-2 and CC1 labeling) for 30 min. Blocking was performed in 3% normal goat serum (NGS, Life Technologies Limited, Auckland, New Zealand) for 1 h at room temperature. Sections were labeled with primary antibodies (1:200) with 3% NGS PBS at 4 °C overnight. Primary antibodies included rabbit anti-neuronal nuclei monoclonal antibody (NeuN; Abcam, Cambridge, England, Cat #AB177487), mouse anti-ionized calcium-binding adapter molecule 1 (Iba-1; Abcam, Cat #AB15690), mouse anti-myelin basic protein (MBP, MAB381; Millipore, Burlington, MA, USA), mouse anti-2′,3′-cyclic-nucleotide 3′-phosphodiesterase (CNPase, AB6319; Abcam); mouse anti-APC antibody (CC-1, AB16794; Abcam); mouse anti-oligodendrocyte lineage transcription factor 2 (Olig-2, AB236540; Abcam); and rabbit anti-glial-fibrillary-acidic protein (GFAP, AB68428; Abcam). Slides were then incubated overnight in either 1:200 biotin-conjugated goat anti-rabbit (Vector Laboratories, Burlingame, CA, USA, Cat #BA-1000) or 1:200 biotin-conjugated goat anti-mouse (Vector Laboratories, Cat #BA-9200) antibody in 3% NGS at 4 °C. Slides were incubated in ExtrAvidin® (1:200; Sigma–Aldrich Pty. Ltd., St Louis, MO, USA) in 3% NGS PBS for 2 h at room temperature. Diaminobenzidine tetrachloride (Sigma–Aldrich Pty. Ltd.) was then added to slides, with the reaction stopped by washing in PBS. Sections were then dehydrated in increasing concentrations of alcohol and then xylene and mounted (Sigma–Aldrich Pty. Ltd.).
Imaging
Imaging and image analysis was performed by an investigator who was blinded by separate coding of all sections to prevent identification of experimental groups. Images within the hippocampus and gray matter region of the parasagittal (PS) gyri 1 and 2 were taken by bright field microscopy on an Olympus Slideview VS200 slide scanner (Evident Corporation, Tokyo, Japan). These images were taken with a 10× objective (0.3 NA) apart from NeuN+ neurons in the hippocampus which was taken with a 20× objective (0.8 NA). Images within the intragyral white matter tracts of the PS1 and PS2 were taken by bright field microscopy on an Nikon H600 L (Scitech Ltd., Preston, VIC, Australia) with images of MBP and CNPase labeling with a 40× objective (0.75 NA) and Iba-1, GFAP, Olig-2, and CC1 with a 20× objective (0.5 NA).
Images were analyzed using Image J and the number of NeuN+, Iba-1+, GFAP+, CC1+, Olig-2+ cells in these regions were counted by an investigator blinded to the treatment groups. Neurons with pyknotic appearance were excluded from counts. Area fraction for MBP, CNPase, and GFAP positive labeling were performed using the Auto threshold settings on ImageJ.
Statistical analysis
The primary outcome of this study is neuronal loss within the CA3 region of the hippocampus. Based on a standard deviation of 20 for neuronal loss in the CA3 region a group size of 8 was needed to provide 80% power to detect a difference of 30 cells/mm2 or more between groups. The Shapiro–Wilk test was used to assess the normality between groups. The Fisher’s exact test was used to assess differences in sex between groups. When multiple time points or areas were analyzed a repeated measures analysis of variance (ANOVA) was performed with the different areas or time treated as repeated measures. When comparing spectral edge frequencies before-hypothermia with during hypothermia a paired samples test was done. For all other data a one-way ANOVA or a Kruskal–Wallis test was used, followed by a Fisher’s least significant difference (LSD) post hoc test when statistical significance was found (IBM SPSS Statistics 24). Statistical significance was accepted when p < 0.05. Exact p values are provided unless tests returned p < 0.001. All values are expressed as the mean ± 95% confidence interval unless otherwise specified.
Results
Fetal demographics, blood gases, glucose, and lactate measurements
There was no significant difference in brain (p = 0.810) or body weight between groups (p = 0.216; Supplementary Table 1). There was also no significant difference in sex between groups (p = 0.195).
There was no significant difference in baseline pH (p = 0.204), PaCO2 (p = 0.058), PaO2 (p = 0.776), or lactate (p = 0.308) between groups (Supplementary Table 2). Baseline glucose levels were slightly higher in sham controls than HI-hypothermia (p = 0.040) but not HI-normothermia (p = 0.077). After HI, the lactate levels rose in the HI-normothermia group compared with sham controls at 2 and 4 h and 1 day after HI (2 h, p = 0.019, 4 h, p = 0.014, 1 day, p = 0.018). During treatment with hypothermia the PaCO2 was significantly lower in HI-hypothermia compared with sham control on days 1 and 2 after HI, and HI-normothermia on day 1 (day 1 HI-hypothermia vs sham control p = 0.012, vs HI-normothermia p = 0.003; day 2 HI-hypothermia vs sham control p = 0.021).
Temperature, MABP, FHR, and CaBF
HI-hypothermia was associated with reduced extradural temperature compared with sham control and HI-normothermia (both p < 0.001 vs HI-hypothermia; Figure 1), and with reduced esophageal temperature compared with sham control and HI-normothermia (HI-hypothermia vs sham control p < 0.001, vs HI-normothermia p = 0.002). HI was associated with reduced CaBF until 3 h after HI (sham control vs HI-normothermia p < 0.001, vs HI-hypothermia p = 0.012). HI was also associated with increased FHR and MABP during HI, compared with sham controls (FHR: sham control vs HI-normothermia p = 0.011, vs HI-hypothermia p = 0.012, MABP: sham control vs HI-normothermia p < 0.001, vs HI-hypothermia p = 0.009). At the onset of hypothermia from (6–7 h after HI) there was a significant increase in FHR in the HI-hypothermia group compared with both sham control (p = 0.025) and HI-normothermia (p = 0.007). From 10 h until the end of the experiment nuchal EMG activity was significantly lower in the HI-normothermia group compared with sham control (p = 0.014). At the onset of hypothermia (6–12 h after HI) there was a significant increase in nuchal activity in the HI-hypothermia group compared with both sham control (p = 0.008) and HI-normothermia (p = 0.001). After rewarming, nuchal body movements in the HI-hypothermia group were reduced from 78 to 81 h after HI in the HI-hypothermia group compared with sham controls (p < 0.001) but not HI-normothermia (p = 0.120).
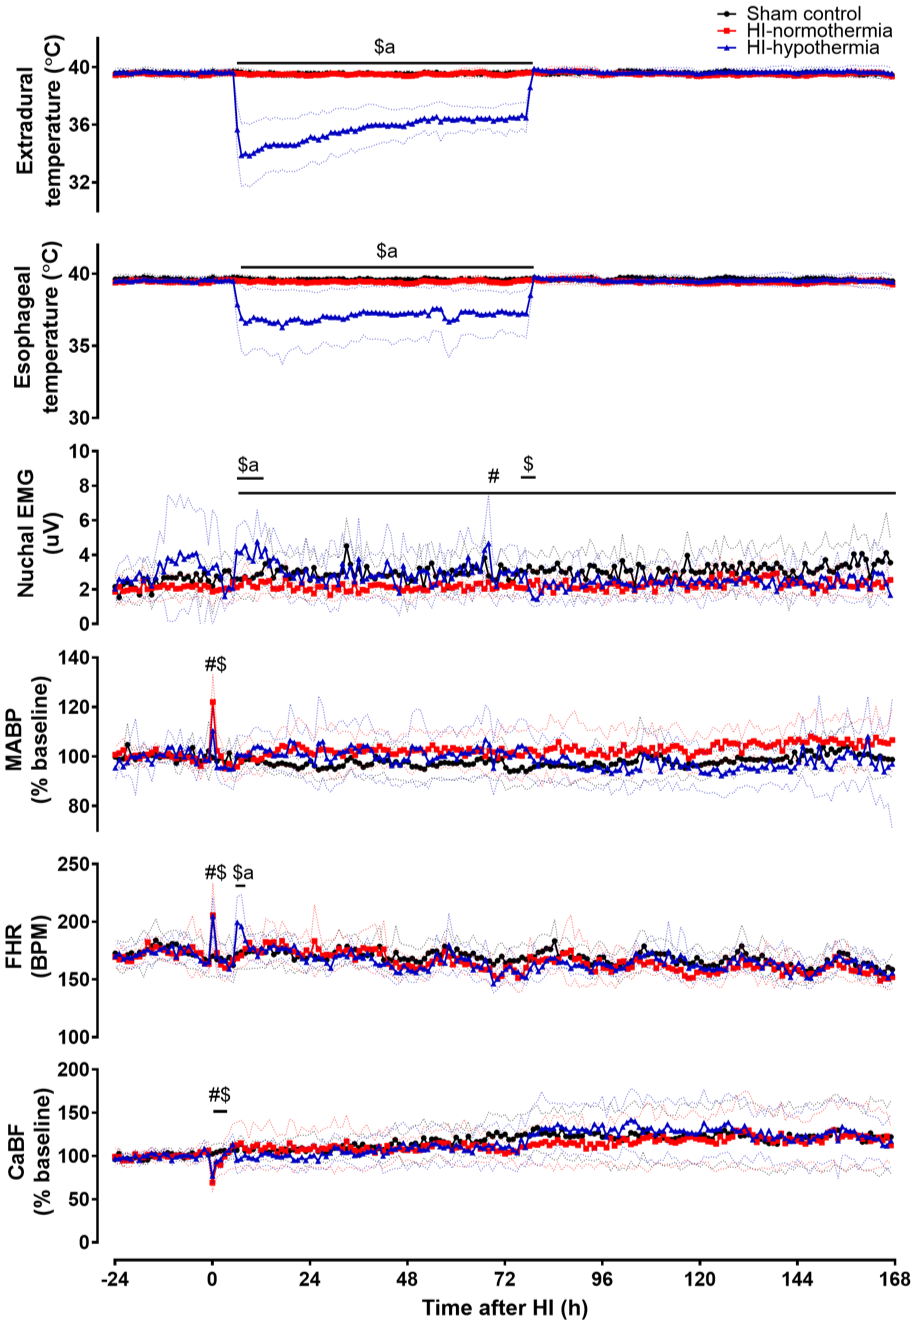
Change in extradural, esophageal temperature, nuchal EMG, MABP, FHR, and CaBF before, during, and after 10 min of HI (time 0) in sham control, HI-normothermia, and HI-hypothermia groups. Sham control (black circles) n = 8, HI-normothermia (red squares) n = 8, and HI-hypothermia n = 8 (blue triangles). Data are mean ± 95% confidence intervals. #p < 0.05 sham control versus HI-normothermia, $p < 0.05 sham control versus HI-hypothermia, ap < 0.05 HI-normothermia versus HI-hypothermia.
Neurophysiology
HI was associated with immediate suppression of EEG power in both the HI-normothermia and the HI-hypothermia groups. EEG power remained lower than sham control until 78 h after HI (sham control vs HI-normothermia p = 0.006, vs HI-hypothermia p = 0.008; Figure 2). There was no significant difference in the recovery of EEG activity during this period between the HI-normothermia and HI-hypothermia groups (p = 0.739). After 78 h there was no significant difference in EEG activity between any of the groups (p = 0.197).
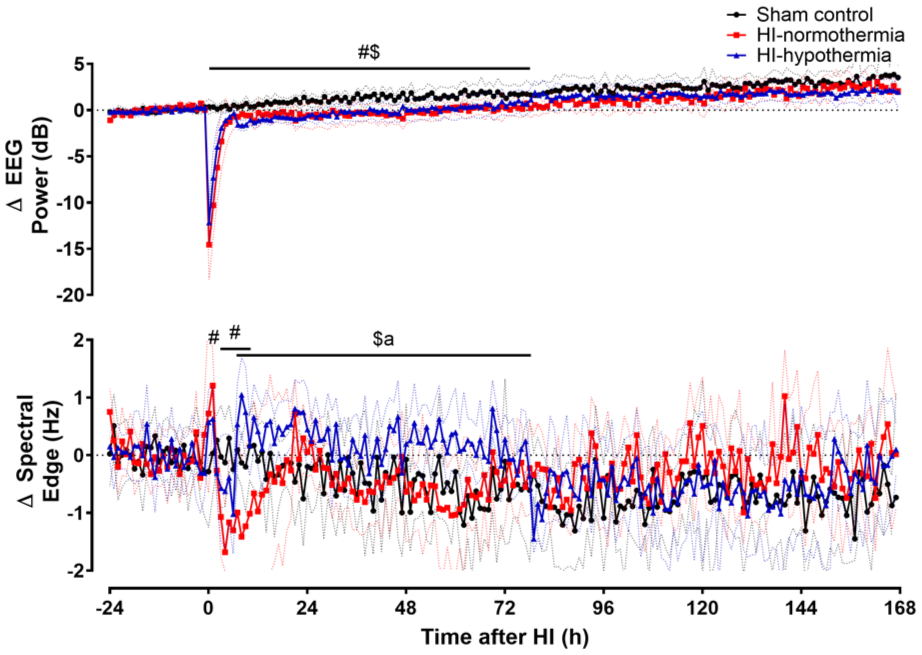
Time sequence of changes in EEG power and spectral edge frequency before, during, and after 10 min of HI (time 0) in the sham control, HI-normothermia, and HI-hypothermia groups. Sham control (black circles) n = 8, HI-normothermia (red squares) n = 8, and HI-hypothermia n = 8 (blue triangles). Data are mean ± 95% confidence intervals. #p < 0.05 sham control versus HI-normothermia, $p < 0.05 sham control versus HI-hypothermia, ap < 0.05 HI-normothermia versus HI-hypothermia.
HI-normothermia was associated with increased spectral edge frequency compared with sham controls at 1 h after HI (p = 0.005; Figure 2), followed by a fall to below sham control values from 3 to 10 h after HI (p = 0.010). By contrast, the onset of hypothermia after HI was associated with increased spectral edge frequency (p < 0.001), which was sustained for the whole period of hypothermia compared with both sham control and HI-normothermia (HI-hypothermia vs sham control p = 0.007, vs HI-normothermia p = 0.003). After rewarming there was no significant difference in spectral edge frequency between groups (p = 0.327).
HI was associated with a significant decrease in the proportion of delta activity in both the HI-normothermia and the HI-hypothermia groups compared with sham control from 0 to 1 h (sham control vs both HI-normothermia and HI-hypothermia p < 0.001; Figure 3). From 4 to 16 h after HI, the proportion of delta activity in the HI-normothermia group was significantly increased compared with sham control (p < 0.001). At the onset of hypothermia there was a significant decrease in the proportion of delta activity in the HI-hypothermia group (p = 0.002), with a sustained reduction in the proportion of delta activity in the HI-hypothermia group compared with HI-normothermia (p = 0.001), but not sham controls (p = 0.151). After hypothermia there were no significant differences in the proportion of delta activity between groups (p = 0.534).
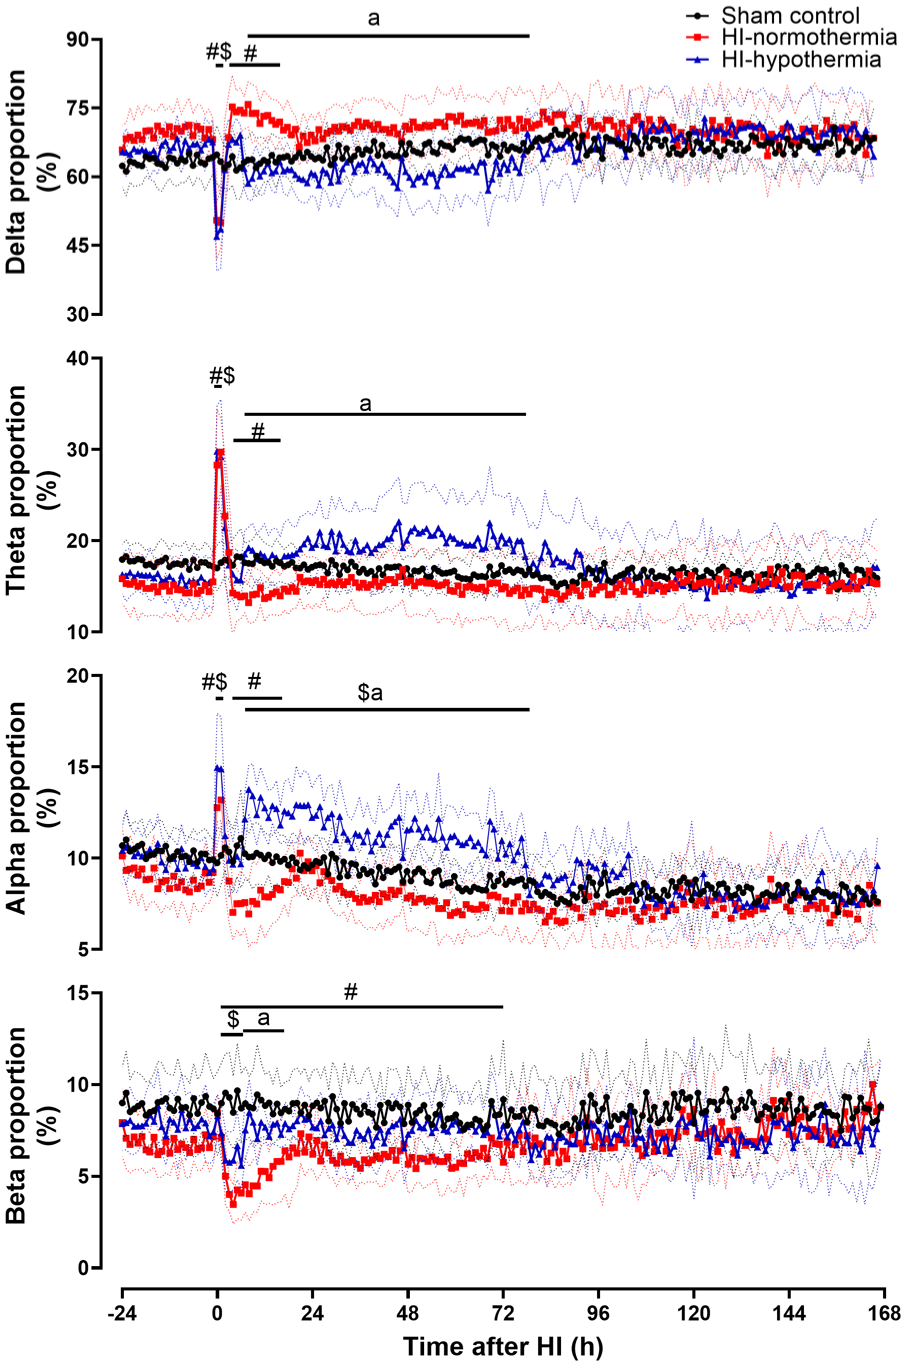
Percentage of delta, theta, alpha, and beta frequencies before, during, and after 10 min of HI (time 0) in sham control, HI-normothermia, and HI-hypothermia groups. Sham control (black circle) n = 8, HI-normothermia (red square) n = 8, and HI-hypothermia n = 8 (blue triangle). Data are the mean ± 95% confidence intervals. #p < 0.05 sham control versus HI-normothermia, $p < 0.05 sham control versus HI-hypothermia, ap < 0.05 HI-normothermia versus HI-hypothermia.
HI was associated with a significant increase in the proportion of theta activity in both the HI-normothermia and the HI-hypothermia groups compared with sham control from 0 to 2 h (sham control vs both HI-normothermia and HI-hypothermia p < 0.001; Figure 3). From 4 to 16 h after HI, the proportion of theta activity in the HI-normothermia group was significantly decreased compared with sham control (p = 0.014). At the onset of hypothermia there was a significant increase in the proportion of theta activity in the HI-hypothermia group (p = 0.005), and subsequently the proportion of theta activity in the HI-hypothermia group remained greater than HI-normothermia (p = 0.011) but not sham control (p = 0.152). After hypothermia there was no significant difference in the proportion of theta activity between groups (p = 0.695).
HI was associated with a significant increase in the proportion of alpha activity in both the HI-normothermia and the HI-hypothermia groups compared with sham controls from 0 to 2 h (sham control vs HI-normothermia p = 0.010, vs HI-hypothermia p < 0.001; Figure 3). From 4 to 16 h there was a significant decrease in the proportion of alpha activity in the HI-normothermia group compared with both sham control and HI-hypothermia (p = 0.005). At the onset of hypothermia there was a significant increase in the proportion of alpha activity (p = 0.003), which remained greater than both sham controls (p = 0.003) and HI-normothermia (p < 0.001) for the duration of hypothermia. This resolved after hypothermia, with no difference in the proportion of alpha activity between groups (p = 0.278).
HI-normothermia was associated with a significant decrease in the proportion of beta activity from 1 to 72 h after HI, with a similar reduction from 1 to 6 h after HI in the HI-hypothermia group compared with sham controls (sham control vs HI-normothermia p = 0.003, vs HI-hypothermia p = 0.004; Figure 3). At the onset of hypothermia there was a significant increase in the proportion of beta activity in the HI-hypothermia group (p = 0.006). From 7 to 17 h the proportion of beta activity in the HI-hypothermia group was not significantly different to sham control (p = 0.184) but it was greater than HI-normothermia (p = 0.008). This resolved after rewarming, with no differences in the proportion of beta power between groups (p = 0.376).
Seizure activity
HI was associated with delayed onset of seizures in both the HI-normothermia and HI-hypothermia groups (4/7 in HI-normothermia and 3/7 in HI-hypothermia group). There was no significant difference between HI-normothermia and HI-hypothermia in the total number of seizures (7.4 ± 9.6 in HI-normothermia and 1.3 ± 1.0 in HI-hypothermia, p = 0.238) or total duration of seizures (4.7 ± 5.9 min in HI-normothermia and 0.5 ± 0.7 min in HI-hypothermia, p = 0.190). There was no significant difference in seizure number (p = 0.229) or seizure burden (p = 0.185) at any time point between HI-normothermia and HI-hypothermia (Supplementary Figure 1). Of fetuses that had seizures in the HI groups, 5/8 had seizures before 6 h (2/4 in the HI-normothermia group and 3/4 in the HI-hypothermia group). There was no significant difference in seizure start time (6.3 ± 4.4 h after HI in HI-normothermia and 2.8 ± 2.2 h after HI in HI-hypothermia p = 0.274). There was no significant difference in the time for the last seizure to occur between HI-normothermia and HI-hypothermia (14.9 ± 12.6 h after HI in HI-normothermia and 3.9 ± 3.2 h after HI in HI-hypothermia p = 0.161). After the start of hypothermia at 6 h a total of 3/4 in the HI-normothermia group and 1/4 in the HI-hypothermia group had seizures.
Sleep state cycling
HI was associated with transient loss of sleep state cycling, which returned in all animals in the HI-normothermia and HI-hypothermia groups. There was no significant difference in the time taken for sleep state cycling to return between HI-normothermia (7.2 ± 3.6 h) and HI-hypothermia groups (6.1 ± 2.5 h, p = 0.627).
Hippocampal and cortical immunohistochemistry
HI was associated with reduced neuronal counts within all hippocampal regions compared with sham control (HI-normothermia vs sham control; CA1 p = 0.008, CA3 p < 0.001, CA4 p = 0.004, and DG p < 0.001; Figure 4). Hypothermia was associated with a significant increase in neuronal counts within the CA1, CA3, and DG compared with HI-normothermia (HI-hypothermia vs HI-normothermia; CA1 p = 0.007, CA3 p = 0.038, and DG p = 0.011). Hypothermia was not associated with any improvement in neuronal counts within the CA4 region compared with HI-normothermia (p = 0.136). There was no significant difference in neuronal counts within any of the hippocampal regions between HI-hypothermia and sham control (HI-hypothermia vs sham control; CA1 p = 0.934, CA3 p = 0.117, CA4 p = 0.115, and DG p = 0.151).
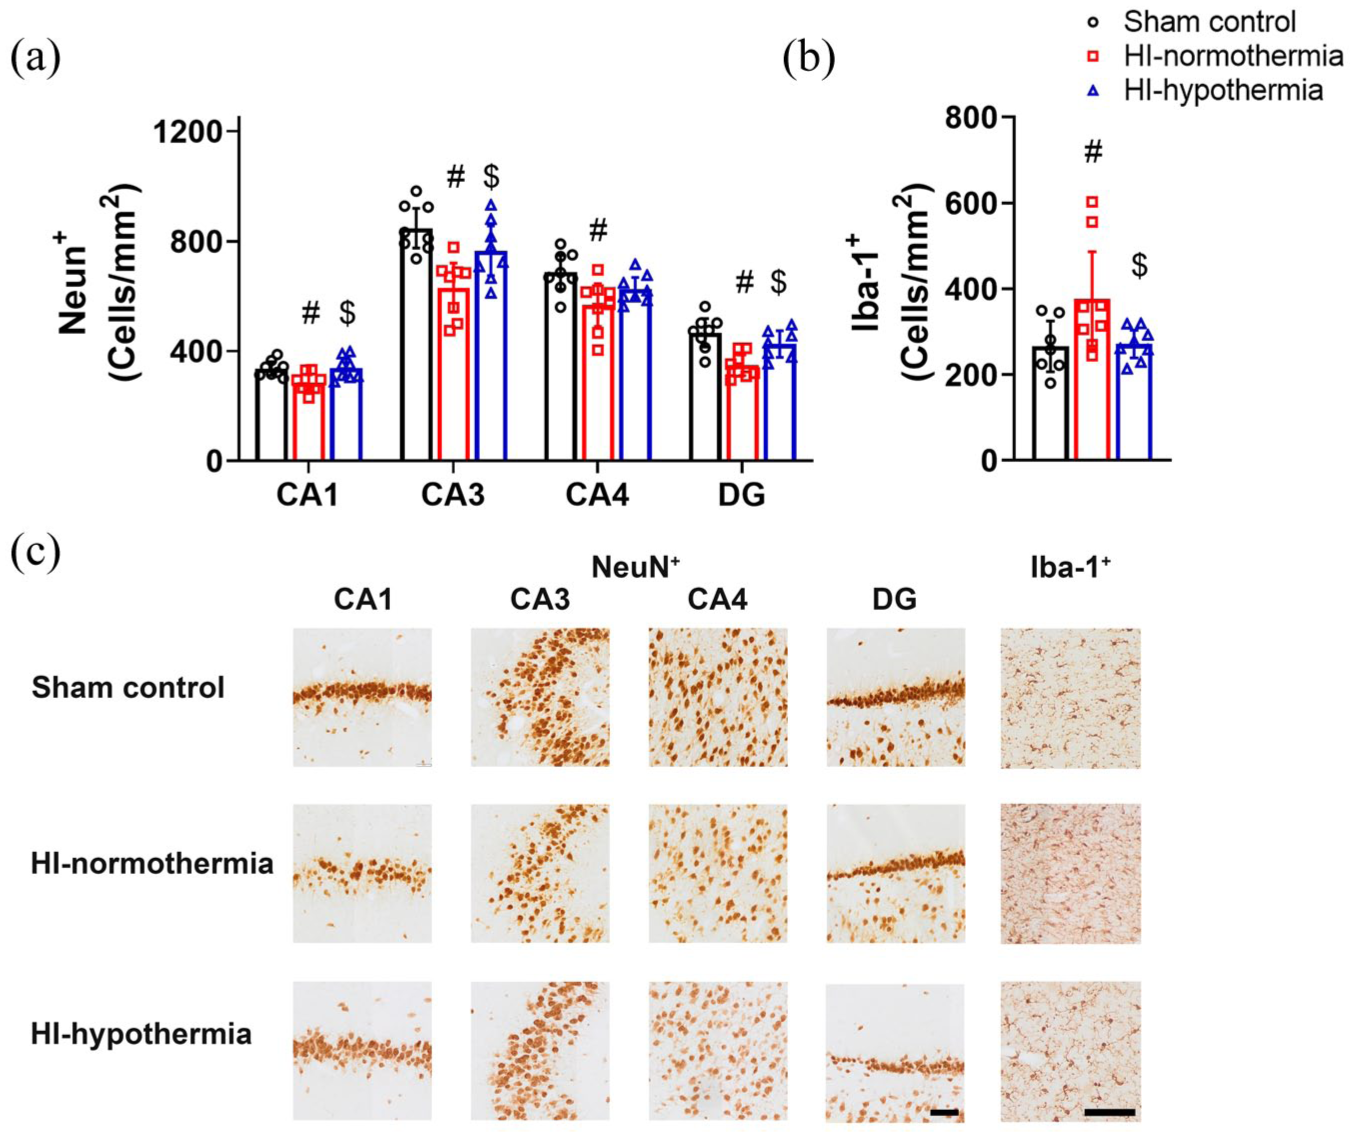
NeuN+ neurons and Iba-1+ microglia within the hippocampus 7 days after 10 min of HI in sham control, HI-normothermia, and HI-hypothermia groups: (a) NeuN+ cells within the CA1, CA3, CA4, and DG regions of the hippocampus, (b) Iba-1+ cells within the hippocampus, and (c) representative photomicrographs of NeuN+ neurons in the CA1, CA3, CA4, DG, and Iba-1+ microglia in the hippocampus. Scale bar for NeuN+ images = 100 µm. Scale bar for Iba-1+ images = 100 µm. Sham control, n = 8, HI-normothermia n = 8, and HI-hypothermia n = 8. Data are mean ± 95% confidence intervals. #p < 0.05 versus sham control, $p < 0.05 versus HI-normothermia.
HI was associated with increased numbers of microglia within the hippocampus compared with sham control (p = 0.026; Figure 4). Hypothermia was associated with a reduction in the number of microglia compared with HI-normothermia (p = 0.028), to sham control levels (p = 0.907).
There was no significant difference in neuronal or microglia counts within the cortex between groups (neuronal: PS1 p = 0.205 and PS2 p = 0.323, microglial: PS1 p = 0.425 and PS2 p = 0.108; Figure 5).
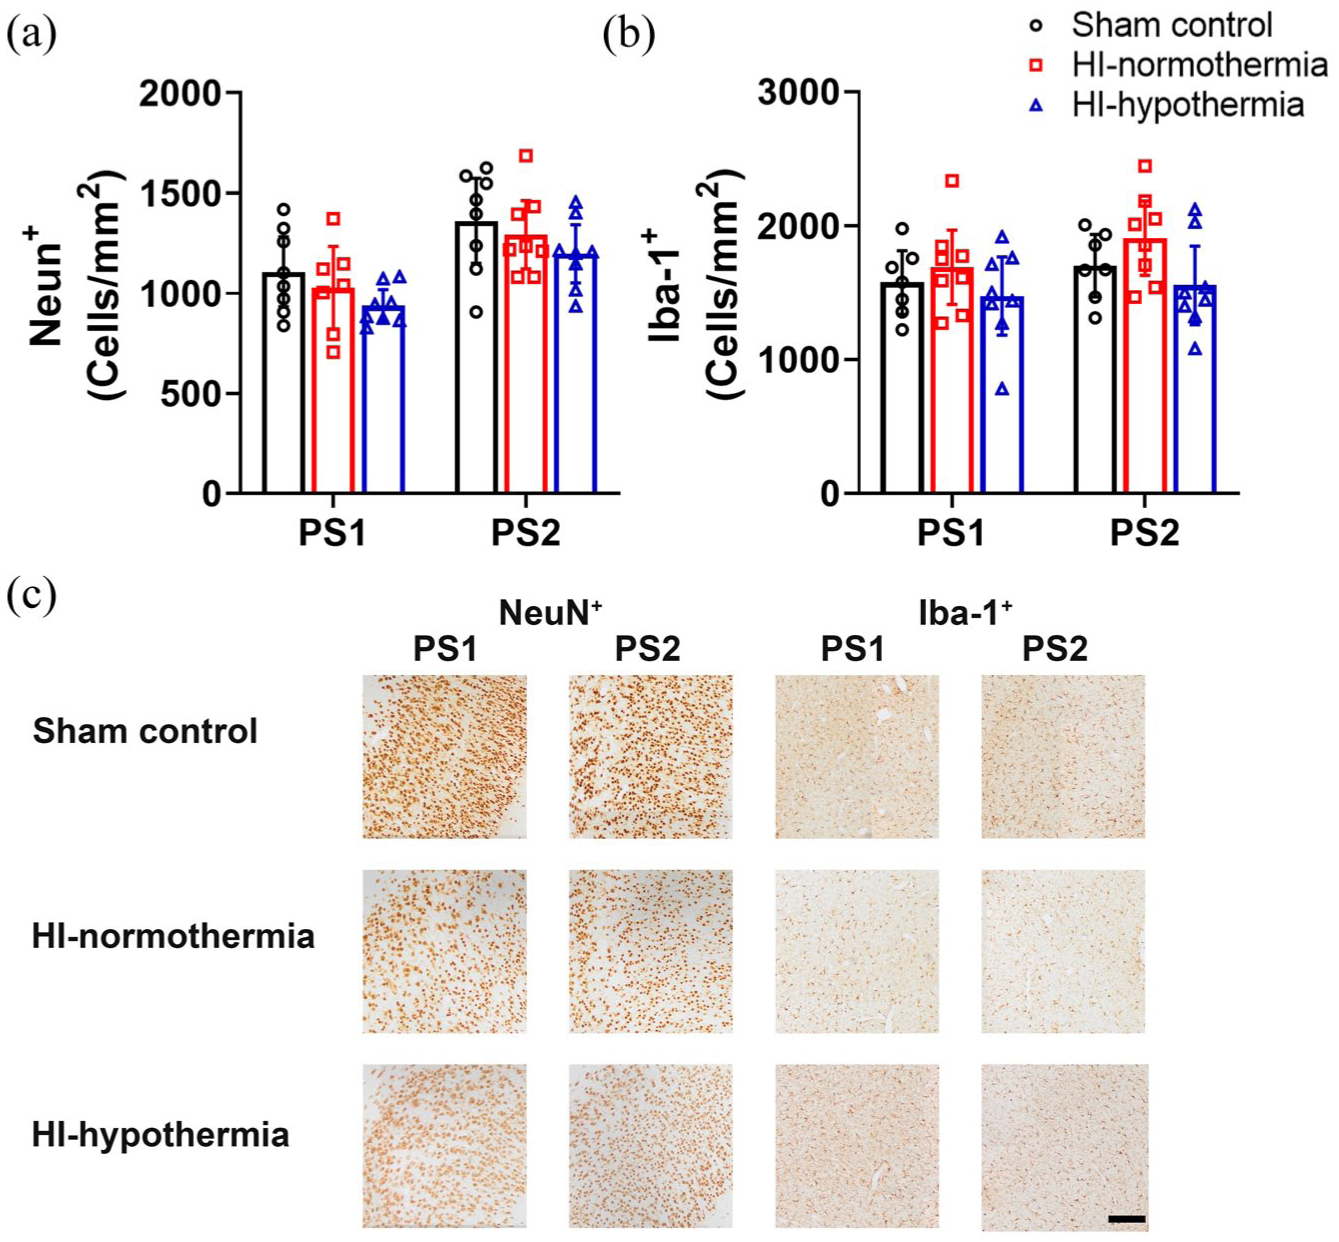
NeuN+ neurons and Iba-1+ microglia within the cortex 7 days after 10 min of HI in sham control, HI-normothermia, and HI-hypothermia groups: (a) number of NeuN+ cells within the PS1 and PS2, (b) number of Iba-1+ cells within the PS1 and PS2, and (c) representative photomicrographs of NeuN+ neurons and Iba-1+ microglia in the PS1, and PS2. Scale bar = 200 µm. Sham control, n = 8, HI-normothermia n = 8, and HI-hypothermia n = 8. Data are mean ± 95% confidence intervals.
Intragyral and periventricular white matter tracts immunohistochemistry
There was no significant difference in the total number of oligodendrocytes between groups (IGWM1 p = 0.702, IGWM2 p = 0.685, and PVWM p = 0.966). Hypothermia was associated with a significant reduction in the number of mature oligodendrocytes within the IGWM2 and PVWM compared with sham control and with HI-normothermia within the PVWM (HI-hypothermia vs sham control IGWM2 p = 0.012, PVWM p = 0.012, vs HI-normothermia IGWM2 p = 0.047).
Hypothermia was associated with reduced area fraction of MBP compared with sham control within the IGWM2 and PVWM and HI-normothermia in the PVWM (HI-hypothermia vs sham control IGWM2 p = 0.011 and PVWM p = 0.006, vs HI-normothermia PVWM p = 0.022; Figure 6). There was no significant difference in MBP area fraction between groups within the IGWM1 (p = 0.091). Hypothermia was associated with reduced area fraction of CNPase compared with sham control and HI-normothermia within the IGWM1 and PVWM (HI-hypothermia vs sham control IGWM1 p = 0.022 and PVWM p = 0.006, vs HI-normothermia IGWM1 p = 0.007, PVWM p = 0.001; Figure 6). There was no significant difference in CNPase area fraction in the IGWM2 between groups (p = 0.188).
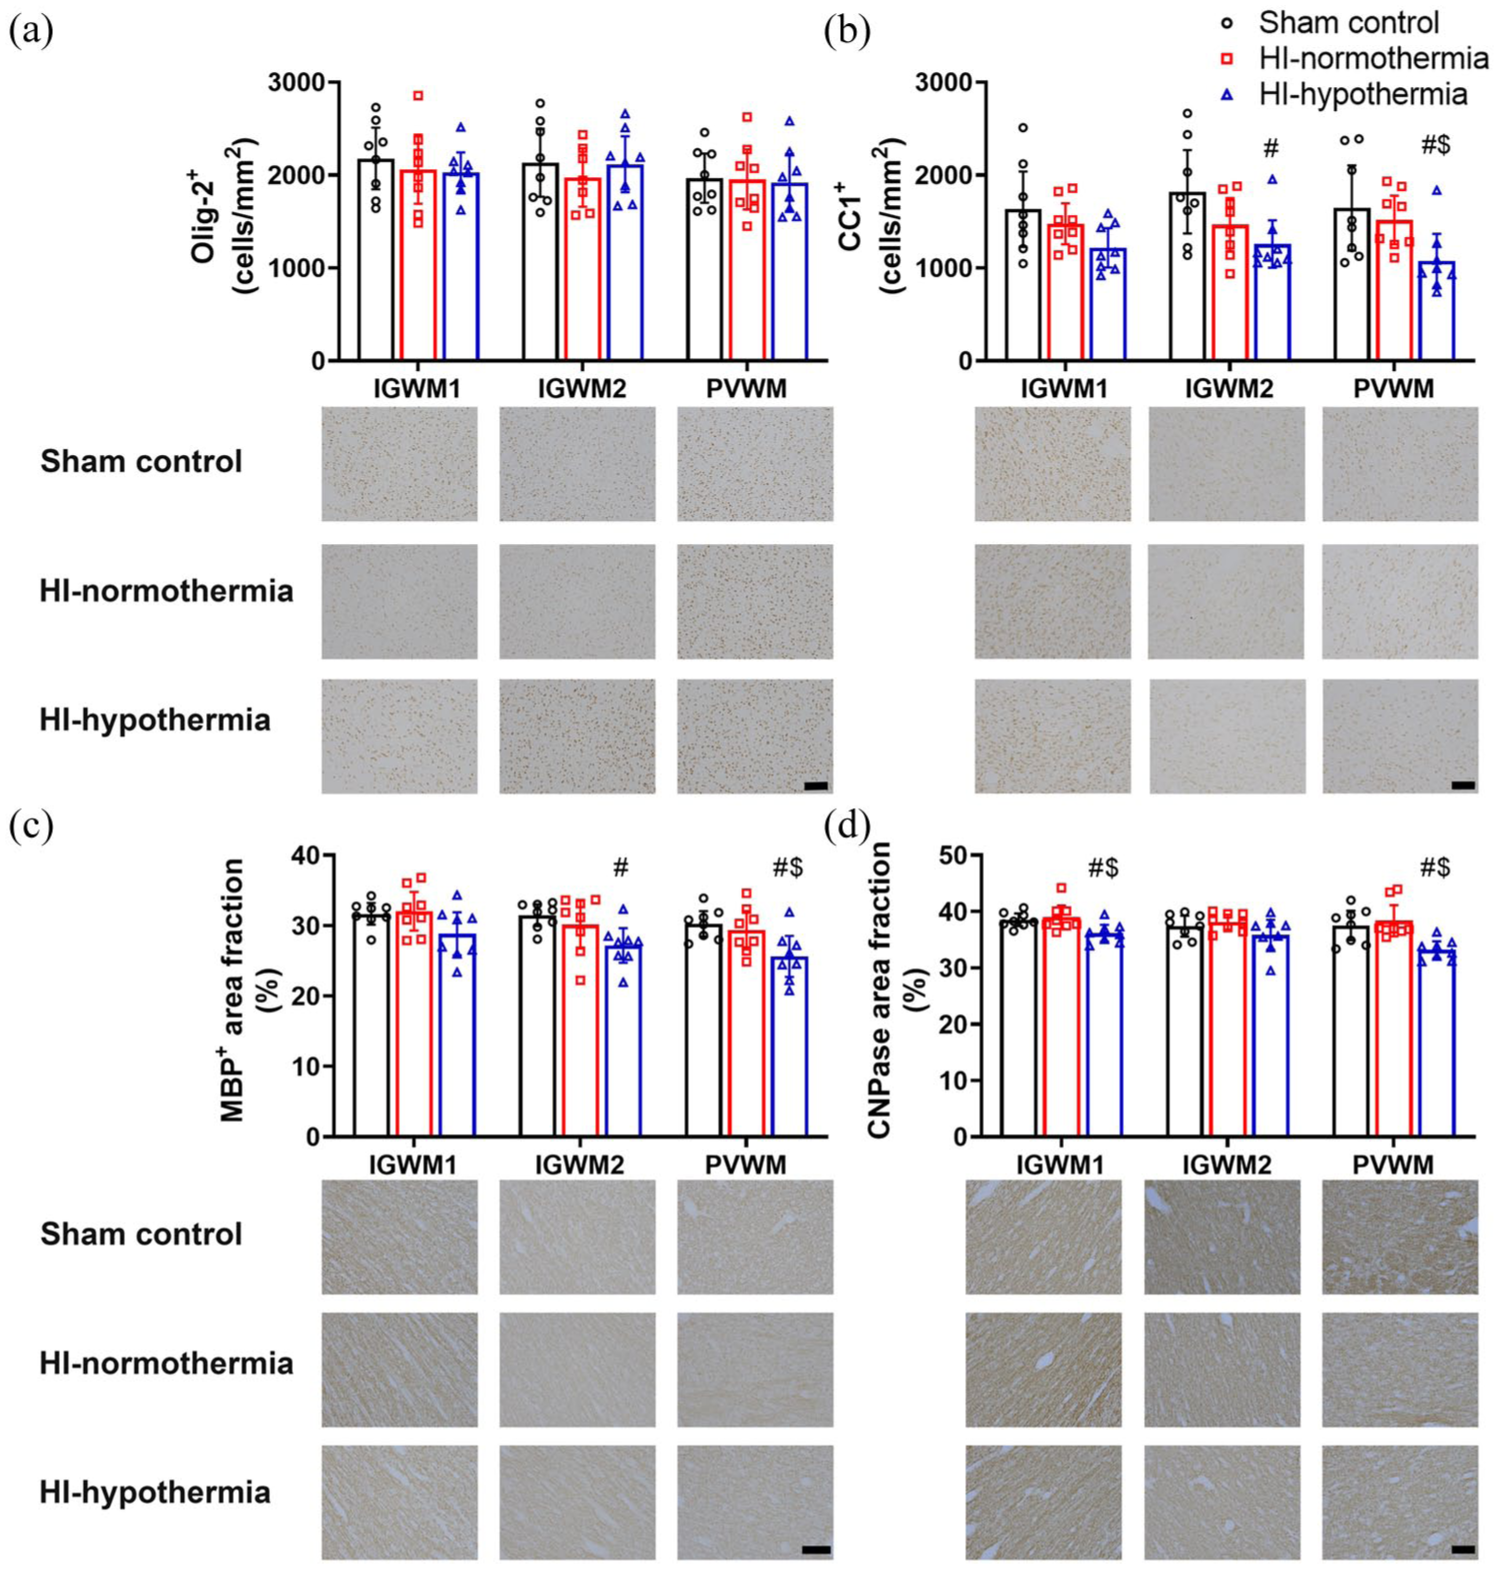
Olig-2+ and CC1+ oligodendrocytes and MBP+ and CNPase+ area fraction within the IGWM and PVWM tracts 7 days after 10 min of HI in sham control, HI-normothermia, and HI-hypothermia groups: (a) number of Olig-2+ cells within the IGWM1, IGWM2, and PVWM and representative photomicrographs, (b) number of CC1+ oligodendrocytes within the IGWM1, IGWM2, and PVWM and representative photomicrographs, (c) area fraction of MBP+ within the IGWM1, IGWM2, and PVWM and representative photomicrographs, and (d) area fraction of CNPase+ within the IGWM1, IGWM2, and PVWM and representative photomicrographs. Scale bars = 100 µm. Sham control, n = 8, HI-normothermia n = 8, HI-hypothermia n = 8. Data are mean ± 95% confidence intervals.
There was no significant difference in the number of microglia between groups (IGWM1 p = 0.614, IGWM2 p = 0.260, PVWM p = 0.939; Figure 7). Hypothermia was associated with a significant reduction in the number of astrocytes in the IGWM1, IGWM2, and PVWM compared with HI-normothermia and IGWM1, IGWM2 compared with sham control (HI-hypothermia vs sham control IGWM1 p = 0.014, IGWM2 p = 0.005, vs HI-normothermia IGWM1 p = 0.008, IGWM2 p = 0.005, PVWM p = 0.012). There was no significant difference in the area fraction of GFAP between groups (IGWM1 p = 0.176, IGWM2 p = 0.064, and PVWM p = 0.154).
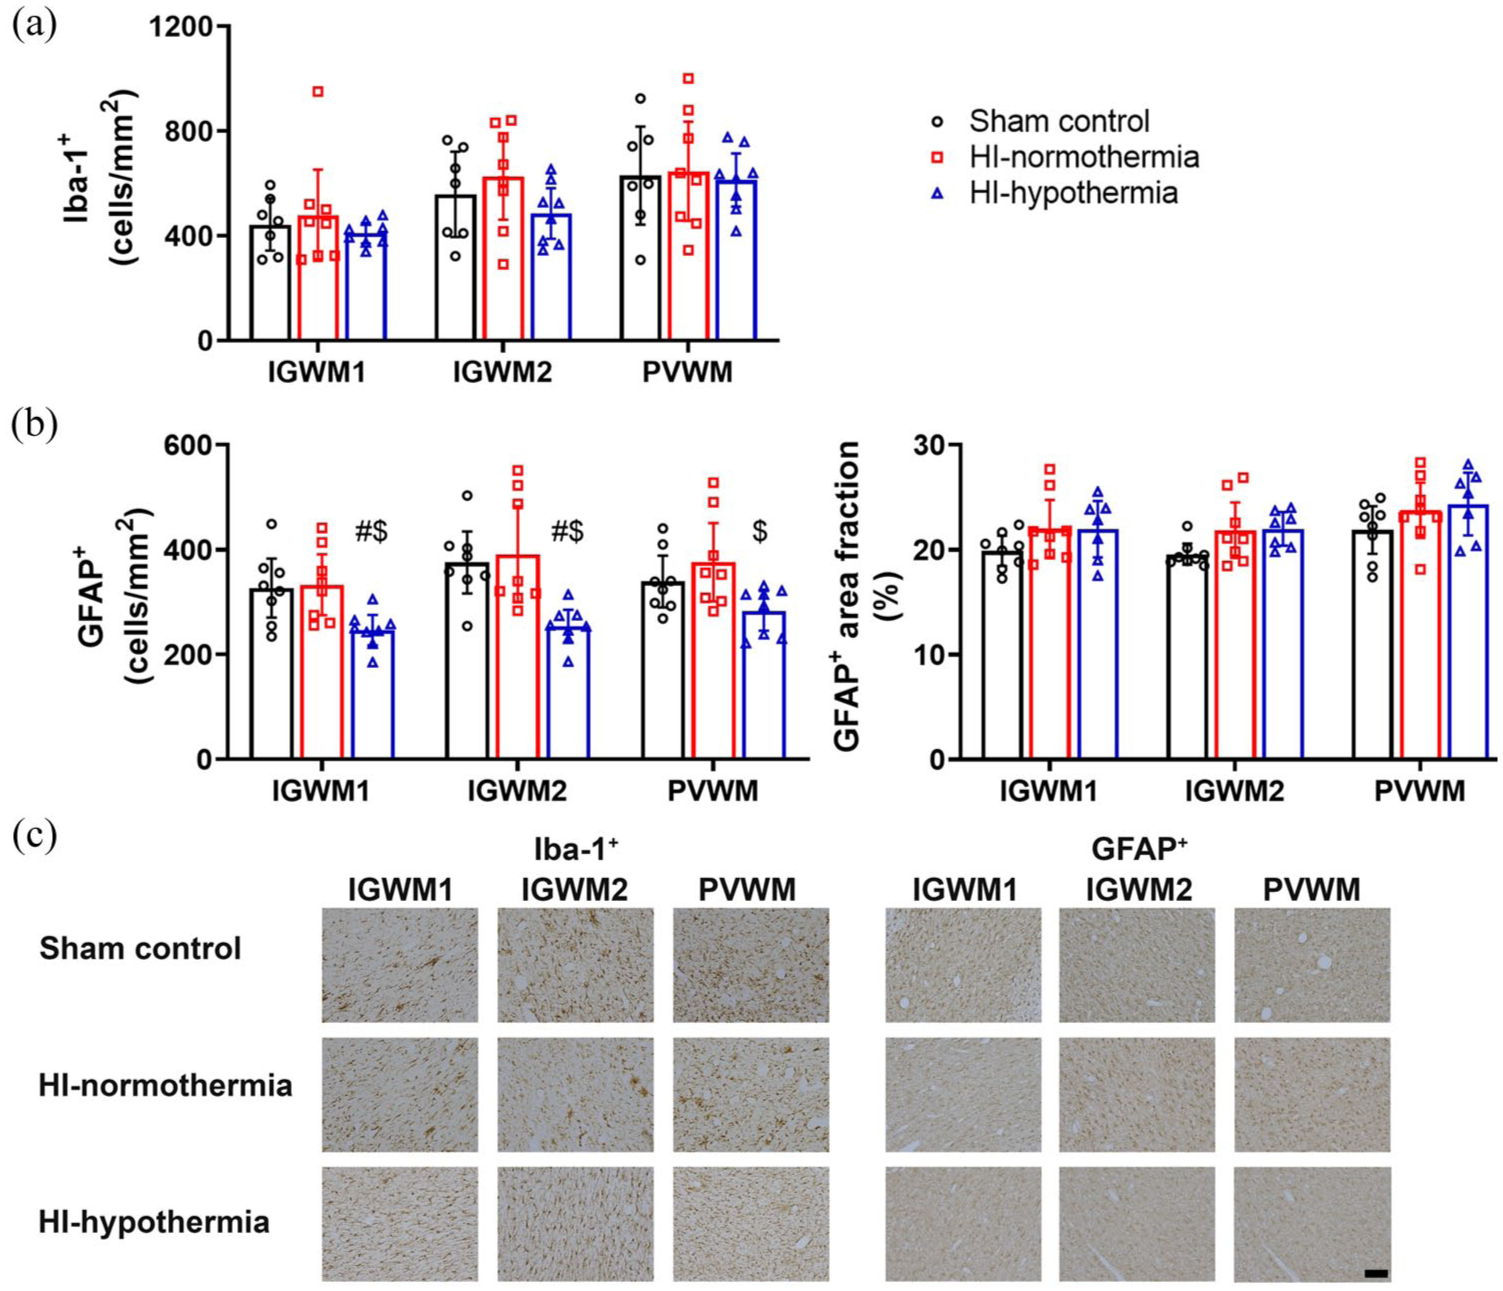
Iba-1+ microglia and GFAP+ astrocytes within the IGWM and PVWM tracts 7 days after 10 min of HI in sham control, HI-normothermia, and HI-hypothermia groups: (a) number of Iba-1+ cells within the IGWM1, IGWM2, and PVWM, (b) number of GFAP+ cells (left) and area fraction of GFAP+ (right) within the IGWM1, IGWM2, and PVWM, and (c) representative photomicrographs of Iba-1+ microglia and GFAP+ astrocytes in the IGWM1, IGWM2, and PVWM). Scale bar = 100 µm. Sham control, n = 8, HI-normothermia n = 8, and HI-hypothermia n = 8. Data are mean ± 95% confidence intervals.
Discussion
The original randomized control trials of therapeutic hypothermia largely excluded infants with mild HIE because of the perceived low risk of adverse outcomes, based on historical evidence that used multimodal assessment over at least 48–78 h. 24 We now know that mild HIE as assessed within the first 6 h of life is associated with significant risk of adverse neurodevelopmental outcomes including death, disability, and brain injury. 1 The current study demonstrates that a clinical protocol of head cooling starting 6 h after HI and continued for 72 h, significantly improved neuronal survival and reduced microglial counts within the hippocampus. Hypothermia had no significant effect on the speed of EEG recovery or seizure count or burden. Interestingly, during the cooling period, hypothermia increased the spectral edge frequency, predominantly due to a decreased proportion of delta and increased proportion of theta and alpha activity. Overall, this suggests that hypothermia for 72 h is significantly neuroprotective when started within 6 h after mild HI.
In the present study, mild HI was associated with an immediate decrease in EEG power. This is a well-established neuroprotective response to HI mediated by the release of endogenous neuromodulators including noradrenaline and endogenous neurosteroids.25,26 This suppression of EEG power was transient, with recovery to sham control levels by 78 h after HI. This is consistent with the insult being relatively mild, and is in contrast to the sustained reduction in EEG power that remains evident at 7 days after 30 min of cerebral ischemia.27,28
As well as reduced overall EEG power, mild HI was also associated with a transient redistribution of the proportions of delta, theta, alpha, and beta frequency activity. Interestingly, immediately after HI there was an increase in the proportion of alpha and theta activity accompanied by a decrease in delta and beta activity. This is not seen after 30 min of cerebral ischemia. 28 From 3 h after HI, there was a prolonged increase in the proportion of delta activity, while the proportions of theta, alpha, and beta activity were decreased after HI-normothermia compared with sham controls. Similar changes in EEG activity have also been reported in infants with mild HIE within the first 6 h of birth, 29 and combined with the current results suggests that changes in EEG could be a promising avenue for the development of a biomarker to identify infants who have been exposed to mild HI.
Induction of hypothermia resulted in a significant and rapid increase in the spectral edge frequency compared with HI-normothermia, mediated by a reduced proportion of delta activity and increased theta, alpha, and beta activity compared with normothermia. Unexpectedly, the spectral edge frequency during hypothermia increased above sham controls, largely because of this increase in the proportion of alpha activity. By contrast, this did not occur during hypothermia following 30 min of cerebral ischemia. 28 In part, differences are likely due to the greater proportion of residual EEG activity following mild HI compared with after severe HI, suggesting that there may be differences in the response to hypothermia depending on the severity of the initial HI insult.
Seizures developed in several fetuses in both mild HI groups (4/7 in HI-normothermia and 3/7 in HI-hypothermia group). These seizures were brief, and the overall seizure burden was low. Although seizures are commonly associated with more severe HIE, seizures are increasingly being detected in infants with mild HIE.30–33 For example, a recent retrospective cohort study of infants with mild HIE treated with hypothermia, found that 21% of infants had seizures, particularly in infants with depressed EEG activity. 34 A striking finding in the present study was that some seizures began within the first 6 h after HI, earlier than the typical onset at 6–8 h after 30 min of cerebral ischemia.27,28 Speculatively, given that EEG activity recovered much faster after mild HI than a more severe insult, reduction of endogenous neuroinhibition may have allowed greater susceptibility to seizures in the hours shortly after mild HI. Hypothermia did not reduce the seizure count or burden, likely due to the overall low seizure incidence and, of course, the fact that many seizures occurred before the initiation of treatment.
At the onset of hypothermia, there was a transient increase in FHR, without any significant changes in CaBF or MABP. Interestingly, hypothermia was also associated with transiently increased nuchal EMG; most likely reflecting fetal shivering. We have previously reported that there is no change in nuchal movement during hypothermia after 30 min of severe HI.35,36 This likely reflects the more extensive damage throughout the brain, including to areas involved in movement such as the cortex and thalamus or potentially thermoregulatory centers such as the hypothalamus, compared with the very selective hippocampal injury in the current study. Although shivering per se is not harmful, the perceived discomfort associated with it may result in infants who have had a milder HI insult, being more likely to receive sedatives and analgesics to reduce shivering; a potential issue that has been raised for treating infants with mild HIE with hypothermia.15,37
In the current study hippocampal neuronal loss was markedly reduced with hypothermia. Further, microglial induction within the hippocampus was essentially abolished, consistent with reduced neuroinflammation. Excitingly, this suggests that hypothermia can reduce hippocampal injury after mild HI. The selective injury after mild HI within the hippocampus and not within the cortex is consistent with an earlier report 17 and in near-term fetal sheep following 10 min of umbilical cord occlusion, 38 and other experimental paradigms. 39 In part, the hippocampus may be more vulnerable due to a faster rate of the evolution of injury than within the cortex,40,41 and potentially with a recovery period of longer than 1 week after HI cortical injury may be observed. 42
Within the white matter, mild HI was not associated with changes in the loss of oligodendrocytes or expression of myelin associated proteins. Surprisingly, hypothermia was associated with a significant reduction in the number of mature oligodendrocytes and consequently a reduction in the expression of myelin associated proteins. This is in direct contrast to numerous studies that have shown that hypothermia improves the maturation of oligodendrocytes and expression of myelination when administered after a more severe HI insult,43–45 although this in part is due to hypothermia reducing the loss of total oligodendrocytes in the first instance. It is plausible that rather than causing overt cellular injury, hypothermia is merely inducing a transient delay in the maturation of oligodendrocytes and therefore myelination. Establishing the long-term consequences of hypothermia on white matter maturation and myelination in future studies will be critical to ensuring the safety of hypothermia for use after mild HI.
In line with the clinical protocol for the treatment of moderate-severe HIE, in the present study hypothermia was continued for 72 h. Preclinical evidence in the near-term fetal sheep following 30 min of HI, suggests that hypothermia for shorter than 72 h is associated with impaired recovery of EEG power, neuronal survival, myelin basic protein, and more microglia in the white matter and cortex.36,46 Speculatively, it is possible but not established that after milder HI, the optimal duration of hypothermia for neuroprotection may be less, and potentially hypothermia will have the same neuroprotective effects without causing delayed maturation within the white matter. Thus, it will be important in future studies to investigate whether a shorter duration of hypothermia might provide similar neuroprotection. Interestingly, the idea that potentially a shorter period of hypothermia would be sufficient for the treatment of mild HIE, has already been incorporated into the design of clinical trials, and indeed the second cohort of the COMET trial (NCT03409770) aims to investigate if 48 h of hypothermia is sufficient to reduce the risk of death and disability in infants with mild HIE. 47 Although it should be noted that substantially early cessation of hypothermia due to apparent improvement in infants with mild HIE (median time 9 h) has been associated with residual brain injury and long term neurodevelopmental outcome. 48 Therefore, it is critical that we develop a strong evidence base for the optimal duration for treatment with hypothermia after milder HI injury.
Promisingly, the current study suggests that there may be a longer window of opportunity for successful intervention with hypothermia after mild HI, as we showed robust neuroprotection when hypothermia was started 6 h after HI. Previous studies in the near-term fetal sheep exposed to severe HI, have shown when hypothermia is delayed beyond 6 h there is no improvement in EEG recovery or cortical neuronal loss compared with the initiation of hypothermia earlier.20,21,49 Consistent with our findings, there is evidence to suggest that there is an extended latent phase after milder HI insults.17,50 Systematic studies are therefore required to define the therapeutic window of opportunity for hypothermia after mild HI, which is particularly important for the treatment of infants with mild HIE, where symptoms may be difficult to detect within the first few hours of birth. 1
There is speculation that sex could influence the effectiveness of hypothermia,51,52 which the current study was not designed or powered to detect. There is little clinical evidence for a sex difference in response to hypothermia for the treatment of moderate-severe HIE.51–53 There is some evidence in neonatal rodents that females may have greater neuroprotection with hypothermia than males.54,55 However, there is no evidence from studies in large animals using clinically relevant protocols of hypothermia to support the results in rodents, which warrants investigation in a future study. Advantages of preclinical large animal studies include that the timing and severity of the insult are consistent and histological analysis of brain samples are readily available, allowing for systematic detailed analysis of potential therapeutics. However, it is important to note that brain injury in infants with mild HIE appears to be highly variable.56,57 Some of this variability may be due to the differences in the timing of MRI examination and differences in scoring protocols. 58 However, is likely that much of it reflects a genuine range of injury in infants currently being diagnosed with mild HIE. In the era of hypothermia where a diagnosis is required rapidly after birth, infants with a slower evolution of encephalopathy may present with mild HIE in the first 6 h but develop moderate HIE later. 1 Clinical studies suggest the frequency of overt lesions on MRI after mild HIE is between 20% and 60%.6,11,31,59 Predominantly, injury in infants with mild HIE appears to be in white matter and watershed regions,2,6,12 with basal ganglia–thalamic injury more common in infants with severe HIE. 60 In contrast, a recent retrospective cohort study of 142 infants with mild HIE found that deep gray matter injury was almost as common as watershed injury (20% vs 23%). 57 The implication of this finding is that some infants with mild HIE actually have injury more consistent with moderate-severe HIE although not presenting as such within the diagnostic window. 61 This highlights the complexity of finding treatments for infants with mild HIE and suggests a need for clinical markers to more accurately determine the severity and stage of evolution of mild HIE. 62
In summary, the present study shows that delayed hypothermia after a single period of mild HI significantly improved neuronal survival and reduced microglial induction within the hippocampus. However, hypothermia may result in delayed or impaired white matter maturation and myelination, which needs to be further investigated. These results support the potential for benefit with established clinical protocols for hypothermia after mild HI.
Supplemental Material
sj-docx-1-jcb-10.1177_0271678X261456876 – Supplemental material for Neuroprotection with delayed maturation of oligodendrocytes after therapeutic hypothermia for mild cerebral ischemia in near-term fetal sheep
Supplemental material, sj-docx-1-jcb-10.1177_0271678X261456876 for Neuroprotection with delayed maturation of oligodendrocytes after therapeutic hypothermia for mild cerebral ischemia in near-term fetal sheep by Alice McDouall, Guido Wassink, Kelly Q Zhou, Simerdeep K Dhillon, Mia Wong, Jemima Jordaan, Malcolm Battin, Laura Bennet, Alistair J Gunn and Joanne O Davidson in Journal of Cerebral Blood Flow & Metabolism
Footnotes
Author contributions
JOD, AJG, and LB contributed to the conception and design of the study. AM, GW, KQZ, SKD, and JOD contributed to the acquisition of data. AM, MW, and JJ contributed to the analysis and interpretation of data. AM, JOD, MB, and AJG contributed to the interpretation of data and drafting of the article. All authors revised the article and approved the final version. All authors contributed to drafting and revising the article and approved the final version.
Funding
The authors disclosed receipt of the following financial support for the research, authorship, and/or publication of this article: This work was supported by The Health Research Council of New Zealand (18/225). AM held a scholarship from the Neurological Foundation.
Declaration of conflicting interests
The authors declared no potential conflicts of interest with respect to the research, authorship, and/or publication of this article.
Supplemental material
Supplemental material for this article is available online.
References
Supplementary Material
Please find the following supplemental material available below.
For Open Access articles published under a Creative Commons License, all supplemental material carries the same license as the article it is associated with.
For non-Open Access articles published, all supplemental material carries a non-exclusive license, and permission requests for re-use of supplemental material or any part of supplemental material shall be sent directly to the copyright owner as specified in the copyright notice associated with the article.