
Abstract
Remote ischemic conditioning (RIC) mitigates ischemic injury through transient, repetitive vascular occlusion in a limb distant from the injury site. Although its protective effects are recognized, the underlying mechanisms remain incompletely understood. This study investigated the metabolic and inflammatory changes induced by RIC to identify novel cytoprotective targets. We used a mouse model of transient focal cerebral ischemia induced by 60-min occlusion of the distal middle cerebral artery. Two RIC protocols were applied: remote ischemic perconditioning (RIPerC), consisting of three cycles of 5-min hindlimb ischemia followed by 5-min reperfusion during ischemia, and remote ischemic postconditioning (RIPostC), applied after reperfusion. Plasma cytokines were quantified using a multiplex assay, and metabolomic profiles of plasma and brain samples were analyzed by untargeted liquid chromatography–mass spectrometry (LC–MS). Data were evaluated with univariate and multivariate statistical methods. RIC induced moderate changes in the brain metabolome but significantly increased three plasma metabolites: Cer (42:3), HexCer (36:1), and TG (28:0), suggesting systemic metabolic modulation during ischemia-reperfusion. Both RIPerC and RIPostC conferred neuroprotection, likely through regulation of peripheral immune responses. These findings demonstrate that RIPerC and RIPostC protect against ischemic injury by modulating inflammatory and metabolic pathways in systemic circulation and brain, providing insights into ischemic tolerance and biomarker discovery.
Introduction
Ischemic conditioning is a potential neuroprotective therapeutic strategy that involves brief, repeated episodes of ischemia and reperfusion, which can confer protection against subsequent prolonged ischemic insults, such as those occurring during cerebral ischemia. 1 Among its variants, remote ischemic conditioning (RIC), in which ischemia is applied to a limb or other distant organ, has garnered particular interest due to its noninvasive nature and systemic protective effects. 2 In the case of cerebral ischemia, where rapid restoration of blood flow is crucial to limiting irreversible neuronal damage, ischemic conditioning holds potential as a complementary approach to existing treatments.3,4 RIC has been studied both as a perconditioning approach, applied during ischemia (RIPerC), and as a postconditioning therapy, initiated after ischemic period has ended (RIPostC), demonstrating potential to reduce infarct size and improve neurological outcomes.4,5 However, the precise mechanisms through which this protective effect is mediated remain incompletely understood, and further investigation is required to fully elucidate its potential clinical applications.3,4
A growing body of evidence underscores the central role of inflammation and immune responses in the pathophysiology of stroke.6–8 Following cerebral ischemia, activation of resident microglia and infiltration of peripheral immune cells contribute to secondary injury through the release of pro-inflammatory cytokines and chemokines.9,10 Among these, interleukins such as IL-1β, IL-6, and IL-17, as well as TNF-α, have been implicated in promoting blood-brain barrier disruption, leukocytes recruitment, and neurotoxicity.9–11 Conversely, regulatory cytokines like IL-10 may mediate neuroprotection. Experimental studies suggest that both RIPerC and RIPostC can modulate these immune pathways. However, the dynamics of peripheral immune responses and their contribution to neuroprotection remain insufficiently characterized.
In parallel, stroke induces profound metabolic alterations in both the brain and peripheral compartments, including disruptions in glycolysis, mitochondrial respiration, amino acid metabolism and oxidative stress pathways, particularly the glutathione redox system.12–15 These metabolic changes not only reflect tissue damage but may also actively shape immune responses and influence stroke outcomes. Despite these advances, a comprehensive understanding of the metabolic mechanisms underlying both local and remote protection remains lacking.
In this study, we hypothesized that RIC confers neuroprotection after stroke by modulating both systemic inflammation and metabolic profile changes. Using a preclinical mouse model of ischemic stroke, we evaluated the effects of RIPerC and RIPostC on inflammatory cytokines and metabolic pathways in both plasma and brain tissue. This integrative approach seeks to delineate the molecular landscape underlying ischemic tolerance and to inform the development of future therapeutic strategies.
Materials and methods
A more detailed description of the methods used in this study is available in the Supplementary Methods.
Mouse strain and ethical procedures
This study was conducted with the approval of the ethical committee of the University of Lleida (CEEA 02-02/20) and adhered to the “Principles of Laboratory Animal Care” (NIH). All animal procedures comply with the ARRIVE guidelines. Male CD1 mice, aged 2–4 months, were bred in-house and maintained in groups of two to five before being separated into individual cages post-surgery. They were housed at 22 °C ± 2 °C with a 12-h light/dark cycle and provided ad libitum access to a standard diet (Teklad Global 14% Protein rodent maintenance diet; Envigo, Madison, WI, USA) and water.
Brain ischemia: Focal transient middle cerebral artery occlusion
Mice were anesthetized using isoflurane (IsoFlo, #71002EU; Zoetis, Madrid, Spain) administered via facemask (5% for induction, 2% for maintenance). Body temperature was monitored and maintained at 37.0 °C ± 0.5 °C using a thermal blanket. After placing the mice in a stereotaxic apparatus (SAS-4100; ASI-Instruments, Warren, MI, USA), a skin incision was made between the right eye and ear. The temporalis muscle was dissected until the temporal bone was visible. The middle cerebral artery (MCA) was located, and a hole was drilled into the skull (Ideal Micro Drill; CellPoint Scientific, Gaithersburg, MD, USA) under saline cooling. A flexible laser Doppler fiber (moorVMS-LDF1; Moor Instruments, Devon, UK) was used to continuously monitor regional cerebral blood flow (rCBF). A glass capillary compressed the MCA for 60 min, achieving a steady rCBF decrease to below 75%–80% of baseline. After occlusion, blood flow was restored by carefully removing the capillary. Mice exhibiting rCBF levels above 80% of baseline post-recanalization were excluded from the study. Animals recovered individually after surgical closure until euthanasia.5,16
Experimental groups
Mice were allocated to four experimental groups: Sham, Stroke, Stroke + RIPerC, and Stroke + RIPostC. The Sham group underwent the surgical procedure without MCA occlusion. The Stroke group was subjected to 60 min of tMCAo followed by 72 h of reperfusion. The Stroke + RIPerC group received RIPerC, consisting of three cycles of 5 min of limb ischemia followed by 5 min of reperfusion, initiated 15 min after the onset of tMCAo (during the ischemic period). The Stroke + RIPostC group received RIPostC, consisting of three cycles of 5 min of limb ischemia followed by 5 min of reperfusion, starting 10 min after the onset of reperfusion.
A dedicated RIC-only control group (without tMCAO) was not included, consequently, systemic effects of RIC independent of ischemia were not directly assessed.
Limb remote ischemic conditioning (LRIC)
LRIC involved three cycles of right hind limb ischemia for 5 min, using an elastic band to induce limb pallor, followed by 5 min of reperfusion. Procedures were conducted on anesthetized mice using 2% isoflurane. Limb ischemia was confirmed by skin color changes and temperature reduction, with the skin returning to pink and temperature normalizing after reperfusion.
Multiplex cytokine analysis
Blood samples were collected at several time points: baseline (before surgery), immediately postsurgery (after RIPerC or RIPerC), 6, 24, 48, and 72 h post-tMCAo via submandibular puncture into EDTA collection tubes (#16.444, Microvette CB300 EDTA; Sarstedt, Nümbrecht, Germany). Samples were centrifuged at 10,000g for 5 min at room temperature and stored at −80 °C until analysis.
Mouse High Sensitivity T Cell Magnetic Bead kits (MHSTCMAG-70KPMX; EMD Millipore, Burlington, MA, USA) were employed to quantify 18 different cytokines across four categories (pro-inflammatory, anti-inflammatory, chemokines, and growth factors). Following pre-wetting of plates, 50 µL of each standard and control were added. A total of 50 µL of serum matrix, 25 µL of assay buffer, and 25 µL of diluted sample were added to the sample wells. Pre-combined beads were introduced, and the plates were incubated overnight at 4 °C. Subsequent washing steps were followed by the addition of detection antibodies and streptavidin-phycoerythrin. Samples were read using a MAGPIX instrument (Luminex, Austin, TX, USA), with data analyzed using MILLIPLEX Analyte 5.1 software. Cytokine concentrations were expressed in pg/mL.
Non-targeted metabolomics and lipidomics analysis
Plasma samples were collected at three time points: baseline, 6, and 72 h post-tMCAo. Brain samples were collected from both the ipsilateral (stroke-affected) and contralateral hemispheres. To account for potential edema and hemispheric asymmetry after ischemia, tissue sampling was performed using consistent stereotactic landmarks, and coronal slices were matched across animals to ensure reproducibility. Brains were sectioned into serial 2 mm coronal slices using a chilled brain mat and razor blade. For each animal, predefined regions were dissected using microtome blades under a stereomicroscope. Tissue punches (e.g. 1–2 mm diameter) were obtained from corresponding locations in both hemispheres. The infarct core and penumbra were identified macroscopically based on pallor and tissue softening, and punches were limited to these zones to avoid sampling bias due to uneven edema. Samples were immediately flash-frozen in liquid nitrogen, and stored at −80 °C. Both plasma and brain samples underwent randomization prior to extraction. Contralateral tissue was used as a within-animal reference rather than an unaffected control, and all results are interpreted as relative hemispheric differences within a globally responsive post-ischemic brain.
Brain tissue (± 25 mg) was homogenized in a buffer containing 180 mM KCl, 5 mM MOPS, 2 mM EDTA, and 1 mM DTPA at pH 7.4, supplemented with BHT and protease and phosphatase inhibitors. Protein concentration was assessed using the Bradford method. Metabolite extraction followed the same protocol for plasma samples.
Analytical instruments
Non-targeted metabolomic and lipidomic profiling was conducted using an Agilent 1290 LC system coupled to an ESI-Q-TOF-MS/MS 6520 mass spectrometer (Agilent Technologies, Barcelona, Spain). Metabolite identities were confirmed by mass, retention time, isotopic distribution, and/or MS/MS spectra using databases like the Human Metabolome Database (HMDB) and LipidMatch. 17
For metabolomic analysis, plasma extraction involved adding cold methanol containing BHT and phenylalanine-C13 as an internal standard, followed by incubation and centrifugation. The resulting supernatant was filtered and prepared for analysis using an LC system with a Zorbax SB-Aq column. Data collection was performed using MassHunter Data Analysis Software.
For lipidomic analysis, 5 µL of miliQ water and 20 µL of methanol were added to 10 µL of plasma to precipitate proteins. Following sonication, the organic phase was separated by centrifugation, and the upper phase was analyzed via mass spectrometry.
Statistical analysis
Omic data were pre-treated by auto-scaling and log transformation. Multivariate statistical analyses were conducted using MetaboAnalyst software 15. Principal component analysis (PCA), partial least squares-discriminant analysis (PLS-DA), hierarchical clustering analysis represented by a heatmap, and Random Forest classification algorithm were performed with MetaboAnalyst. Statistical analysis was conducted using GraphPad Prism (version 9.0.0) for OS X (GraphPad Software, La Jolla, CA, USA). Each animal was considered an independent entity. The number of mice analyzed is indicated in the figure legends for each result. To assess the data distribution, formal normality tests, including the Kolmogorov–Smirnov and Shapiro–Wilk tests, were conducted for all continuous variables prior to performing the main statistical analyses. Non-normally distributed data were analyzed using non-parametric tests. Multiple groups were compared using an analysis of variance (ANOVA) test, with two-way ANOVA applied when two independent variables were present. Post-hoc tests included Dunnett’s and Tukey’s tests. Differences with a p < 0.05 were considered statistically significant. The specific tests used in each experiment, along with n values, are reported in the corresponding figure legends.
Results
Data availability statement
The corresponding author will consider requests for access to the data reported in this article.
Plasma tMCAo related cytokines
The assessment of the cytokine profile in plasma at different periods after tMCAo revealed significant changes in the concentrations of 14 cytokines, chemokines, and growth factors, including GM-CSF, IL-1α, IL-1β, IL-4, IL-5, IL-6, IL-10, IL-12p70, IL-13, IL-17A, KC/CXCL, MCP-1, MIP-2, and TNF-α. Supplementary Table 1 summarizes the main sources and functions of these cytokines and chemokines. Following ischemic stroke, cytokines were classified into two groups based on their temporal roles: the hyperacute phase (immediate hours post-surgery–6 h) and the acute phase (6 h–1 week 18 ; Figure 1).
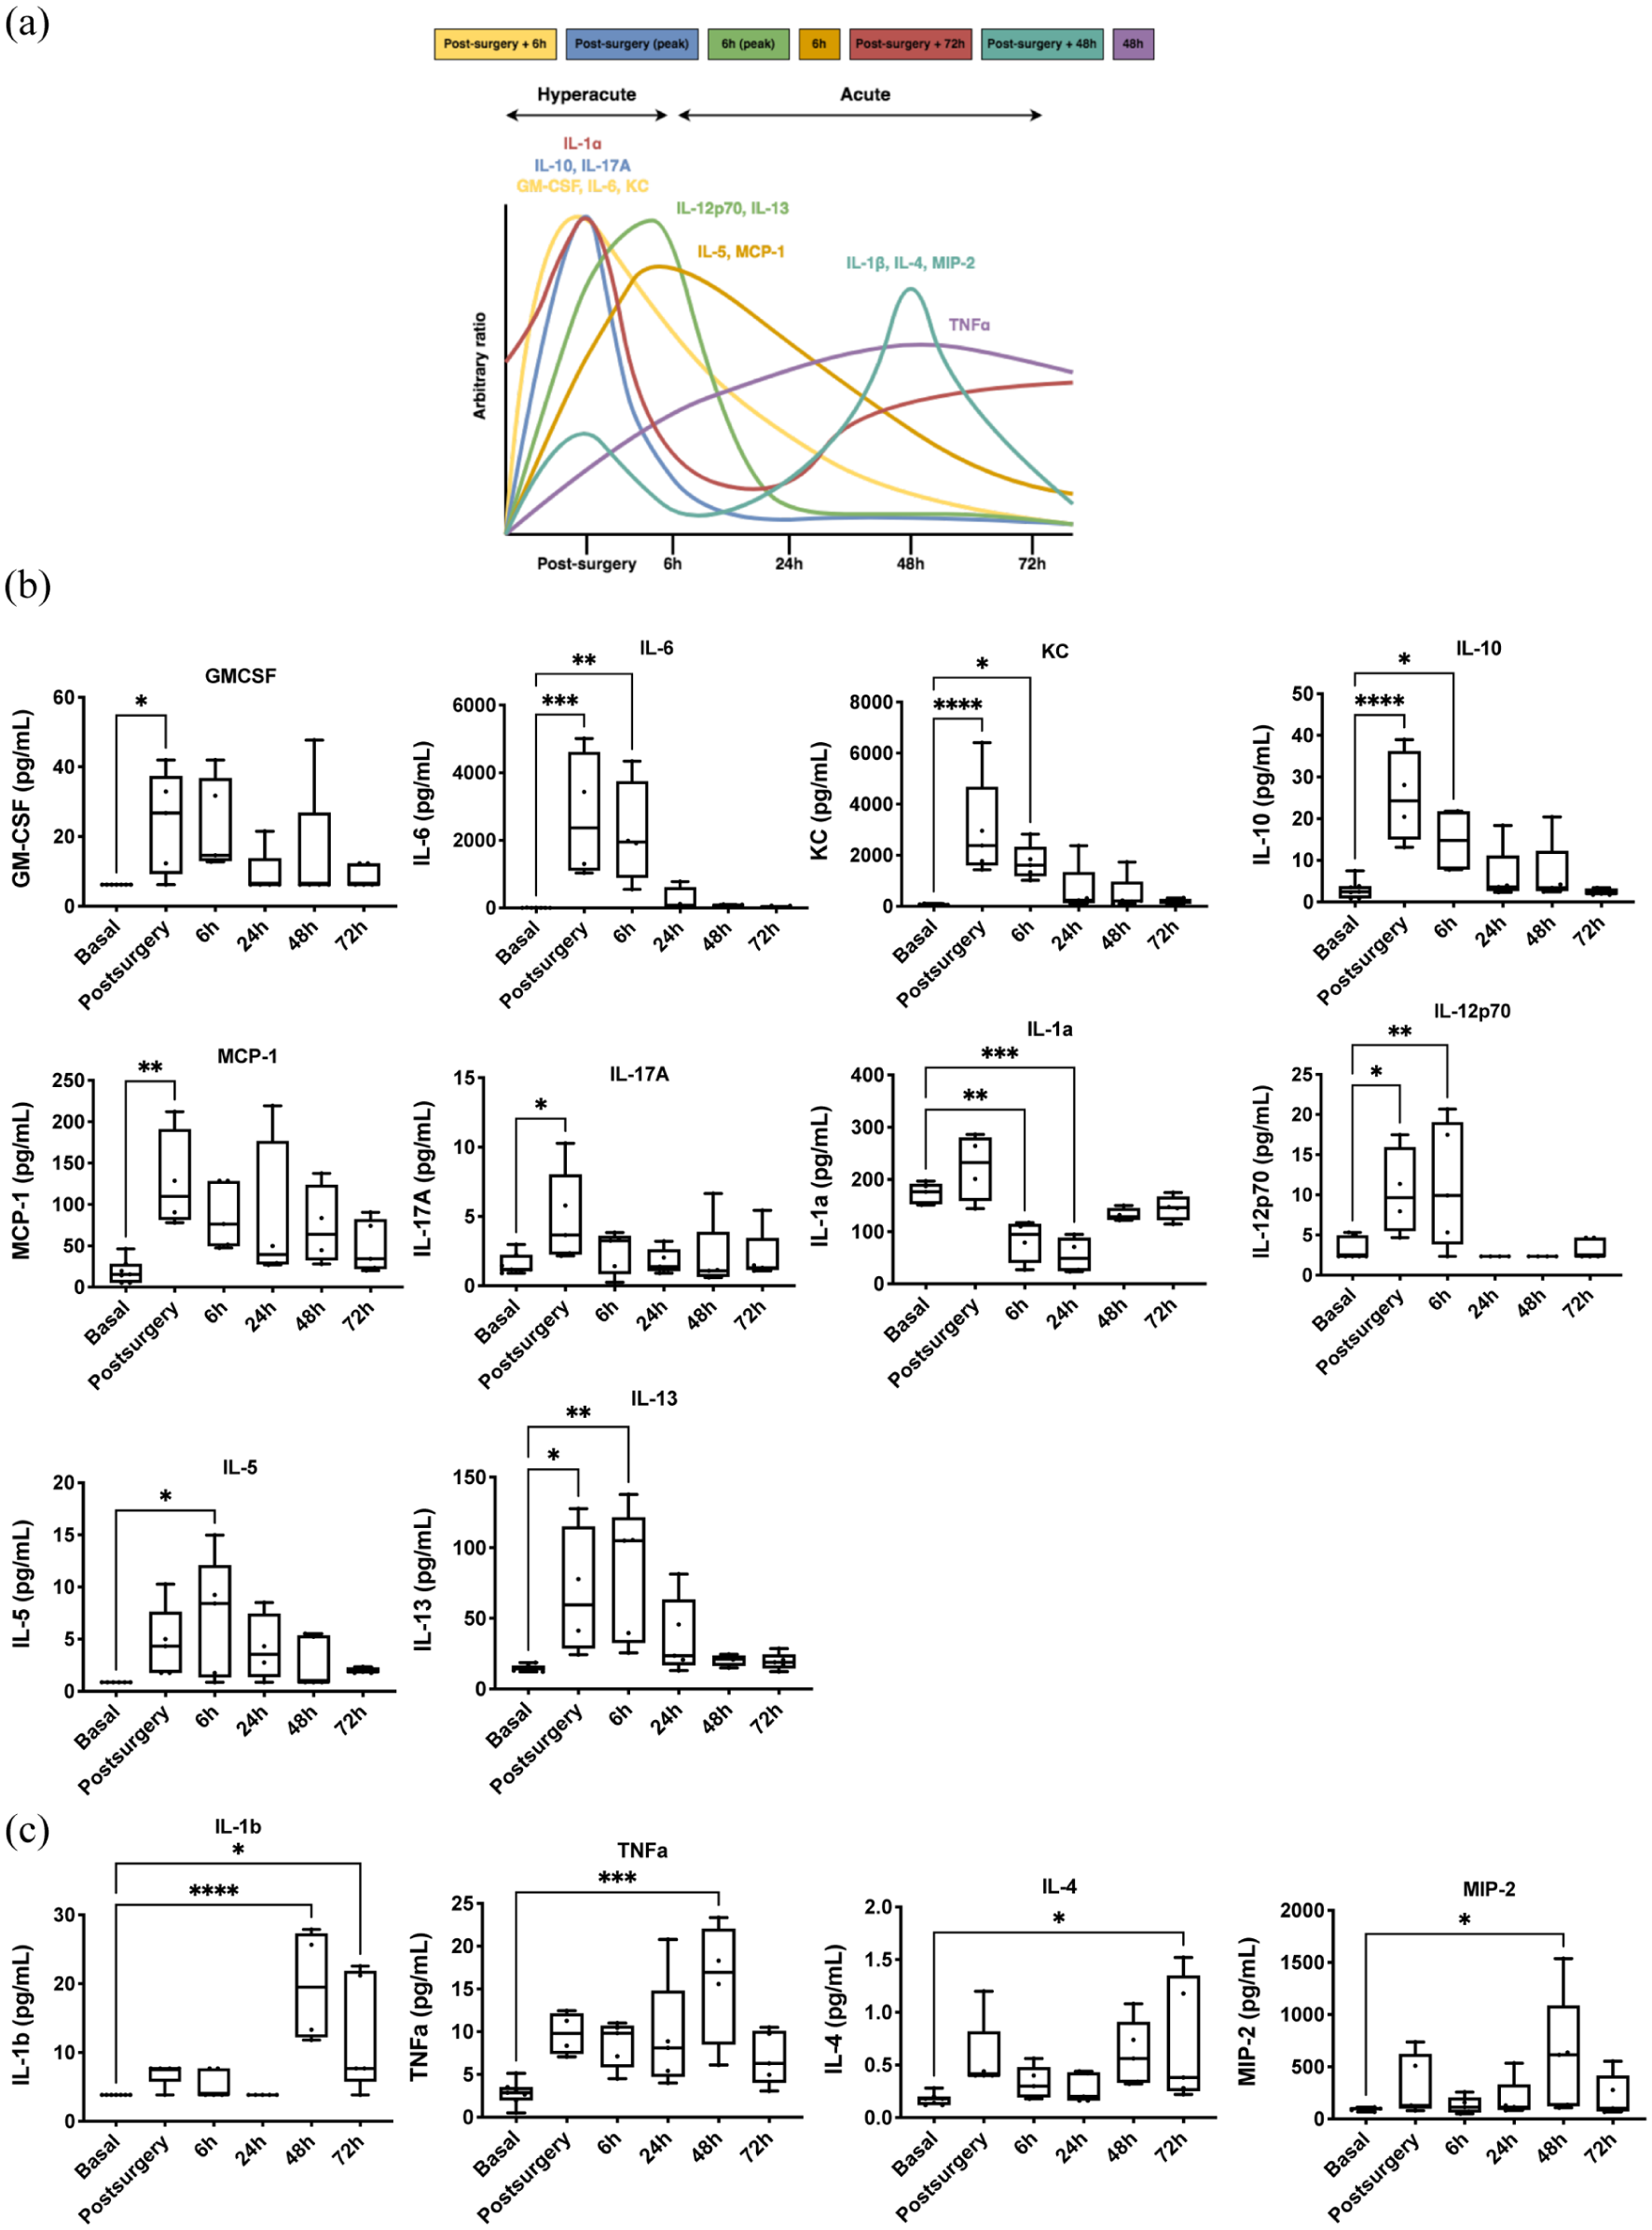
Time-depending cytokine expression profile in tMCAo mice model: (a) time course of expression profile of cytokines, chemokines, and growth factors of ischemic brain damage. Data are presented as relative increases in expression levels on an arbitrary y axis and the peak time of expression after surgery on the x axis. Cytokine, chemokine, and growth factor levels in plasma samples of tMCAo mice model at hyperacute phase (b) and acute phase (c). Expression levels were analyzed at six different times: basal, postsurgery, 6, 24, 48, and 72 h post-surgery. Box and whiskers graph showing min–max range, mean, and all points (n = 4–5 mice/group). One-way ANOVA with Dunnett’s multiple comparison test.
During the hyperacute phase, pro-inflammatory cytokines such as IL-6, IL-17A, and IL-12p70; anti-inflammatory cytokines IL-10 and IL-13; chemokines KC and MCP-1; and growth factors GM-CSF and IL-5 showed increased expression (Figure 1(a)). Conversely, IL-1α levels decreased in this phase. In the acute phase, pro-inflammatory cytokines IL-1β and TNF-α, as well as anti-inflammatory cytokine IL-4 and chemokine MIP-2, exhibited increased expression (Figure 1(b)). No significant differences were observed in plasma levels of IFN-γ, LIX, IL-7, and IL-2.
To determine whether plasma cytokine expression correlates with the time post-stroke, multivariate statistics were applied. Non-supervised principal component analysis (PCA) indicated a distinct plasma cytokine profile over time, explaining up to 55.5% of sample variability (Supplementary Figure 1(a)). Hierarchical clustering, represented by a heat map, further confirmed this time-specific cytokine profile (data not shown). Average cytokine values suggested differing profiles for the hyperacute phase (e.g. post-surgery and 6 h) and the acute phase (24, 48, and 72 h; Supplementary Figure 1(f)). This was corroborated by supervised analysis via partial least squares discriminant analysis (PLS-DA; Supplementary Figure 1(b)). Cross-validation of the PLS-DA model yielded a maximum Q2 of 0.38 and R2 of 0.84 with four components (Supplementary Figure 1(c)). Permutation tests (1000 repeats) indicated a significant p value of 0.036, suggesting the observed statistic was superior to permuted distributions (Supplementary Figure 1(d)). A variable importance projection (VIP) score identified IL-4 and KC as top-ranked features (Supplementary Figure 1(e)). The random forest (RF) classification algorithm showed a classification error of 0.594, particularly high for 6, 48, and 72 h, with KC contributing significantly to classification accuracy (Supplementary Figure 1(h)).
The heatmap (Supplementary Figure 1(f)) confirmed the presence of a time-specific plasma cytokine profile, indicating seven cytokine expression profiles related to stroke onset time. Figure 1(c) illustrates time-dependent cytokine expression profiles, revealing distinct patterns for the hyperacute and acute phases, with further subphases identified. These were classified based on timing as: (i) an early wave of expression at post-surgery followed by a return to baseline (GM-CSF, IL-6, KC; yellow line); (ii) a focal increase at post-surgery (IL-10, IL-17A; blue line); (iii) a peak at post-surgery with reduction from 6 to 24 h, returning to baseline (IL-1α; red line); (iv) a focal increase at 6 h (IL-12p70, IL-13; green line); (v) an expression wave at 6 h returning to baseline (IL-5, MCP-1; orange line); (vi) two expression waves with peaks at post-surgery and 48 h (IL-1β, IL-4, MIP-2; aquamarine line); and (vii) a progressive increase reaching stable expression at 24 h (TNF-α; violet line).
Plasma RIC-related cytokines
The inflammatory profile of remote ischemic conditioning (RIC) in the preclinical tMCAo model was assessed using the same multiplex cytokine panel. Results indicated that both RIC treatments primarily influenced the hyperacute phase post-stroke, particularly during the post-surgery period (Figure 2(a)). At this time, RIPerC and RIPostC significantly reduced levels of IL-12p70, IL-1α, IL-10, IL-13, IL-6, GM-CSF, KC, and MCP-1 compared to the stroke group. At 6 h, RIPerC notably increased anti-inflammatory cytokines IL-10, IL-13, and GM-CSF while decreasing KC levels. RIPostC significantly reduced IL-12p70, IL-2, IL-6, and chemokines LIX and KC. The most notable differences between RIPerC and RIPostC were observed at 6 h, with RIPostC showing decreased levels of IL-13, IL-5, IL-6, and GM-CSF compared to RIPerC (Figure 2(a)).
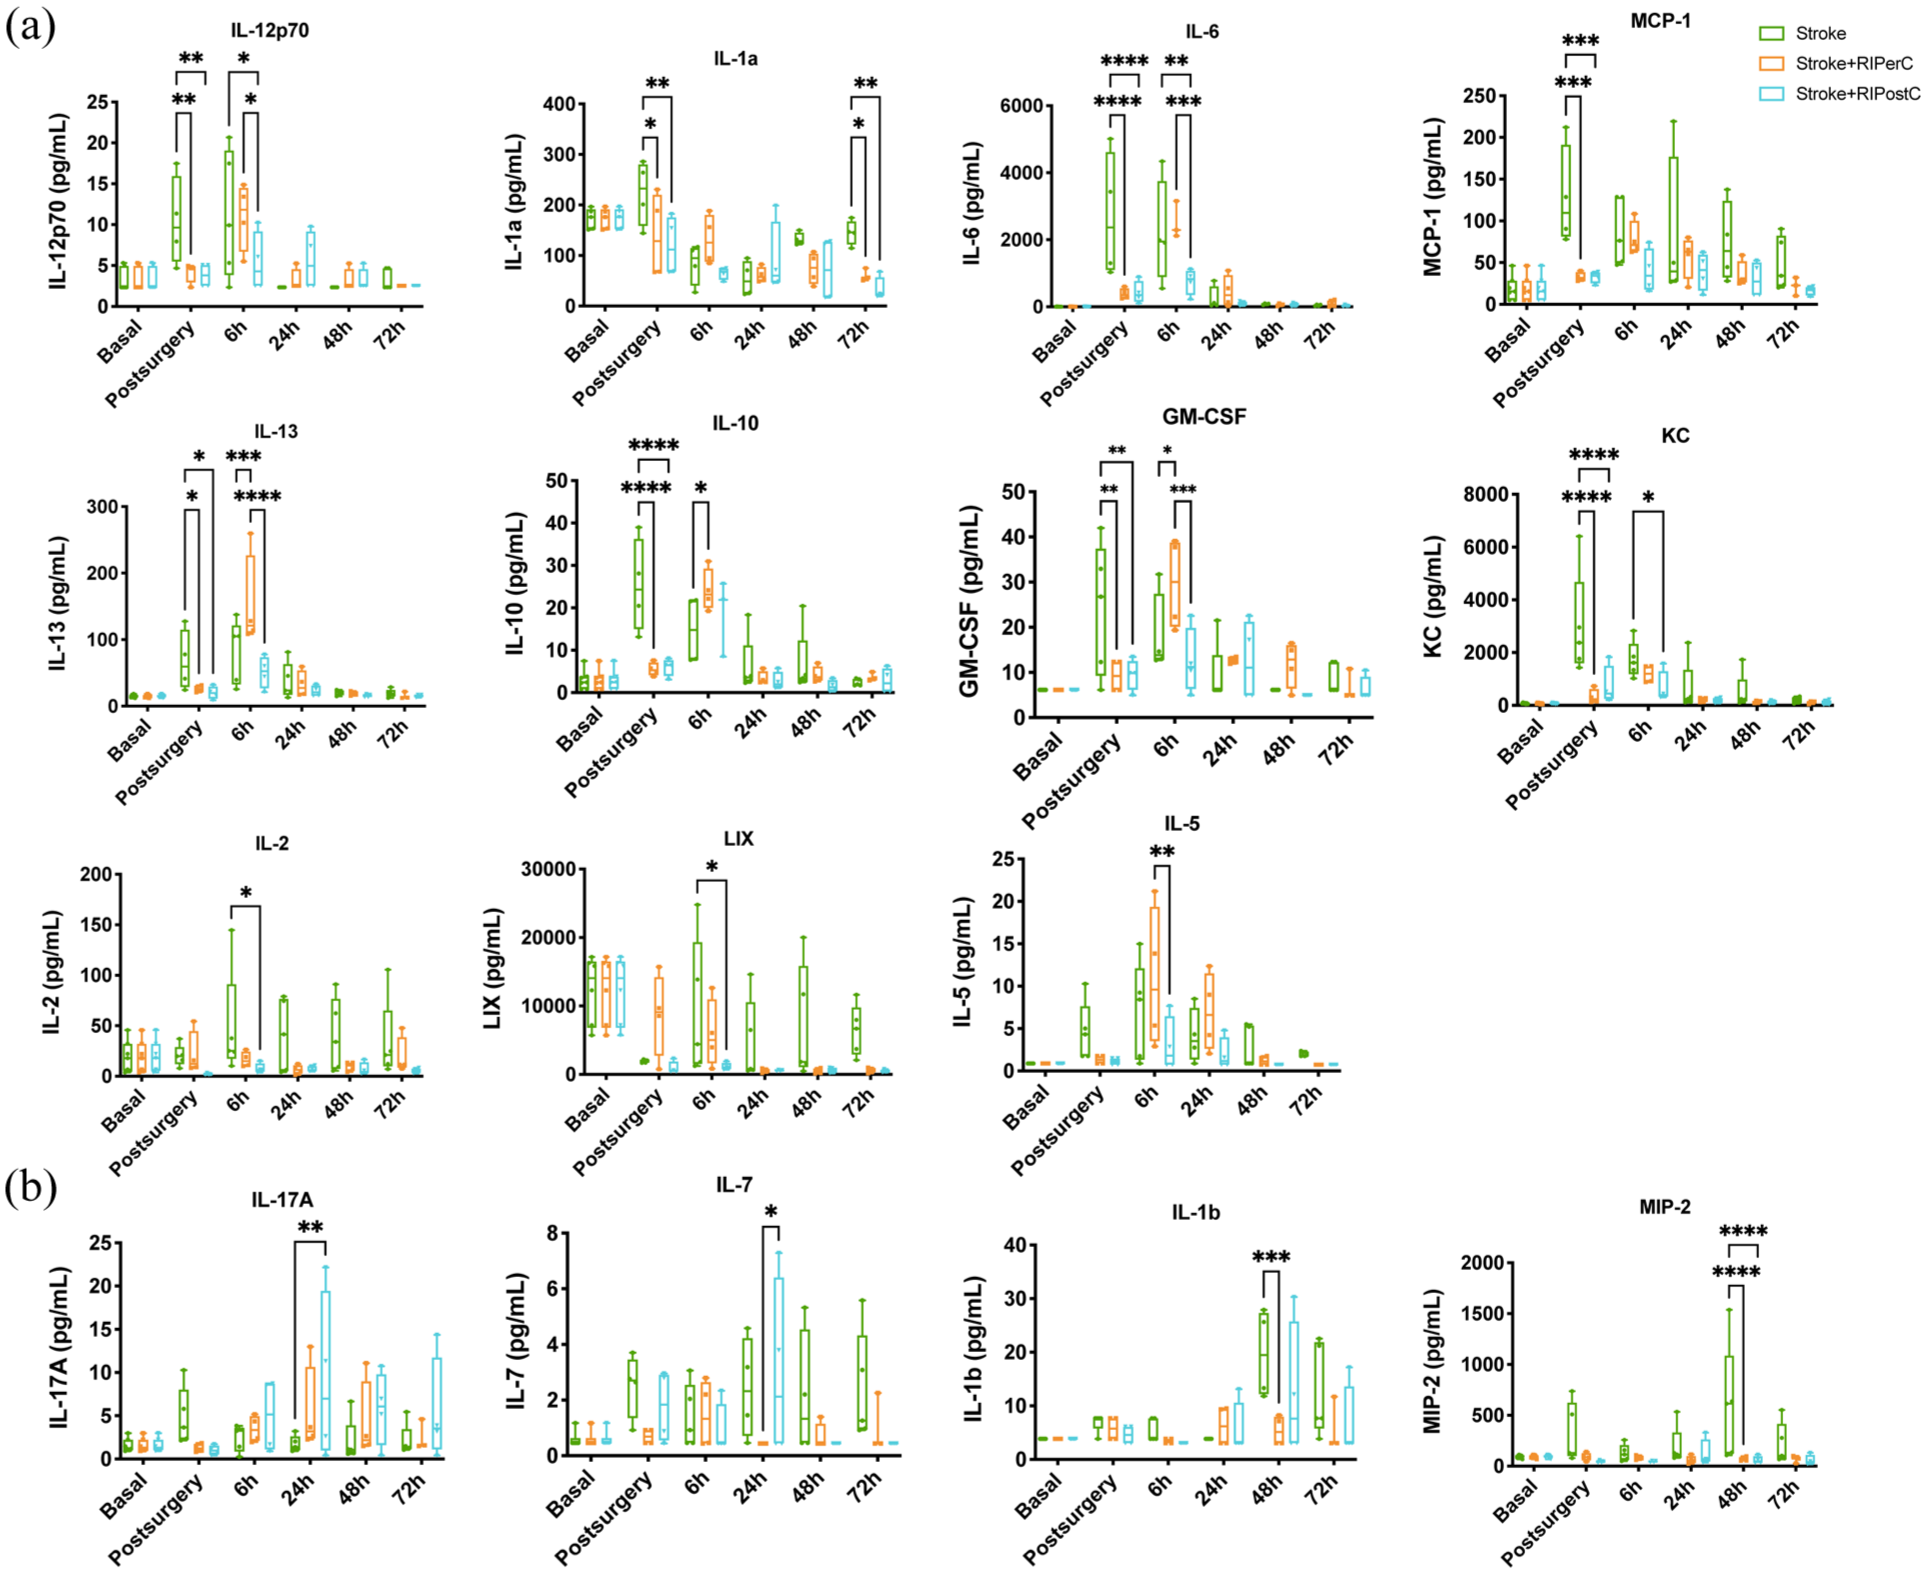
The effect of RIPerC and RIPostC on plasma levels pro-inflammatory, anti-inflammatory cytokines and growth factors in stroke animals at acute phase (a) and subacute phase (b), N = 4–5 animals/group. Two-way ANOVA with Tukey’s multiple comparisons test.
In the acute phase, both treatments appeared to reduce inflammatory responses. Twenty-four hours post-stroke, RIPostC increased IL-17A expression compared to the stroke group and IL-7 compared to RIPerC. Forty-eight hours post-stroke, RIPerC decreased IL-1β and MIP-2 levels, with RIPostC also reducing MIP-2. Both RIC treatments significantly decreased IL-1α levels at 72 h post-stroke (Figure 2(b)). No significant differences were noted in plasma levels of IFN-γ, IL-4, and TNF-α (data not shown).
Supplementary Figure 2 presents the cytokine expression profile by experimental group. These findings suggest distinct inflammatory signatures for RIPerC and RIPostC, with both treatments mitigating post-surgery inflammation and demonstrating specific profiles at 6 h. This cytokine panel aids in identifying plasma biomarkers and proposing circulating pathophysiological mechanisms of RIC.
Omic signatures
We next explored the metabolomic and lipidomic profiles of ischemic stroke and the effects of RIPerC and RIPostC treatments in the preclinical tMCAo model to identify local (brain tissue) and circulating (plasma) biomarkers. Statistical analysis pooled all brain tissue datasets (metabolomics and lipidomics from both ionization modes: positive and negative) for a global metabolome assessment, which revealed a total of 41,856 molecular features post-correction. Following quality control, 1871 features were retained for statistical analysis. In plasma, the global metabolome analysis identified 141,400 molecular features, with 2303 features remaining after processing.
Effect of brain ischemia on the brain metabolome
Non-targeted metabolomics and lipidomics were employed to evaluate whether tMCAo had a unique brain metabolome signature. The effect of 60 min of occlusion on the brain metabolome of tMCAo mice at 72 h post-stroke was assessed (Figure 3(a)). PCA showed good separation between groups, with the first three principal components explaining 50% of sample variability. PLS-DA distinctly separated the two groups (Figure 3(b)), but permutation tests (1000 repeats) yielded a non-significant p value (p = 1), indicating suboptimal modeling (data not shown). Hierarchical clustering of all lipid and metabolite species revealed no specific trend, although analysis of the 50 metabolites with the lowest p values confirmed that stroke significantly affected the brain lipidome and metabolome at 72 h post-surgery (Figure 3(c)).
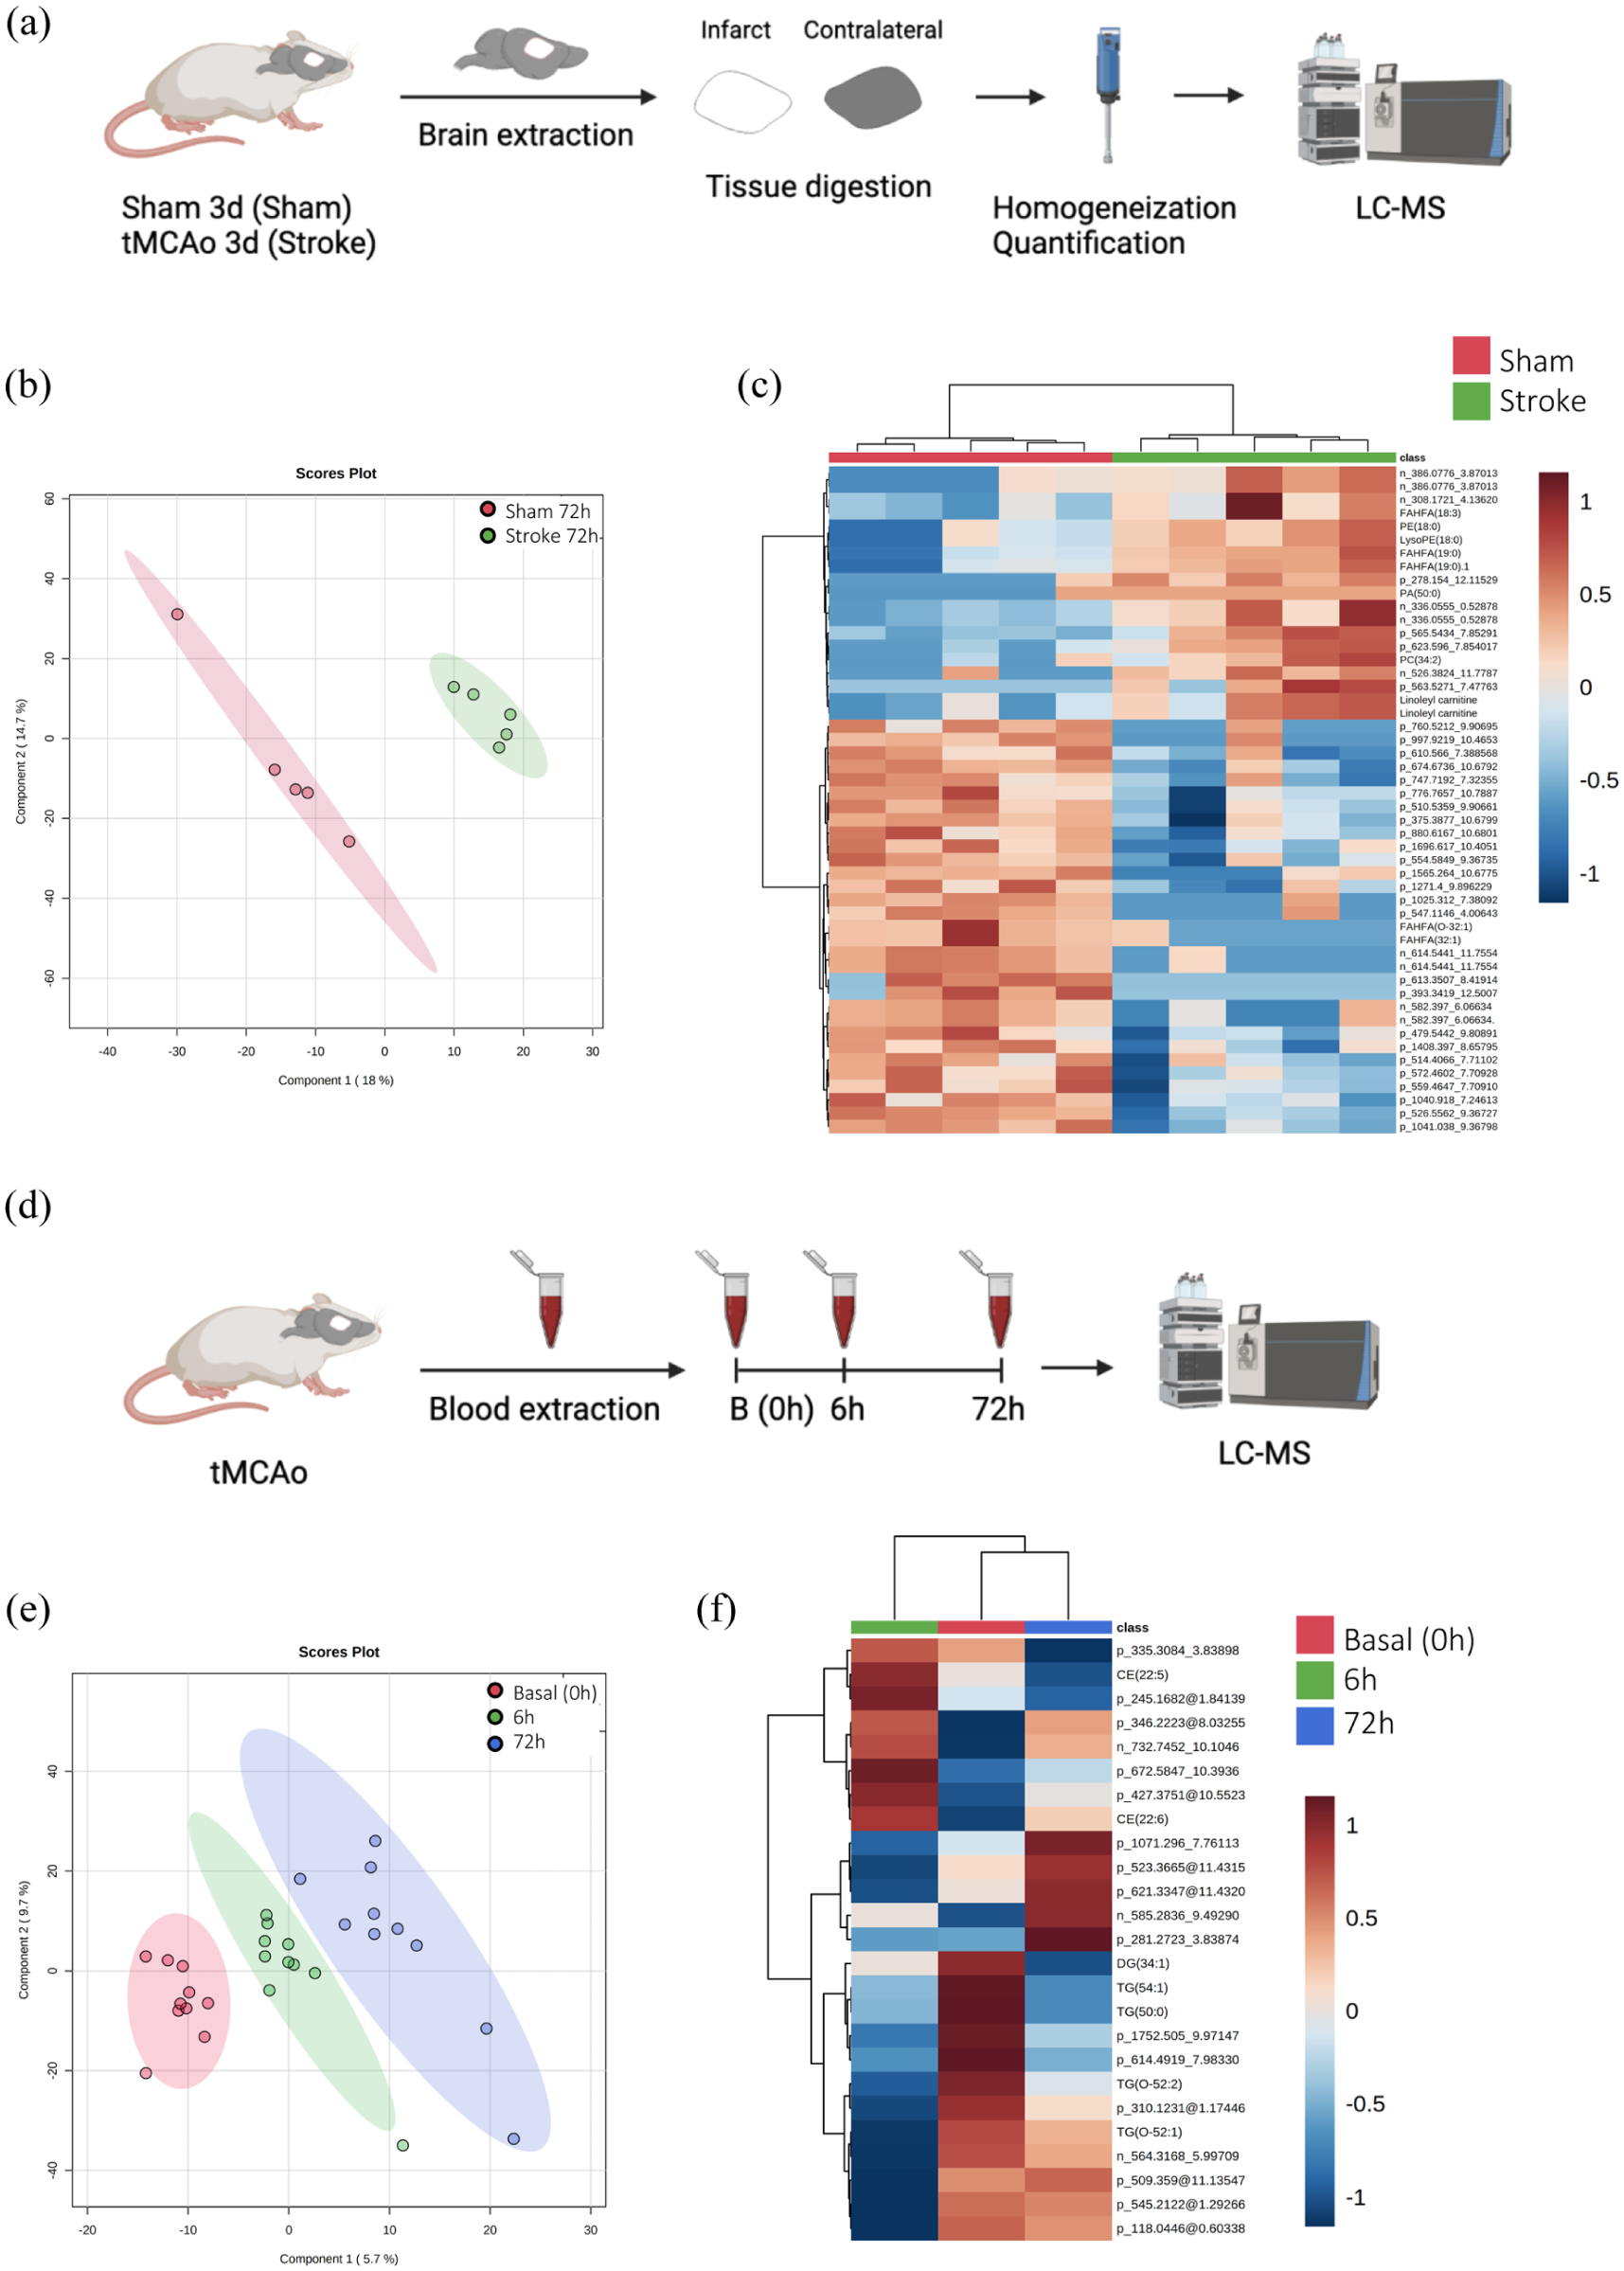
(a) Experimental design of the multivariate analysis of the differential metabolites species detected in brain tissue 72 h after sham or stroke surgery (N = 5 mice/group), (b) PLS-DA representation, (c) heatmap of hierarchical clustering using the 50 metabolites with the lowest p value detected in plasma. Each colored cell on the map corresponds to a feature and its relative concentration value, with samples in columns and compounds in rows, (d) experimental design of the multivariate analysis of the differential metabolites detected in the plasma during basal (0), 6, and 72 h after tMCAo mice (N = 10 mice/group), (e) PLS-DA representation, and (f) hierarchical clustering of average sample values.
A non-parametric Wilcoxon rank test identified 120 statistically different compounds from the 1871 detected, with 35 identified (Table 1). Identified species included one sterol lipid, nine fatty acids, five glycerolipids, 14 glycerophospholipids, five sphingolipids, and one N-acylamide. Among fatty acids, 66% were FAHFAs. Glycerolipids were predominantly comprised of MGs (40%) and TGs (40%). Glycerophospholipids included PAs (36%) and PCs (34%). These lipids were associated with antioxidant, anti-inflammatory, bioenergetics, structural, and signaling functions.
Metabolites species significantly different in brain tissue at 72 h after tMCAo between stroke and sham group.
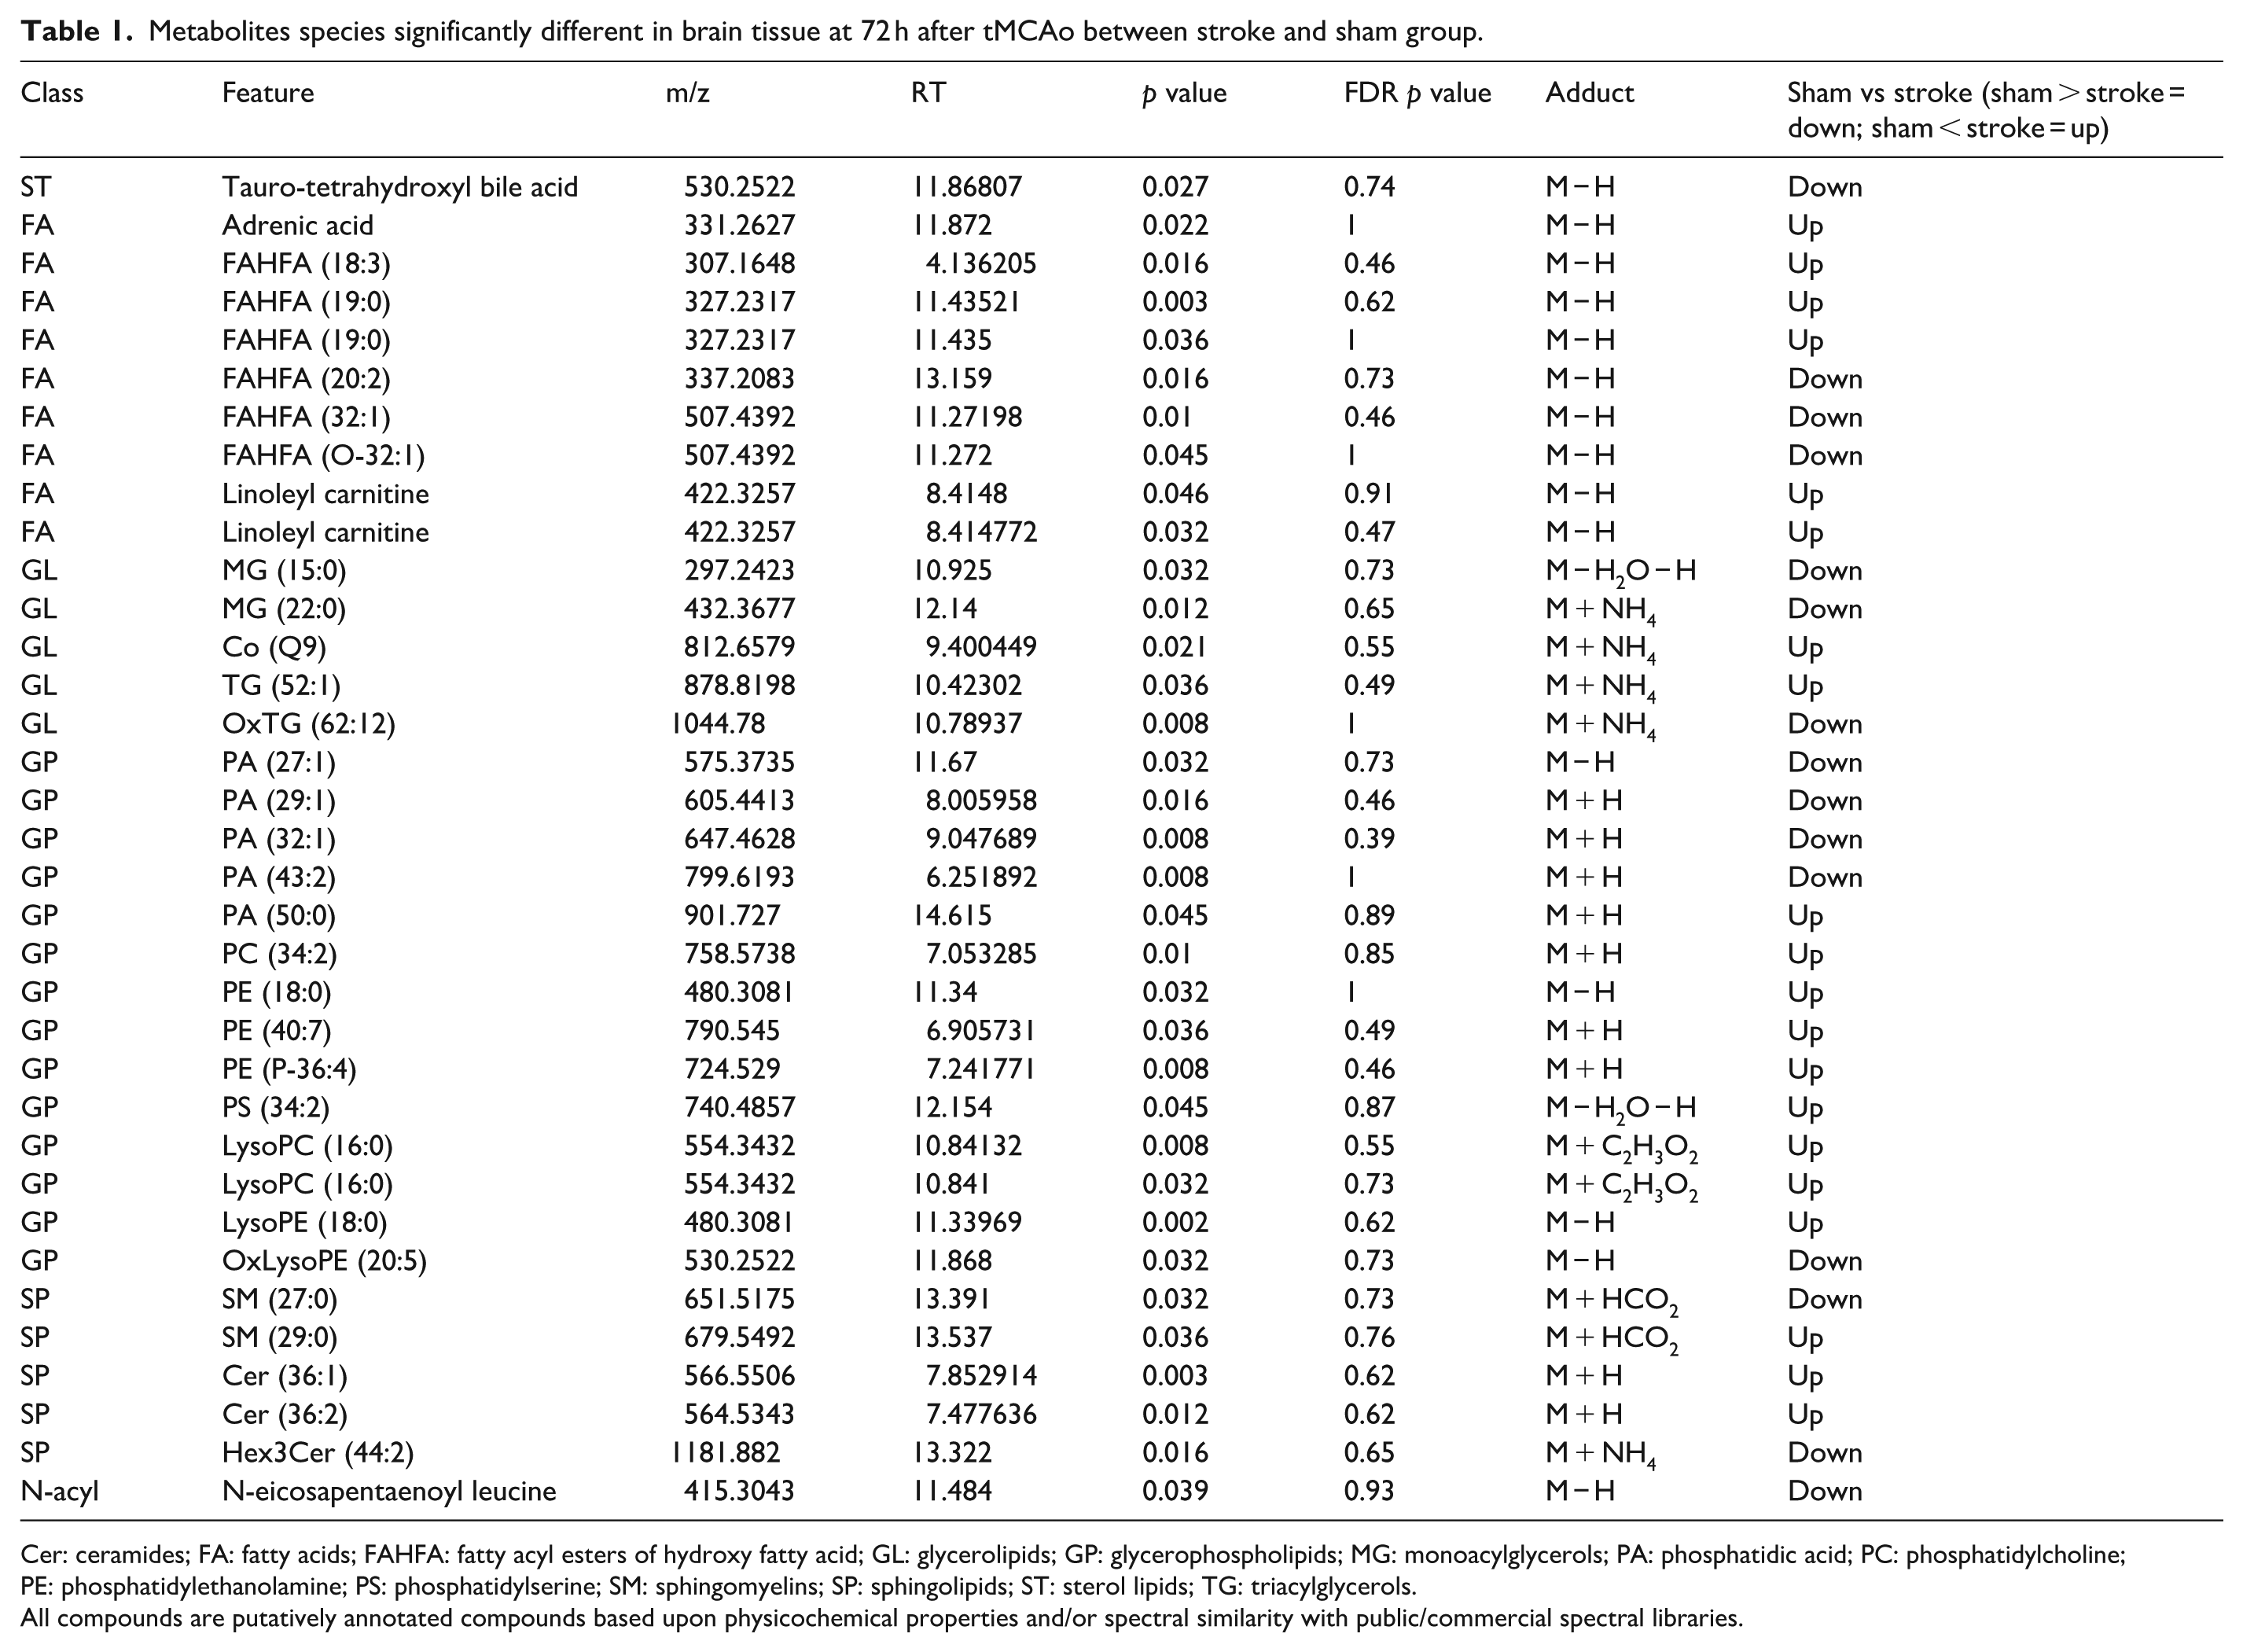
Cer: ceramides; FA: fatty acids; FAHFA: fatty acyl esters of hydroxy fatty acid; GL: glycerolipids; GP: glycerophospholipids; MG: monoacylglycerols; PA: phosphatidic acid; PC: phosphatidylcholine; PE: phosphatidylethanolamine; PS: phosphatidylserine; SM: sphingomyelins; SP: sphingolipids; ST: sterol lipids; TG: triacylglycerols.
All compounds are putatively annotated compounds based upon physicochemical properties and/or spectral similarity with public/commercial spectral libraries.
Effect of brain ischemia on the plasma metabolome
The plasma metabolome signature after 60 min of tMCAO was similarly analyzed (Figure 3(d)). PCA revealed that the first three principal components explained 27.5% of sample variability, suggesting common metabolite profiles with minor differences. PLS-DA clearly separated the three groups (Figure 3(e)), but permutation tests indicated a non-significant p value (p = 0.915), reflecting overfitting due to a limited number of variables (data not shown). Hierarchical clustering showed no specific metabolic profile for each time point when the entire metabolome was considered; however, analysis of the 25 metabolites with the lowest p values demonstrated that stroke progression affected the plasma metabolomic profile over time. Heatmap analysis indicated that the basal and 72 h groups exhibited more similar profiles than the 6 h group (Figure 3(f)). Among the significantly different metabolites identified, CE (22:5) increased its levels at 6 h and decreased at 72 h. Other examples are DG (34:1), TG (54:1), and TG (50:0) which decreased their levels at 6 and 72 h gradually. In contrast, TG (O-52:1) was decreased at 6 h after stroke and subsequently returns to baseline levels.
A non-parametric Kruskal–Wallis test was performed followed by Dunn’s multiple comparison post hoc test to compare all the groups between them. Thus, when we searched for specific stroke biomarkers in plasma, we found 223 compounds to be statistically different between groups (p < 0.05; Table 2). Among all the significant molecules, 125 were annotated, and 98 were not identified. Of all identified species, we detected eight FA, 54 GL, 41 GP, 10 SP, seven ST, one benzoid, one amino acid (AA), one imidazole, one acylamida, and one purine. Within the FAs class, 50% of features were acylcarnitines and the rest of the features were grouped together as others. Within GLs class, 80% of features were TGs, 13% DGs, and 7% MGs. Within GPs class, 12% were cardiolipins, 32% LysoPCs, 34% PCs, and 22% others. Within SPs class, 50% were sphingomyelins, 20% ceramides, 20% gangliosides, and 10% others. Within STs class, 71% were cholesteryl esters and 29% others. Globally, these metabolites were related with antioxidant, anti-inflammatory, bioenergetics, structural and signaling functions. Metabolic alteration by tMCAo was primarily associated with FA (AcCa), GL (DG, MG, and TG), GP (LysoPC, CL, PC, and OxPC), SP (SM), and ST (CE) metabolic pathways. AcCa and cholesterol ester metabolism was changed most significantly at 6 h. The levels of TGs decreased at 6 and 72 h. The levels of DG, MG, and LysoPC decreased at 6 h, but increased again to basal levels by 72 h. Long CL, PC, and OxPC reduced at 72 h. Finally, short CL as well as SM reduced at 6 h but increased by 72 h.
Metabolites species significantly different in plasma between B, 6, and 72 h after stroke.
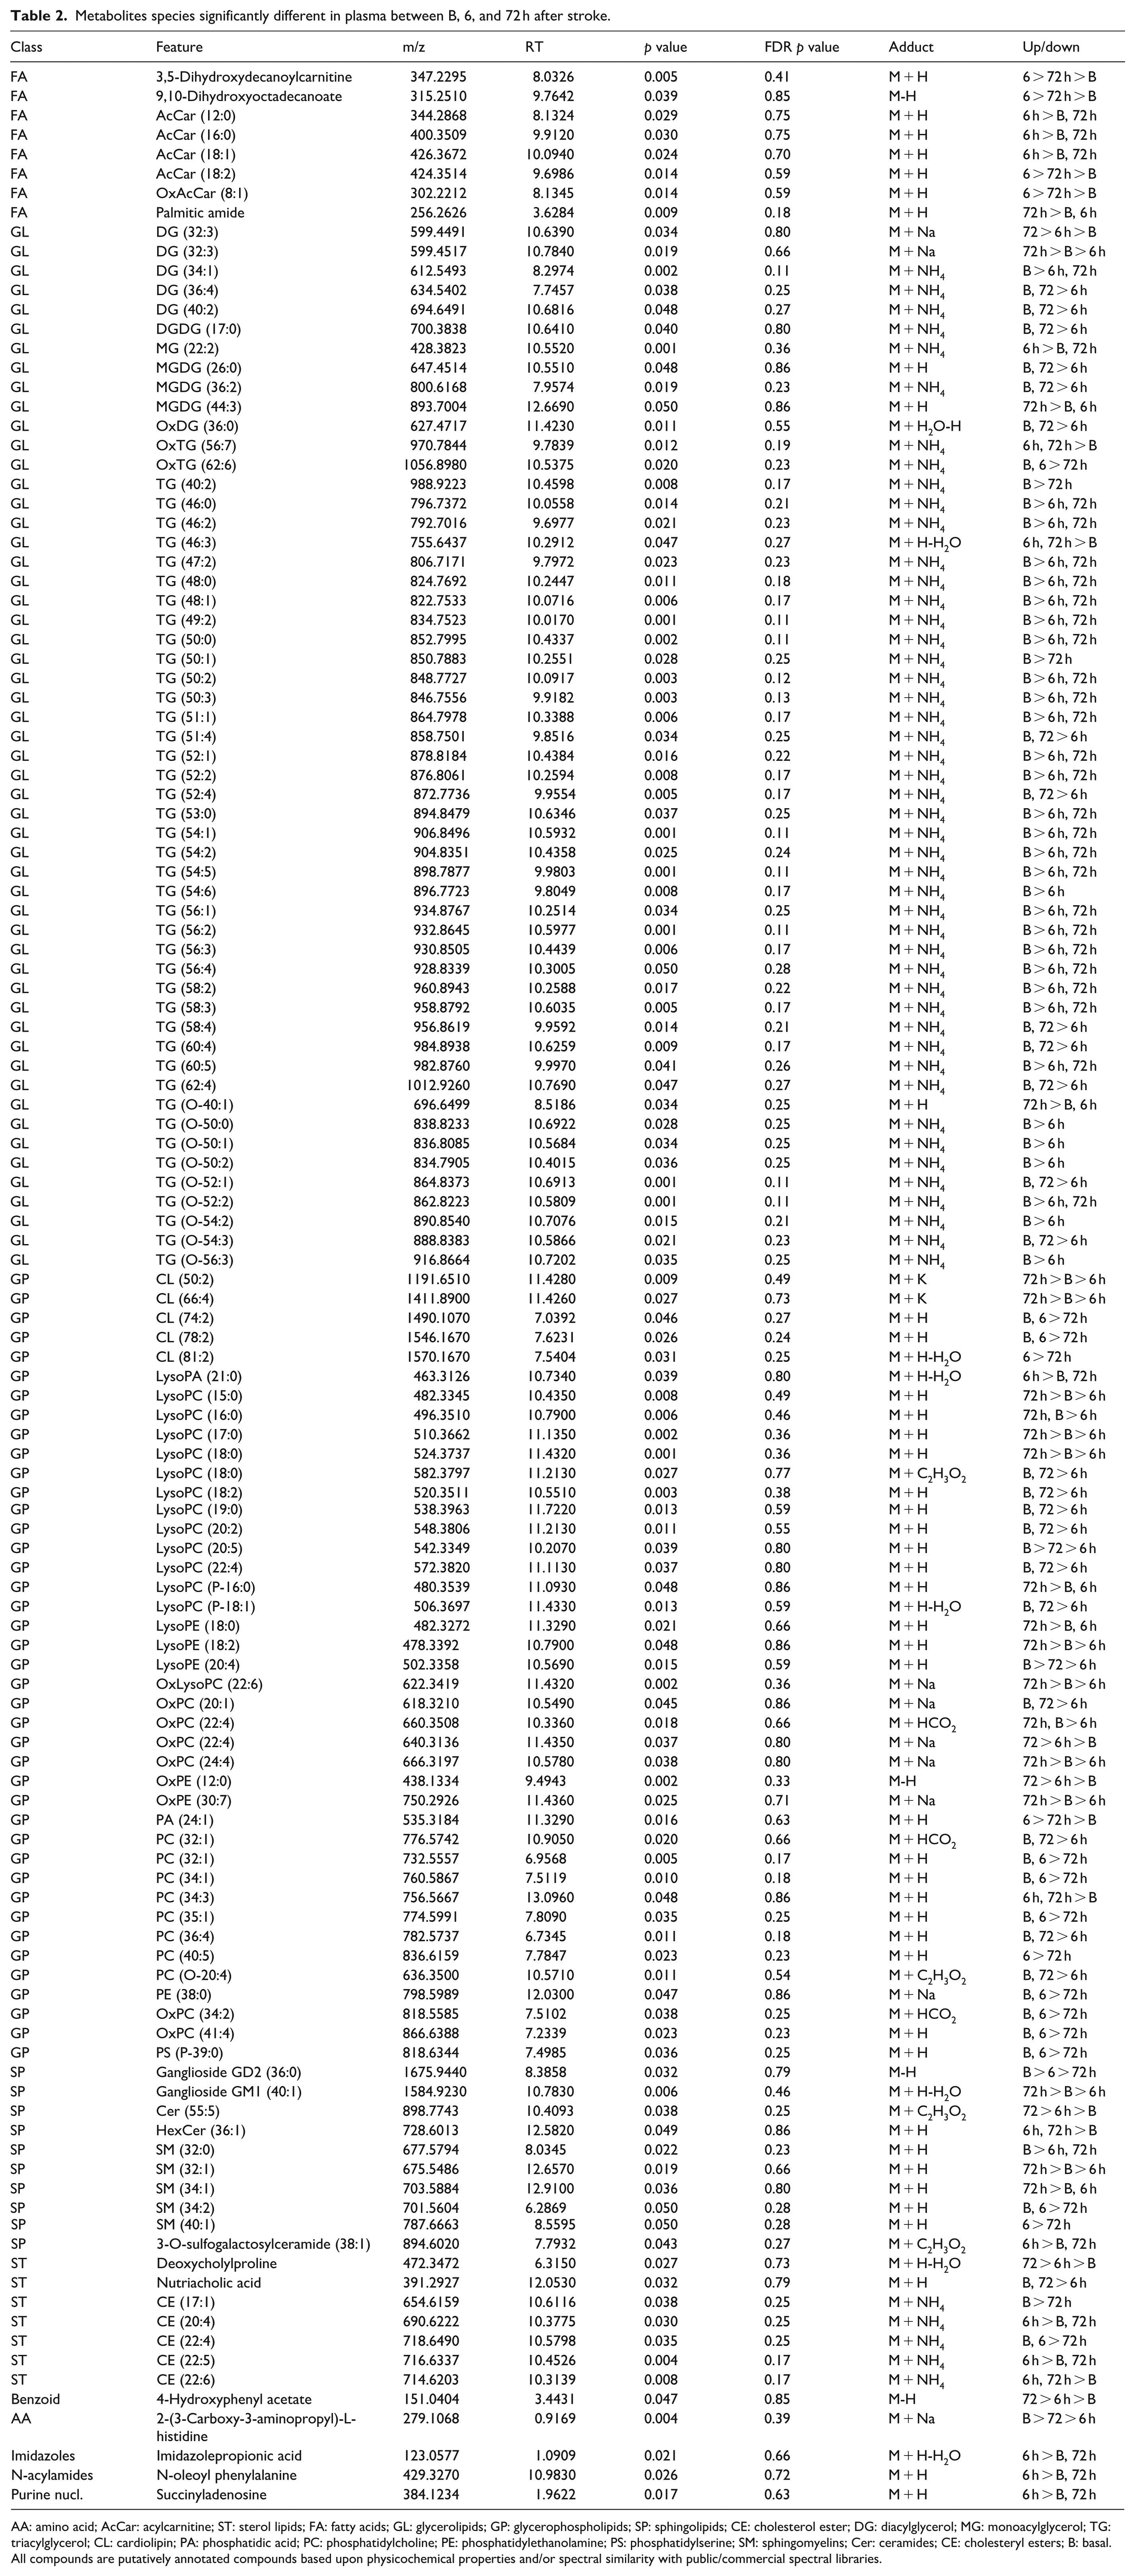
AA: amino acid; AcCar: acylcarnitine; ST: sterol lipids; FA: fatty acids; GL: glycerolipids; GP: glycerophospholipids; SP: sphingolipids; CE: cholesterol ester; DG: diacylglycerol; MG: monoacylglycerol; TG: triacylglycerol; CL: cardiolipin; PA: phosphatidic acid; PC: phosphatidylcholine; PE: phosphatidylethanolamine; PS: phosphatidylserine; SM: sphingomyelins; Cer: ceramides; CE: cholesteryl esters; B: basal.
All compounds are putatively annotated compounds based upon physicochemical properties and/or spectral similarity with public/commercial spectral libraries.
Effect of RIC in brain metabolome
To investigate whether RIPerC and RIPostC had a brain metabolome signature expressing an adaptive metabolic response with a potential neuroprotective role, the same analysis was performed (Figure 4(a)). PLS-DA was able to clearly separate the three groups (Figure 4(b)), but permutation tests (1000 repeats) yielded a not significant p value (p = 0.976), indicating that the model is overfitted (data not shown). Hierarchical clustering using all lipid and metabolites species detected showed there was no specific trend when the whole lipidome and metabolome was considered. However, when this analysis was performed using the 25 metabolites species with the lower p value, it showed that both RIC groups (RIPerC and RIPostC) were more homogeneous and similar to each other that to the Stroke group, indicating that RIC is determinant in the definition of the metabolome in the brain (Figure 4(c)).
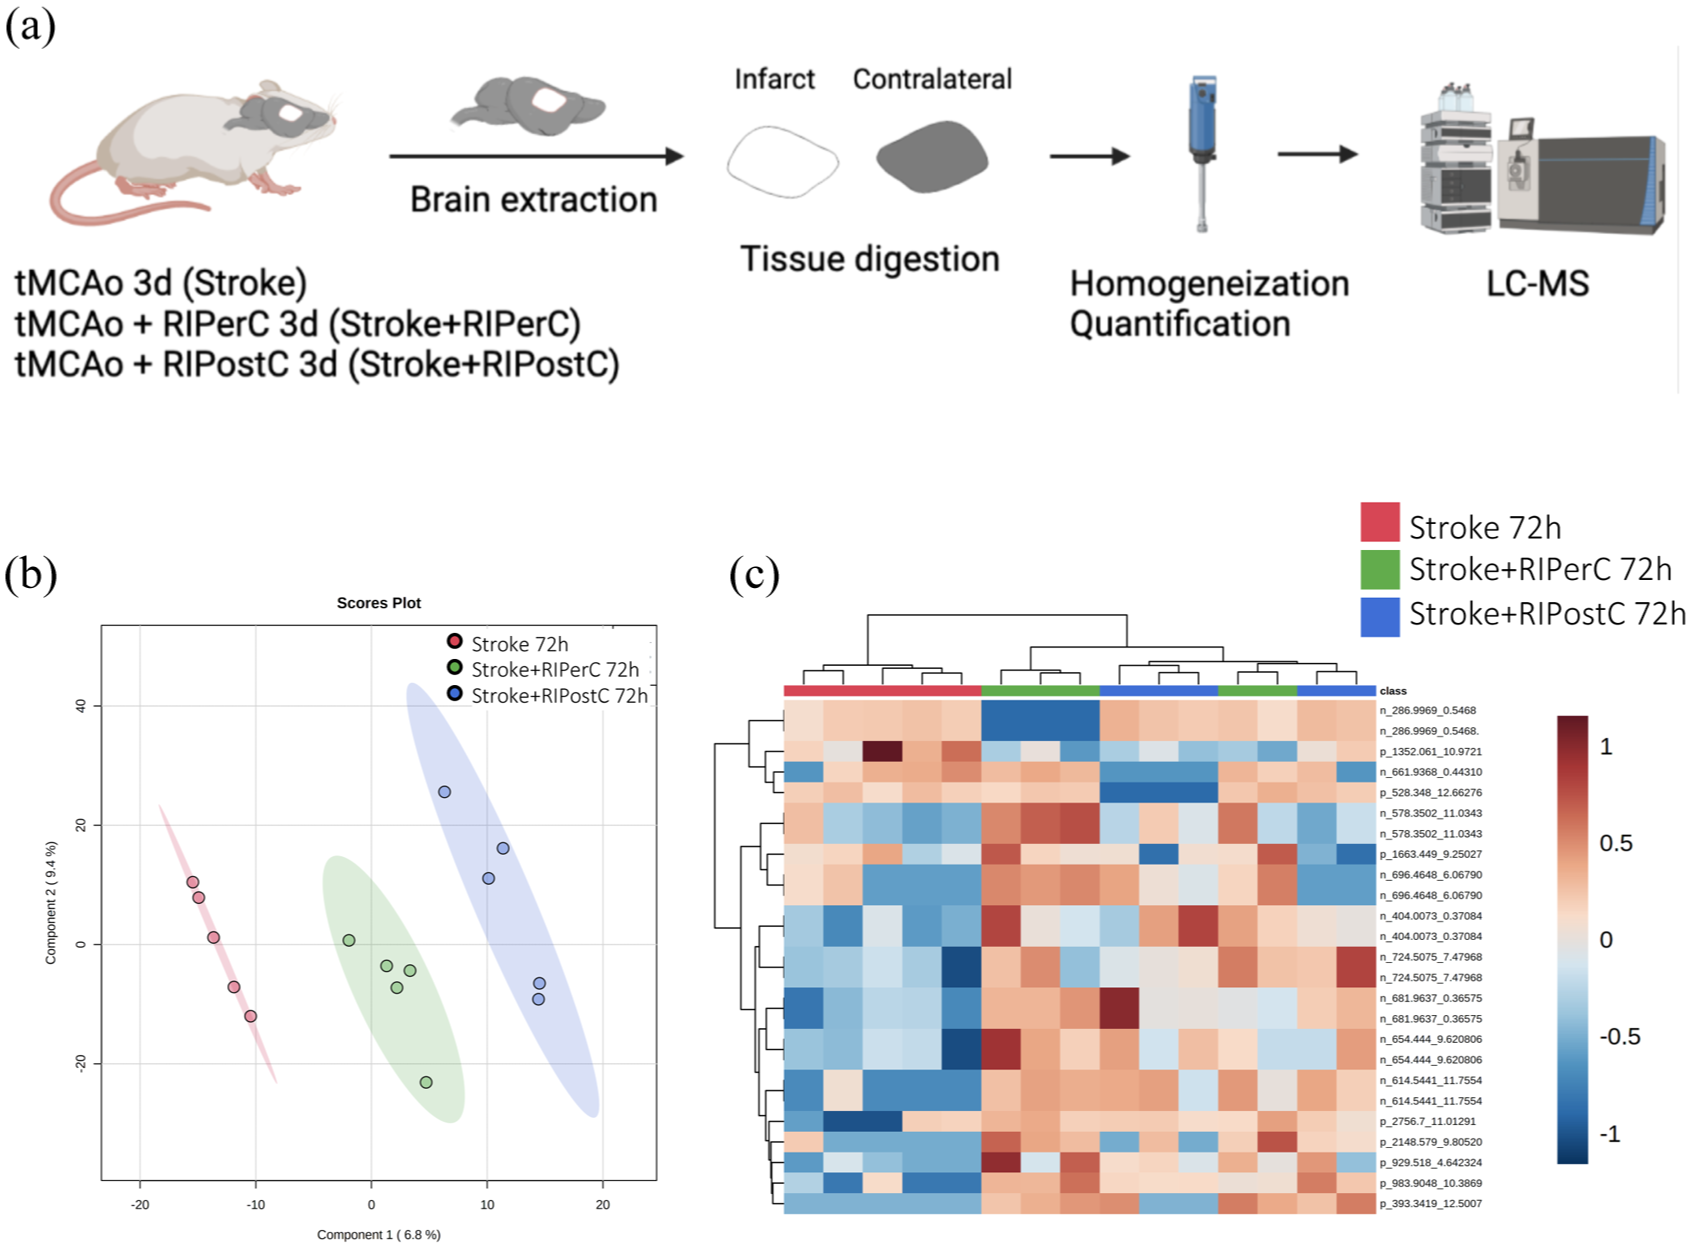
(a) Experimental design of the multivariate analysis of the differential metabolites detected in brain tissue 72 h after RIC application (N = 5 mice/group), (b) PLS-DA representation, and (c) heatmap of hierarchical clustering using the 25 metabolites with the lowest p value detected in plasma.
A non-parametric Kruskal–Wallis test was performed followed by Dunn’s multiple comparison post hoc test to compare all the groups. From the 1871 molecules detected, 10 compounds were found to be statistically different, of which three were identified (Supplementary Table 2). Among identified species, we described one glycerolipid (GL) and two sphingolipids (SP). Cer (42:3) and HexCer (36:1) levels increased at RIPostC group compared to that in the Stroke and RIPerC groups. TG (28:0) levels increased at RIPerC group compared to that in the Stroke and RIPostC groups. Globally, these lipids are related with signaling, structural, and bioenergetics functions.
Effect of RIC in plasma metabolome
Finally, we evaluated the effect of RIC in the plasma metabolome of tMCAo mice model at 6 h (Figure 5(a)) and 72 h after stroke (Figure 5(d)). If we focused first at 6 h, PLS-DA was able to clearly separate the three groups (Figure 5(b)). Hierarchical clustering using all metabolites species detected showed there were no global changes when the whole metabolome was considered. However, when this analysis was performed using the 25 metabolites species with the lowest p value, it revealed that there was an almost perfect clusterization according to their group. The heatmap of metabolites abundances showed that the Stroke + RIPerC group had a specific profile compared with the other two groups (Stroke and Stroke + RIPostC; Figure 5(c)).
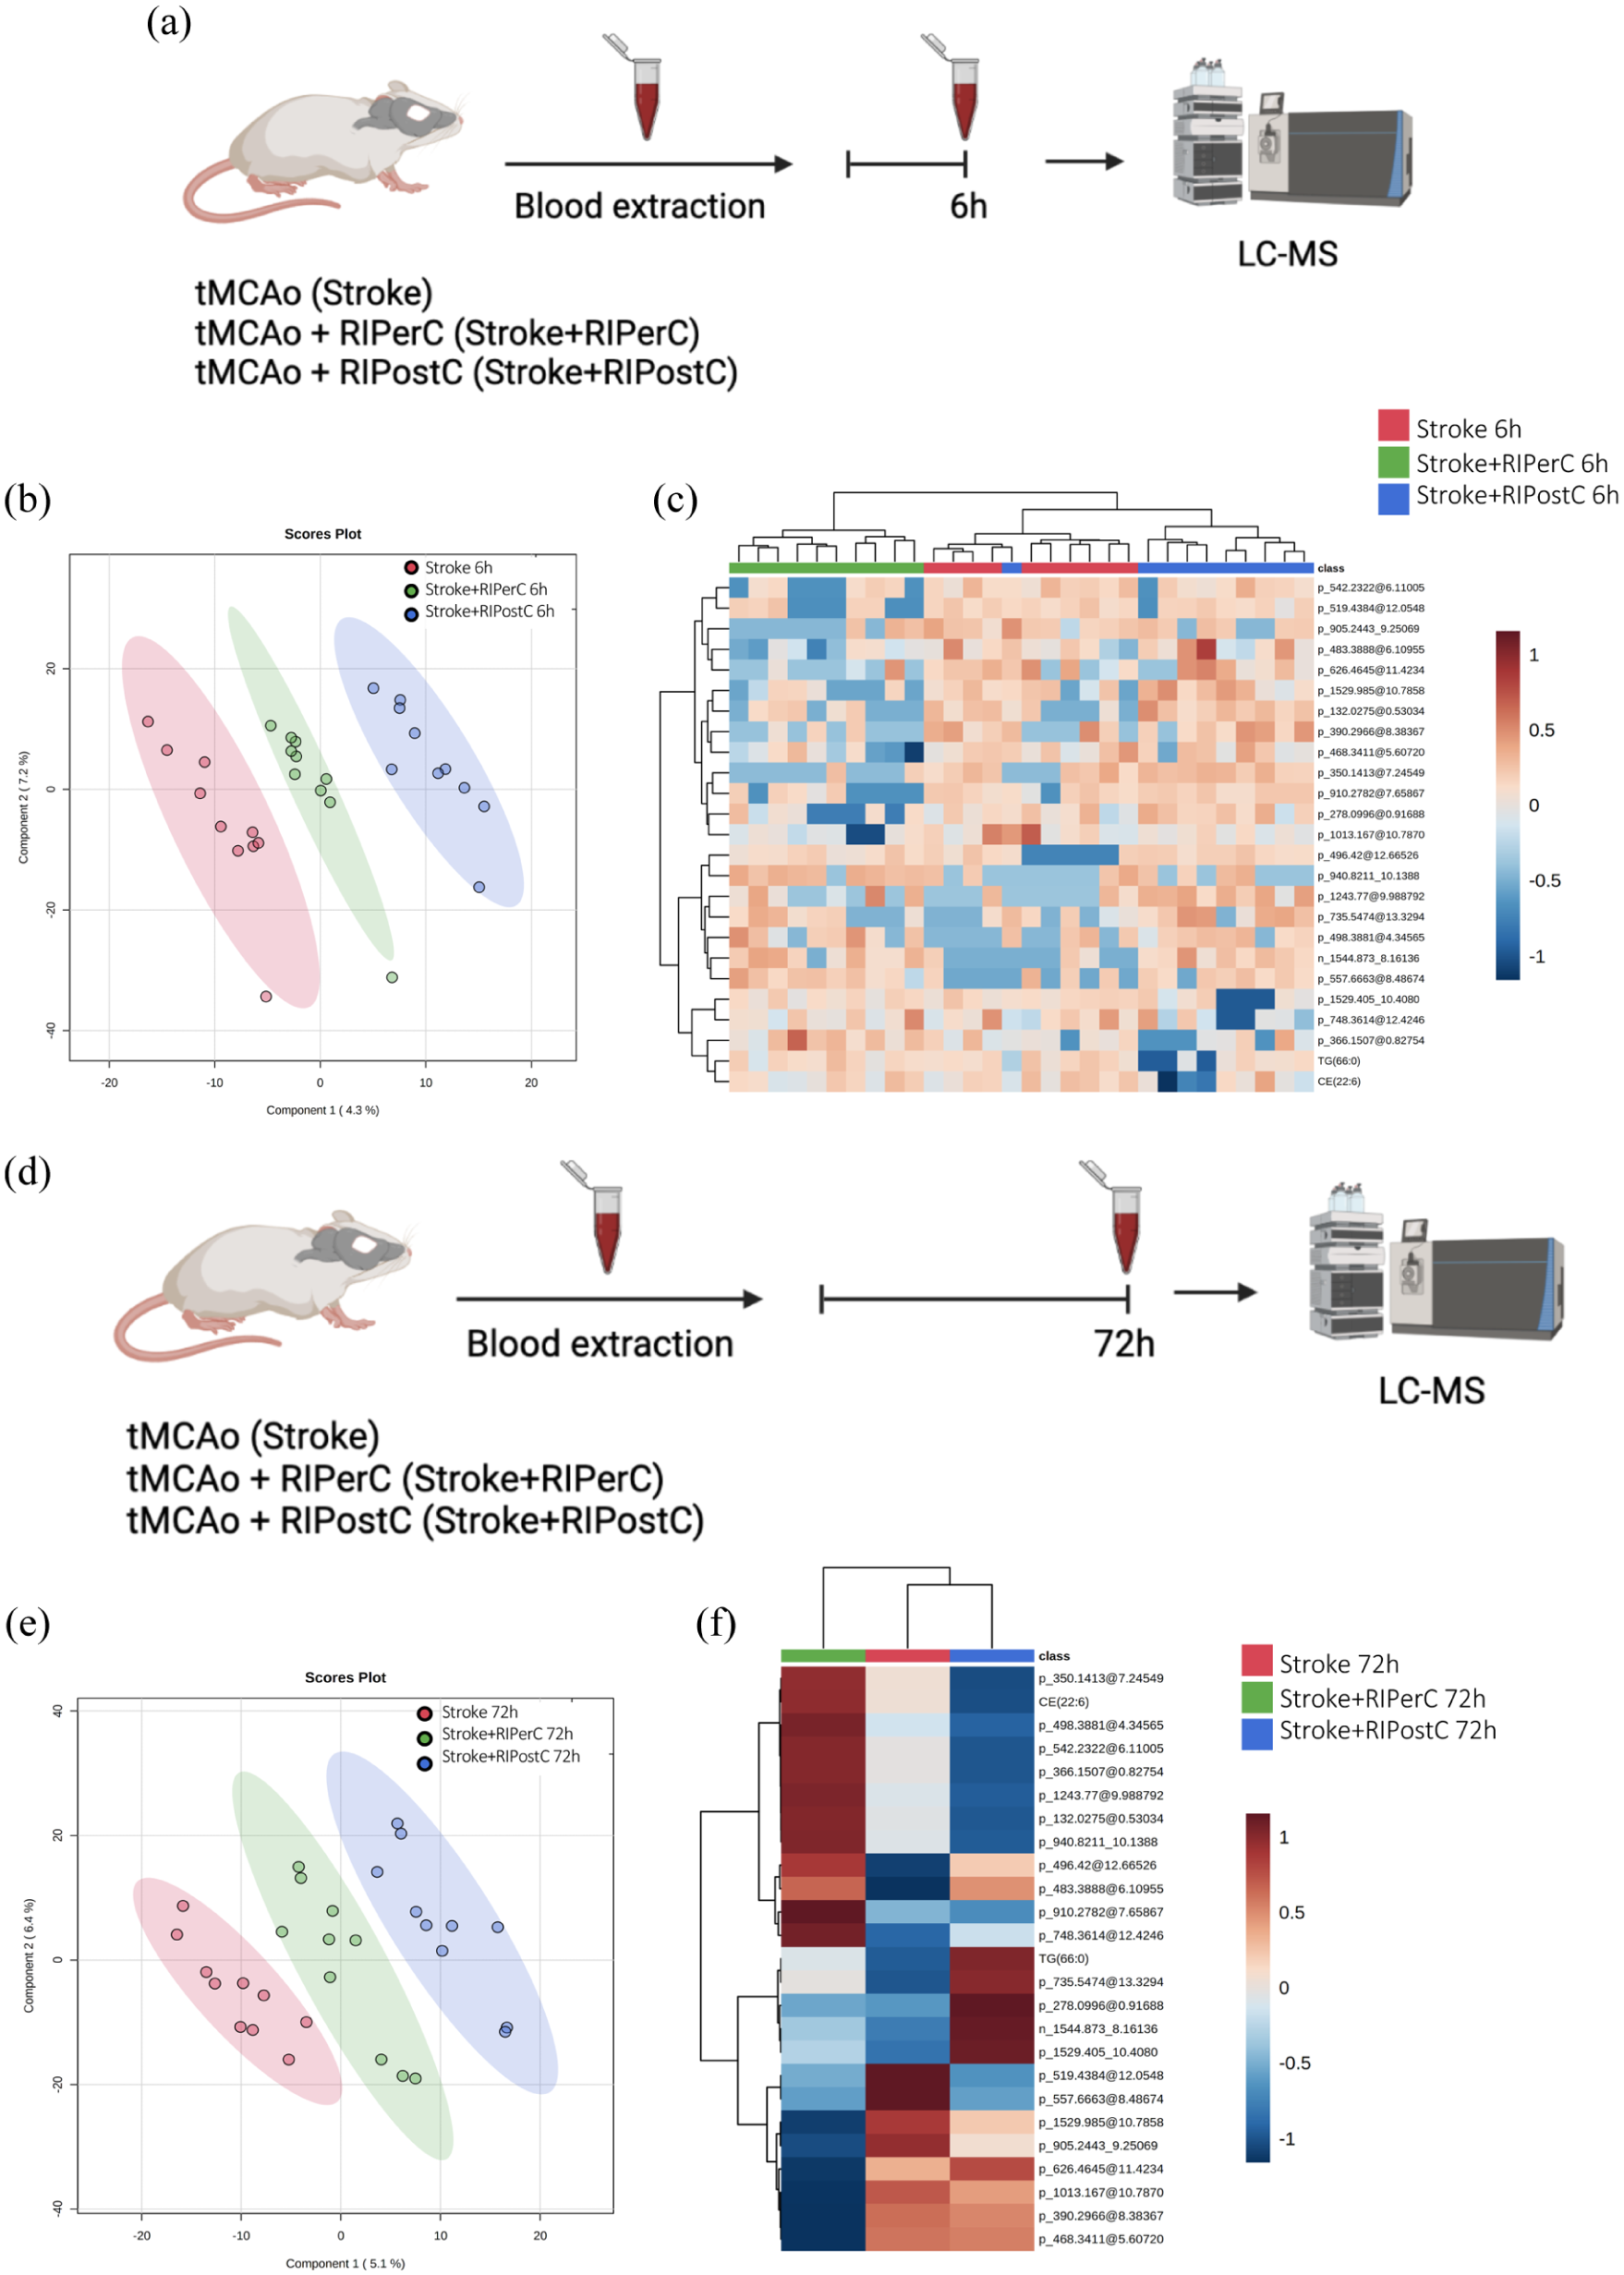
(a) Experimental design of the multivariate analysis of the differential metabolites species detected in the plasma after RIC application in the tMCAo mice at 6 h after stroke (N = 10 mice/group), (b) PLS-DA representation, (c) heatmap of hierarchical clustering using the 25 metabolites with the lower p value detected in plasma, (d) experimental design of the multivariate analysis of the differential metabolites’ species detected in the plasma after RIC application in the tMCAo mice at 72 h after stroke (N = 10 mice/group), (e) PLS-DA representation, and (f) hierarchical clustering of average sample values.
Univariant metabolomic analysis demonstrated the existence of specific changes in plasma metabolome at 6 h after RIC application. Thus, to search for specific RIC biomarkers in plasma at the hyperacute phase, a non-parametric Kruskal–Wallis test was performed followed by Dunn’s multiple comparison post hoc test to compare all the groups. We found 61 compounds to be statistically different between groups (p < 0.05). Among all the significant molecules, 18 were annotated and 43 were not identified (Supplementary Table 3). Of all identified species, we described one amino acid (AA), four glycerolipids (GL), nine glycerophospholipids (GP), two N-acylamidas, one organonitrogen, and one sphingolipid (SP). Within GLs class, 50% were MGs and 50% DGs. Within GPs class, 22% were PGs, 22% Pes, and 56% others. In general, lipids detected were associated with antioxidant, signaling, and structural functions.
Glycerophospholipid metabolism was changed most significantly in the RIPostC group compared to that in the RIPerC and Stroke group. The levels of AA and MGDG increased at RIPerC group. Sphingolipid metabolism was changed in both RIC groups compared to that in the Stroke group.
Considering the results at 72 h, PLS-DA was able to clearly separate the three groups (Figure 5(e)). Hierarchical clustering using all metabolites species detected showed there was no affectation of the metabolome at a global level. Moreover, when this analysis was performed using the 25 metabolites species with the lower p value, the distribution was not improved. However, the heatmap of average 25 metabolites abundances allowed to see how molecules evolve depending on the treatment, with their respective abundances. A specific profile for each group can be observed (Figure 5(f)).
Univariate metabolomics analysis demonstrated the existence of specific changes in the global plasma metabolome at 72 h after RIC application. Thus, when we searched for specific stroke biomarkers in plasma, a non-parametric Kruskal–Wallis test was performed followed by Dunn’s multiple comparison post hoc test to compare all the groups. We found 66 compounds to be statistically different between groups (p < 0.05; Supplementary Table 4). Among all the significant molecules, 29 were annotated, and 37 were not identified. Of all identified species, we described one amino acid (AA), one benzoid, three fatty acids (FA), nine glycerolipids (GL), 10 glycerophospholipids (GP), three sphingolipids (SP), one N-acylamida, and one purine. Within GLs class, 78% were TGs, 11% MGs, and 11% DGs. Within GPs class, 30% were PCs, 40% were OxLysoPCs, and 30% others. Glycerolipids and glycerophospholipids were the most abundant class with functions such as bioenergetics and signaling. FA metabolism was most significantly changed in the RIPostC group, while GL and GP metabolism were most altered in the RIPerC group.
For a more comprehensive analysis of results, please refer to the online Supplementary Methods.
Discussion
As in previous studies, our findings confirm the beneficial effects of RIPerC and RIPostC in brain ischemia.4,5 Notably, our study provides the first evidence of an inflammatory and metabolomic-lipidomic signature associated with RIC. This signature indicates that RIPerC and RIPostC confer protection against cerebral ischemia-reperfusion injury through peripheral immunomodulation and the regulation of lipid metabolism. We observed a rapid and transient peripheral inflammatory response characterized by various inflammatory mediators following experimental stroke, characterized by increased levels of multiple cytokines and chemokines during the hyperacute phase (up to 6 h) and partial resolution of this response during the acute phase (24–72 h).
RIC significantly modulated these systemic responses. Both RIPerC and RIPostC reduced pro-inflammatory mediators, suggesting that RIC may transmit protective signals to the brain via peripheral immune regulation. Chemokines such as GM-CSF, KC, and MCP-1 may limit leukocyte infiltration, while increased IL-10 and IL-13 suggest an enhanced anti-inflammatory environment. Distinct patterns emerged between the two RIC strategies: RIPerC promoted an early rise in anti-inflammatory cytokines, whereas RIPostC suppressed specific pro-inflammatory mediators, consistent with prior reports. 8 These complementary mechanisms likely converge to reduce neuroinflammation and infarct size.
Among the cytokines, IL-17A, IL-1β, and IL-1α were selected as key candidates for future brain-level analysis due to their dual roles in neuroinflammation and repair. 19 IL-17A, elevated in plasma after RIPostC, can exacerbate acute damage but also support astrocyte–neuron interactions and synaptic remodeling. Reduced plasma IL-1β and IL-1α may reflect decreased neutrophil recruitment and blood–brain barrier injury. Future studies examining these cytokines in the peri-infarct or penumbra will clarify whether plasma changes correspond to brain-level effects, thereby solidifying the mechanistic relevance of the observed systemic responses.
Our metabolomic profiling revealed a distinct plasma signature associated with stroke, with the most pronounced alterations occurring 6 h after tMCAo. These changes were largely driven by lipid metabolism, including fatty acids, glycerolipids, glycerophospholipids, and sphingolipids. Elevated acylcarnitines suggested mitochondrial β-oxidation dysfunction and proinflammatory signaling, 20 while reduced diacylglycerols and triacylglycerols may reflect their consumption for membrane repair. 21 In contrast, toxic intermediates such as linoleyl carnitine accumulated in the ischemic brain, highlighting potential metabolic targets for intervention. Consistent with prior studies, alterations in lipid classes such as LysoPC, cardiolipins, and ceramides indicate their dual role as both damage-associated signals and possible contributors to neuroprotection or angiogenesis, depending on timing and localization.
Beyond lipids, stroke induced dynamic changes in other metabolite classes, including purine nucleosides, amino acids, bile acids, and sterols. Reduced histidine and nutricholic acid levels point to impaired antioxidant and anti-inflammatory mechanisms, 22 while accumulation of succinyladenosine and sulfatides suggests enhanced inflammatory signaling and neuronal damage. 23 Importantly, decreased cholesterol esters and phosphatidylserine in plasma may reflect transport toward injured brain tissue to aid in membrane repair, 24 whereas shifts in bile acids indicate ongoing regulation of neuroinflammation. Together, these findings highlight plasma as a more sensitive compartment than brain tissue for detecting early metabolic disturbances after ischemia, and they suggest a panel of candidate metabolites that could serve as biomarkers for stroke onset, severity, and progression.
Our results demonstrate that RIC induces a distinct metabolomic profile characterized by antioxidant, anti-inflammatory, and neuroprotective effects. Early after stroke, both RIPerC and RIPostC elevated oxidized glutathione, PG (32:2), and ganglioside GM1, suggesting enhanced ROS scavenging and neuroprotection. 25 Specific metabolites were differentially modulated by each strategy: RIPerC reduced LysoSM (18:0) and glutamine derivatives linked to ROS and cytokine release, while RIPostC lowered excitotoxic metabolites and increased choline, a compound with known roles in neuroplasticity and recovery. 26 Both interventions also reduced oxidative lipid species, including acylcarnitines and TAGs, and decreased sulfatide levels, indicating attenuation of oxidative stress and neuronal apoptosis. 27 At 72 h, reductions in tryptophan and 2,4OH-BP further supported an anti-inflammatory and anti-apoptotic shift in the systemic metabolic response.
In brain tissue, RIC effects were more limited but still pointed to a role in regulating lipid metabolism and cell survival. RIPerC reduced ceramides, molecules linked to apoptosis, 28 while RIPostC increased specific long-chain ceramides that may support proliferation and repair, 28 suggesting divergent mechanisms of protection. Additional changes included increased TG (28:0) in RIPerC-treated brains, consistent with enhanced energy storage for mitochondrial metabolism. Collectively, these findings support the hypothesis that RIC promotes ischemic tolerance through targeted modulation of systemic and brain lipid metabolism, generating a metabolomic–lipidomic signature that could serve as the basis for future biomarker discovery and therapeutic strategies in stroke.
Taken together, these findings support the concept that RIC induces coordinated systemic and local metabolic adaptations. The contralateral hemisphere should not be regarded as a biologically inert control, as it undergoes histological, inflammatory, metabolic and transcriptional changes after cerebral ischemia.29–31 We therefore used contralateral tissue as a within-animal reference rather than an unaffected comparator, and interpret RIC-associated effects as hemispheric differences within a globally responsive post-ischemic brain. Although a dedicated RIC-only control group was not included because of experimental constraints, the paired design is consistent with widely used preclinical RIC stroke paradigms and provides a robust framework for detecting relative treatment-associated changes.
Future investigations should prioritize targeted analyses of selected cytokines (e.g. IL-17A, IL-1β) and metabolites (e.g. LysoPC, ceramides) within ischemic brain regions, particularly the penumbra, to determine whether the systemic signatures identified here directly reflect cerebral pathophysiology. Such studies will be essential for validating candidate biomarkers and elucidating the mechanistic pathways through which RIC mediates neuroprotection. 32
We acknowledge several additional limitations. First, although cytokine profiles were assessed at multiple time points, metabolomic and lipidomic analyses were restricted to three, which may have missed dynamic changes during intermediate or chronic phases of stroke. Second, while analyses of plasma and ipsilateral cortical tissue revealed systemic and local alterations, the penumbral region—an essential target for neuroprotective strategies—was not specifically examined. Third, although RIC induced distinct changes in plasma cytokines and metabolites, we did not directly assess whether these alterations were mirrored in the brain, limiting conclusions regarding peripheral–central mechanistic links. Fourth, although the distal tMCAo model produces reproducible infarcts representative of partial MCA-territory strokes, it does not fully recapitulate the large-vessel occlusions observed in patients with more severe strokes. Finally, the study did not account for sex differences or incorporate common comorbidities (e.g. hypertension, diabetes, aging), which are critical considerations for translational relevance.
In conclusion, RIC elicits an adaptive systemic response that modulates inflammatory mediators and lipid metabolism, producing downstream effects consistent with neuroprotection. Our findings reveal a distinctive metabolomic–lipidomic signature of ischemic tolerance induced by RIPerC and RIPostC and identify key plasma markers for future brain-level validation, providing a foundation for mechanistic studies and the development of potential biomarkers in stroke.
Supplemental Material
sj-pdf-1-jcb-10.1177_0271678X261458135 – Supplemental material for Remote ischemic perconditioning and postconditioning reduced cerebral ischemic injury modulating inflammatory responses and metabolic pathways
Supplemental material, sj-pdf-1-jcb-10.1177_0271678X261458135 for Remote ischemic perconditioning and postconditioning reduced cerebral ischemic injury modulating inflammatory responses and metabolic pathways by Coral Torres-Querol, Reinald Pamplona, Gloria Arqué and Francisco Purroy in Journal of Cerebral Blood Flow & Metabolism
Footnotes
Acknowledgements
We would like to express our gratitude to the members of the Clinical Neuroscience group at IRBLleida for their invaluable collaboration and support throughout this project. We also sincerely thank the staff of the animal facility for their essential assistance.
Author contributions
Conceived the study: CT-Q, GA, RP, and FP; designed experiments: CT-Q, GA, RP, and FP; participated on data interpretation and draft the manuscript: CT-Q, GA, RP, and FP. All authors: CT-Q, GA, RP, and FP critically revised the final version of the manuscript. All authors approved the final version to be published. CT-Q was the recipient of a pFIS contract granted by the ISCIII. FP procured funding.
Funding
The authors disclosed receipt of the following financial support for the research, authorship, and/or publication of this article: CT-Q received predoctoral fellowships in the Health Research Training program (PFIS contracts) of the Instituto de Salud Carlos III (ISCIII), AES2018 (FI18/00319).
Declaration of conflicting interests
The authors declared no potential conflicts of interest with respect to the research, authorship, and/or publication of this article.
Ethics approval and consent to participate
This work was conducted with the approval of the ethical committee of the University of Lleida (CEEA 02-02/20). All experiments complied with the “Principles of laboratory animal care” (NIH). Animal work is reported according to the ARRIVE guidelines.
Consent for publication
All authors have given consent for publication.
Data availability statement
Requests for access to the data reported in this paper will be considered by the Lead contact on reasonable basis.
Supplemental material
Supplemental material for this article is available online.
References
Supplementary Material
Please find the following supplemental material available below.
For Open Access articles published under a Creative Commons License, all supplemental material carries the same license as the article it is associated with.
For non-Open Access articles published, all supplemental material carries a non-exclusive license, and permission requests for re-use of supplemental material or any part of supplemental material shall be sent directly to the copyright owner as specified in the copyright notice associated with the article.