
Abstract
Obesity is associated with chronic systemic inflammation, vascular endothelial dysfunction, and increased risk of central nervous system (CNS) injury, yet the mechanisms linking peripheral inflammation to brain damage remain incompletely understood. The endothelial glycocalyx, a critical regulator of vascular barrier integrity, may serve as a mechanistic interface between systemic inflammation and CNS impairment. In this prospective observational cohort study, 72 adults (48 with obesity and 24 normal-weight controls) underwent standardized clinical assessments, fasting blood sampling, emotional evaluation, and diffusion tensor imaging of the brain. Circulating inflammatory markers, endothelial glycocalyx degradation products, and CNS injury biomarkers were quantified. After adjusting for age, hypertension, triglycerides, and fasting glucose, individuals with obesity exhibited significantly elevated levels of all inflammatory, glycocalyx, and CNS injury markers, along with reduced white-matter integrity (lower FA, higher MD; all p < 0.05). Partial correlation analyses revealed that endothelial glycocalyx degradation was closely associated with systemic inflammation, CNS injury, and white-matter microstructure. Our findings indicated that glycocalyx degradation products might serve as biomarkers for obesity-related neurovascular changes. This study was registered at the Chinese Clinical Trial Registry (ChiCTR 2400085587).
Keywords
Introduction
The global obesity epidemic has become a major public health challenge. 1 The prevalence of overweight and obesity has risen substantially worldwide,2,3 with midlife obesity now recognized as a significant risk factor for late-life dementia, particularly impairing attention, memory, and executive function. 4 Neuroimaging studies demonstrate that higher body mass index (BMI) associates with reduced gray matter volume in critical memory regions (e.g. hippocampus), and compromised white matter integrity,5–7 suggesting that obesity may contribute to cognitive decline through structural alterations.
Obesity triggers chronic low-grade systemic inflammation through immune cell infiltration during adipose tissue expansion. 8 Circulating inflammatory cytokines and adipokines disrupt metabolic homeostasis and may impair blood–brain barrier (BBB) integrity. 9 Although traditionally considered immune-privileged, 10 the central nervous system (CNS) exhibits neuroinflammation under obese conditions. Animal studies demonstrate that high-fat diet (HFD)-induced obesity promotes peripheral immune cell infiltration into the hypothalamic and hippocampal regions, establishing a proinflammatory microenvironment and triggering synaptic dysfunction. 11 However, the precise mechanisms by which peripheral immune cells breach the BBB remain incompletely elucidated.
Endothelial dysfunction critically contributes to obesity-related pathologies. 12 In adults under 60 years of age, elevated BMI values have been reported to be independently associated with endothelial injury 13 and to promote vascular stiffness. 14 The endothelial glycocalyx, a gel-like layer coating vascular endothelial cells,15,16 forms the blood–endothelium interface. This structure physiologically inhibits leukocyte adhesion by shielding adhesion molecules (e.g. P-selectin 17 ), while its degradation products (e.g. syndecan-1 (SDC-1)) serve as circulating biomarkers of endothelial injury. 18 However, the impact of obesity on glycocalyx remains unclear, as does its potential role in linking systemic inflammation with CNS injury.
Therefore, we conducted a prospective observational cohort study to investigate the associations among systemic inflammation, endothelial glycocalyx degradation, CNS injury markers, and white matter microstructural changes in adults with or without obesity. Plasma biomarkers reflecting these biological domains were quantified, and white matter integrity was assessed using magnetic resonance diffusion tensor imaging (MRI–DTI). This study aimed to elucidate the interrelationships among systemic inflammation, endothelial glycocalyx degradation, and CNS injury in the context of obesity.
Materials and methods
Between July 1, 2024 and May 31, 2025, a total of 83 individuals were assessed for eligibility, comprising 53 candidates with obesity and 30 age-matched control candidates. All participants were screened based on predefined inclusion and exclusion criteria prior to enrollment. Eleven individuals were excluded for the following reasons: congestive heart failure (n = 2), history of stroke (n = 1), MRI contraindications or refusal (n = 5), and incomplete clinical or imaging data (n = 3). The final analysis included 72 participants (Figure 1). Exclusion criteria were: history of neurological disorders or major brain injury; endocrine diseases directly affecting body weight and metabolism (e.g. hyperthyroidism, Cushing’s disease); abnormal liver function; or significant body-weight fluctuations or extreme dietary behaviors within 1 month before enrollment. In addition, conventional MRI sequences were used to exclude participants with silent cerebral infarctions, space-occupying lesions, or major congenital malformations. Participants with a BMI ⩾30 kg/m2 were included in the obese group (n = 48), and those with 18.5 ⩽ BMI < 25 kg/m2 were assigned to the control group (n = 24), in accordance with the World Health Organization (WHO) definition of obesity. The study was approved by the Ethics Committee of Huashan Hospital, Fudan University (approval no. KY2024-697) and registered with the Chinese Clinical Trial Registry (ChiCTR2400085587). All procedures involving human participants were conducted in accordance with the Declaration of Helsinki. All participants provided written informed consent.
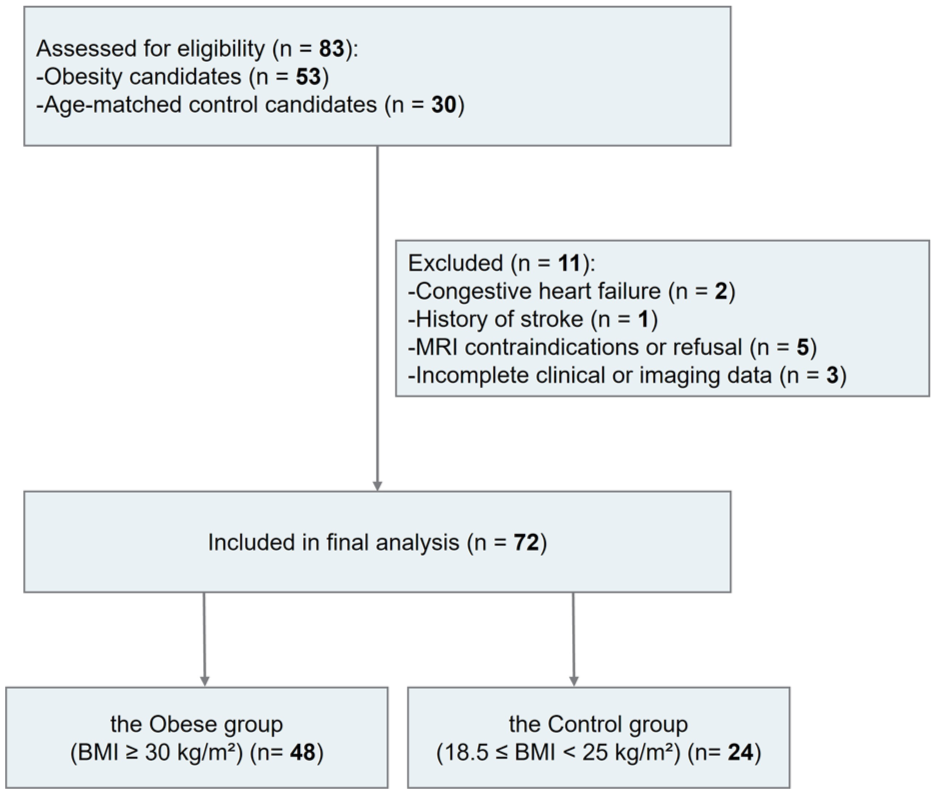
Flow diagram of participant recruitment and selection.
We recorded the age, gender, height, weight, comorbidities (e.g. history of hypertension, diabetes, etc.), and medication history within the past 3 months (e.g. statins, metformin, nonsteroidal anti-inflammatory drugs, etc.) for all participants. Medication history within the past 3 months was recorded at enrollment, including antidiabetic agents, antihypertensive agents, lipid‑lowering agents, antidepressants, and medications for other obesity‑related complications (e.g. NSAIDs). The specific drugs and doses were documented for each participant. Hypertension was diagnosed according to the Chinese Guidelines for Prevention and Treatment of Hypertension. 19 For participants not taking antihypertensive medication, hypertension was defined as office blood pressure ⩾140/90 mmHg on 3 separate days (non‑consecutive). Participants with a documented history of hypertension were classified as having hypertension regardless of whether they were currently on antihypertensive medication. We also measured fasting blood glucose (FBG), triglycerides (TG), and total cholesterol (TC). The primary outcome was plasma heparan sulfate (HS), a biomarker of systemic endothelial glycocalyx degradation. Secondary outcomes included plasma syndecan-1 (SDC-1); systemic inflammation markers (interleukin-1β (IL-1β), interleukin 6 (IL-6), interleukin-10 (IL-10), tumor necrosis factor α (TNF-α), and ferritin) and CNS injury biomarkers (glial fibrillary acidic protein (GFAP), neurofilament light chain (NFL), and amyloid-β42 (Aβ42)).
All blood samples were collected in the early morning after fasting (⩾8 h) into sterile EDTA anticoagulant tubes. Plasma was separated by centrifugation at 3000 rpm for 10 min, aliquoted into cryogenic tubes, and stored at −80 °C. All analytes were quantified using enzyme-linked immunosorbent assays (ELISA), with procedures strictly adhering to manufacturer protocols. Details regarding kit manufacturers, catalog numbers, analytical sensitivities, reporting ranges, and intra-/inter-assay coefficients of variation were provided in eTable 1.
White-matter integrity was assessed via MRI–DTI on a Siemens Verio 3.0-T MRI scanner using the following parameters: repetition time (TR) 6500 ms, echo time (TE) 95 ms, slice thickness 3 mm, b-value 1000 s/mm2, and field of view (FOV) 230 × 230 mm. Image processing followed the tract-based spatial statistics (TBSS) pipeline in the FMRIB Software Library (FSL). Analyses were performed on the mean fractional anisotropy (FA) images and their skeletons, with anatomical labeling based on the JHU-ICBM-DTI-81 atlas. Prior to TBSS analysis, all DTI datasets underwent visual quality control for excessive head motion, severe image distortion, and overall image quality.
The sample size was calculated for the primary outcome (HS) using PASS 2021. Based on prior data 20 (mean HS value of 10.4 ng/mL in the obese group vs 3.3 ng/mL in the control group), assuming a standard deviation σ = 7 ng/mL, a two-tailed test with α = 0.05, and 90% power (1 − β), 22 participants/group were required. Considering heterogeneity in lipid metabolism among individuals in the obese group, the target sample size for this group was increased to 44 subjects. Accounting for a 10% dropout rate, the final planned sample size was set at 48 subjects in the obese group and 24 subjects in the control group.
Statistical analyses were performed using SPSS 26.0 (IBM, USA) and GraphPad Prism 10.0 (GraphPad Software, USA). Normality of continuous variables was assessed using the Kolmogorov–Smirnov test. Normally distributed data were presented as mean ± standard deviation (SD), with intergroup differences tested with independent samples t-tests. Multivariate linear regression models were utilized to compare glycocalyx degradation markers (HS and SDC-1), systemic inflammatory markers (IL-6, TNF-α, and ferritin), CNS injury markers (GFAP, NFL, and Aβ42), and DTI metrics between the two groups, incorporating age, FBG, TG, and hypertension. The correlations among the aforementioned markers were assessed using both zero-order Pearson correlation analyses and partial correlation analysis. Multiple testing correction was performed using the Benjamini–Hochberg method. A two-tailed p < 0.05 was considered statistically significant.
Results
A total of 72 participants were recruited in the final analysis (the obese group, n = 48; the control group, n = 24). There were no significant differences between the two groups in age, height, or gender distribution (all p > 0.05). Compared with the normal weight group, the obese group exhibited significantly higher levels of BMI, FBG, TG, and TC. In the obese group, six participants had hypertension and seven had diabetes, while no participants in the control group reported hypertension or diabetes. Additionally, in the obese group, two and four individuals, respectively, had taken statins or metformin within the past 3 months. No one in the control group had taken these medications. In this cohort, only statin and metformin use were reported (two and four participants, respectively, all in the obese group); no participant reported use of antidepressants, NSAIDs, or other obesity‑related complication medications (Table 1).
Clinical characteristics of the study participants.
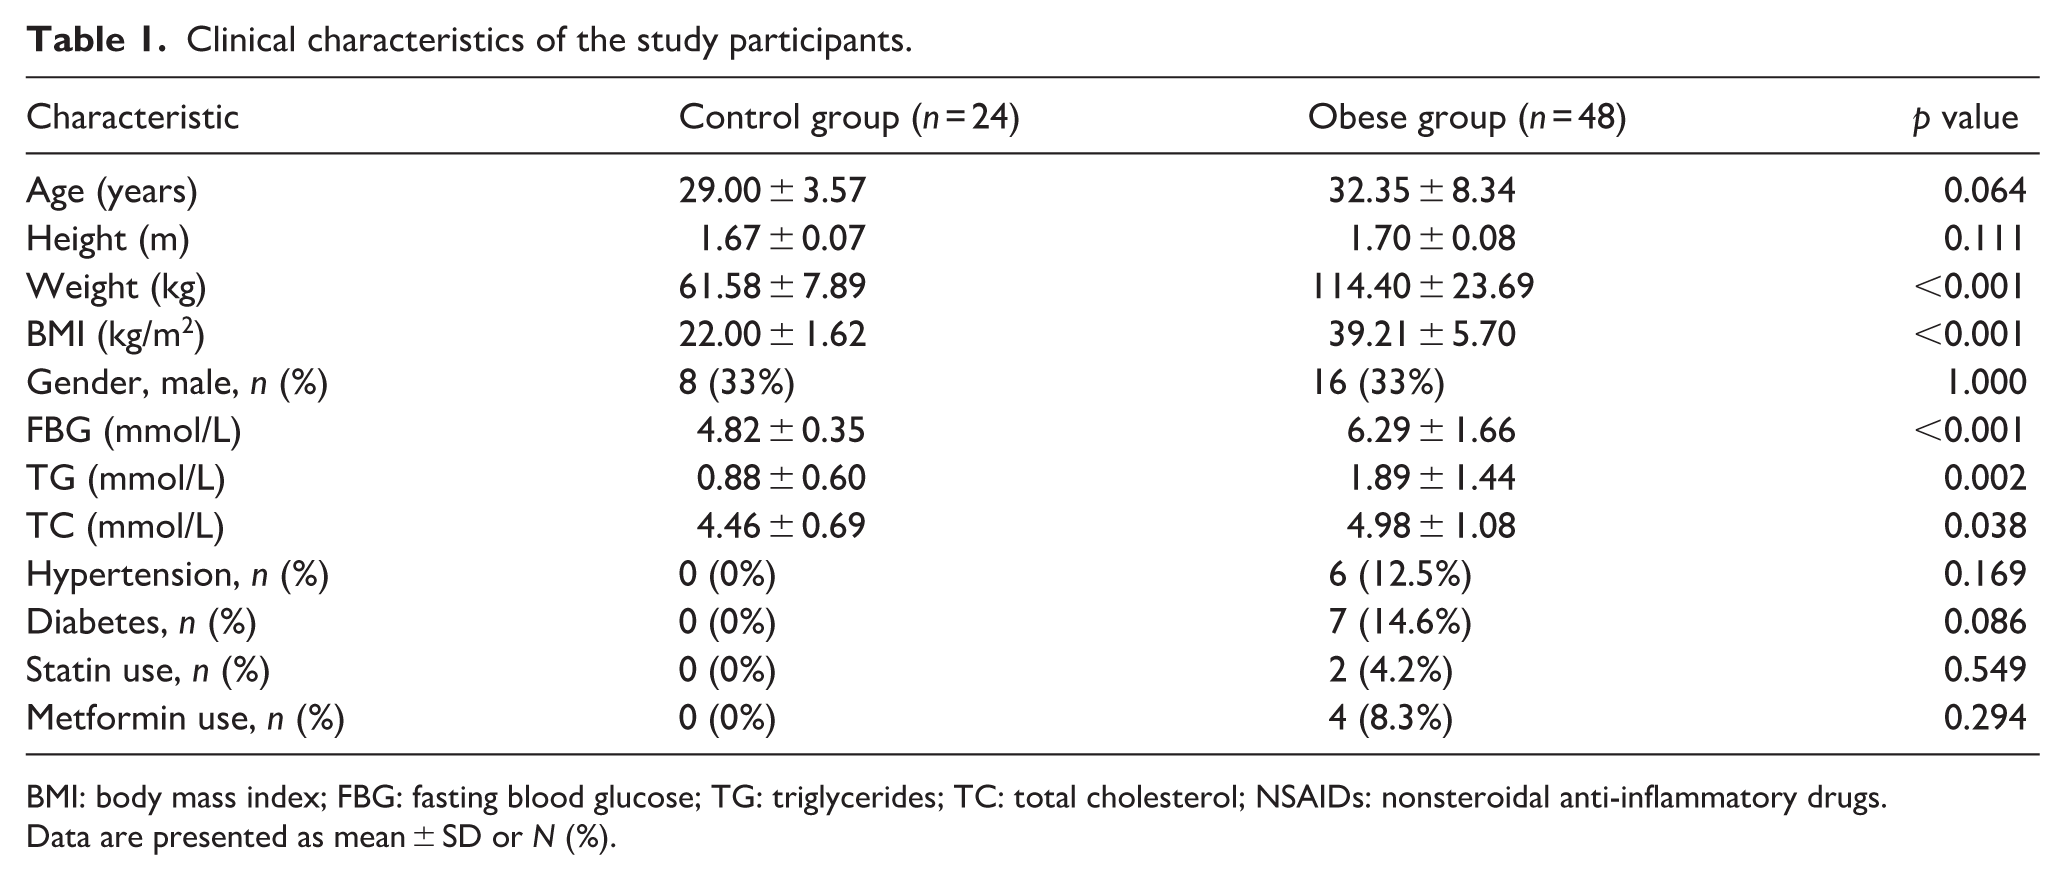
BMI: body mass index; FBG: fasting blood glucose; TG: triglycerides; TC: total cholesterol; NSAIDs: nonsteroidal anti-inflammatory drugs.
Data are presented as mean ± SD or N (%).
Systemic inflammation
Systemic inflammation biomarkers revealed significant differences between groups. After adjustment for age, FBG, TG, and hypertension using multivariable linear regression, plasma IL-6 levels remained significantly higher in the obese group compared with controls (B = 0.869, SE = 0.144, p < 0.001; Table 2). However, TNF-α and ferritin, which showed significant differences in unadjusted analyses (p = 0.021 and p = 0.023, respectively), were no longer statistically significant after adjustment. No significant differences were observed in plasma IL-1β and IL-10 levels. Stratified analyses by FBG or TG levels showed no significant subgroup differences (eFigures S1 and S2).
Adjusted and unadjusted comparisons of plasma biomarkers between the obese and control groups.
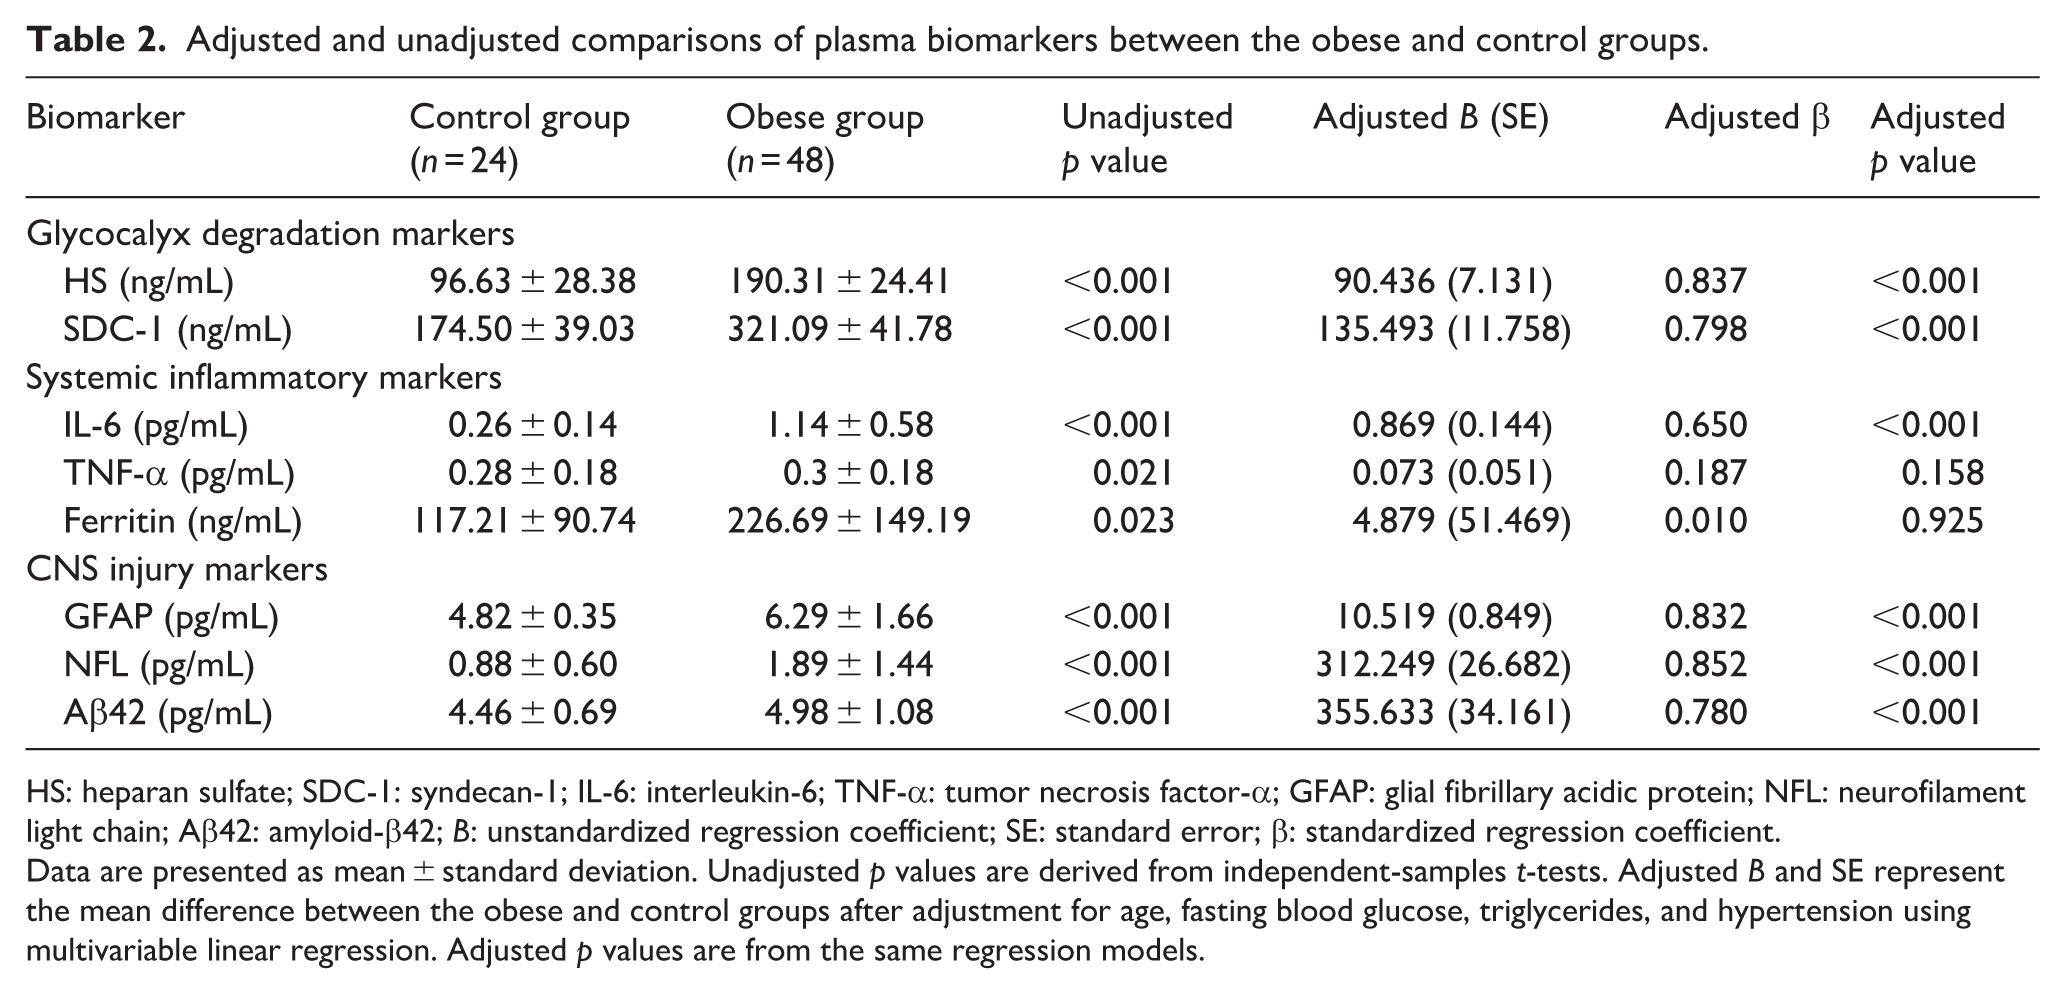
HS: heparan sulfate; SDC-1: syndecan-1; IL-6: interleukin-6; TNF-α: tumor necrosis factor-α; GFAP: glial fibrillary acidic protein; NFL: neurofilament light chain; Aβ42: amyloid-β42; B: unstandardized regression coefficient; SE: standard error; β: standardized regression coefficient.
Data are presented as mean ± standard deviation. Unadjusted p values are derived from independent-samples t-tests. Adjusted B and SE represent the mean difference between the obese and control groups after adjustment for age, fasting blood glucose, triglycerides, and hypertension using multivariable linear regression. Adjusted p values are from the same regression models.
CNS injury biomarkers
Plasma biomarkers of CNS injury were elevated in the obese group. After multivariable adjustment, GFAP levels remained significantly higher in the obese group (B = 10.519, SE = 0.849, p < 0.001), as did NFL (B = 312.249, SE = 26.682, p < 0.001) and Aβ42 (B = 355.633, SE = 34.161, p < 0.001; Table 2). Stratified analyses by FBG or TG showed no significant subgroup differences (eFigures S1 and S2).
White matter microstructure
TBSS-based group comparisons using the JHU-ICBM-DTI-81 atlas demonstrated significantly lower FA values and higher MD values in the obese group compared with controls across multiple white matter tracts, including the genu and body of the corpus callosum, anterior and posterior limbs of the internal capsule, anterior and superior corona radiata, external capsule, cingulum, and superior longitudinal fasciculus (Figure 2). After multivariable adjustment for age, FBG, TG, and hypertension, these group differences remained statistically significant for all FA and MD regions examined (all adjusted p < 0.05, Benjamini-Hochberg corrected; Table 3).
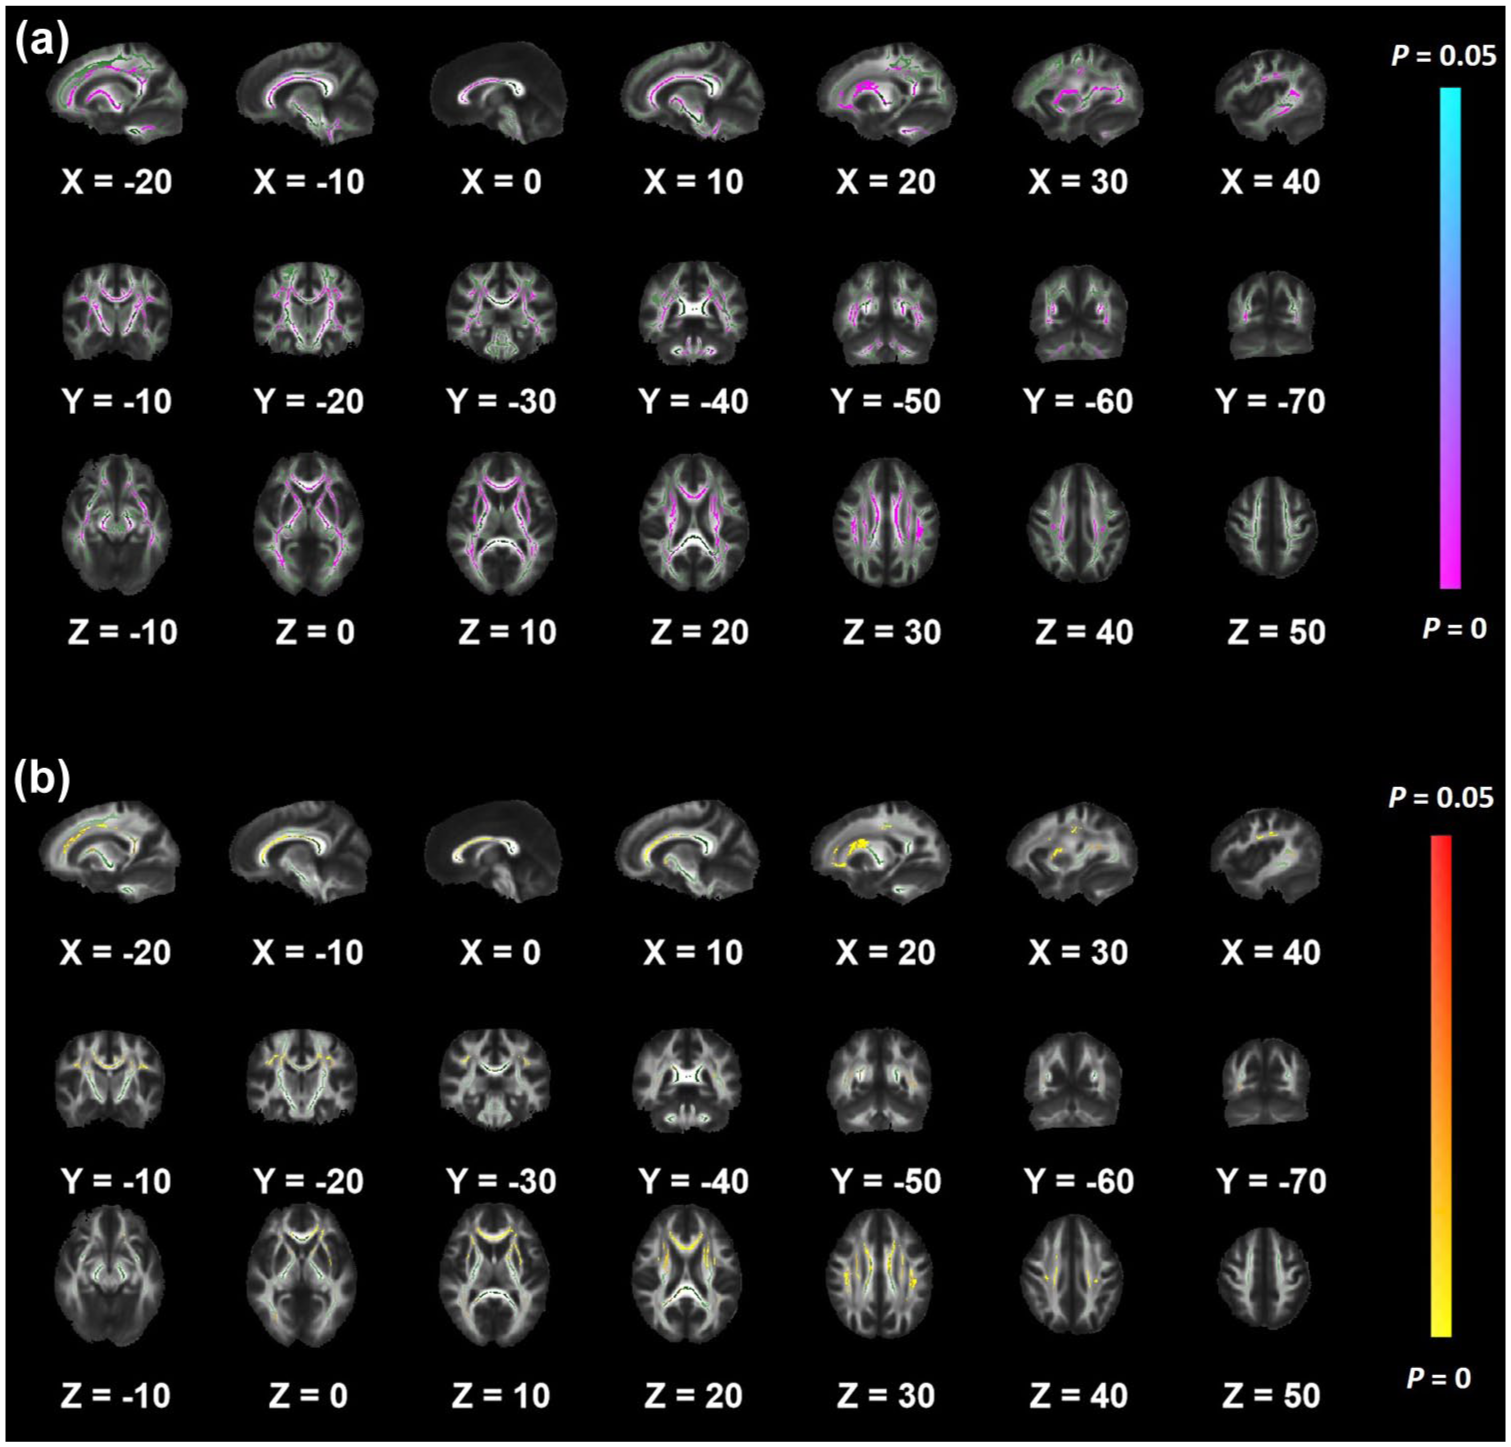
Between-group differences in white matter microstructure based on TBSS. Green indicates the TBSS white-matter skeleton (mean FA). Areas with significantly reduced FA in the obese group compared with controls are shown in magenta–violet, and areas with significantly increased MD are shown in yellow–red, with color intensity corresponding to significance level (p < 0.05). X, Y, and Z values represent slice coordinates in the MNI152 standard space: (a) regions with lower FA in the obese group, mainly involving the corpus callosum, internal capsule, corona radiata, sagittal stratum, external capsule, cingulum, superior longitudinal fasciculus, posterior thalamic radiation, and cerebellar peduncles and (b) regions with higher MD in the obese group, primarily distributed in the corpus callosum (genu, body, and splenium), anterior limb of the internal capsule, corona radiata, posterior thalamic radiation, external capsule, cingulum, and superior longitudinal fasciculus.
Adjusted and unadjusted comparisons of white matter microstructure (DTI metrics) between the obese and control groups.
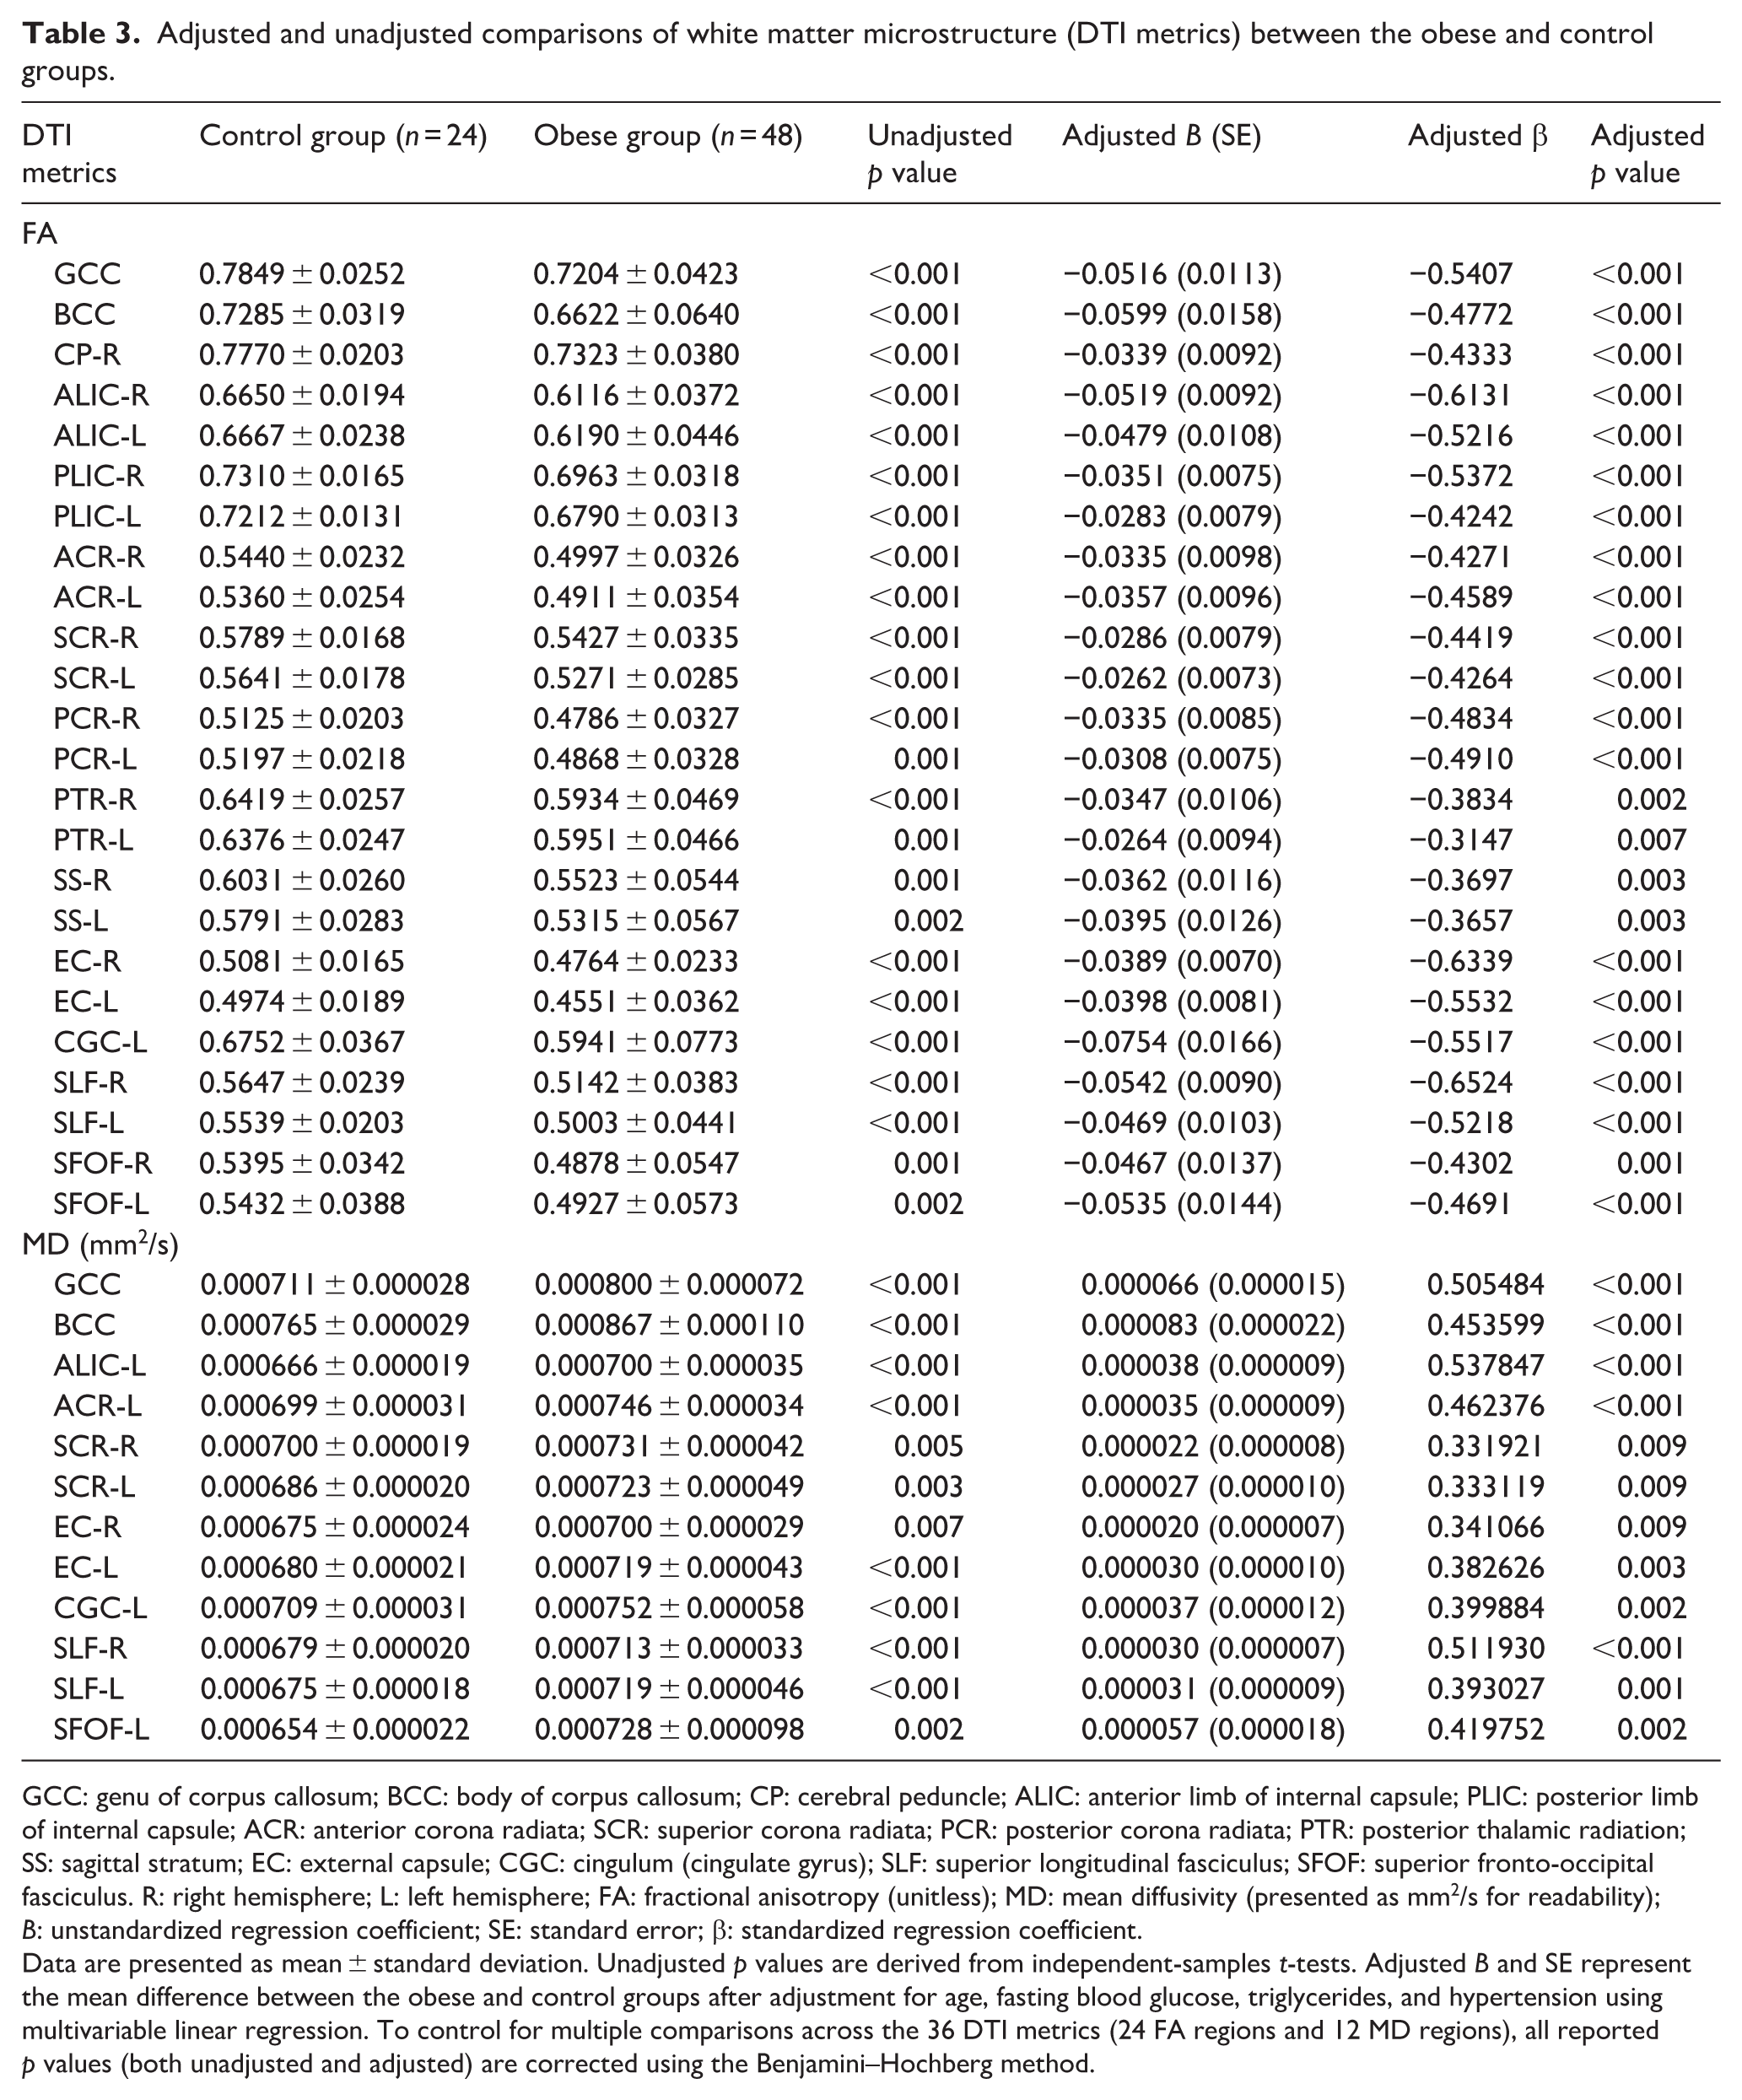
GCC: genu of corpus callosum; BCC: body of corpus callosum; CP: cerebral peduncle; ALIC: anterior limb of internal capsule; PLIC: posterior limb of internal capsule; ACR: anterior corona radiata; SCR: superior corona radiata; PCR: posterior corona radiata; PTR: posterior thalamic radiation; SS: sagittal stratum; EC: external capsule; CGC: cingulum (cingulate gyrus); SLF: superior longitudinal fasciculus; SFOF: superior fronto-occipital fasciculus. R: right hemisphere; L: left hemisphere; FA: fractional anisotropy (unitless); MD: mean diffusivity (presented as mm2/s for readability); B: unstandardized regression coefficient; SE: standard error; β: standardized regression coefficient.
Data are presented as mean ± standard deviation. Unadjusted p values are derived from independent-samples t-tests. Adjusted B and SE represent the mean difference between the obese and control groups after adjustment for age, fasting blood glucose, triglycerides, and hypertension using multivariable linear regression. To control for multiple comparisons across the 36 DTI metrics (24 FA regions and 12 MD regions), all reported p values (both unadjusted and adjusted) are corrected using the Benjamini–Hochberg method.
Endothelial glycocalyx degradation
Plasma HS and SDC-1 levels were significantly higher in the obese group than in controls. These differences persisted after multivariable adjustment for age, FBG, TG, and hypertension (HS: B = 90.436, SE = 7.131, p < 0.001; SDC-1: B = 135.493, SE = 11.758, p < 0.001; Table 2). Stratified analyses by FBG or TG yielded consistent results (eFigures S1 and S2).
Correlation analyses
Pairwise correlation heatmaps demonstrated significant interrelationships among systemic inflammation, glycocalyx degradation, and CNS injury biomarkers. Zero-order Pearson correlations (Figure 3, lower triangle) showed that IL-6, HS, and SDC-1 were significantly correlated with GFAP, NFL, and Aβ42 (all p < 0.01). After partial correlation adjustment for age, hypertension, FBG, TG, and BMI (Figure 3, upper triangle), strong correlations among glycocalyx degradation markers (HS, SDC-1) and CNS injury markers (GFAP, NFL, Aβ42) remained statistically significant (all p < 0.05). However, some previously significant associations involving IL-6 (e.g. IL-6 with SDC-1 and Aβ42) were attenuated and no longer reached statistical significance. Further analyses revealed that higher plasma levels of HS and SDC-1 were associated with lower mean FA values and higher MD values in TBSS-significant white-matter tracts (Figure 4). After partial correlation adjustment for age, hypertension, FBG, TG, and BMI, HS remained significantly correlated with DTI metrics across multiple white matter tracts, whereas correlations involving SDC-1 were largely attenuated and no longer significant (Figure 4(b) and (d)). GFAP, NFL, and Aβ42 also exhibited significant correlations with FA reductions and MD elevations, with similar patterns persisting after adjustment. These findings suggest that systemic inflammation and endothelial injury are closely associated with white-matter microstructural alterations in adults with or without obesity.
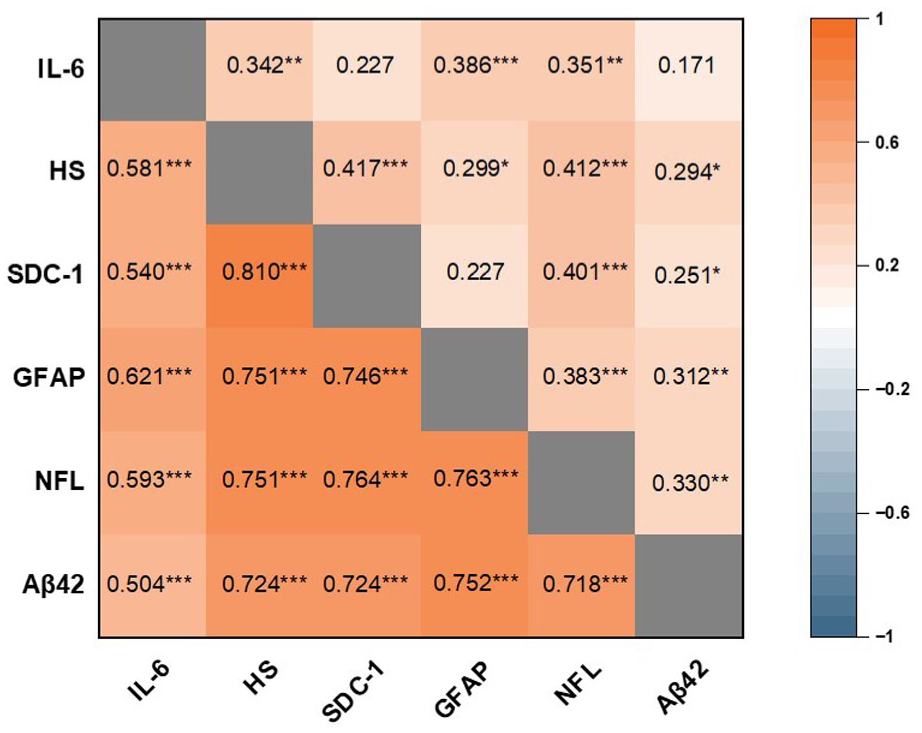
Correlations among plasma biomarkers. Heatmap displaying zero-order Pearson correlations (lower triangle) and partial correlations adjusted for age, hypertension, triglycerides, fasting blood glucose, and BMI (upper triangle) among six plasma biomarkers (n = 72). Orange indicates positive correlations, with color intensity reflecting the magnitude of the correlation coefficient. The gray diagonal represents the line of unity (correlation = 1) and separates the lower and upper triangles.
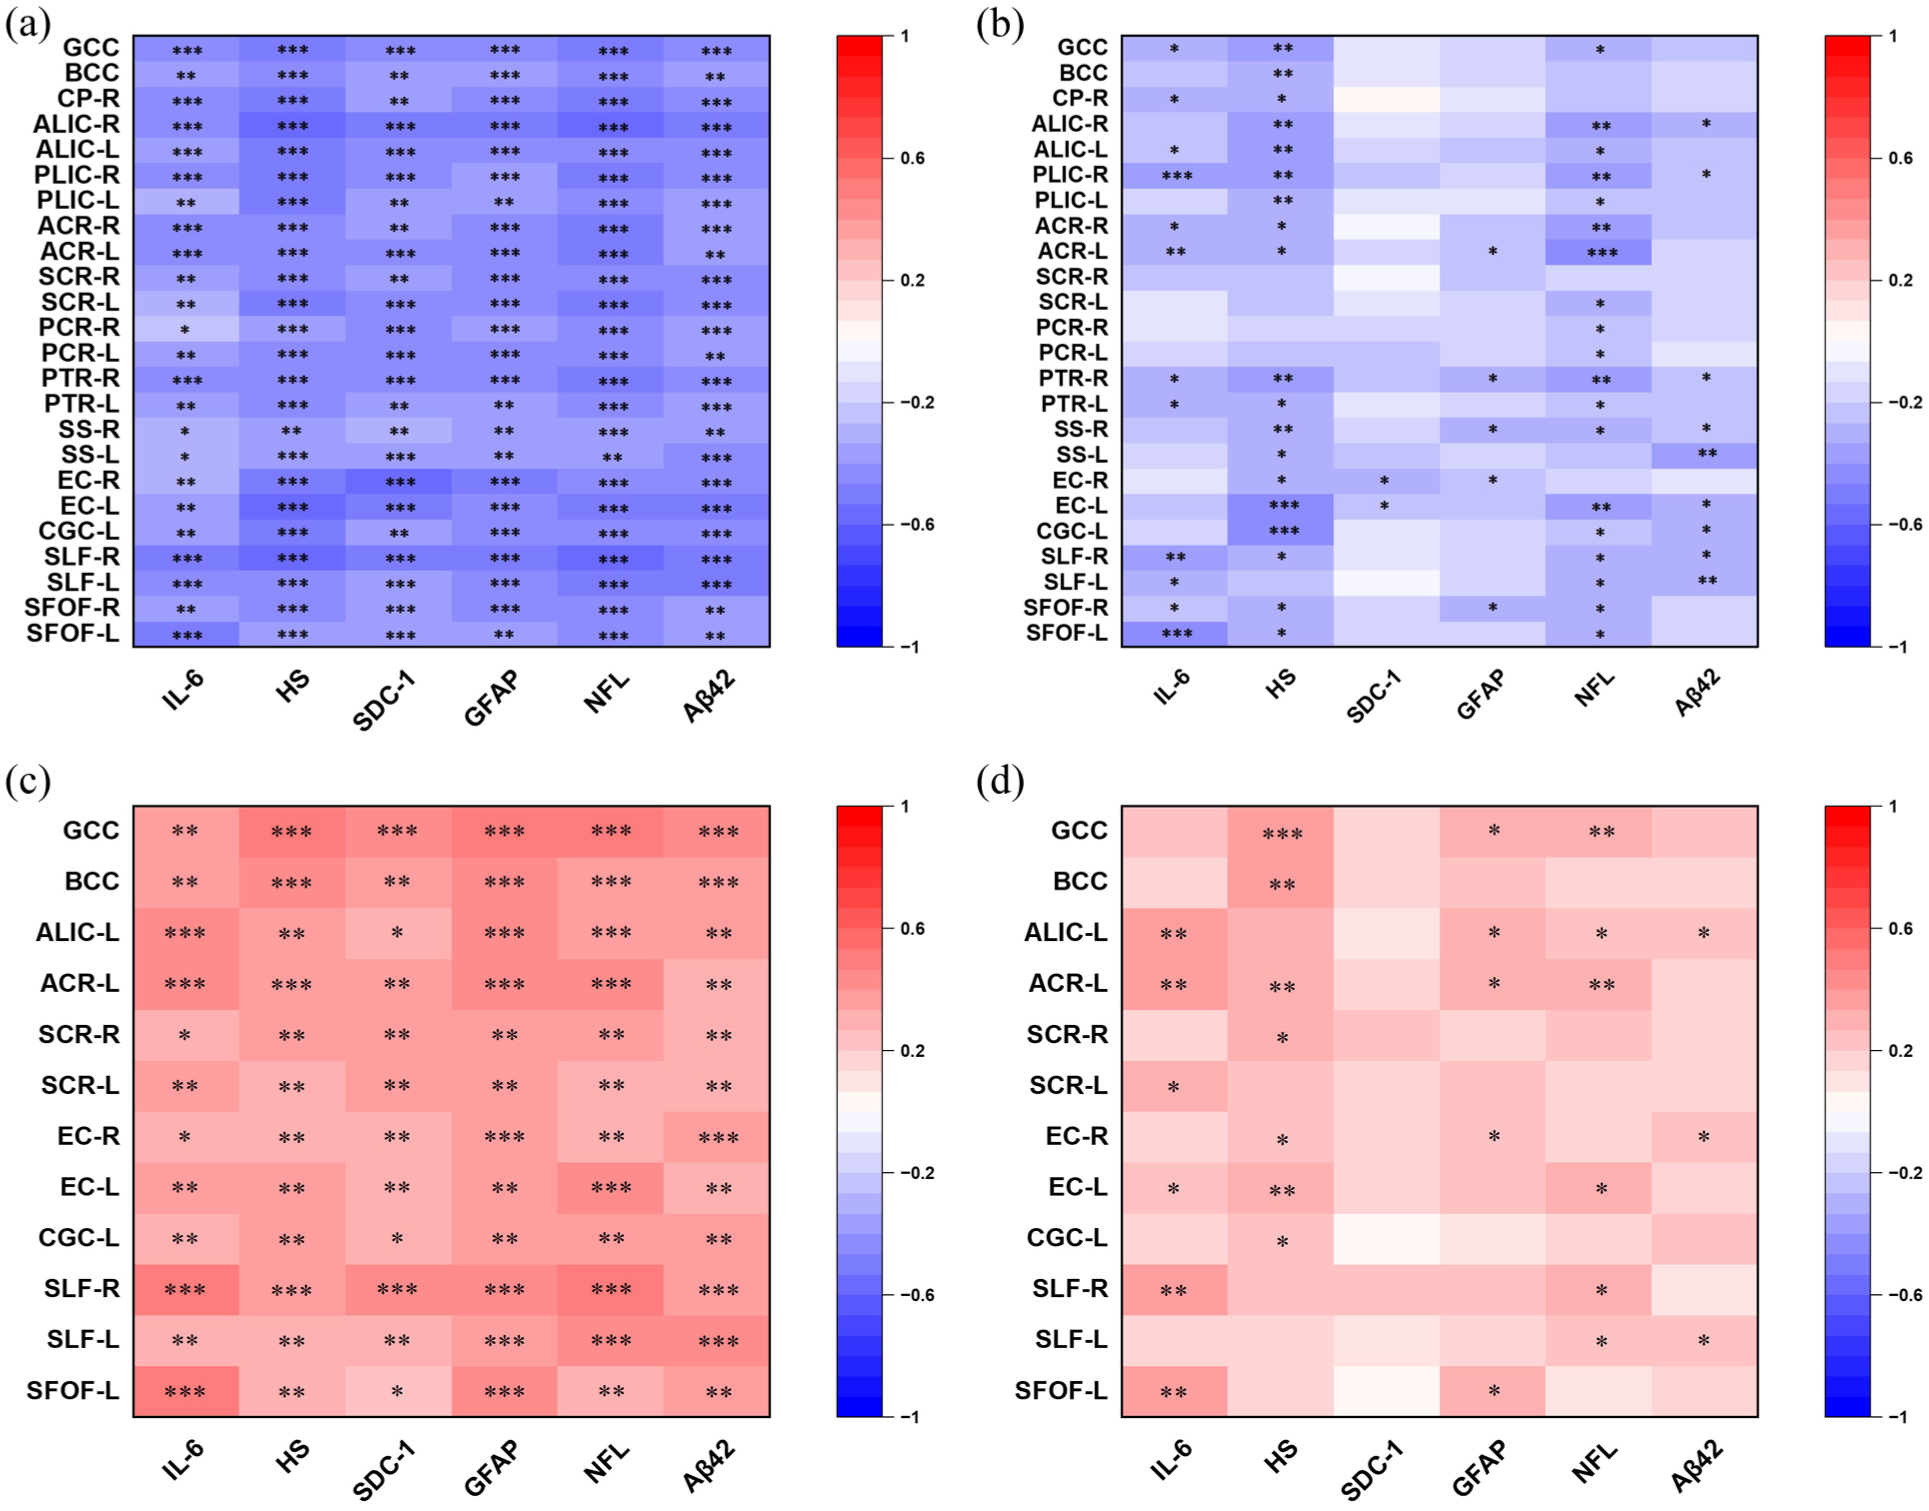
Correlations between plasma biomarkers and DTI metrics. Heatmaps showing correlations between six plasma biomarkers (IL-6, HS, SDC-1, GFAP, NFL, Aβ42) and white matter microstructure metrics derived from DTI: (a, b) correlations with FA and (c, d) correlations with MD. (a, c) Zero-order Pearson correlation coefficients (unadjusted). (b, d) Partial correlation coefficients adjusted for age, hypertension, triglycerides, fasting blood glucose, and BMI (n = 72). The color scale represents the magnitude and direction of correlations, with red indicating positive and blue indicating negative correlations. Coefficients without asterisks are not statistically significant (p ⩾ 0.05). Brain region abbreviations are as defined in Table 3 (e.g. GCC, BCC, ALIC). Comparison between unadjusted and adjusted panels illustrates the impact of metabolic and vascular confounders on the observed associations.
Discussion
This study investigated systemic inflammation, endothelial glycocalyx degradation, and CNS injury in adults with or without obesity, and explored the associations among these biological markers in a cross-sectional investigation.
Our findings demonstrated that plasma markers of systemic inflammation (IL-6), endothelial glycocalyx degradation (HS and SDC-1), and CNS injury (GFAP, NFL, and Aβ42) were significantly elevated after adjustment in individuals with obesity compared with normal-weight controls. Partial correlation analyses further revealed significant interrelationships among glycocalyx degradation markers (HS, SDC-1) and CNS injury markers (GFAP, NFL, Aβ42), as well as associations between circulating biomarkers and white-matter microstructural alterations measured by DTI (Figures 3 and 4). Under chronic low-grade inflammatory conditions, IL-6 and TNF-α activate endothelial cells, inducing the expression of heparinase and other glycosidases, thereby promoting the shedding of glycocalyx components such as HS and SDC-1.21–23 The resulting structural and functional weakening of the endothelial surface layer may alter vascular barrier properties and inflammatory responsiveness, thereby promoting long-term systemic inflammation effects on neurovascular structures. Our findings indicate a coordinated pattern linking systemic inflammation, endothelial dysfunction, and neural structural changes in obesity, partially independent of metabolic and vascular confounders.
DTI analysis further demonstrated reduced FA and increased MD values in multiple white-matter tracts, including the corpus callosum, internal capsule, and superior longitudinal fasciculus. These regions are critical for cognitive and emotional processing, their impaired function indicates microstructural disconnection within neural pathways associated with executive function and memory.24,25 Notably, alterations were observed in the genu and body of the corpus callosum connecting the prefrontal and orbitofrontal cortices, 26 suggesting potential early-stage cognitive vulnerability despite the absence of overt emotional symptoms in this cohort. Elevated plasma levels of GFAP, NFL, and Aβ42 further corroborate axonal and astrocytic injury.27,28 However, given the cross-sectional design, the temporal sequence among systemic inflammation, endothelial alterations, and neural injury cannot be determined.
The endothelial glycocalyx plays a central role in vascular homeostasis, including regulation of vascular permeability, inflammatory signaling, and mechanotransduction. Increased circulating HS and SDC-1 levels are widely recognized as markers of systemic endothelial glycocalyx shedding. In the present study, elevated glycocalyx degradation markers were associated with both inflammatory and neural injury biomarkers, suggesting that endothelial dysfunction may represent an important vascular phenotype in obesity. Stratified analyses based on FBG or TG levels showed that these elevations were consistently observed across different metabolic strata, indicating that glycocalyx degradation is a characteristic feature of obesity independent of glucose and lipid metabolic status (eFigures S1 and S2). Notably, in partial correlation analyses adjusting for age, hypertension, FBG, TG, and BMI, HS remained significantly correlated with DTI metrics across multiple white matter tracts, whereas correlations involving SDC-1 were largely attenuated and no longer significant after full adjustment. This discrepancy may reflect distinct roles of these glycocalyx components: HS, as a major constituent of the endothelial glycocalyx backbone, may be more directly linked to vascular permeability and blood–brain barrier integrity, while SDC-1, as a transmembrane proteoglycan, may be more closely related to inflammatory signaling and show weaker direct associations with brain structure after accounting for metabolic confounders. However, because HS and SDC-1 were quantified from peripheral blood, these markers reflect systemic endothelial glycocalyx shedding and should not be interpreted as direct measurements of cerebral microvascular or blood–brain barrier glycocalyx integrity.29,30
Although the prevalence of hypertension, diabetes, statin use, and metformin use did not differ significantly between groups, these factors independently affect inflammatory and endothelial outcomes. Hypertension and diabetes may overestimate the obesity‑associated differences, 31 whereas statins and metformin may underestimate the true pathological effects of obesity.32,33 Nevertheless, after adjusting for hypertension and fasting blood glucose, the obese population still showed significant upregulation of plasma inflammatory responses, glycocalyx damage, and central injury markers, and we cannot deny the potential bias caused by the independent effects of these factors on inflammation and endothelial function.
Our cohort was relatively young (mean age 29–32 years), and no participants reported NSAID use within the past 3 months. Although NSAID use is common in obese populations due to a higher prevalence of joint pain, the absence of such use in this cohort is likely explained by the young age and the restricted 3‑month reporting window.
Several limitations should be acknowledged. First, the relatively modest sample size (n = 72) limited the statistical power of subgroup analyses and also meant that comparisons of comorbidity and medication history between groups were underpowered; therefore, the non‑significant p values do not rule out clinically meaningful disparities in these variables. Second, circulating HS and SDC-1 reflect systemic endothelial glycocalyx shedding and do not directly measure cerebral microvascular or blood–brain barrier integrity. Third, because of the cross-sectional design, causal or temporal relationships among systemic inflammation, endothelial glycocalyx degradation, and CNS injury cannot be inferred. Fourth, this study did not assess clinical manifestations of neurovascular dysfunction, such as cognitive decline or neurological symptoms; therefore, the clinical relevance of our findings remains to be established in future longitudinal studies. Longitudinal studies and mechanistic experimental models are required to clarify the directional relationships among these biological processes.
In summary, adults with obesity exhibited elevated systemic inflammatory markers, increased circulating indicators of endothelial glycocalyx degradation, higher plasma markers of CNS injury, and altered white-matter microstructure. These findings demonstrated significant associations among inflammatory, vascular, and neural injury markers in obesity, highlighting endothelial glycocalyx degradation as a potential biomarker of neurovascular vulnerability in the obese population.
Supplemental Material
sj-docx-1-jcb-10.1177_0271678X261459818 – Supplemental material for Endothelial glycocalyx degradation, systemic inflammation, and central nervous system injury: A comparative cohort study in adults with and without obesity
Supplemental material, sj-docx-1-jcb-10.1177_0271678X261459818 for Endothelial glycocalyx degradation, systemic inflammation, and central nervous system injury: A comparative cohort study in adults with and without obesity by Yuwei Guo, Xiaojian Fu, Ruiqing Xu, Yihuan Chen, Yuran Zhao, Lingqi Gao and Qiong Yu in Journal of Cerebral Blood Flow & Metabolism
Footnotes
Acknowledgements
The authors thank Prof. Xiaolei Lin, Data Analysis Specialist at the Institute of Medical Research, Huashan Hospital, Fudan University, for her expert advice on sample size estimation and statistical methodology. All individuals mentioned in this paper have consented to attribution.
Author contributions
Qiong Yu and Xiaojian Fu conceived and designed the study. Yuwei Guo, Ruiqing Xu, Yihuan Chen, and Yuran Zhao acquired the data. Yuwei Guo, Ruiqing Xu, and Lingqi Gao analyzed and interpreted the data. Yuwei Guo and Lingqi Gao drafted the manuscript. Qiong Yu and Xiaojian Fu critically revised the manuscript for important intellectual content. Lingqi Gao performed the statistical analysis. Qiong Yu and Lingqi Gao obtained funding. Ruiqing Xu and Yihuan Chen provided administrative, technical, and material support. Qiong Yu supervised the study.
Funding
The authors disclosed receipt of the following financial support for the research, authorship, and/or publication of this article: This work was supported by the National Natural Science Foundation of China (no. 82171188 to QY and no. 82301446 to LG).
Declaration of conflicting interests
The authors declared no potential conflicts of interest with respect to the research, authorship, and/or publication of this article.
Ethical considerations
This study was approved by the Ethics Committee of Huashan Hospital, Fudan University (approval no. KY2024-697). All procedures involving human participants were conducted in accordance with the Declaration of Helsinki.
Consent to participate
Written informed consent was obtained from all participants prior to enrollment.
Consent for publication
Not applicable.
Data availability statement
The data that support the findings of this study are available from the corresponding authors upon reasonable request for academic purposes.
Supplemental material
Supplemental material for this article is available online.
References
Supplementary Material
Please find the following supplemental material available below.
For Open Access articles published under a Creative Commons License, all supplemental material carries the same license as the article it is associated with.
For non-Open Access articles published, all supplemental material carries a non-exclusive license, and permission requests for re-use of supplemental material or any part of supplemental material shall be sent directly to the copyright owner as specified in the copyright notice associated with the article.