
Abstract
Loss of locus coeruleus (LC) integrity, a debilitating feature of Alzheimer’s disease (AD), can be visualized in vivo with MRI. Longitudinal investigation across the AD spectrum can elucidate the timing of LC damage and its behavioral correlates. Cognitively normal adults (n = 153), individuals with mild cognitive impairment (n = 73), and with AD (n = 43) underwent MR imaging to assess LC integrity, PET imaging to assess tau and Aβ ([18F]MK6240 and [18F]AZD4694, respectively) and completed a battery of cognitive tests. For a subset of participants, these assessments were repeated annually for up to 4 years. Linear mixed effects analysis examined the association of time and cognitive performance with LC signal. Reduction in LC integrity over time was significant for patients early in the course of AD (t95 = −3.72, p = 0.0003) but not in later AD phases or healthy aging. In AD participants, several cognitive measures correlated with LC integrity including logical memory (t64 = 2.57, p = 0.013) and object recognition (t64 = 3.41, p = 0.001). LC imaging reveals degeneration of the LC-norepinephrine system within subjects over time in early AD phases. LC damage correlates to cognitive impairment and the strong relationship observed of LC signal to object recognition could suggest an important role of this system in novelty detection in AD.
Introduction
The locus coeruleus (LC) is the primary source of norepinephrine (NE) in the brain. This neuromodulator exerts widespread influence over most brain cortical and subcortical regions.1–4 NE released from the LC during arousing, mentally challenging, or novel stimuli supports several cognitive processes including episodic memory, working memory, and cognitive control.5,6 Neurodegeneration and dysfunction of the LC–NE system occurs in Alzheimer’s disease (AD) and other neurodegenerative disorders7–11 and is associated with cognitive deficits related to learning, memory, and decision making.5,6,12 The LC may be the first brain structure to begin accumulating hyperphosphorylated tau, even in some cases decades prior to onset of AD and may propagate the spread of tau in the brain.13–15 Later in the illness course, this is succeeded by alterations in LC structure and function and ultimately degeneration of LC neurons.16–22 LC–NE system dysregulation also disrupts the important role of this system in neuroprotection. 23 The consequences of these insults to the LC–NE system on the pathophysiology and symptoms of AD are not adequately understood and more work is needed to disentangle the role of the LC within the cascade of other pathological processes.
To support this line of research, recent studies have employed in vivo imaging of the LC using a method sometimes referred to as neuromelanin-sensitive MRI (NM–MRI) that provides a reproducible and practical method to assay LC integrity.24,25 Reduced LC signal, reflecting degeneration of norepinephrine neurons in this structure26,27 is observed in Alzheimer’s disease (AD)28–30 where it is correlated to other pathophysiological markers, including cortical atrophy and amyloid (Aβ) and tau burden throughout the brain.31,32 In individuals with mild cognitive impairment (MCI), reduced LC signal is also observed, 33 especially in those who convert to AD.34,35 However, inferring LC signal loss on the basis of low LC signal in cross-sectional data is suboptimal and there has been little longitudinal work to investigate LC signal loss within individuals over time. This would support more accurate identification of when LC signal loss begins, when it is most pronounced, and what are its behavioral consequences, thereby elucidating its potential as an early marker of AD risk.
Given the important role of the LC–NE system in cognition, several studies have examined the correlation of LC signal loss to cognitive impairment in cognitively normal older adults, as well as MCI and AD patients.31,36 In work combining older adults with and without MCI, associations were found between reduced rostral/middle LC–CNR and several cognitive domains: verbal fluency, episodic memory, and processing speed with these relationships driven more strongly by individuals with MCI.31,37 In healthy aging, some studies have found LC signal to be positively associated with global cognition, 38 episodic memory, 39 and other specific cognitive functions (e.g. emotional regulation, inhibitory control, and emotional memory), 38 while other studies in cognitively normal older adults found no correlations between LC signal and cognition35,40 consistent with the possibility that variation in LC signal in the absence of degeneration has minimal effects on cognition. Differences between studies in the strictness of the definition of “healthy aging” could account for some of these discrepancies. Consistent with this, one study in older adults found tau pathology to mediate the correlation between LC signal and memory performance. 32
While progress has been made including several longitudinal studies of LC imaging in clinical or preclinical AD,32,33,41 more work is needed to characterize the time course of LC degeneration, especially relative to the first presence of tau and Aβ, and its association with cognitive decline. Thus, the current study aims to examine LC signal loss longitudinally in a large sample spanning older adults with and without AD pathology. We quantify the LC NM–MRI signal using our validated automated LC segmentation method, 42 and test the correlations between a summary measure of LC integrity and multiple cognitive measures across and within different groups of older adults stratified based on PET-imaging markers of Aβ and tau burden. The cognitive measures examined include global cognition, verbal memory, working memory, executive function, speed of processing, object recognition, and verbal fluency.
Methods
Participants
Study participants (n = 269), over 50 years of age from the community or outpatients at the McGill University Research Centre for Studies in Aging were enrolled in the Translational Biomarkers of Aging and Dementia (TRIAD) cohort, 43 McGill University, Canada. Participants had a detailed clinical assessment, including the Clinical Dementia Rating Scale (CDR) and Mini Mental State examination (MMSE; for clinical and demographic description of the sample, see Table 1). Cognitively unimpaired participants had no objective cognitive impairment and a CDR score of 0. Mild cognitive impairment (MCI) individuals had subjective and objective cognitive impairment, preserved activities of daily living, and a CDR score of 0.5. Patients with mild-to-moderate sporadic AD dementia had a CDR score between 0.5 and 2 and met the National Institute on Aging and the Alzheimer’s Association criteria for probable AD determined by a physician. 44 Participants were excluded if they had other inadequately treated conditions, active substance abuse, recent head trauma, major surgery, or MRI/PET safety contraindication. AD patients did not discontinue medications for this study. The Douglas Institute Research Ethics Board approved this study. Study procedures were carried out consistent with the Declaration of Helsinki principles and all participants provided written informed consent.
Participant characteristics.
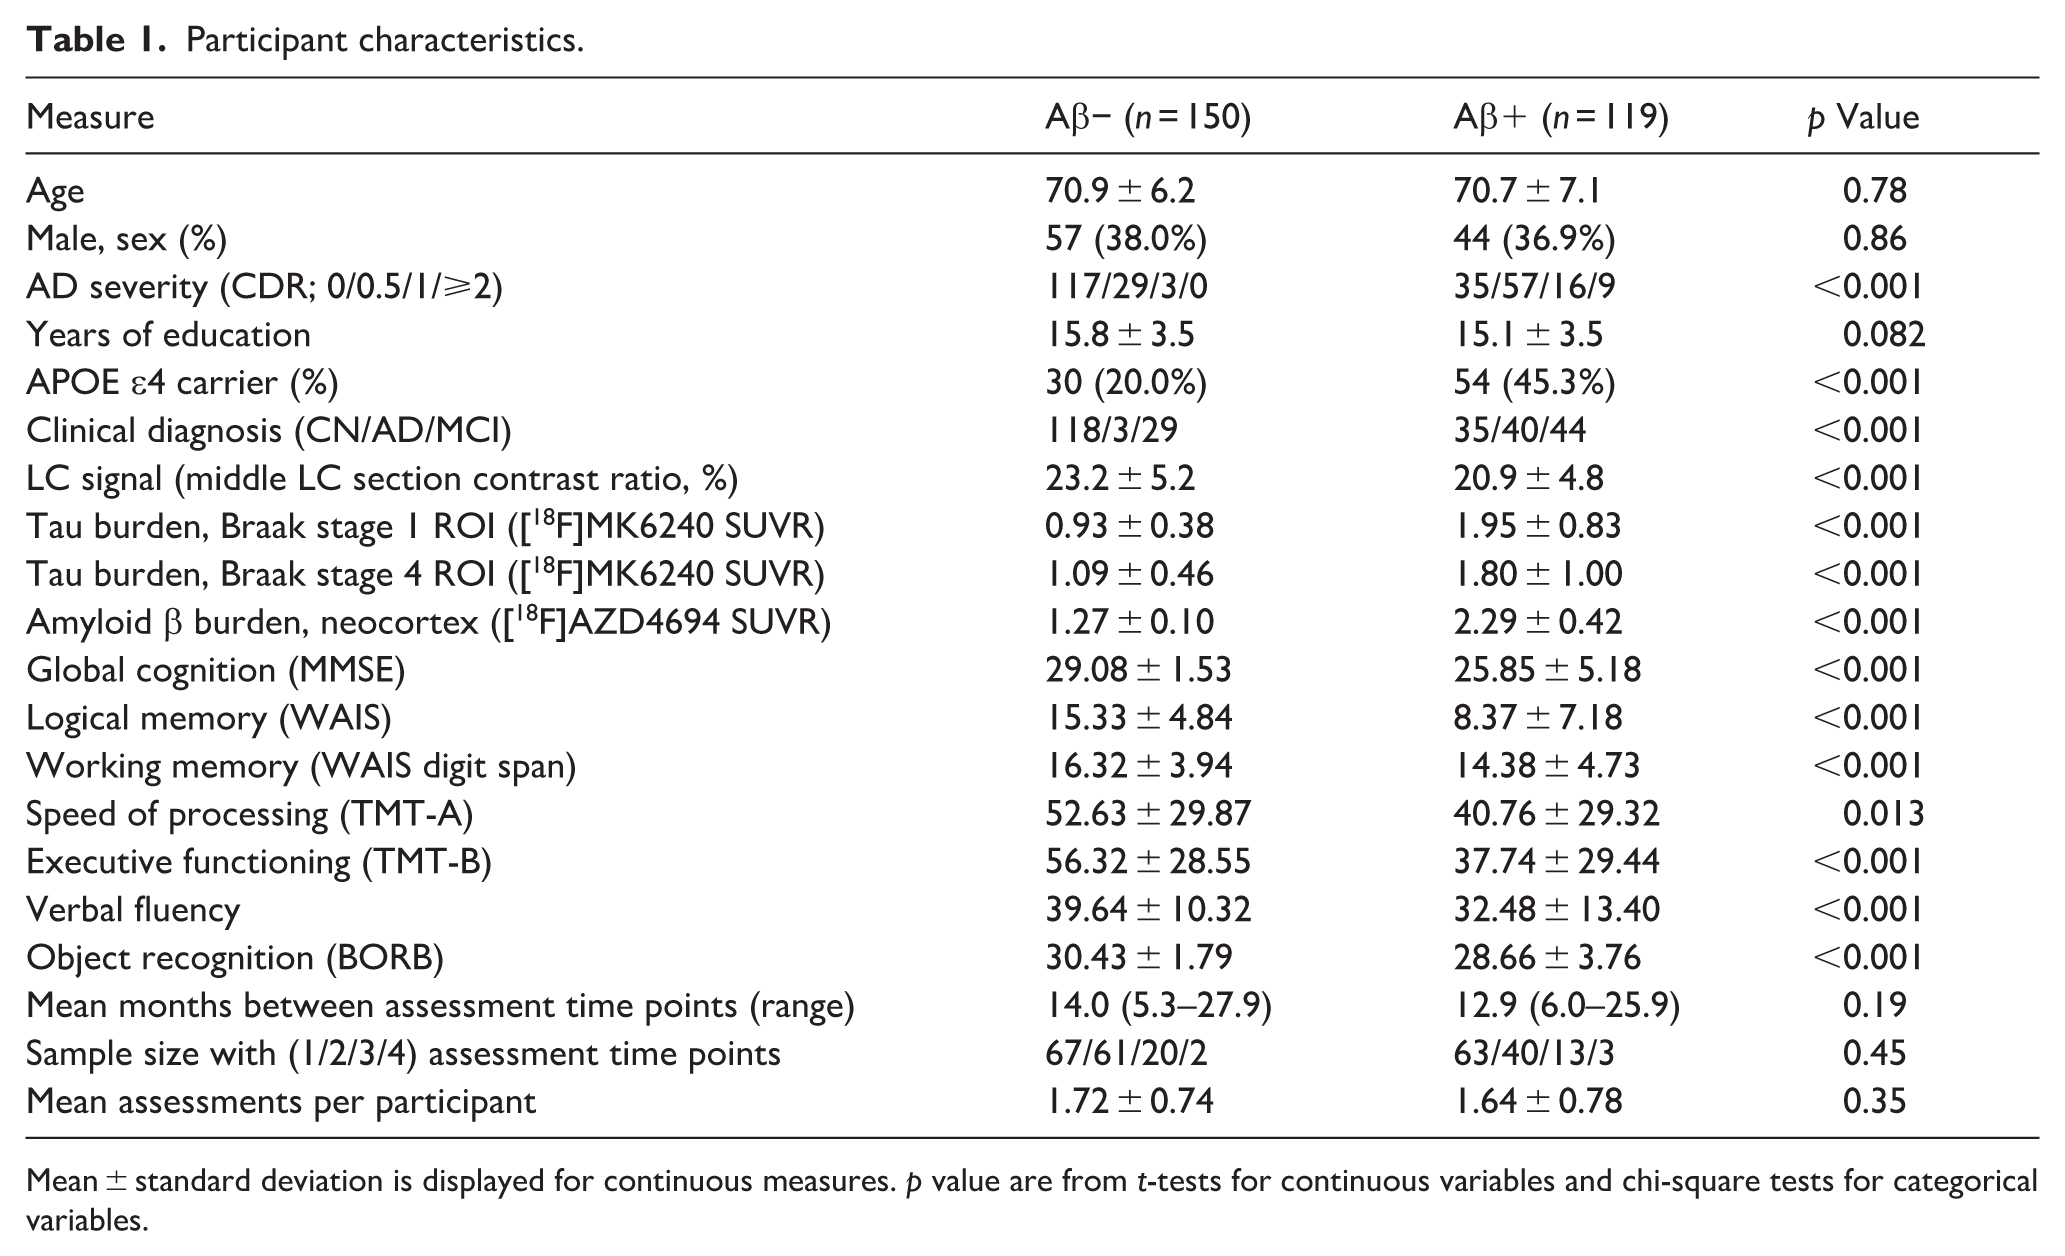
Mean ± standard deviation is displayed for continuous measures. p value are from t-tests for continuous variables and chi-square tests for categorical variables.
Cognitive measures
The Mini-Mental State Examination (MMSE) evaluates orientation, memory, attention, language, and visuospatial skills. We employ the total score reflecting performance on all tasks. 45 The Birmingham Object Recognition Battery (BORB) assesses object recognition using 32 items consisting of drawings of tools and animals. Half of the pictures depict a chimera of two animals (e.g. head of a donkey on a cow’s body). Participants must recognize whether a real or an unreal object is depicted. 46 The Trail Making Test (TMT) consists of part A (TMT-A) wherein participants connect numbers sequentially on a sheet of paper and part B where numbers and letters are connected in alternating sequence. Scoring considers speed and accuracy. The Digit Span Test is a component of the Wechsler Adult Intelligence Scale—Third Edition (WAIS-III) wherein participants repeat a sequence of digits in the forward and reverse order. 47 Logical memory is a subtest in the Wechsler Memory Scale-IV (WMS-IV) wherein participants listen to stories and recall as many details as possible. We used the immediate recall score (logical memory I). 48 The verbal fluency test requires participants to produce as many words as possible within a semantic category (category fluency condition) and starting with a given letter (letter fluency). We employ the combined score from both conditions. 49
MRI acquisition
All neuroimaging data were acquired at the Montreal Neurological Institute (MNI). Magnetic resonance (MR) images were acquired on a 3 T Prisma-Fit Siemens scanner. NM–MRI images were collected via a turbo spin echo sequence with the following parameters: repetition time (TR) = 600 ms; echo time (TE) = 10 ms; flip angle = 120°; turbo factor = 4; in-plane resolution = 0.6875 × 0.6875 mm2; partial brain coverage overlaying the pons and midbrain with field of view = 165 × 220; number of slices = 20; slice thickness = 1.8 mm; number of averages = 7; acquisition time = 8.45 min. Whole-brain, T1-weighted MR images (resolution = 1 mm, isotropic) were acquired using an MPRAGE sequence for preprocessing of the NM–MRI and PET data. Quality of MR images was visually inspected for artifacts immediately upon acquisition, and scans were repeated when necessary, time permitting.
NM–MRI processing
LC signal was measured using a semi-automated algorithm developed by our group (see previous papers for more complete description of the algorithm and performance of the method in terms of reliability and performance in the context of AD42,50). This “Funnel-Tip” method performs an intensity-threshold-free cluster search within an overinclusive mask of the LC that has been transformed from standardized space to native space. It thereby estimates the signal from the LC at its hyperintense putative “core” on each cross-sectional (axial) slice through the structure. Similar to other algorithms, it calculates contrast-to-noise ratio (CNR) of the LC relative to a central pons reference region, applies an LC search mask on native space NM–MRI images 51 and divides the LC into rostrocaudal sections 52 (we calculated LC signal for five sections on the right and left side; see Figure 1(a) for LC segmentation in a representative participant).
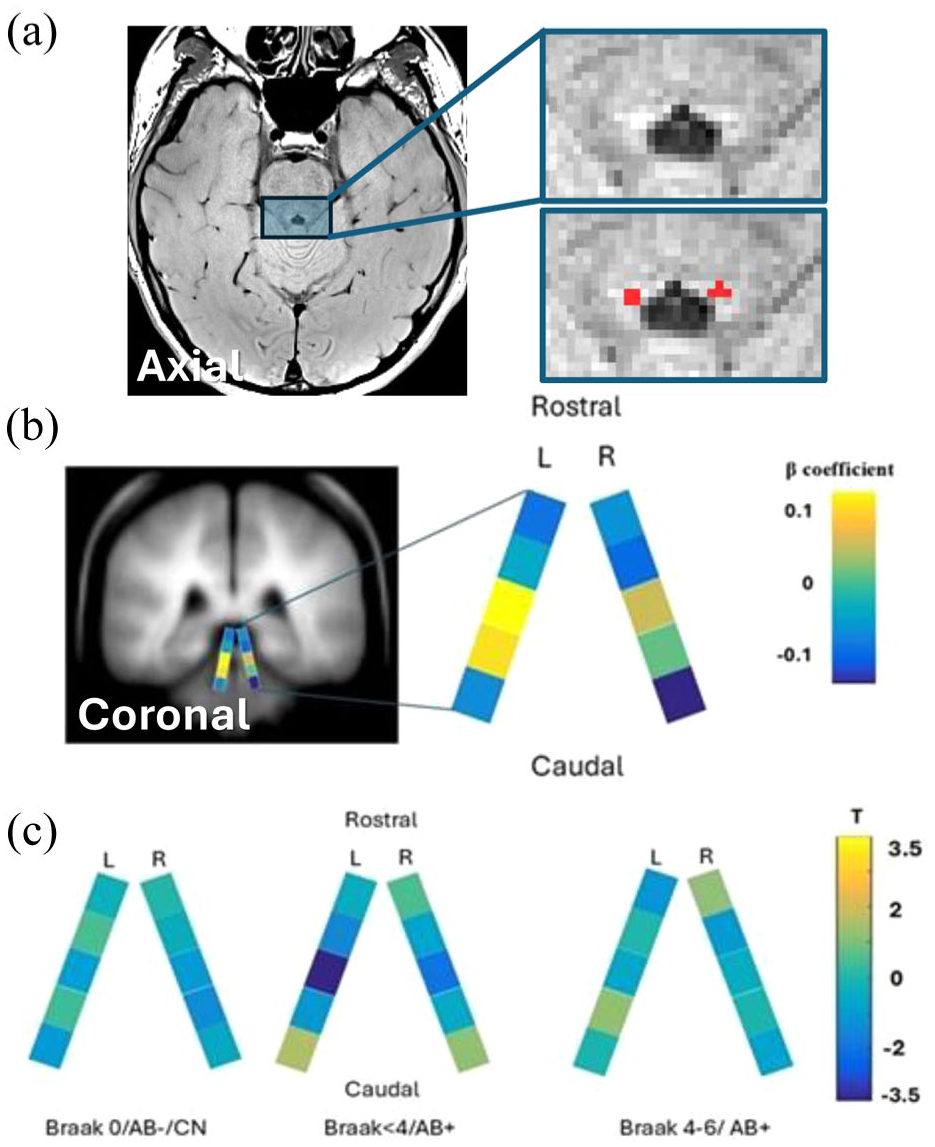
LC segmentation and measurement of LC signal in rostrocaudal sections: (a) LC segmentation for a representative subject using the Funnel-Tip method. A single axial slice shows the LC in cross-section (in red, four voxels per side on each axial slice covered by the overinclusive LC mask, only the most hyperintense of the four is retained), (b) schematic map of the LC showing weights used to derive the summary measure of LC integrity for each participant (LC patternCN). The colors reflect coefficients for each LC section derived from a logistic regression predicting CN status. High signal in the middle of the LC relative to its rostral and caudal ends is associated with greater odds of a participant being CN. These coefficients were then applied to the sectionwise LC values from each participant to calculate their LC patternCN value, and (c) longitudinal change in LC signal across rostrocaudal sections in sub-groups of participants at different stages of AD.
We used a multivariate approach, guided by work in other neuroimaging modalities, 53 to generate a single metric of LC integrity that incorporates information from all LC sections and reflects the extent to which an individual’s pattern of LC signal across sections is AD-like or healthy (CN-like). To make this metric, we first carried out a mixed-effects logistic regression analysis (fitglme with “binomial” distribution and “logit” link function in MATLAB) with clinical diagnosis of AD as the dependent variable (MCI were excluded) and LC signal from all 10 LC sections for all time points as fixed factors and subject as a random factor. The regression coefficients produced by this analysis for each LC section was saved (see Figure 1(b)). These same 10 regression coefficients were then input with each participant’s LC signal data from the corresponding LC section (using the mnrval MATLAB function) to return each subject’s predicted probability of CN status from a multinomial logistic regression model. Finally, the probabilities were converted to log of the odds ratio (as log of odds are more amenable to statistical analysis compared to probabilities) log of odds of CN status = log(probability(CN) / probability(AD)). All steps subsequent to calculation of coefficients applied to all participants including those with MCI. We refer to this log of the odds ratio as the LC patternCN, participants with positive values have greater odds of being CN than AD. Figure 1(b) shows that the LC pattern linked to CN status is high signal in middle and mid-caudal LC sections relative to signal on the rostral and caudal ends of the LC. Note that LC patternCN was highly correlated with a simpler LC integrity metric, LC signal averaged from bilateral middle LC sections (r = 0.77, the middle section was selected because it was the one that was most affected in AD in our prior work in this cohort42,50).
PET acquisition and analysis
Participants had [18F]AZD4694 and [18F]MK6240 PET scans acquired to estimate brain levels of Aβ and tau, respectively, using a brain-dedicated Siemens high resolution research tomograph. PET measures were employed, not as outcomes of interest, but to stratify participants into groups based on AD severity. See previous studies for more detailed PET methods.54,55
Briefly, [18F]MK6240 acquisition proceeded 90–110 min following intravenous bolus injection. Scans were reconstructed using an ordered-subsets expectation maximization (OSEM) algorithm on a four-dimensional volume with four frames (4 × 300 s). [18F]AZD4694 radioligand acquisition proceeded 40–70 min following intravenous bolus injection. Reconstruction used OSEM on a four-dimensional volume with three frames (3 × 600 s). For attenuation correction, PET acquisition was followed by a 6-min transmission scan conducted with a rotating 137Cs point source. Images were corrected for motion, dead time, radioactive decay as well as random and scattered coincidences and were meninges and skull stripped. PET images underwent linear registration to native T1 space (using ANTs) and non-linear transformation to ADNI reference space followed by smoothing using an 8 mm full-width half-maximum Gaussian kernel. To quantify radioligand binding, standardized uptake value ratios (SUVR) were computed using the inferior cerebellar GM as a reference region in the case of tau-PET [18F]MK6240 and whole cerebellar GM in the case of amyloid-PET [18F]AZD4694.
For the Aβ tracer, [18F]AZD4694, SUVR values were extracted from a composite set of regions including the precuneus, prefrontal, orbitofrontal, parietal, temporal, anterior, and posterior cingulate cortices. 56 Aβ positivity (Aβ status) was defined, similar to prior work, 55 as SUVR value >1.55 at baseline or at a subsequent time point if [18F]AZD4694 was not available at baseline. SUVR scores from the tau tracer [18F]MK6240 were extracted from predefined ROIs to determine Braak stage, consistent with prior work. 57 Each ROI is linked to a specific Braak stage and each participant’s Braak stage was defined based on the most advanced stage ROI where SUVR was above that ROI’s critical threshold (for further detail about threshold determination, see prior work 57 ). Discordant observations (where regional tau burden did not follow the anatomical progression proposed by Braak) were excluded from analyses of Braak stage, see Table S1 for characteristics of participants who were excluded from the Braak stage subgroups at baseline. Mean time interval across participants between [18F]AZD4694 and [18F]MK6240 scans was 40 days; mean interval between MRI and [18F]MK6240 scans was 38 days and between MRI and [18F]AZD4694 scans was 46 days.
Statistical analysis
Statistical analyses employed linear mixed effects models and robust linear regression implemented in MATLAB software with random intercepts but not random slopes. Our initial analysis examined the impact of time on the LC signal. This linear mixed-effects model employed an LC patternCN as dependent variable, a random subject factor, and the fixed factors were: time since baseline (time), Aβ status, time × Aβ status, age at baseline, sex, and scan date pre/post covid-19 pandemic onset. The pre/post covid-19 dummy covariate was included in analyses examining time effects on the LC because the pandemic occurred between the baseline and follow up scans of many participants and there is evidence that the LC may be vulnerable to covid-19 infection.58–62 This analysis was repeated in different subgroups of participants examining the impact of time on LC signal with the same model except for exclusion of the Aβ status and time × Aβ status fixed factors.
The next set of analyses examined the impact of LC signal on cognition. These linear mixed-effects models employed a cognitive measure as dependent variable a random subject factor, and the following fixed factors: LC patternCN, age at study baseline, years of education, sex, and time. These were repeated for different cognitive measures and in different subgroups of participants.
For purposes of visualization, we provide statistical maps displaying the time effect (Figure 1(c)) and correlations to cognition (Figure S1) for all LC sections. These were generated by running the above-described linear-mixed effects regression models for all 10 LC sections.
Results
Longitudinal change in LC signal
To assess LC change over time, n = 269 study participants were included in a linear mixed effects model. We did not see evidence that the LC patternCN was differentially changing over time between Aβ-positive and Aβ-negative individuals (time × Aβ status interaction t474 = −0.47). Therefore, we reasoned that further division into early and later phase AD groups may be needed to reveal AD-associated LC degeneration over time. We divided cases into a healthy aging group with no cognitive impairment and no AD pathophysiology (group (CN, Aβ-negative, and at Braak stage 0, n = 93, n = 41 with multiple time points), an early AD group group (Aβ-positive and Braak stage <4, n = 67, n = 27 with multiple time points), and a later AD group (Aβ-positive and Braak stage 4–6, n = 59, n = 21 with multiple time points). We did not measure significant change over time in the healthy aging group (ΔLC patternCN/year = −0.023, CI = −0.24 to 0.19, t139 = −0.21, p = 0.83, linear mixed effects model controlling for age at baseline, sex, and scan date prior to covid-19 pandemic), nor in the later AD group (ΔLC patternCN/year = 0.13, CI = −0.096 to 0.35, t80 = 1.14, p = 0.26). It was the early-stage AD group who showed a marked decrease in LC integrity over time (ΔLC patternCN/year = −0.43, CI = −0.66 to −0.20, t95 = −3.72, p = 0.0003). Note that examining a simpler metric of LC integrity, the average signal from the bilateral middle LC, the results were similar (t139 = −1.27, p = 0.21 in healthy aging; t95 = −3.74, p = 0.0003 in early AD; t80 = −1.23, p = 0.22 in later AD). For detailed visualization of how the LC signal changed over time in all rostro-caudal sections, see Figure 1(c) and for plots of LC integrity over time for each participant in the three groups, see Figure 2.
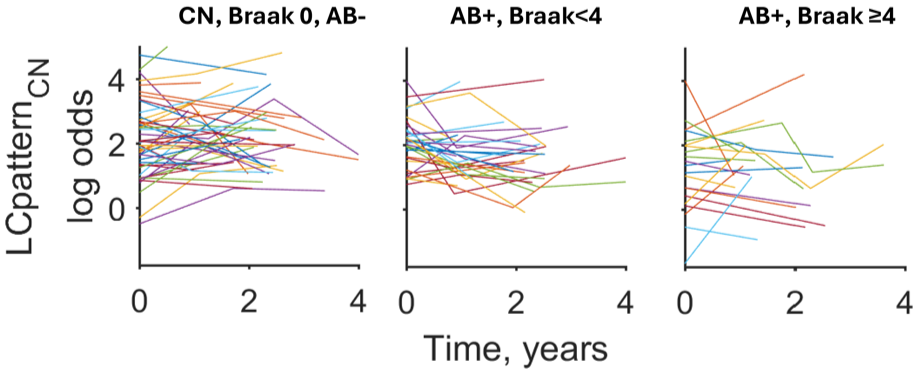
Longitudinal change in LC integrity over time at different stages of AD. Each line plots LCpatternCN at all assessment times for each participant. LC integrity significantly decreased over the 2–4 years of follow-up for participants at the early stages of AD (AB+, Braak <4, middle plot).
Association of LC integrity to cognition
Next, we considered the association between LC integrity and multiple domains of cognition in healthy aging and AD individuals using data from all available time points in linear mixed effects models with additional fixed factors: time, years of education, age at baseline, and sex. When merging Aβ-positive individuals from Braak stage 1–6, all cognitive measures correlated positively to LC patternCN, the strongest association was with the novel object recognition test (BORB: T124 = 4.08, p = 0.00008; Table 2). In the healthy aging group, only working memory (WAIS digit span) showed a significant correlation to LC patternCN (T128 = 2.62, p = 0.010; Table 2). To minimize the risk of correlation strength being inflated by examining measures across such a broad range of AD severity, and in line with evidence from the prior analyses that LC signal may be impacted differently across the AD spectrum, we performed subsequent analysis dividing the AD group into early (Aβ-positive, Braak stage <4) and later (Aβ-positive, Braak stage 4–6) groups. In the early AD group, LC patternCN correlated positively to general cognitive impairment (MMSE score, t92 = 2.34, p = 0.021) and executive function (TMT-B test, t47 = 2.92, p = 0.005; Table 2). In the later AD group, LC patternCN correlated positively to several measures including object recognition (BORB test, t63 = 3.42, p = 0.001), logical memory (t63 = 2.38, p = 0.020), and verbal fluency (t65 = 2.33, p = 0.023; Table 2). The findings from examining cognitive domains in AD subgroups that survived FDR correction were the relationship of LC patternCN to TMT-B in early AD and its relationship to object recognition, logical memory, and verbal fluency in later AD. See Figure 3 for scatterplots of these relationships and Figure S1 for maps visualizing the relationships across LC sections. These analyses were repeated using a simpler LC integrity metric, the bilateral average of the middle LC section signal, and results were very similar compared to the LC patternCN metric (see Table S2).
Relation of LC patternCN to cognitive measures in study subgroups.
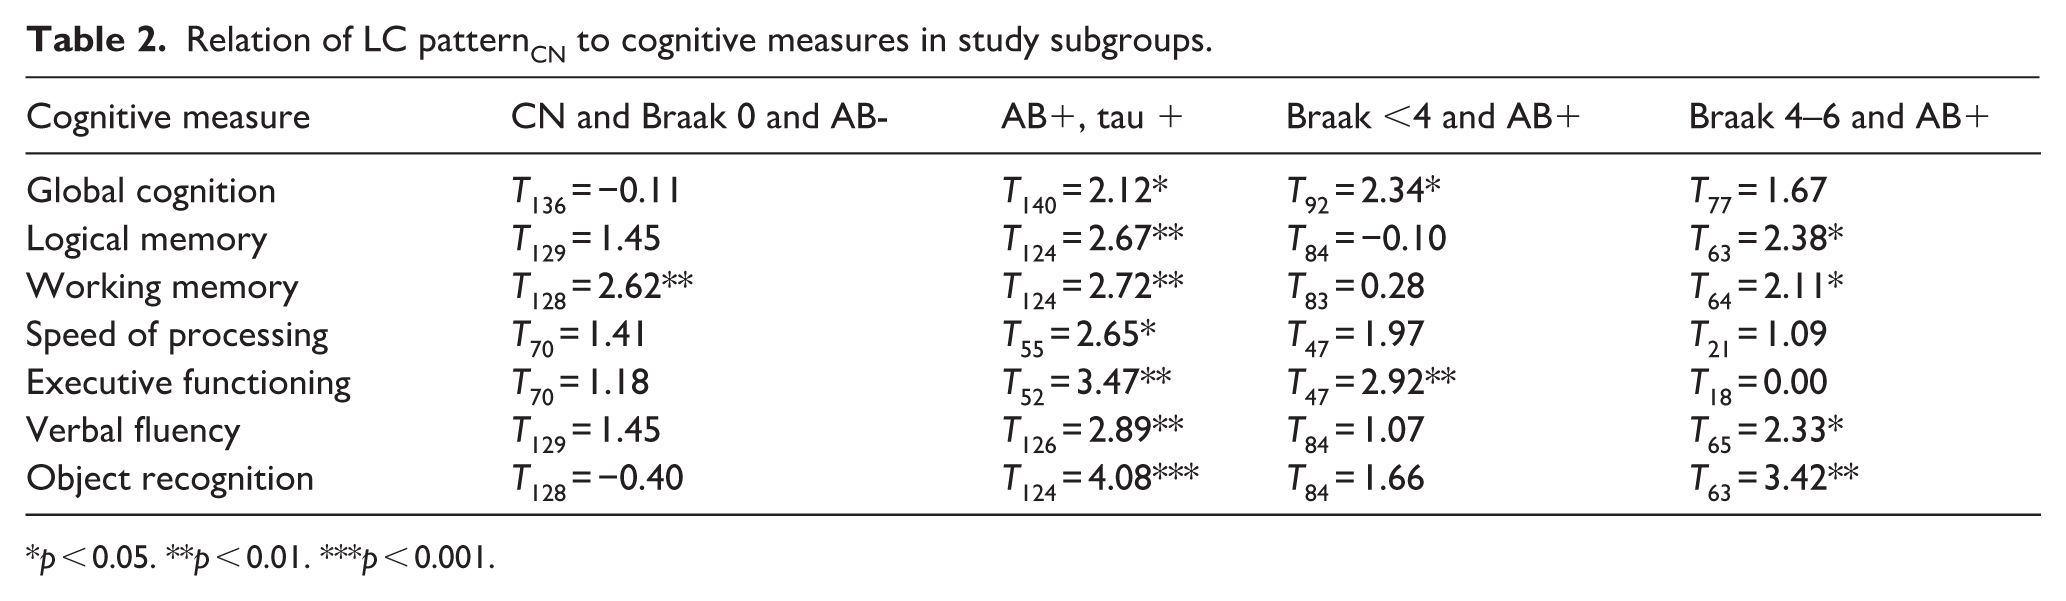
p < 0.05. **p < 0.01. ***p < 0.001.
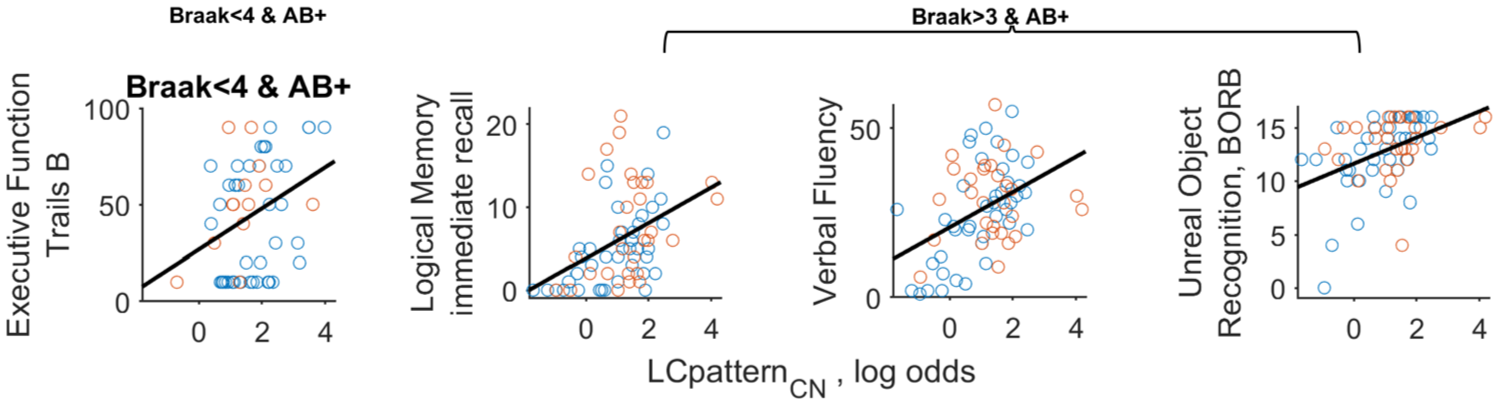
Correlation between LC integrity and selected cognitive measures. Baseline assessments are shown as blue circles and follow-up assessments as orange circles. The correlation to executive function is shown for participants at the early stages of AD (Braak <4 and for amyloid β positive, AB+, at left) and the other correlations are shown for later AD participants (Braak >3 and AB+).
Given the strong relationship we observed in AD between object recognition and LC integrity, we further examined subscale scores of this test and found that the relationships to LC integrity were apparent when attempting to recognize novel stimuli (imaginary animals comprising the “unreal subscale,” t124 = 4.01 in the full AD sample and t63 = 3.59 the later AD group; Figure 3) but were not significant when recognizing familiar stimuli (common animals on the “real subscale,” t = 1.96 and 1.18, respectively).
Discussion
This study investigated longitudinal change in LC integrity and its association to cognition in a large and well characterized sample of older adults across the AD spectrum. We found that the rate of loss in LC integrity was steepest in the early stages of AD (prior to Braak stage 4), whereas a significant change could not be detected in later stages of AD or in healthy aging. Next, we examined the relationship of LC integrity to cognition across different domains. We found that, when looking at the full spectrum of AD severity, LC integrity was related to performance on all cognitive measures. A more stringent test to reduce spurious correlation due to illness progression and constrain analyses to either early AD (Braak stage <4) or later AD (Braak stage >3) found that many cognitive measures remained significantly correlated to LC integrity. While most of these cognitive measures have been previously implicated in the LC’s role in AD (e.g. logical memory32,39,63), the one that showed the strongest relationship, object recognition, has been less well studied in this context and could reflect an important role of the LC–NE system in impaired novelty detection in AD. Finally, our study was able to investigate healthy aging according to a more rigorous definition than some prior reports that lacked Aβ and tau imaging. We found that, except for working memory, the LC metric was not significantly related to cognition in this group, consistent with evidence that LC degeneration is minimal in healthy aging. 26
This study generated a single measure of LC integrity across all rostrocaudal LC sections, LC patternCN—the log of the odds that an individual is cognitively normal or has AD based on their LC signal. This multivariate approach has some advantages over examining an average of the whole LC or individual LC sections without considering information provided by other sections. For example, a person with low LC signal in the middle of the LC relative to its ends will have a worse LC patternCN compared to another person with similarly low LC signal but throughout the LC. We had reasoned that diverse factors could influence the LC signal and a multivariate LC metric would assist in capturing LC signal loss over time as opposed to other biological or imaging artifacts might alter LC signal with a different pattern across LC sections compared to AD-linked degeneration. Indeed, this strategy revealed that the strongest LC degeneration occurred in the early phases of AD, from Braak stage 1–3, and it is notable that when examining LC signal change over time across all LC sections at this phase (Figure 1(c)), as expected, the pattern appears as the inverse of the pattern linked to CN status cross-sectionally (LC patternCN, see Figure 1(b)): loss in the middle of the LC but trending towards increase on the ends of the LC.
The observation of decreasing LC signal in early AD is consistent with prior work examining the early or at-risk stage of AD. We are aware of two prior imaging studies on this question, both of which found significant LC signal decrease, either in people at genetic risk for AD 32 or in a mixed group of AD and MCI. 33 Postmortem work has likewise shown the sharpest drop in LC volume between Braak stage 0 and 1 in middle LC. 26 On the other hand, another study on a large sample of community older adults did not show a significant change in LC signal over time. 39 This lack of longitudinal change in LC signal in healthy aging (or in the later AD group) could be accounted for by several factors. Small changes in LC signal may not rise above the level of test-retest noise, possibly requiring a longer follow-up than the 2–4-year interval to observe significant change. Furthermore, we cannot directly measure LC degeneration with MRI but only LC signal, which is susceptible to other influences that could plausibly increase the signal (e.g. changes in neuromelanin, iron, cell size or macromolecule content) and counteract a degeneration-linked decrease. Indeed, we observed large increases in signal over time for some participants (Figure 2). This could obscure LC degeneration and thus we cannot conclude whether our inability to observe signal decrease over time in the later AD group was due to a flattening rate of degeneration or due to these other influences assuming that they could fluctuate more widely at later illness stages. Indeed, our multivariate LC metric may have been better suited to observe change in the early, compared to later AD stages and it is possible that the pattern of LC signal loss throughout the structure may vary depending on the stage of AD. Nevertheless, examining both the summary metric and the more granular LC metrics (Figure 1(c)) it appears that LC subregions show a steeper rate of signal loss in early AD than later AD. This still leaves open the possibility that more total LC loss occurs in later AD should the duration of these late AD stages be much longer than the early stages (lower rate but for a longer duration could equal more loss). Other important caveats when considering early versus later AD include the fact that the later AD group was the smallest in the study (only n = 21 with follow up data) and may have been underpowered to detect signal loss over time and finally that participants in our study did not have severe AD symptoms and it is possible that heavy LC loss may occur in the latest stages of illness.
We found LC integrity to be positively associated with cognitive performance across several measures, consistent with prior imaging studies. To examine more directly the association of LC signal with cognition and minimize spurious correlation from sampling across a wide range of AD severity, we looked at early and later AD subgroups and still found many significant correlations. In the early AD subgroup, the only measure to withstand multiple-comparisons correction was the TMT-B test. This finding is consistent with a large body of evidence of the LC-NE system’s role in executive function 63 and merits replication in a larger sample (this test was available on fewer participants than most tests in our sample) and using a paradigm capable of investigating specific aspects of executive function (e.g. cognitive flexibility, inhibitory control). In the later AD group, we found several cognitive measures to positively correlate to LC integrity including logical memory, a common measure of interest in prior LC imaging studies, most of which also found LC signal loss linked to deficits in logical memory in AD or AD-risk groups.31,37,63 Our observation of a correlation between LC signal and verbal fluency is consistent with a prior report in older adults with and without MCI. 36 It is notable that both the logical memory and verbal fluency effects appeared to be most pronounced in the mid-caudal LC (Figure S1), a topography mirroring a prior report. 36
It is notable that the cognitive measure that related most strongly to LC integrity, object recognition, has not been investigated in prior LC imaging studies to our knowledge. This measure correlated only at the later AD stage perhaps due to ceiling effects in those with lesser impairment as near-perfect scores would be expected for most healthy adults on a test of this nature. We argue that this measure can be considered a novelty detection test by asking participants to recognize pictures of animals that do not exist in nature. There is a large literature on the role of the LC-NE system on novelty detection and on the presence of novelty detection deficits in AD.64–69 Perhaps this is a particularly sensitive test to demonstrate the impact of LC damage on behavior in AD, and could be considered as a simple screening test to track LC integrity in AD. Furthermore, more detailed study of the LC on novelty processing could better reveal mechanisms of norepinephrine system dysfunction in AD and how they may color the expression of behavioral impairment.
We found that in healthy aging, with the exception of working memory, our LC metric was not significantly related to cognition, consistent with the absence of significant LC signal loss over time in this group and prior evidence that LC degeneration is minimal in healthy aging based on postmortem and imaging data.26,31,67,68 Thus, the factors contributing to LC signal variability in the absence of LC degeneration (e.g. neuromelanin and iron content, cell size or cell density) may have little consequence on cognitive performance in healthy aging. Several prior studies31,32,68,69 similarly found no significant association of LC signal to cognitive performance in healthy aging, whereas other studies did find LC signal to be correlated with memory,29,39,70 global cognition, 38 and executive function. 40 These associations may in some cases be due to inadvertent inclusion of cases with prodromal AD as many studies did not screen for brain AD markers. This ambiguity encouraged us to be very strict in our definition of healthy aging (cognitively normal and no Aβ or tau, even in the Braak 0 ROI). Nevertheless, we do not mean to conclude that the LC is immune to harms in healthy aging just because we did not observe change in our measures over the time of follow-up. Aside from the strong evidence of early tau accumulation in LC, some imaging and postmortem studies have observed LC damage in this context 71 and the susceptibility of LC neurons to degeneration in Braak stage 0 remains a subject of debate. Regarding correlation to the correlation of LC integrity to working memory, this finding is intriguing, but contrasts with some prior work in healthy aging, 39 and merits replication.
Our study has many strengths as the largest longitudinal LC imaging study we are aware of in AD and one that spans the full spectrum of AD from Braak stage 0–6 and includes PET imaging of tau and Aβ. Nevertheless, not all subjects had longitudinal data and, after division into subgroups, sample sizes were still modest. Another limitation is a risk of circularity considering that our LC metric, LC patternCN, was defined and applied in the same sample. We feel this risk is minimal in our case since this metric was defined by a group comparison (CN vs AD) and very few analyses in the study were performed across groups and the most important findings were observed in analyses confined to participants largely drawn from one or the other of these groups. Future work could apply the same sectionwise weights used in this study to calculate LC patternCN in an out-of-sample study to determine whether this metric would allow better diagnostic segregation compared to a simpler metric (e.g. whole LC or middle LC signal). Furthermore, since this metric was defined to segregate CN from AD, it may not allow optimal distinction within AD, that is, patterns of LC signal that differentiate early from later AD stages. Thus, future work is needed to better determine the utility of this multivariate metric and it is reassuring that in the current report the findings using the multivariate metric of LC integrity were closely aligned to findings using a simpler and more standard metric of LC contrast in the middle section. Finally, our study found the largest signal loss occurring in the middle LC section, in contrast to some other reports where the largest effect was in mid-rostral LC.29,33,39 This discrepancy could be due to methodological differences between studies, for instance in the anatomical definition of the LC or MRI acquisition, or differences in sample characteristics.
In conclusion, our study reveals that LC signal loss is detectable within subjects over a 2–4-year span in early stages of AD. Furthermore, we confirm prior reports of positive correlations of LC signal to multiple cognitive domains in AD but show that LC signal variation in healthy aging may have little impact on cognition. Finally, we propose that tests of novel object recognition may be particularly sensitive to LC damage in AD.
Supplemental Material
sj-docx-1-jcb-10.1177_0271678X261460160 – Supplemental material for A longitudinal investigation of locus coeruleus norepinephrine system integrity and cognitive performance across the Alzheimer’s spectrum
Supplemental material, sj-docx-1-jcb-10.1177_0271678X261460160 for A longitudinal investigation of locus coeruleus norepinephrine system integrity and cognitive performance across the Alzheimer’s spectrum by Ahmad Sibahi, Seyyed Ali Hosseini, Nesrine Rahmouni, Joseph Therriault, Rami Hamati, Reihaneh Forouhandehpour, Firoza Lussier, Mira Chamoun, Christine Tardif, Pedro Rosa-Neto and Clifford M Cassidy in Journal of Cerebral Blood Flow & Metabolism
Footnotes
Acknowledgements
The authors thank all participants of the study and staff of the McGill Center for studies in Aging and at the University of Ottawa Institute of Mental Health Research.
Author contributions
CMC, PR-N, and AS made substantial contributions to the conception and design of the work, to the acquisition, analysis, or interpretation of data for the work; and to drafting of the work and revising it critically for important intellectual content. MC, NR, and FL contributed to collection of neuroimaging and/or clinical data. CT contributed to implementation and analysis of neuroimaging measures. JT, SAH, RH, and RF contributed to data management, data processing and analysis. All authors contributed to writing and editing the manuscript.
Funding
The authors disclosed receipt of the following financial support for the research, authorship, and/or publication of this article: This research is supported by the Natural Sciences and Engineering Research Council of Canada (NSERC; RGPIN-2020-06127, PI: CMC), the Weston Brain Institute, Canadian Institutes of Health Research (CIHR; MOP-11-51-31; RFN 152985, 159815, 162303), Canadian Consortium of Neurodegeneration and Aging (CCNA; MOP-11-51-31-team 1), the Alzheimer’s Association (NIRG-12-92090, NIRP-12-259245), Brain Canada Foundation (CFI Project 34874; 33397), the Fonds de Recherche du Québec—Santé (FRQS; Chercheur Boursier, 2020-VICO-279314; 2024-VICO-356138). PR-N is a member of the CIHR-CCNA Canadian Consortium of Neurodegeneration in Aging. Colin J Adair Charitable Foundation.
Declaration of conflicting interests
The authors declared the following potential conflicts of interest with respect to the research, authorship, and/or publication of this article: The authors report no competing financial interest in relation to the study design, results, or discussion. CMC and PR-N are inventors on a pending patent using the analysis method described here, licensed to Terran Biosciences, but have received no royalties.
Supplemental material
Supplemental material for this article is available online.
References
Supplementary Material
Please find the following supplemental material available below.
For Open Access articles published under a Creative Commons License, all supplemental material carries the same license as the article it is associated with.
For non-Open Access articles published, all supplemental material carries a non-exclusive license, and permission requests for re-use of supplemental material or any part of supplemental material shall be sent directly to the copyright owner as specified in the copyright notice associated with the article.