






Abstract
Following a stroke, a local inflammatory cascade is triggered, resulting in the systemic diminishment of immune function, known as stroke-induced immunosuppression. The association of stroke-induced immunosuppression with brain injury and stroke prognosis after intravenous thrombolysis remains unclear. In this cohort study, we prospectively enrolled 1023 patients across 16 centers. Lymphocyte counts and the neutrophil-to-lymphocyte ratio were used as indicators of the severity of stroke-induced immunosuppression. The primary outcomes were the 90-day functional outcome, assessed using the modified Rankin Scale, and the severity of brain injury, evaluated by serum biomarkers (glial fibrillary acidic protein, S100β, ubiquitin c-terminal hydrolase L1, and neuron-specific enolase). Key secondary outcomes included infarct volume, 24 h and 7-day National Institutes of Health Stroke Scale, early neurological deterioration, hemorrhagic transformation, and 3-month mortality. Our results demonstrated that stroke-induced immunosuppression was independently associated with functional outcomes at 3 months and the severity of brain injury. In addition, patients with severe stroke-induced immunosuppression had increased infarct volume, higher National Institutes of Health Stroke Scale scores, increased risk of hemorrhagic transformation, and higher 3-month mortality. These results suggest that stroke-induced immunosuppression is independently associated with brain injury and poor outcomes in patients with acute ischemic stroke undergoing intravenous thrombolysis.
Keywords
Introduction
Stroke is the second leading cause of death worldwide, causing almost seven million deaths annually, and the third leading cause of disability. 1 Intravenous thrombolysis (IVT) is currently the most effective treatment for ischemic stroke.2,3 However, a substantial proportion of the patients receiving IVT therapy fail to achieve favorable outcomes. 4 Therefore, further exploration of the mechanisms underlying poor outcomes after IVT and the identification of potential therapeutic targets, is warranted.
The immune system plays a crucial role throughout the process of the ischemic cascade, spanning from acute vascular occlusion to parenchymal injury and ultimately to cerebral tissue repair and regeneration. 5 Following the onset of ischemic stroke, a local inflammatory cascade is triggered, resulting in systemic immune suppression, commonly referred to as stroke-induced immunosuppression (SIIS).6,7 Previous studies have been predominantly focused on the correlation between SIIS and increased susceptibility to post-stroke infections.8–10 To date, the available literature has demonstrated only a correlation between SIIS and extended infarct volumes. 11 However, the associations between SIIS and clinical prognosis remain unclear in patients undergoing IVT.
The severity of brain injury following ischemic stroke is well recognized as a surrogate marker for clinical prognosis.12,13 However, existing assessment methods, including imaging techniques, remain insufficiently precise, 14 thereby limiting further investigation of the association between SIIS and brain injury in patients with stroke. In recent years, specific circulating biomarkers have emerged as reliable assessment tools, referred to as brain injury biomarkers. Under physiological conditions, these biomarkers are predominantly expressed in the central nervous system. Following acute ischemic stroke, disruption of the blood–brain barrier allows the release of biomarkers into the peripheral circulation, where they may serve as quantifiable indicators of brain injury severity.15,16 Astrocytic and neuron injury markers, including glial fibrillary acidic protein (GFAP), S100β, neuron-specific enolase (NSE), and ubiquitin C-terminal hydrolase L1 (UCH-L1), are among the most commonly studied biomarkers.17–19 Accordingly, we aimed to investigate the associations of SIIS with brain injury severity (assessed using brain injury biomarkers) and clinical outcomes in patients with ischemic stroke undergoing IVT.
Materials and methods
This was a multicenter, prospective cohort study of patients with acute ischemic stroke who underwent IVT at 16 hospitals (Table S1) in Northeast China between September 2016 and April 2023. This study was approved by the Ethics Committee of the First Hospital of Jilin University (2015-156). All participants gave written informed consent and the study was conducted in accordance with the Helsinki declaration.
Participants
The inclusion criteria were as follows: (1) age 18 years or older, (2) diagnosis of acute ischemic stroke, (3) admission within 4.5 h after onset and treatment with standard alteplase (0.9 mg/kg), (4) modified Rankin Scale (mRS) score ⩽1 before the stroke, and (5) agreement to participate in the study with written informed consent. The exclusion criteria were as follows: (1) severe inflammatory or infectious diseases and (2) unavailable serum lymphocyte and neutrophil data before or 24 h after IVT.
Data collection
The following patient data were collected: demographic features (age and sex), vascular risk factors (cigarette smoking, alcohol consumption, hypertension, diabetes mellitus, dyslipidemia, previous ischemic stroke, coronary heart disease, and hyperhomocysteinemia), and clinical information (blood pressure, heart rate, serum fasting glucose, onset-to-recombinant tissue plasminogen activator bolus time, stroke subtype, stroke severity, infarct location, and endovascular treatment). Using the National Institutes of Health Stroke Scale (NIHSS) score, the severity of ischemic stroke was determined at baseline (before IVT), 24 h after IVT, and 7 days after IVT. 20 Ischemic stroke subtypes were classified according to the Trial of Org 10172 in Acute Stroke Treatment criteria. 21 Infarct volumes were measured on post-IVT (3–7 days) diffusion-weighted imaging using 3D Slicer v5.3.0. For all enrolled patients, the thrombolysis in brain ischemia (TIBI) score, measured using transcranial Doppler (EMS-9 PB; Delica, China) within 24 h after IVT, was used to reflect flow grade.22,23 The TIBI grade, comprising six levels (0, absent; 1, minimal; 2, blunted; 3, dampened; 4, stenotic; and 5, normal flow), was evaluated using the worst flow signal in the presumed culprit arteries.
SIIS indicators
Peripheral blood lymphocyte counts and neutrophil to lymphocyte ratio (NLR) were obtained on admission and 24 h after IVT, and they were used to assess the degree of SIIS. 7 Lymphocytopenia is the main manifestation of SIIS.8,10,24 Additionally, neutrophils trigger inflammation, release proinflammatory cytokines, and produce stress hormones. This inflammatory process is believed to reduce lymphocyte counts, consequently leading to impaired immune function. 25 Therefore, NLR was also included in our study to evaluate the extent of the immune response.
Brain injury biomarkers
GFAP, UCHL1, S100β, and NSE levels were obtained 24 h after IVT and were used to assess brain injury. These biomarkers were analyzed using an automated magnetic particle-based chemiluminescent enzyme immunoassay system (MS-Fast/Aceso 80 A; Sophonix, Beijing, China). The detection ranges were as follows: GFAP, >5 pg/mL; UCH-L1, >50 pg/mL; S100β, 0.05–10 ng/mL; and NSE, 0.5–350 mg/mL. Values at the lower or upper limits were recorded when biomarker levels exceeded the detection range. Human specimens were stored in the Biobank Department of Jilin University’s First Hospital Clinical Research Division after collection.
Outcomes
The primary outcomes were (1) functional outcome at 90 days, assessed using the mRS, and (2) brain injury severity, evaluated by measuring serum levels of four brain injury biomarkers (GFAP, S100β, UCH-L1, and NSE) 24 h after IVT. The secondary outcomes included infarct volume, 24 h NIHSS score, 7-day NIHSS score, early neurological deterioration (END), hemorrhagic transformation (HT), and 3-month mortality. HT was identified according to the European Collaborative Acute Stroke Study criteria. 26 END was defined as an increase in NIHSS score ⩾4 points within 24 h of IVT. 27 An mRS score of 0–2 indicated a favorable functional outcome, whereas a score of 3–6 indicated an unfavorable functional outcome. All patients completed the 3-month follow-up through telephone interviews or questionnaires. The mRS scores, imaging parameters, and other outcome assessments were performed by trained physicians who were blinded to the patients’ lymphocyte counts and NLR values throughout the entire assessment process.
Statistical analyses
All statistical analyses were performed using SPSS (version 22; IBM SPSS, Chicago, IL, USA) and Stata (version 15; StataCorp LLC, College Station, TX, USA). A two-sided p < 0.05 was considered statistically significant. Categorical variables are described as frequencies and percentages, and were compared using the χ2 test or Fisher’s exact test. Continuous variables are presented as means with standard deviations (normal distribution) or as medians with interquartile ranges (non-normal distribution), and were compared using Student’s t-test and Mann–Whitney U test. The NIHSS score and infarct volume were treated as continuous variables, and linear regression analyses were performed to evaluate their correlations with lymphocyte counts and NLR. HT, END, functional outcome, and mortality were treated as categorical variables, and binary logistic regression analyses were performed to evaluate their correlations with lymphocyte counts and NLR. GFAP, UCH-L1, S100β, and NSE levels were categorized into quartiles and converted into ordinal variables, and ordered regression analyses were performed to evaluate their correlations with lymphocyte counts and NLR. Two models were applied: Model 1 was unadjusted. For infarct volume, 24 h NIHSS, 7-day NIHSS, 3-month mRS score, and brain injury biomarkers, Model 2 was adjusted for sex, age, cigarette smoking, alcohol consumption, hypertension, diabetes mellitus, previous ischemic stroke, coronary heart disease, dyslipidemia, hyperhomocysteinemia, endovascular treatment, baseline NIHSS, systolic and diastolic blood pressure, heart rate, blood glucose level, onset-to-needle time, stroke subtypes, TIBI score, and infarct location. Additionally, considering the low event rates of HT, END, and 3-month mortality, Model 2 was adjusted for six key covariates including age, EVT, baseline NIHSS score, onset-to-needle time, stroke subtype, and TIBI score. Odds ratios (ORs) or beta coefficients (β) with 95% confidence intervals (CIs) were used to depict the correlations.
Additionally, to determine whether lymphocyte counts and NLR after IVT adds prognostic value beyond the established predictors (baseline NIHSS, infarct volume, and TIBI), the area under the receiver operating characteristic curve (AUC-ROC), net reclassification index (NRI), and integrated discrimination improvement (IDI) were calculated. Comparison of the two ROC curves was based on the method of DeLong et al. 28
Results
Participant characteristics
We included 1131 patients with acute ischemic stroke who underwent IVT. Among these, 37 were lost to the 3-month follow-up, and 22 declined to participate in the study during follow-up, leaving 1072 patients. Finally, 1023 patients with serum lymphocyte and neutrophil counts before and 24 h after IVT were included in this analysis. Baseline characteristics were compared between patients with complete follow-up and those lost to follow-up (Table S2). No significant differences were observed between the groups, suggesting that loss to follow-up did not result in significant selection bias in this study. Of the 1023 patients, 854 (83.5%) were enrolled from The First Hospital of Jilin University, and 169 (16.5%) were enrolled from the other 15 hospitals. The infarct volume was calculated for 940 patients with available magnetic resonance imaging data. A comparison of the characteristics of patients with different levels of lymphocyte counts or NLR is shown in Table 1. Patients with low lymphocyte counts or high NLR had higher 24 h and 7-day NIHSS scores, risk of HT and unfavorable outcomes, and 3-month mortality than those with high lymphocyte counts or low NLR.
Baseline characteristics in the entire cohort.
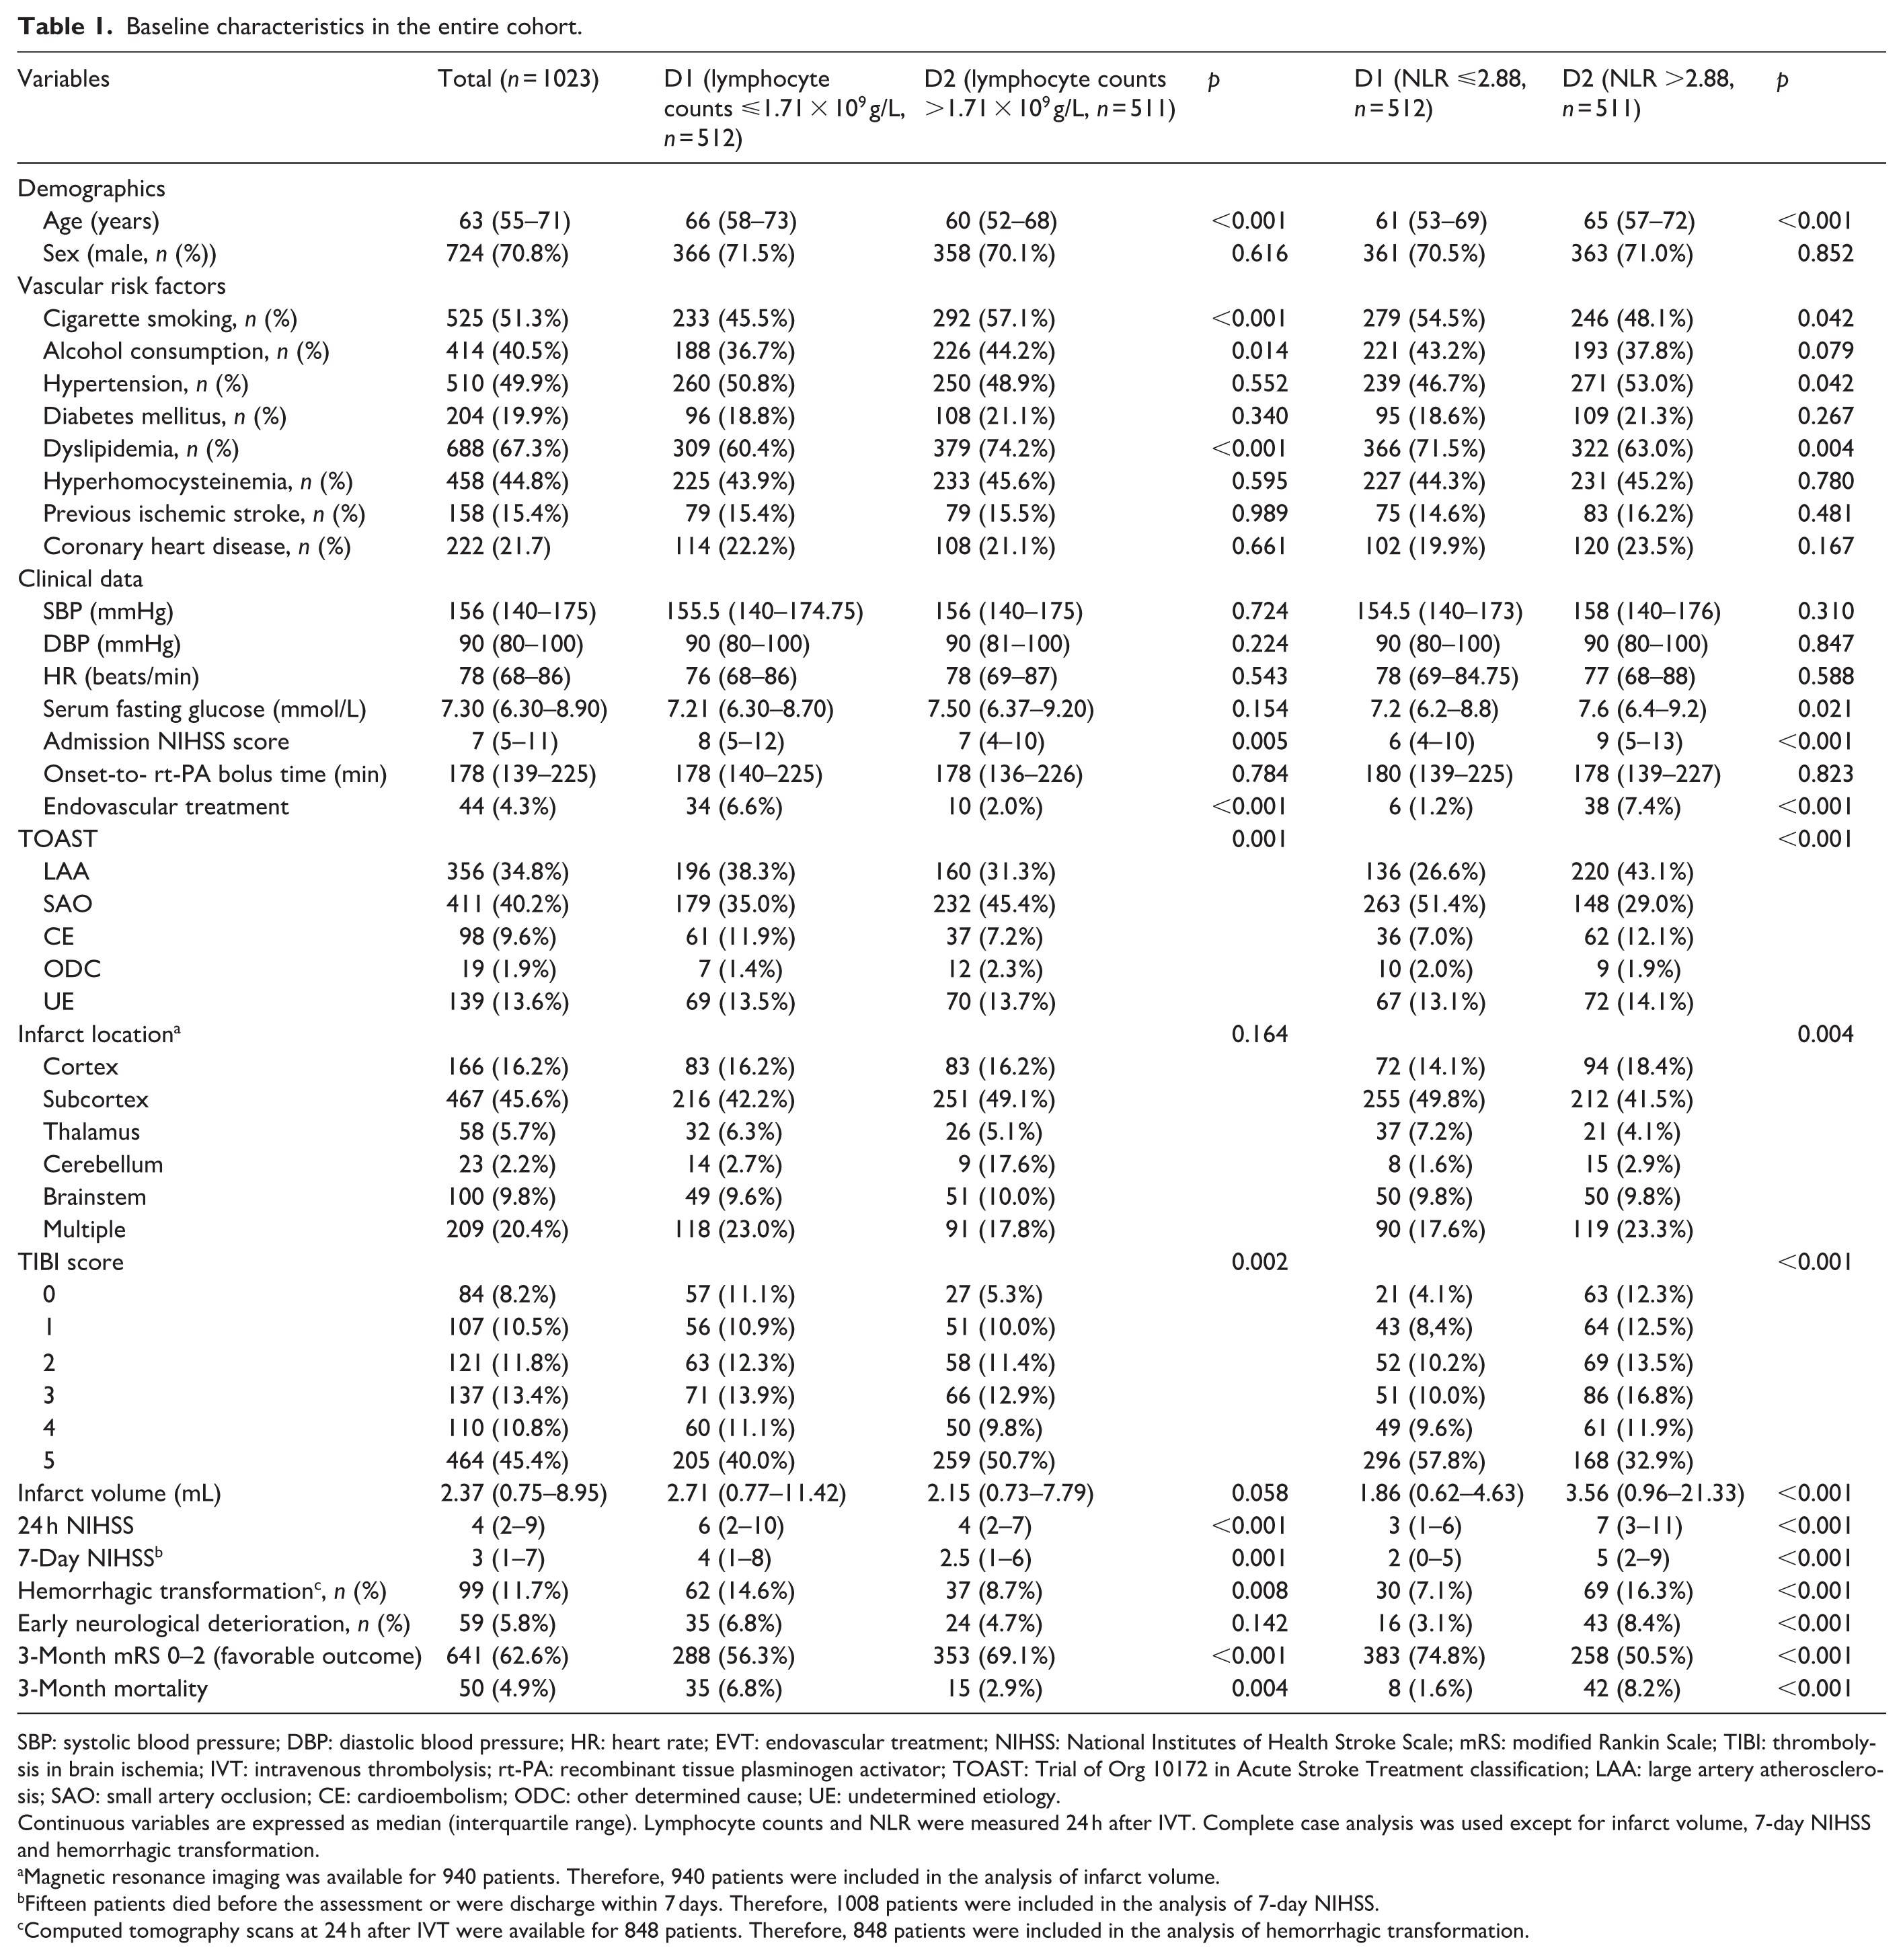
SBP: systolic blood pressure; DBP: diastolic blood pressure; HR: heart rate; EVT: endovascular treatment; NIHSS: National Institutes of Health Stroke Scale; mRS: modified Rankin Scale; TIBI: thrombolysis in brain ischemia; IVT: intravenous thrombolysis; rt-PA: recombinant tissue plasminogen activator; TOAST: Trial of Org 10172 in Acute Stroke Treatment classification; LAA: large artery atherosclerosis; SAO: small artery occlusion; CE: cardioembolism; ODC: other determined cause; UE: undetermined etiology.
Continuous variables are expressed as median (interquartile range). Lymphocyte counts and NLR were measured 24 h after IVT. Complete case analysis was used except for infarct volume, 7-day NIHSS and hemorrhagic transformation.
Magnetic resonance imaging was available for 940 patients. Therefore, 940 patients were included in the analysis of infarct volume.
Fifteen patients died before the assessment or were discharge within 7 days. Therefore, 1008 patients were included in the analysis of 7-day NIHSS.
Computed tomography scans at 24 h after IVT were available for 848 patients. Therefore, 848 patients were included in the analysis of hemorrhagic transformation.
Immunosuppression indicators and infarct volume or stroke severity
No association was observed between admission lymphocyte counts and infarct volume in the univariate and multivariate analyses, whereas NLR on admission was associated with infarct volume in the univariate analysis but not in the multivariate analysis. Both serum lymphocyte counts and NLR 24 h after IVT were significantly related to infarct volume in both the unadjusted and adjusted models (multiple adjusted: β, −7.076; 95% CI, −12.619 to −1.532; p = 0.012 and β, 2.276; 95% CI, 1.169, 3.383; p < 0.001, respectively). Results of the linear regression analysis of the relationship between immunosuppression indicators and infarct volume is presented in Table 2.
The correlation between immunosuppression indicators and stroke outcomes.
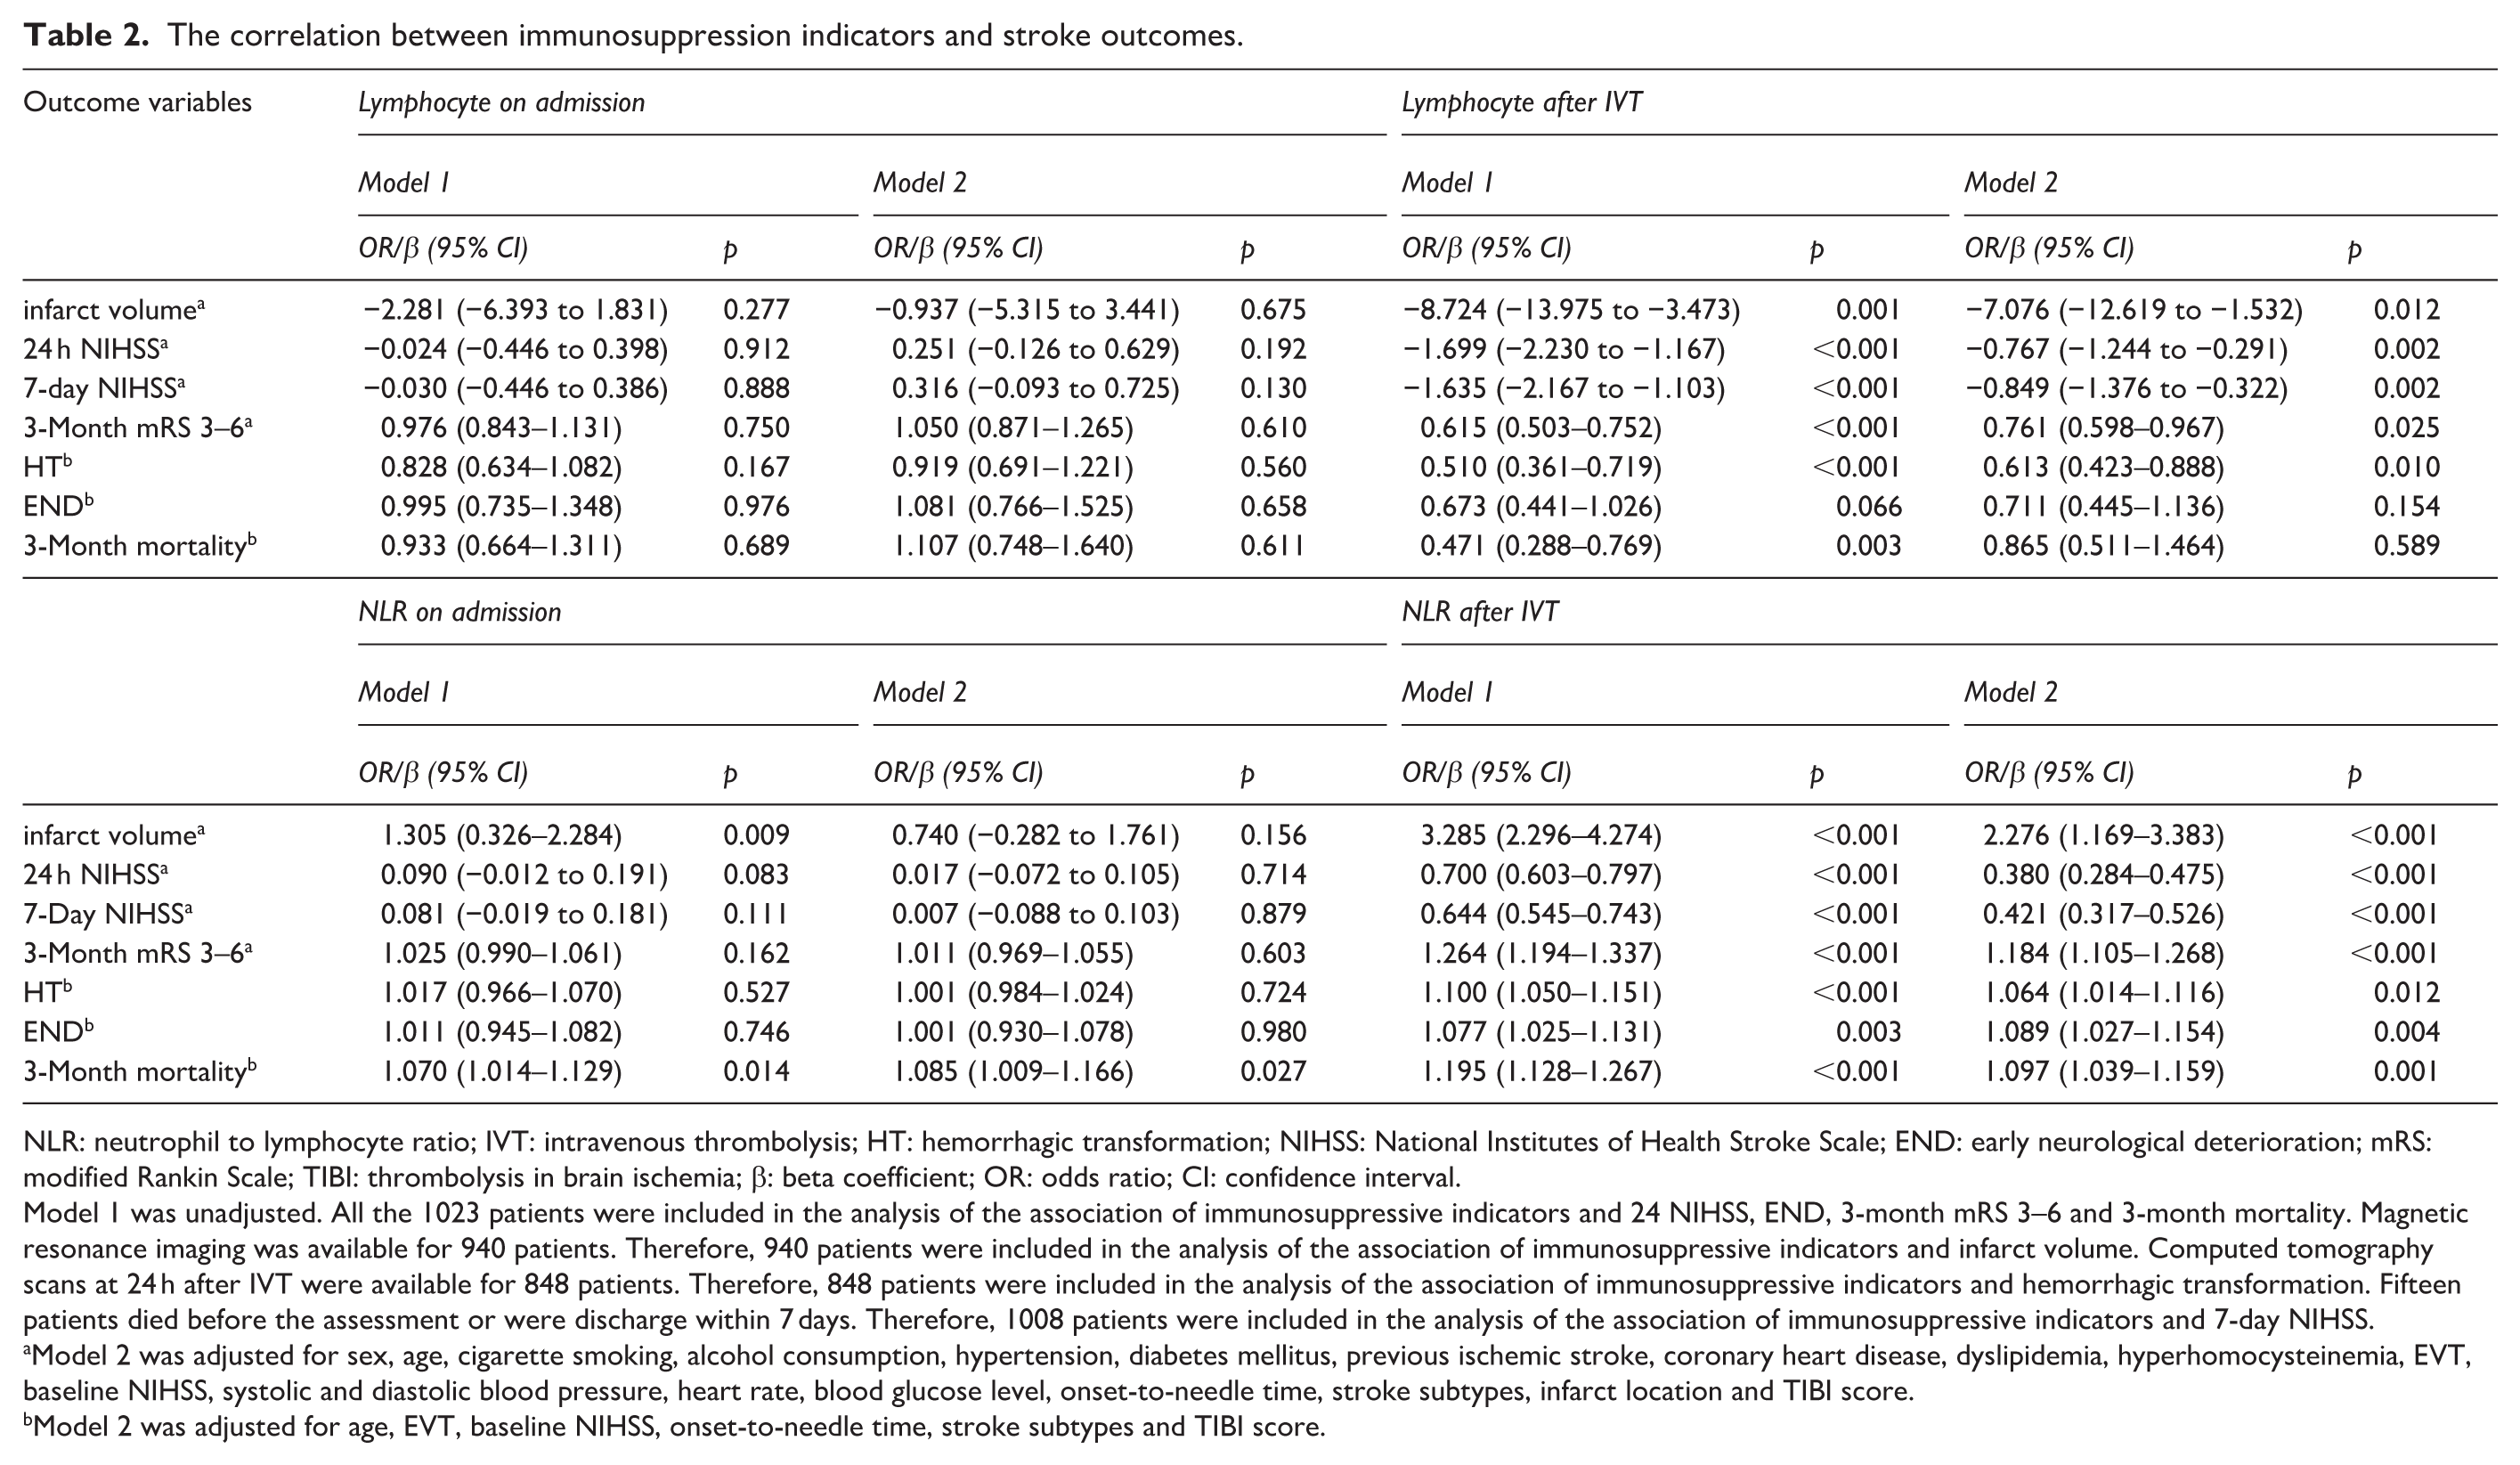
NLR: neutrophil to lymphocyte ratio; IVT: intravenous thrombolysis; HT: hemorrhagic transformation; NIHSS: National Institutes of Health Stroke Scale; END: early neurological deterioration; mRS: modified Rankin Scale; TIBI: thrombolysis in brain ischemia; β: beta coefficient; OR: odds ratio; CI: confidence interval.
Model 1 was unadjusted. All the 1023 patients were included in the analysis of the association of immunosuppressive indicators and 24 NIHSS, END, 3-month mRS 3–6 and 3-month mortality. Magnetic resonance imaging was available for 940 patients. Therefore, 940 patients were included in the analysis of the association of immunosuppressive indicators and infarct volume. Computed tomography scans at 24 h after IVT were available for 848 patients. Therefore, 848 patients were included in the analysis of the association of immunosuppressive indicators and hemorrhagic transformation. Fifteen patients died before the assessment or were discharge within 7 days. Therefore, 1008 patients were included in the analysis of the association of immunosuppressive indicators and 7-day NIHSS.
Model 2 was adjusted for sex, age, cigarette smoking, alcohol consumption, hypertension, diabetes mellitus, previous ischemic stroke, coronary heart disease, dyslipidemia, hyperhomocysteinemia, EVT, baseline NIHSS, systolic and diastolic blood pressure, heart rate, blood glucose level, onset-to-needle time, stroke subtypes, infarct location and TIBI score.
Model 2 was adjusted for age, EVT, baseline NIHSS, onset-to-needle time, stroke subtypes and TIBI score.
No difference was observed in the association between admission lymphocytes counts and 24 h NIHSS and 7-day NIHSS. Similar results were observed for NLR on admission. In the unadjusted and adjusted analyses, both lymphocytes and NLR 24 h after IVT were independently associated with the 24 h NIHSS (multiple adjusted: β, −0.767; 95% CI, −1.244 to −0.291; p = 0.002 and β, 0.380; 95% CI, 0.284, 0.475; p < 0.001, respectively) and 7-day NIHSS (multiple adjusted: β, −0.849; 95% CI, −1.376 to −0.322; p = 0.002 and β, 0.421; 95% CI, 0.317, 0.526; p < 0.001, respectively). The specific correlations between immunosuppression indicators and stroke severity are presented in Table 2.
Immunosuppression indicators and HT
The lymphocyte counts 24 h after IVT (multiple adjusted: OR, 0.613; 95% CI, 0.423, 0.888; p = 0.010) and NLR 24 h after IVT (multiple adjusted: OR, 1.064; 95% CI, 1.014, 1.116; p = 0.012) were independently correlated with HT in the multivariate analysis. The results indicated that lower lymphocyte counts were associated with a higher risk of HT, whereas higher NLR was associated with a higher risk of HT. No significant differences were observed between the immunosuppression indicators on admission and HT. The data on the correlations among lymphocyte counts, NLR, and HT are shown in Table 2.
Immunosuppression indicators and 3-month functional outcome
No significant correlations were observed between immunosuppression indicators at admission and 3-month functional outcomes in the multivariable analysis. There was no significant association between lymphocyte counts 24 h after IVT and END and 3-month mortality. In the univariate and multivariable logistic regression analyses, low lymphocyte counts 24 h after IVT (multiple adjusted: OR, 0.761; 95% CI, 0.598, 0.967; p = 0.025) was found to predict an increased risk of an mRS score of 3–6. The NLR after IVT was independently associated with END (multiple adjusted: OR, 1.089; 95% CI, 1.027, 1.154; p = 0.004), 3-month mRS score of 3–6 (multiple adjusted: OR, 1.184; 95% CI, 1.105, 1.268; p < 0.001), and 3-month mortality (multiple adjusted: OR, 1.097; 95% CI, 1.039, 1.159; p = 0.001). The detailed relationships between immunosuppression indicators and functional outcomes are shown in Table 2 and Figure 1. The distribution of functional outcome assessed by mRS at 90 days based on lymphocyte counts and NLR changes is shown in Figure 2. To verify whether the main findings were solely driven by patients from the First Hospital of Jilin University, subgroup analyses were conducted among patients from the remaining 15 external centers. Consistent with the overall cohort, subgroup analysis of external centers showed that patients with unfavorable outcomes had significantly higher NLR 24 h after IVT than those with favorable outcomes (p < 0.001). Although no significant between-group difference was observed in lymphocyte count (p = 0.087), it showed a trend consistent with that of the overall cohort. Detailed data of the subgroup comparison are presented in Table S3.
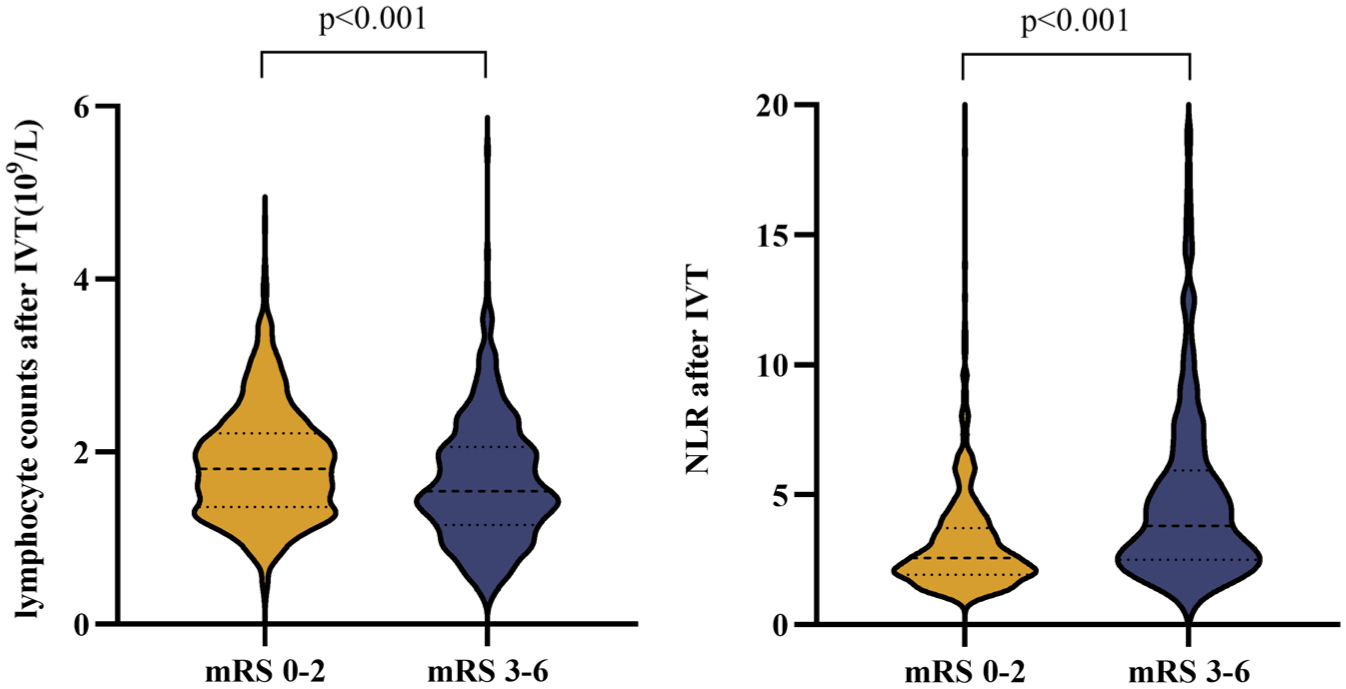
Violin plot of lymphocyte counts and NLR after IVT in patients with different functional outcome.
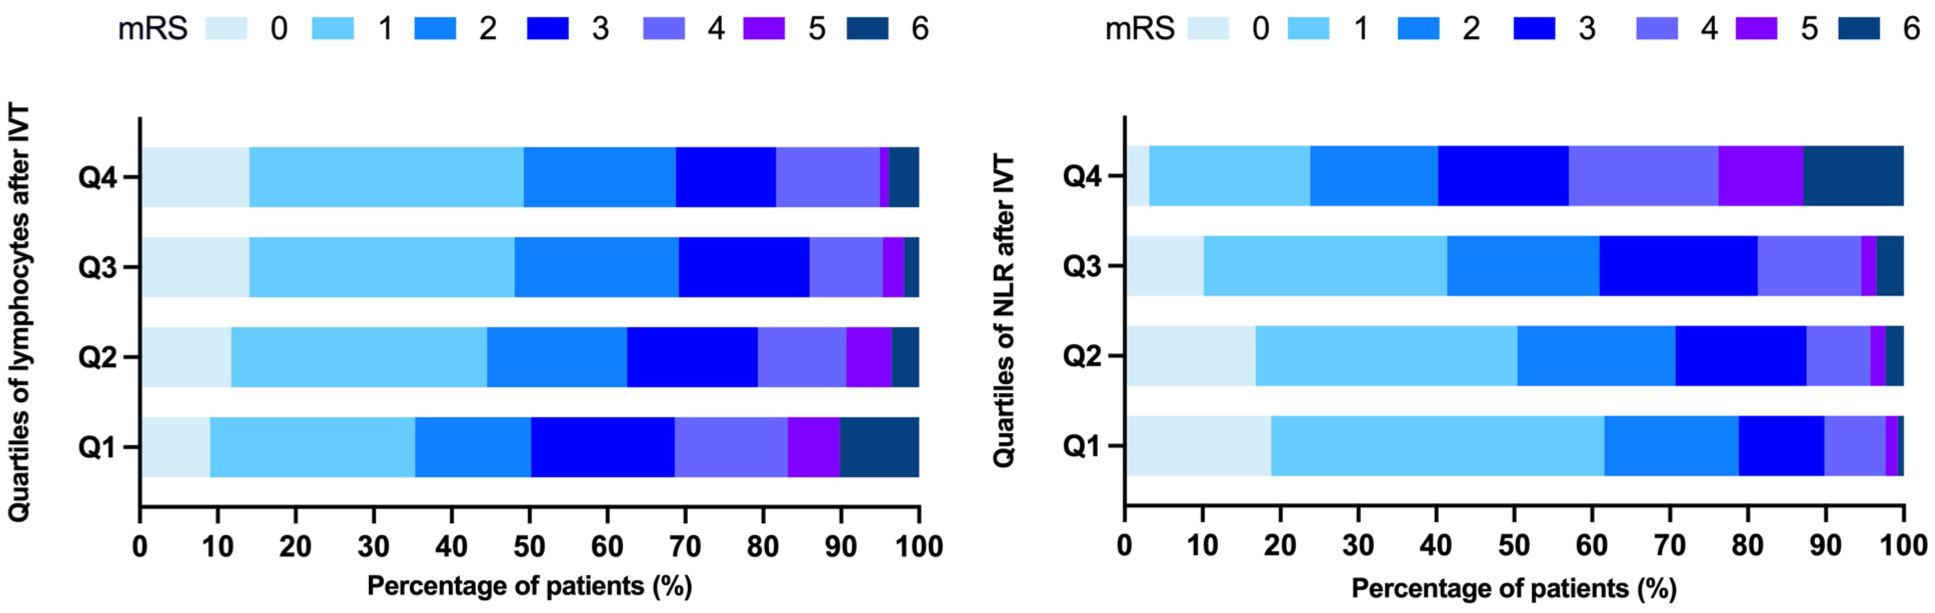
Distribution of functional outcome assessed by mRS at 90 days according to lymphocytes and NLR after IVT quartiles.
Immunosuppression indicators and brain injury
GFAP, S100β, UCH-L1, and NSE levels were transformed into ordinal variables according to their quartiles. Lymphocyte counts 24 h after IVT were independently associated with S100β (multiple adjusted: common OR, 0.799; 95% CI, 0.665, 0.958; p = 0.015); however, for GFAP, UCH-L1, and NSE, the results were not significant. No correlation was observed between the admission lymphocyte counts and the four biomarkers. A significant association was observed between the NLR on admission and GFAP in both the unadjusted and adjusted models. The NLR after IVT was significantly related to all four brain injury biomarkers: GFAP (multiple adjusted: common OR, 1.100; 95% CI, 1.047, 1.155; p < 0.001), S100β (multiple adjusted: common OR, 1.122; 95% CI, 1.071, 1.175; p < 0.001), UCH-L1 (multiple adjusted: common OR, 1.151; 95% CI, 1.094, 1.212; p < 0.001), and NSE (multiple adjusted: common OR, 1.052; 95% CI, 1.013, 1.094; p = 0.009). The detailed results of the correlations between immunosuppression indicators and GFAP, S100β, UCH-L1, and NSE levels are presented in Table 3.
The correlation of immunosuppression indicators with quartiles of GFAP, S100β, UCH-L1 and NSE levels.
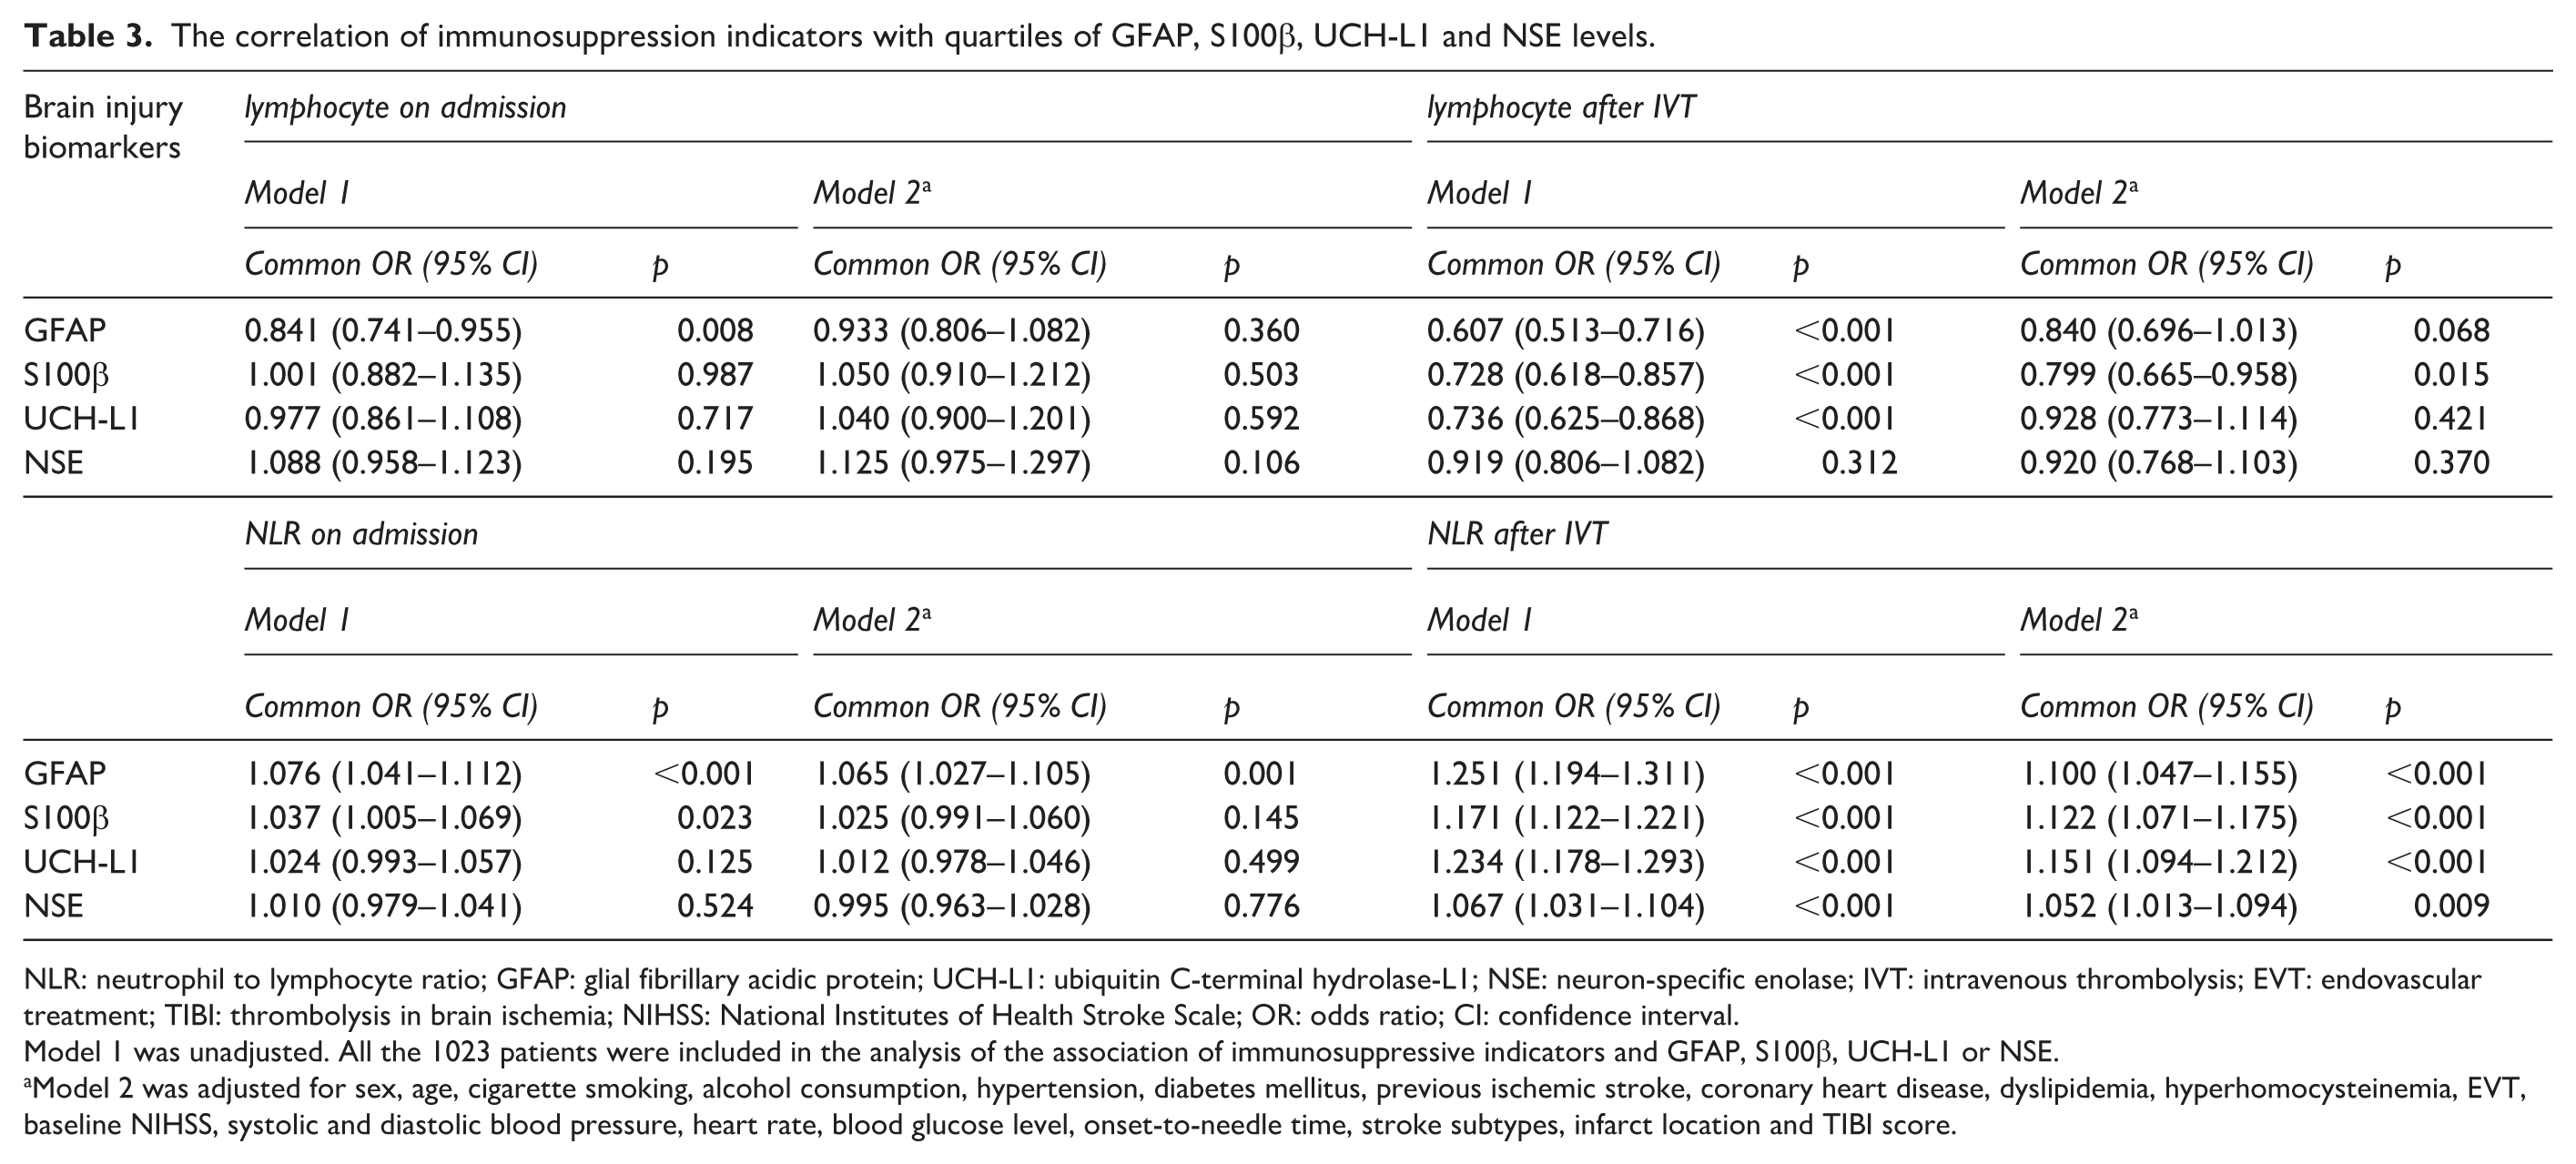
NLR: neutrophil to lymphocyte ratio; GFAP: glial fibrillary acidic protein; UCH-L1: ubiquitin C-terminal hydrolase-L1; NSE: neuron-specific enolase; IVT: intravenous thrombolysis; EVT: endovascular treatment; TIBI: thrombolysis in brain ischemia; NIHSS: National Institutes of Health Stroke Scale; OR: odds ratio; CI: confidence interval.
Model 1 was unadjusted. All the 1023 patients were included in the analysis of the association of immunosuppressive indicators and GFAP, S100β, UCH-L1 or NSE.
Model 2 was adjusted for sex, age, cigarette smoking, alcohol consumption, hypertension, diabetes mellitus, previous ischemic stroke, coronary heart disease, dyslipidemia, hyperhomocysteinemia, EVT, baseline NIHSS, systolic and diastolic blood pressure, heart rate, blood glucose level, onset-to-needle time, stroke subtypes, infarct location and TIBI score.
Incremental predictive value of lymphocyte counts and NLR in patients who underwent IVT
Given the significant findings observed at 24 h, we further explored whether lymphocyte counts and NLR at 24 h after IVT provide incremental prognostic value beyond established predictors. As shown in Table S4, although no significant difference was observed in AUC-ROC values, the addition of lymphocyte counts improved the NRI (NRI: 16.14%, p = 0.009), and the inclusion of NLR further enhanced both NRI and IDI compared with the model based on the combination of established predictors (baseline NIHSS, infarct volume, and TIBI) (NRI: 20.50%, p < 0.001; IDI 1.69%, p < 0.001).
Discussion
In this study, we found a significant correlation between SIIS status at 24 h after IVT and brain injury severity (as reflected via GFAP, S100β, UCH-L1, and NSE), infarct volume, HT, and stroke prognosis. Our findings indicate that overactivated immunosuppression after stroke is associated with severe brain injury and poor outcomes in patients with ischemic stroke. Furthermore, SIIS, reflected by lymphopenia and an elevated NLR, may serve as a predictor of severe brain injury and poor prognosis in patients with ischemic stroke treated with IVT.
Immunomodulatory therapy after acute ischemic stroke is currently an area of active investigation. Elucidating the impact of SIIS on stroke prognosis is critical for guiding such therapies; however, their association remains poorly defined. Prior studies on SIIS have primarily examined its association with post-stroke infection risk.10,29,30 The limited available evidence suggests that greater SIIS severity is associated with larger infarct volume and higher NIHSS scores.11,31 However, the relationship between SIIS and long-term functional outcomes in patients after ischemic stroke remain unclear. In our multicenter cohort study, we explored the prognostic role of SIIS in patients receiving IVT, based on a relatively large sample size. Moreover, the inclusion of lymphocyte counts and NLR significantly improved prognostic value beyond the combination of established predictors (baseline NIHSS, infarct volume, and TIBI). However, we did not observe a significant relationship between baseline SIIS before IVT and stroke prognosis. This might be attributable to the absence of fully-developed SIIS within the first 4.5 h. 8
Additionally, a key strength of our study is the use of biomarkers, including GFAP, S100β, UCH-L1, and NSE, to explore the influence of SIIS on the extent of brain injury. GFAP, a class III intermediate filament protein selectively expressed in central nervous system astrocytes, primarily functions in maintaining their morphology and structural integrity. 18 S100β is a calcium-binding protein predominantly expressed in astrocytes. 32 Elevated GFAP and S100β reflects astrocyte injury. UCH-L1 is a neuron-specific deubiquitinating enzyme and can be used as a biomarker of neuronal injury. NSE is a glycolytic enzyme predominantly expressed in neurons and is involved in cellular energy metabolism through glucose catalysis. 33 Elevated UCH-L1 and NSE indicates neuronal injury. Accumulating evidence suggests that these biomarkers are elevated in the acute phase of ischemic stroke and correlated with stroke severity and functional outcomes.16,34–37 Thus, both neuroglial and neuronal injury biomarkers reflect overall brain injury. Our results indicate that SIIS is associated with severe brain injury (neuroglial and neuronal) as well as large infarct volume.
However, the mechanisms underlying the association between SIIS with brain injury and stroke outcomes remain unclear. SIIS initially serves as a compensatory mechanism to counteract neuroinflammation-induced brain damage. 38 Although attenuation of immune function can alleviate neuroinflammation after ischemic stroke, specific immune subsets exert protective effects. A decreased lymphocyte count may therefore weakened the protective and neurogenic effects of these subpopulations. For example, regulatory T cells have been shown to promote tissue repair and functional recovery and protect against secondary infarct growth, thereby conferring neuroprotection.39–41 In addition, the interaction of T cells with platelets may exert hemostatic effects, thereby reducing the risk of HT after ischemic stroke. 42 Additionally, B lymphocytes synthesize neurotrophins such as brain-derived neurotrophic factor and nerve growth factor, which facilitate neuroplasticity and neural regeneration. 43 In the post-stroke brain, B lymphocytes can migrate into areas associated with neurogenesis, promote neural regeneration, and mediate motor recovery. 44 Collectively, the attenuation of beneficial lymphocyte subset functions secondary to SIIS may partially explain its adverse association with brain injury and stroke outcomes. Furthermore, the detrimental effects of SIIS on stroke prognosis may be associated with its inhibitory effects on neuroinflammation. The complexity of the immune response is underscored by findings that, even in the acute stage after ischemic stroke, immune and inflammatory responses may be beneficial and contribute to improved functional outcomes. 45 Neuroinflammation can exert beneficial effects by promoting clearance of necrotic tissue, rescuing penumbra salvage, and facilitating tissue repair. SIIS, which is considered a counteractor of inflammatory reaction, might compromise these beneficial processes and worsen long-term prognosis. Finally, systemic immunosuppression in SIIS may directly increase susceptibility to bacterial infections such as stroke-associated pneumonia, thereby worsening post-stroke prognosis and elevating mortality risk.7,8 Further basic and clinical investigations are required to clarify these speculations.
This study has some limitations. First, SIIS was evaluated only in patients who underwent IVT. Future studies should include patients with ischemic stroke who receive medical care and endovascular treatment. Second, both brain injury biomarkers and SIIS indicators were measured concurrently at 24 h after IVT, precluding confirmation of a definitive causal relationship between SIIS and brain injury. Future studies should measure SIIS and brain injury indicators at different time points to investigate their dynamic changes and explore the potential causal relationship. Third, the majority of the patients were enrolled from a single center (The First Hospital of Jilin University), which may restrict the generalizability of our findings to more diverse clinical settings and populations. Fourth, this study only measured peripheral lymphocyte counts and NLR as the markers of SIIS, which are non-specific and do not reflect changes in specific immune cell subsets (e.g. T cell, B cell, and monocyte subsets) or their functional status. Future studies should incorporate advanced techniques such as flow cytometry and functional assays to ensure a more comprehensive assessment of SIIS. Fifth, the number of patients who received endovascular therapy was too small (44 patients, 4.3%) for subgroup analysis; further studies are required to explore the association between SIIS and clinical outcomes in patients who receive endovascular therapy.
Conclusions
SIIS is independently associated with severe brain injury and poor clinical outcomes in patients with acute ischemic stroke undergoing IVT.
Supplemental Material
sj-docx-1-jcb-10.1177_0271678X261462716 – Supplemental material for Stroke-induced immunosuppression is associated with brain injury and poor outcomes in patients receiving intravenous thrombolysis: A multicenter prospective cohort study
Supplemental material, sj-docx-1-jcb-10.1177_0271678X261462716 for Stroke-induced immunosuppression is associated with brain injury and poor outcomes in patients receiving intravenous thrombolysis: A multicenter prospective cohort study by Zhong-Yu Cao, Yang Qu, Ze-Yu Hao, Reziya Abuduxukuer, Peng Zhang, Hang Jin, Bao-Feng Xu, Li-Juan Wang, Jian-Hua Gao, De-Wang Pan, Zhi-Mei Yuan, Chun-Ying Li, Guang-Cai Li, Hong-Yu Yang, Ji-Liang Gu, Ying He, Li-Li Zhao, Zhi-Dan Li, Yong-Fei Jiang, Lu-Ping Zhang, Wen-Tong Song, Hong Xin, Zhi-Bo Chen, Ying-Bin Qi, Dong-Xue Yang, Yu Zhang, Yi Yang and Zhen-Ni Guo in Journal of Cerebral Blood Flow & Metabolism
Supplemental Material
sj-docx-2-jcb-10.1177_0271678X261462716 – Supplemental material for Stroke-induced immunosuppression is associated with brain injury and poor outcomes in patients receiving intravenous thrombolysis: A multicenter prospective cohort study
Supplemental material, sj-docx-2-jcb-10.1177_0271678X261462716 for Stroke-induced immunosuppression is associated with brain injury and poor outcomes in patients receiving intravenous thrombolysis: A multicenter prospective cohort study by Zhong-Yu Cao, Yang Qu, Ze-Yu Hao, Reziya Abuduxukuer, Peng Zhang, Hang Jin, Bao-Feng Xu, Li-Juan Wang, Jian-Hua Gao, De-Wang Pan, Zhi-Mei Yuan, Chun-Ying Li, Guang-Cai Li, Hong-Yu Yang, Ji-Liang Gu, Ying He, Li-Li Zhao, Zhi-Dan Li, Yong-Fei Jiang, Lu-Ping Zhang, Wen-Tong Song, Hong Xin, Zhi-Bo Chen, Ying-Bin Qi, Dong-Xue Yang, Yu Zhang, Yi Yang and Zhen-Ni Guo in Journal of Cerebral Blood Flow & Metabolism
Footnotes
Acknowledgements
We thank the Department of Biobank, Division of Clinical Research, the First Hospital of Jilin University for the providing of blood samples, and The First Hospital of Jilin University Real-World Data Application Platform for providing data.
Author contributions
YY, Z-NG, Z-YC, and YQ drafted the initial protocol, which was reviewed with critical revision and approval by all authors. Z-YC and YQ wrote the first draft of the manuscript. Z-YC, YQ, and PZ did the statistical analysis. YQ, Z-YC, Z-YH, RA, L-JW, J-HG, D-WP, Z-MY, C-YL, G-CL, H-YY, J-LG, YH, L-LZ, Z-DL, Y-FJ, L-PZ, W-TS, HX, Z-BC, Y-BQ, D-XY and YZ collected data. HJ, B-FX, Z-NG and YY revised the manuscript. YY and Z-NG acquired funding. All authors contributed to data acquisition.
Funding
The authors disclosed receipt of the following financial support for the research, authorship, and/or publication of this article: This project was supported by the Science and Technology Department of Jilin Province (20250601002RC) to Yi Yang.
Declaration of conflicting interests
The authors declared no potential conflicts of interest with respect to the research, authorship, and/or publication of this article.

Data availability statement
The datasets used and analyzed during the current study are available from the corresponding author on reasonable request.
Supplemental material
Supplemental material for this article is available online.
References
Supplementary Material
Please find the following supplemental material available below.
For Open Access articles published under a Creative Commons License, all supplemental material carries the same license as the article it is associated with.
For non-Open Access articles published, all supplemental material carries a non-exclusive license, and permission requests for re-use of supplemental material or any part of supplemental material shall be sent directly to the copyright owner as specified in the copyright notice associated with the article.
