






Abstract
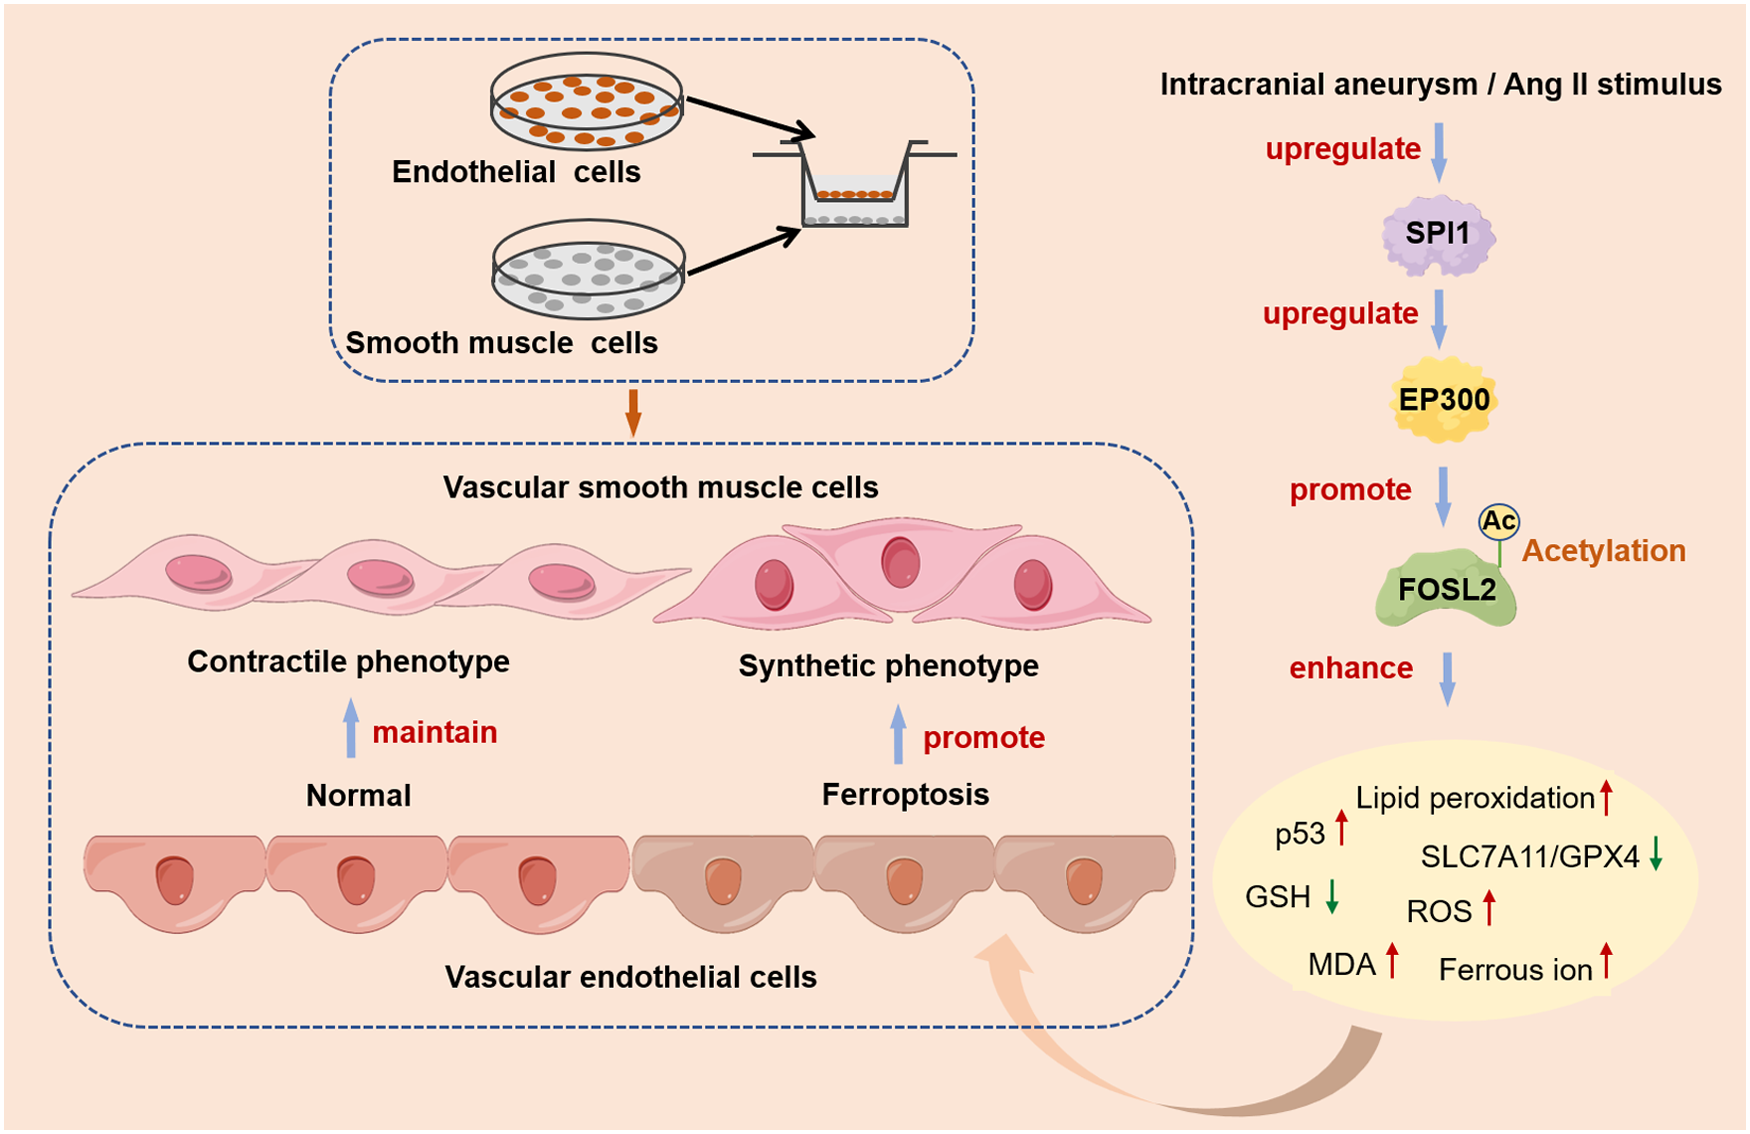
This study investigates the role of SPI1 in the pathogenesis of intracranial aneurysm (IA). Results confirmed that SPI1 was significantly upregulated in both an in vivo mouse IA model and an in vitro model of angiotensin II-stimulated human cerebral microvascular endothelial cells. Functional studies demonstrated that SPI1 overexpression promoted vascular endothelial cell ferroptosis, as evidenced by dysregulation of key markers (p53, GPX4, SLC7A11, ACSL4, TFRC), elevated lipid peroxidation, and mitochondrial damage, whereas SPI1 knockdown attenuated these effects. Mechanistically, SPI1 upregulated the histone acetyltransferase EP300, which subsequently mediated the acetylation of FOSL2. Acetylated FOSL2 enhanced the transcriptional activity of the p53 promoter, thereby driving the execution of ferroptosis. In a co-culture system, SPI1-induced vascular endothelial ferroptosis facilitated the phenotypic switching of vascular smooth muscle cells towards a synthetic phenotype. Crucially, administration of the SPI1 inhibitor DB2313 effectively suppressed the SPI1/EP300/FOSL2 axis, inhibited vascular endothelial ferroptosis, mitigated vascular smooth muscle cell phenotypic switching, and alleviated IA progression in mice. Our findings revealed a novel SPI1/EP300/FOSL2 acetylation axis that promoted vascular endothelial ferroptosis and vascular smooth muscle cell dysfunction in IA, identifying SPI1 as a promising therapeutic target for the condition.
Keywords
Introduction
Rupture of an intracranial aneurysm (IA) is a leading cause of fatal subarachnoid hemorrhage, associated with high rates of disability and mortality, posing a severe threat to human health.1,2 The pathogenesis of IA is complex, involving hemodynamic stress, inflammatory responses, and vascular wall remodeling. 3 Physiological communication between vascular endothelial cells and vascular smooth muscle cells (VSMCs) is crucial for vasculature development and the homeostasis of mature vessels. 4 Vascular endothelial cells help maintain vascular wall homeostasis by preserving the “contractile phenotype” of VSMCs and suppressing their transition to a “synthetic phenotype”. 5 Substantial evidence confirms that vascular endothelial cell dysfunction is a central driver of IA initiation and progression.6 –8 However, the intrinsic molecular pathways driving endothelial cell dysfunction, particularly their association with novel forms of cell death, remain to be fully elucidated.
In recent years, the role of ferroptosis—an iron-dependent form of regulated cell death characterized by the accumulation of lipid peroxides—in cardiovascular diseases has gained increasing prominence. 9 Studies have shown that ferroptosis contributes to vascular injury and is closely linked to the progression of abdominal aortic aneurysm.10,11 Notably, ferroptosis have been observed in the vessel walls of both human and experimental IA models,12,13 indicating its potential role in IA disease progression. Our previous bioinformatic analyses also suggested an association between ferroptosis and IA development. 14 Furthermore, the induction of vascular endothelial ferroptosis has been implicated in the progression of various vascular pathologies, including atherosclerosis, blood-brain barrier disruption after thrombolysis, and acute lung injury.15 –18 Nonetheless, the relationship between endothelial ferroptosis and IA progression, along with its upstream regulators, remains poorly defined.
Spleen focus-forming virus proviral integration 1 (SPI1), also known as PU.1, a member of the E26 transformation-specific (ETS) transcription factor family, plays a role in vascular development and the regulation of endothelial cell function.19 –21 Bioinformatic analyses have identified significant upregulation of SPI1 in IA wall tissues from IA patients and in peripheral blood cells from patients with subarachnoid hemorrhage (SAH) due to IA rupture,22,23 suggesting its potential role as a key pathological factor. Previous research indicates that SPI1-mediated transcriptional activation is involved in the regulation of ferroptosis.24,25 Interestingly, SPI1 has been reported to directly regulate the transcription of Glutathione Peroxidase 4 (GPX4), a key ferroptosis-related gene, in a colon cancer model. 26 Consequently, this study was intrigued to investigate whether SPI1 contributes to IA by regulating endothelial ferroptosis.
FOS-like antigen 2 (FOSL2) is a member of the FOS protein family. 27 Studies have shown that FOSL2 can regulate vascular endothelial cell dysfunction and influence vascular wall structure and function, thereby participating in the development of cardiovascular diseases.28,29 Furthermore, in cancer research, FOSL2 has been confirmed to influence ferroptosis by regulating downstream target genes.30,31 However, the role of FOSL2 in IA remains unexplored. Jing et al. have revealed that SPI1 induces microglia-mediated neuroinflammation through the transcriptional regulation of FOSL2 expression. 32 The function of FOSL2 is known to be regulated by post-translational modifications. 33 In cervical cancer, E1A binding protein P300 (EP300) has been found to enhance FOSL2 acetylation at K222, thereby accelerating the malignant proliferation of cervical cancer cells. 34 STRING database predictions indicated the interactions between EP300 and both SPI1 and FOSL2. Based on these findings, this study further investigated the impact of SPI1 and EP300 on FOSL2 expression and the specific mechanistic relationships within the context of IA.
In this study, significant upregulation of SPI1 was observed in an IA mouse model and in human cerebral microvascular endothelial cells (HCMEC/D3) stimulated with angiotensin II (Ang II). Our results demonstrated that SPI1 promoted vascular endothelial cell ferroptosis and facilitated the transition of VSMCs to a synthetic phenotype. Mechanistically, SPI1 mediated the acetylation of FOSL2 by upregulating EP300, which ultimately enhanced vascular endothelial ferroptosis by activating the expression of p53. Furthermore, the therapeutic potential of an SPI1 inhibitor in alleviating IA progression was validated in vivo. This study was the first to reveal the existence and function of the SPI1/EP300/FOSL2 acetylation axis in IA pathogenesis, highlighting SPI1 as a promising therapeutic target for preventing IA rupture.
Materials and methods
Animals
Male C57BL/6J mice (6–8 weeks old) were purchased from Beijing SiPeiFu biotechnology (Beijing, China). All mice were housed under specific pathogen-free conditions with a controlled temperature of 21–26°C, humidity of 40%–70%, and a 12/12-hour light/dark cycle. The mice were allowed free access to standard rodent chow and water throughout the study. After a one-week acclimatization period, the experiments were initiated. All animal experiments were conducted in accordance with the full guidelines entitled Guide for the Care and Use of Laboratory Animals (8th edition, National Academies Press, Washington, DC, USA, 2011) and were approved by the Animal Ethics Committee of The first affiliated hospital, Jiangxi Medical College, Nanchang University (CDYFY-IACUC-202504GR033). The reporting of animal experiments in this manuscript complies with the ARRIVE guidelines 2.0.
IA model establishment and treatment
IA model was induced in male C57BL/6J mice using a well-established method combining renal hypertension and stereotactic elastase injection.35,36 Briefly, mice underwent left nephrectomy under anesthesia. One week post-surgery, hypertension was induced by subcutaneous daily injections of deoxycorticosterone acetate (DOCA, dissolved in olive oil) and by providing drinking water containing 0.12% β-aminopropionitrile and 1% NaCl. Subsequently, mice were anesthetized and placed in a stereotactic frame. Elastase solution was injected into the right basal cistern of the cerebrospinal fluid using a micro-injection pump to initiate the formation of IA. Mice were randomly assigned to the following groups (n = 6): (1) Sham group: mice underwent sham surgery without subsequent induction; (2) Model group: mice underwent the full IA induction procedure; (3) Model + DMSO group: IA-induced mice received intraperitoneal injections of the vehicle (PBS containing 10% DMSO) daily for 7 days, starting on the 7th day after model establishment; (4) Model + DB2313 group: IA-induced mice received intraperitoneal injections of the SPI1 inhibitor DB2313 (10 mg/kg/d, dissolved in PBS with 10% DMSO) daily for 7 days, starting on the 7th day after model establishment. Neurological function was evaluated in all mice using the modified Garcia score system by an investigator blinded to the group allocation. Meanwhile, systolic blood pressure was measured non-invasively in conscious mice using the tail-cuff method with an ML125 Non-Invasive Blood Pressure (NIBP) Controller (ADInstruments, Artisan Technology Group). The internal carotid artery (ICA) was used for quantitative analysis of the Willis circle.
Morphological analysis of mouse skull base
To visualize the cerebral vasculature, mice were subjected to transcardial perfusion. Briefly, mice were deeply anesthetized and perfused with physiological saline until the effluent ran clear, followed by perfusion with a warm gelatin solution containing 2% Evans blue dye (Yuanye Biotechnology, Shanghai, China). The brain was then carefully harvested, and the surrounding nerves at the skull base were meticulously dissected. The skull base vessels were exposed and imaged under a stereomicroscope (Phoenix Optical, Shangrao, Jiangxi, China) to assess the vascular morphology and the presence of aneurysmal bulging.
Histological morphology analysis
The brain tissues were sectioned in the coronal plane. Brain tissues containing the Willis circle were fixed in 4% paraformaldehyde (#G1101, Servicebio, Wuhan, Hubei, China), embedded in paraffin, and sectioned at 4 μm thickness for histological examination. For hematoxylin and eosin (H&E) staining, sections were deparaffinized, rehydrated, stained with hematoxylin (#G1004, Servicebio) and eosin (#G1001, Servicebio) following standard protocols, dehydrated, and mounted. For assessment of collagen fibers, sections were subjected to Masson’s trichrome staining using a commercial kit (#G1346, Solarbio, Beijing, China) according to the manufacturer’s instructions, which included sequential staining with Celestine blue, Mayer’s hematoxylin, Ponceau S, and Aniline blue after proper mordant treatment. All stained sections were visualized and imaged under a light microscope (#DM500, Leica, Wetzlar, Hesse, Germany). The circumference of the Willis circle was quantified from the images using ImageJ software.
Immunohistochemistry
Immunohistochemical staining for SPI1 was performed on 4-μm-thick paraffin-embedded sections of the Willis circle. After deparaffinization and rehydration, antigen retrieval was carried out by heating the sections in EDTA antigen retrieval buffer (#P0085, Beyotime, Shanghai, China) using a microwave oven. Endogenous peroxidase activity was quenched by incubation with a peroxidase blocker. The sections were then incubated with a primary antibody against SPI1 (#55100-1-AP, Proteintech, Wuhan, Hubei, China) at a dilution of 1:200 at 37°C for 30 min, followed by incubation with a secondary antibody (#PV-6000, Zhongshan Golden Bridge, Beijing, China) according to the manufacturer’s instructions. The antigen-antibody complex was visualized using a 3,3′-diaminobenzidine substrate kit (#G1212-200T, Servicebio). Finally, the sections were counterstained with hematoxylin, dehydrated, cleared, and mounted. Stained sections were observed and imaged under a light microscope (#DM500, Leica).
Cell culture and treatment
The immortalized HCMEC/D3 cells were purchased from Immocell Biotechnology (Xiamen, Fujian, China) and cultured in vascular endothelial cell medium (#ScienCell 1001, Hongrong Microelectronics, Shanghai, China) at 37°C in a humidified atmosphere of 5% CO2. To establish an in vitro model, cells were treated with Ang II (#HY-13948, MedChemExpress, Monmouth Junction, New Jersey, USA) for 24 h. The optimal concentration of Ang II (10−5 mol/L) for subsequent experiments was determined using a Cell Counting Kit-8 (CCK-8; #C0038, Beyotime) assay. Briefly, cells were seeded in 96-well plates and treated with a gradient of Ang II concentrations (10−9 to 10−5 mol/L). After 24 h, 10 μL of CCK-8 reagent was added to each well, followed by incubation for 1 h. The absorbance at 450 nm was measured using a microplate reader (#Multiskan FC, Thermo Fisher Scientific, Waltham, MA, USA) to assess cell viability.
For cell transfection, the culture medium was replaced with 2 mL of fresh medium when cells reached 70%–80% confluence in 6-well plates. Cells were transfected with plasmid DNA (Overexpression (OE)-SPI1, FOSL2-AMP, FOSL2-AIP, or OE-FOSL2) or siRNA (si-SPI1 or si-FOSL2) using Lipo8000™ reagent (#C0533, Beyotime) according to the manufacturer’s instructions. Cells transfected with the empty vector served as the negative control. After 24–48 h of incubation at 37°C, the cells were subjected to subsequent treatments or analyses. Additionally, depending on the specific research aims, cells were treated with the ferroptosis inhibitor Ferrostatin-1 (Fer-1), the EP300 inhibitor (C646), or the deacetylase inhibitor Trichostatin A (TSA).
Immunofluorescence staining
Immunofluorescence staining was performed on both cultured cells and brain tissue sections to assess protein expression, localization, and co-localization. For cell-based immunofluorescence, HCMEC/D3 cells grown in 48-well plates were fixed with 4% paraformaldehyde, permeabilized with 0.5% Triton X-100, and blocked with 3% BSA. The cells were then incubated with primary antibodies: anti-SPI1 (#55100-1-AP, 1:500; Proteintech), anti-FOSL2 (#15832-1-AP, 1:500; Proteintech), and/or anti-EP300 (#sc-32244, 1:100; Santa Cruz Biotechnology, Dallas, TX, USA). After washing, the cells were incubated with corresponding fluorescent secondary antibodies, including FITC-conjugated goat anti-rabbit IgG (#A0562, Beyotime) and Cy3-conjugated goat anti-mouse IgG (#A0521, Beyotime), at room temperature for 1 h in the dark. Nuclei were counterstained with DAPI. For tissue immunofluorescence, sections were deparaffinized, rehydrated, and subjected to antigen retrieval. Sections were permeabilized with 0.2% Triton X-100, blocked with 3% BSA, and incubated overnight at 4°C with primary antibodies against α-SMA (#BM3902, 1:200; Boster, Pleasanton, California, USA) or OPN (#sc-21742, 1:200; Santa Cruz Biotechnology), followed by incubation with Cy3-conjugated secondary antibody (#A0516, Beyotime). All samples were mounted with an anti-fade mounting medium and visualized under a fluorescence microscope (#BZ-X800, Keyence, Osaka, Japan). Co-localization analysis was performed on the acquired images.
Transmission electron microscopy
For the observation of mitochondrial ultrastructure in vascular endothelial cells by transmission electron microscopy, the cell samples were processed as follows. Treated HCMEC/D3 cells were collected by trypsinization, centrifuged to form a pellet, and fixed with electron microscope fixation buffer (#G1102, Servicebio) at room temperature for 30 min. After fixation, samples were stored at 4°C and subsequently imaged to examine mitochondrial ultrastructure.
Lipid peroxidation assay
Lipid peroxidation was assessed using the C11-BODIPY 581/591 probe (#S0043S, Beyotime). For cellular assays, treated HCMEC/D3 cells in 48-well plates were incubated with the C11-BODIPY working solution at 37°C for 15 min, washed with PBS, and immediately imaged under a fluorescence microscope. For tissue assays, fresh-frozen brain sections were incubated with the C11-BODIPY working solution for 30 min at 37°C in the dark. After washing with PBS and counterstaining with DAPI, the sections were mounted and visualized under a fluorescence microscope.
Mitochondrial reactive oxygen species (ROS) detection
Mitochondrial superoxide production was monitored using the MitoSOX Red reagent (#S0061S, Beyotime). For cellular assays, treated HCMEC/D3 cells were incubated with MitoSOX Red working solution at 37°C for 15 min, washed with PBS, and then imaged under a fluorescence microscope. For tissue assays, fresh-frozen brain sections were incubated with MitoSOX Red working solution for 30 min at 37°C. After washing and DAPI counterstaining, the sections were mounted and visualized under a fluorescence microscope.
Detection of mitochondrial membrane potential (ΔΨm)
The ΔΨm level was assessed using the JC-1 assay kit (#C2006, Beyotime). Briefly, treated cells were collected, washed with PBS, and resuspended in 1 mL of JC-1 working solution. After incubation at 37°C for 20 min in the dark, the cells were centrifuged, and the supernatant was removed. The cell pellet was then washed once with JC-1 staining buffer and finally resuspended in the same buffer for immediate analysis. The fluorescence intensity was measured using a flow cytometer (#RMNNC-3000, Agilent, Santa Clara, California, USA).
Measurement of glutathione (GSH), malondialdehyde (MDA), and ferrous iron (Fe2+) levels
Intracellular and tissue levels of GSH, MDA, and Fe2+ were quantified using commercial colorimetric kits according to the manufacturers’ instructions. GSH was measured using a Micro Reduced Glutathione Assay Kit (#A006-2-1, Jiancheng Bioengineering, Nanjing, China) for cells and a Reduced Glutathione Content Assay Kit (#BC1175, Solarbio) for tissues. MDA content was determined using the MDA Assay Kit (#A003-4-1, Jiancheng Bioengineering) for cells and the MDA Colorimetric Assay Kit (#E-BC-K025-M, Elabscience, Wuhan, Hubei, China) for tissues. Fe2+ concentration was detected using a Ferrous Iron Assay Kit (#BL1147A, Biosharp, Beijing, China) for cells and a Ferrous Ion Colorimetric Assay Kit (#E-BC-K773-M, Elabscience) for tissues. All absorbance measurements were performed using a microplate reader (#Multiskan FC, Thermo Fisher Scientific).
Co-culture system and VSMC morphological observation
A non-contact co-culture system was established to investigate the communication between vascular endothelial cells and VSMCs. HCMEC/D3 cells were seeded in the upper chamber of a Transwell insert, while VSMCs were seeded in the lower chamber. HCMEC/D3 cells were pre-treated according to experimental groups. After the indicated treatments, the co-culture system was maintained to allow paracrine signaling. The morphological changes of VSMCs in the lower chamber were subsequently observed and photographed under a microscope.
Western blot analysis
Protein extracts from tissues or cells were prepared using RIPA lysis buffer supplemented with protease inhibitors, and protein concentrations were determined with a BCA assay kit. Equal amounts of protein were separated by SDS-PAGE and transferred onto PVDF membranes. After blocking with 5% skim milk, the membranes were incubated overnight at 4°C with specific primary antibodies (all used at 1:1000 dilution), followed by incubation with appropriate HRP-conjugated secondary antibodies (1:5000) for 2 h at room temperature. The target proteins were visualized using an enhanced chemiluminescence substrate, and β-actin served as the loading control. The primary antibodies used included: β-actin (#66009-1-Ig, Proteintech), SPI1 (#66618-2-Ig, Proteintech), p53 (#10442-1-AP, Proteintech), GPX4 (#67763-1-Ig, Proteintech), SLC7A11 (#ab307601, Abcam, Cambridge, UK), ACSL4 (#M04372-1, Boster), TFRC (#84766-4-RR, Proteintech), α-SMA (#BM4172, Boster), SM22α (#10493-1-AP, Proteintech), OPN (#22952-1-AP, Proteintech), matrix metalloproteinase-9 (MMP-9, #2270, Cell Signaling, Danvers, MA, USA), EP300 (#20695-1-AP, Proteintech), FOSL2 (#15832-1-AP, Proteintech), HDAC1 (#10197-1-AP, Proteintech), HDAC2 (#12922-3-AP, Proteintech), HDAC3 (#10255-1-AP, Proteintech), p16 (#80772, Cell Signaling), p21 (#ab109520, Abcam), p-YAP1 (#80694-2-RR, Proteintech), and YAP1 (#66900-1-Ig, Proteintech).
Quantitative real-time PCR (qRT-PCR)
Total RNA was extracted from tissues or cells using TRIzol reagent (#G3013, Servicebio) and reverse-transcribed into cDNA using the PrimeScript RT reagent kit (#RR047A, Takara, Otsu, Shiga, Japan). Quantitative PCR was performed with TB Green Premix Ex Taq II (#RR820Q, Takara) on a real-time PCR system (#SLAN-96S, HSG LASER, Foshan, Guangdong, China). The reaction mixture contained TB Green Premix, primers, ROX Reference Dye, cDNA template, and RNase-free water. The amplification protocol consisted of initial denaturation at 95°C for 30 s, followed by 40 cycles of 95°C for 5 s and 60°C for 34 s. The relative mRNA expression levels of target genes (SPI1, EP300, FOSL2, α-SMA, SM22α, OPN, MMP-9, p53) were normalized to β-actin and calculated using the 2−ΔΔCt method. Primer sequences are listed in Supplemental Table 1.
Co-immunoprecipitation (Co-IP) and acetylation assay
Protein lysates were prepared using RIPA buffer containing protease inhibitors. For Co-IP assays, protein lysate was incubated with antibodies against SPI1 (#66618-2-Ig, Proteintech), EP300 (#20695-1-AP, Proteintech), or FOSL2 (#15832-1-AP, Proteintech) at 4°C overnight, followed by incubation with Protein A/G magnetic beads (#P2179S, Beyotime). Normal IgG was used as a negative control. The immunoprecipitated complexes were washed, eluted, and subjected to Western blot analysis. To assess FOSL2 acetylation, immunoprecipitation was performed using an anti-FOSL2 antibody, and the precipitates were probed with an anti-acetylated-lysine antibody (#9441S, Cell Signaling). Western blot procedures followed protocols as described above.
Dual-luciferase reporter assay
The transcriptional activity of the p53 promoter was assessed using a dual-luciferase reporter assay. Cells were co-transfected with a pGL3-based p53 promoter-luciferase reporter plasmid and the pRL-TK Renilla luciferase control vector using Lipo8000™ transfection reagent (#C0533, Beyotime). After 24-48 h of transfection, cells were lysed, and luciferase activity was measured using a dual-luciferase reporter assay kit (#RG027, Beyotime) according to the manufacturer’s instructions. Firefly luminescence was normalized to Renilla luminescence for each sample, and the relative luciferase activity was calculated to evaluate p53 promoter activation under different experimental conditions.
Protein-protein interaction (PPI) network analysis
To predict the PPI among EP300, SPI1, and FOSL2, an analysis was performed using the STRING database (https://string-db.org). Official gene symbols (EP300, SPI1, FOSL2) were entered into the “Multiple proteins” search mode, with the organism set to Homo sapiens. The resulting PPI network was visualized as nodes and lines.
EdU staining for cell proliferation
HCMEC/D3 cells were seeded into 48-well plates and incubated overnight. EdU staining was performed using the BeyoClick™ EdU-488 kit according to the manufacturer’s instructions. Briefly, cells were incubated with 20 μM EdU working solution at 37°C for 2 h. After removal of the medium, cells were fixed with 4% paraformaldehyde for 10 min, permeabilized with PBS containing 0.1% Triton X-100 for 5 min, and then incubated with Click reaction solution for 30 min in the dark. Nuclei were counterstained with Hoechst 33342 for 5 min. After washing, cells were mounted with anti-fade mounting medium and observed under a fluorescence microscope (Olympus IX73).
Transwell cell migration assay
HCMEC/D3 cells were transfected for 48 h, harvested, and resuspended in serum‑free medium at a density of 2 × 10⁵ cells/mL. A total of 100 μL cell suspension was added to the upper chamber of a 24‑well Transwell plate, while 600 μL complete medium containing 10% FBS was placed in the lower chamber. Cells were incubated at 37°C with 5% CO2 for 24 h. Non‑migrated cells on the upper surface were gently removed with a cotton swab. Migrated cells were fixed with 4% paraformaldehyde for 30 min, stained with 0.2% crystal violet (#G1014-50ML, Servicebio) for 20 min, and washed three times with PBS. Images were captured under an inverted fluorescence microscope (#BZ-X800, Keyence).
Senescence-associated β-galactosidase (SA-β-gal) staining
Cellular senescence was assessed using an SA-β-gal staining kit (#C0602, Beyotime). HCMEC/D3 cells were seeded in 96-well plates at 1 × 10⁶ cells/mL and incubated at 37°C with 5% CO2. After removal of the culture medium, cells were fixed with β-gal fixative solution for 15 min at room temperature, washed three times with PBS, and then incubated with freshly prepared staining working solution overnight at 37°C. Stained cells were observed and imaged under an inverted fluorescence microscope (#BZ-X800, Keyence).
Statistical analysis
Each assay was performed for three independent replicates. Data were analyzed using GraphPad Prism 8.0 (La Jolla, CA, USA) and expressed as mean ± standard deviation (SD). Normality was assessed using the Shapiro-Wilk test, complemented by Quantile-Quantile plots. Homogeneity of variances was evaluated using Levene’s test. For comparisons between two groups, two-tailed Student’s t-test was applied. For multiple group comparisons, one-way analysis of variance (ANOVA) was used. A p-value of <0.05 was considered statistically significant.
Results
SPI1 was upregulated in intracranial aneurysms and HCMEC/D3 cells
To investigate the role of SPI1 in IA pathogenesis, an IA mouse model was established. Compared to the Sham group, IA model mice exhibited significant neurological deficits (Figure 1(a)), hypertension (Figure 1(b)), vascular bulging of skull base (Figure 1(c)), and an increased circumference of the Willis circle (Figure 1(e)). Histological analysis via H&E and Masson staining revealed structural deterioration, including uneven vascular wall thickness, increased diameter, and disorganized collagen fibers in model mice (Figure 1(d) and (f)). Critically, SPI1 expression was significantly elevated at the Willis circle in IA model mice (Figure 1(g)–(i)). In HCMEC/D3 cells, the optimal concentration (10−5 mol/L) of Ang II for simulating the pathological state of IA was determined using a CCK-8 assay (Figure 1(j)). Ang II treatment resulted in a significant upregulation of SPI1 at both the mRNA and protein levels in HCMEC/D3 cells (Figure 1(k) and (l)). Immunofluorescence staining further confirmed the increased expression of SPI1 in Ang II-treated HCMEC/D3 cells (Figure 1(m)). These findings indicated that SPI1 was highly expressed in both in vivo and in vitro models of IA.
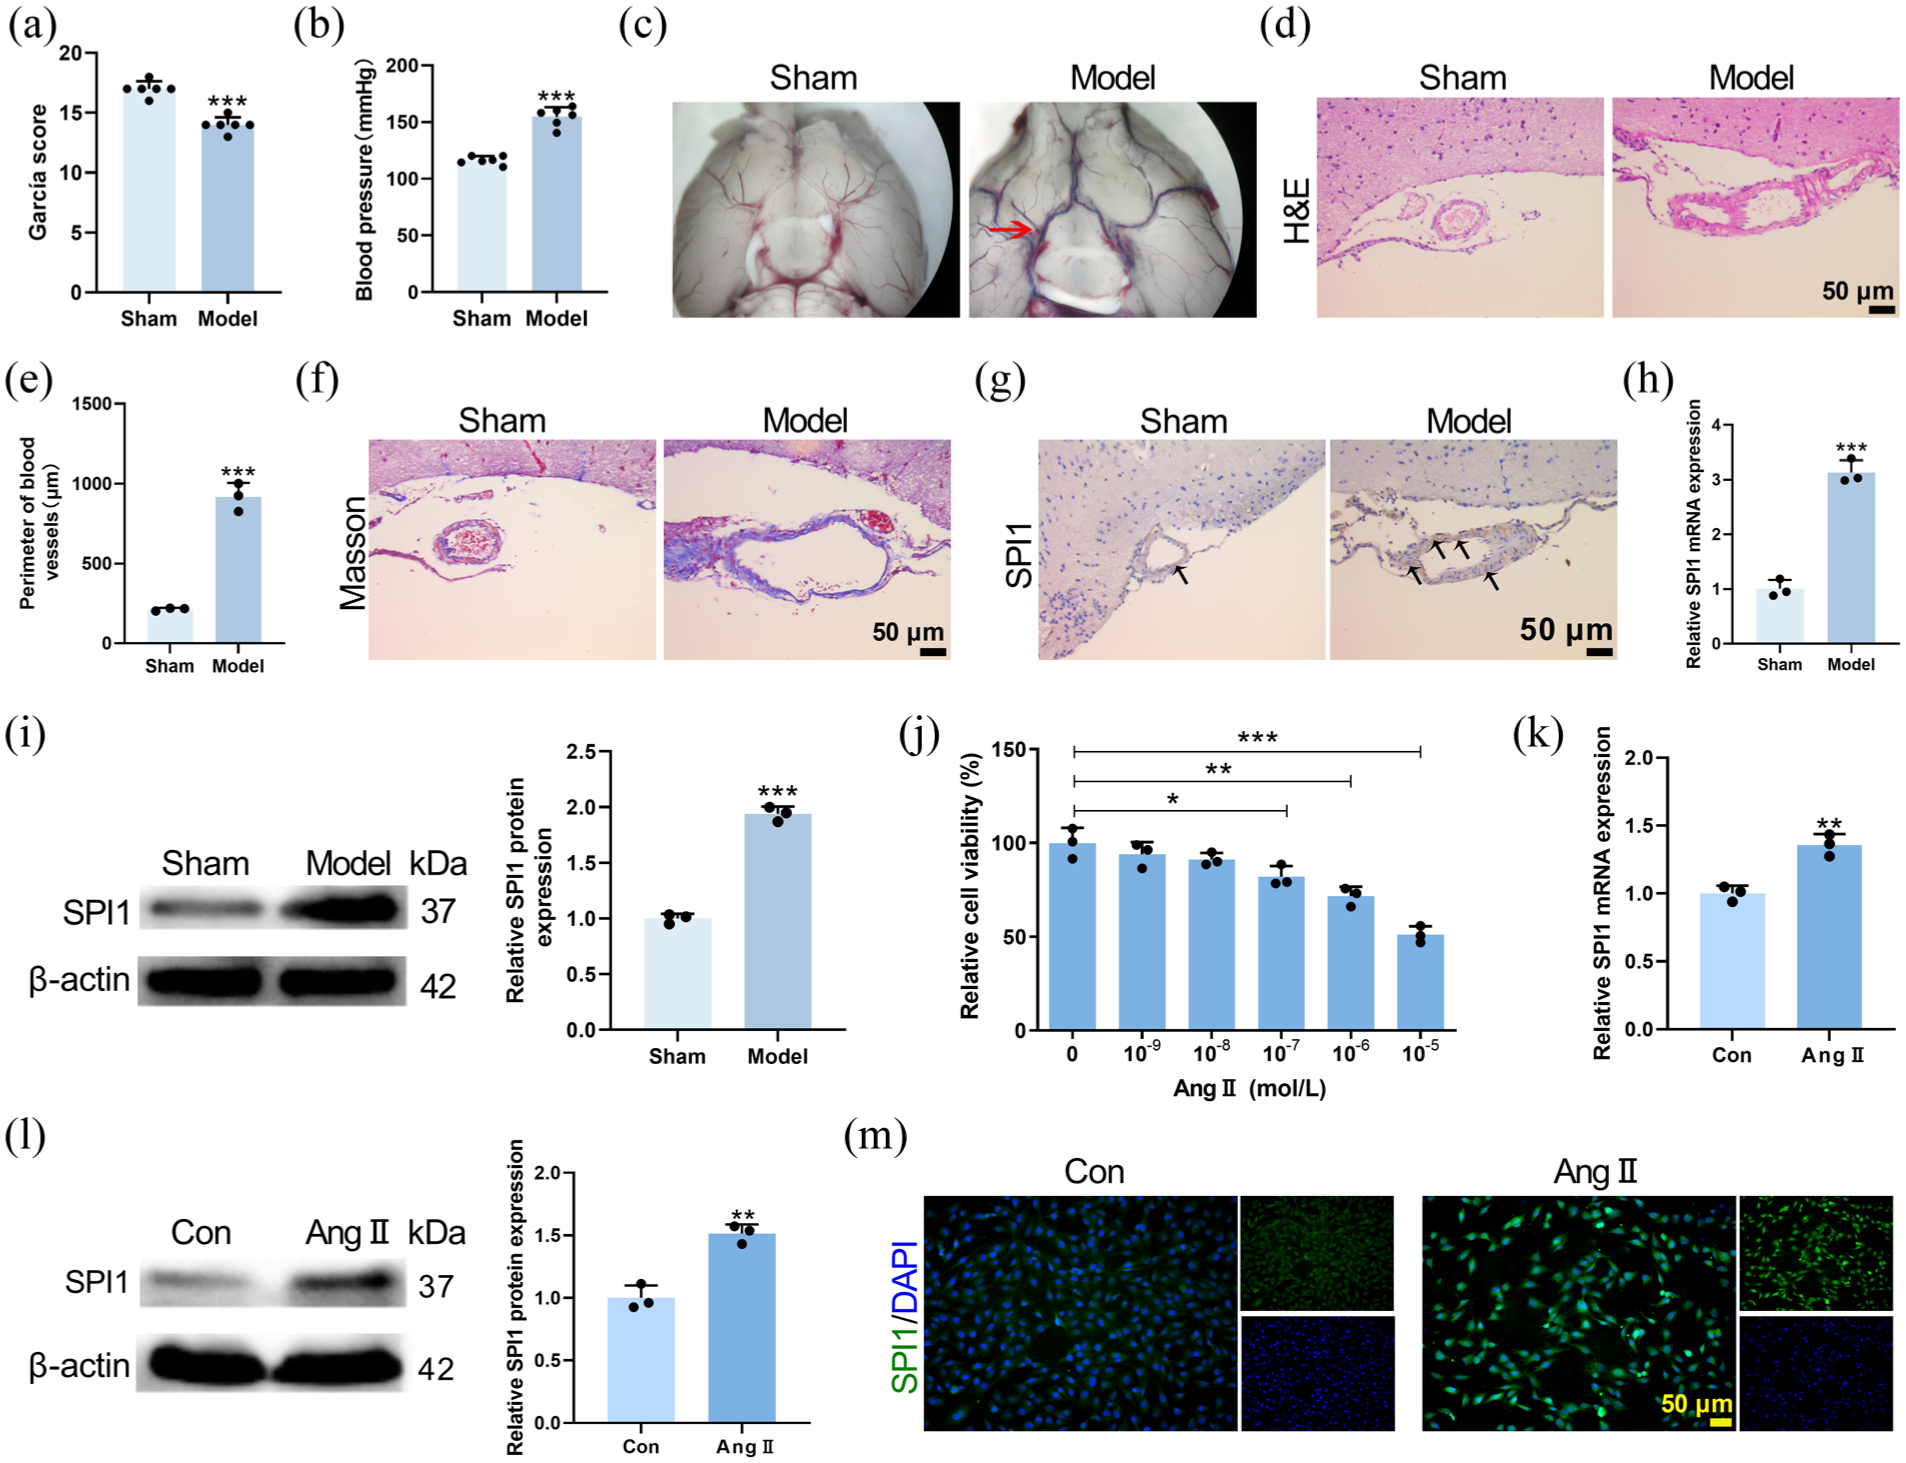
SPI1 was upregulated in IA mouse Willis circle and Ang II-induced HCMEC/D3 cells. In vivo, male C57BL/6 mice underwent surgical induction of IA or sham surgery. (a) Modified Garcia scores assessing neurological function in Sham and IA model mice (p < 0.001). (b) Non-invasive measurement of tail blood pressure in mice (p < 0.001). (c) Stereomicroscope images showing vascular morphology of mouse skull base, with vascular bulging (red arrow) in the model group. (d) and (e) H&E staining demonstrating pathologic change in mouse Willis circle and quantification of the circumference of Willis circle based on H&E staining in Sham and IA model mice (p < 0.001). (f) Masson staining demonstrating pathologic change in mouse Willis circle. (g) Immunohistochemical staining was conducted to assess SPI1 expression in the Willis circle of mice, with black arrows indicating SPI1-positive area. (h) and (i) The mRNA and protein level of SPI1 were detected by qRT-PCR and western blot, respectively, using isolated vascular tissues from the mouse Willis circle (p < 0.001). In vitro, HCMEC/D3 cells were treated with or without Ang II. (j) CCK-8 assay determining the optimal concentration (10−5 mol/L) of Ang II for treating HCMEC/D3 cells (F = 29.45, p < 0.0001). (k) and (l) qRT-PCR (p = 0.0032) and western blot (p = 0.0020) analysis of SPI1 expression in HCMEC/D3 cells. (m) Immunofluorescence images showing SPI1 expression (green) in HCMEC/D3 cells, with nuclei stained using DAPI (blue).
SPI1 promoted HCMEC/D3 cell ferroptosis and facilitated the transition of VSMCs to a synthetic phenotype
The functional role of SPI1 in HCMEC/D3 cells was further explored. HCMEC/D3 cells were transfected with SPI1 overexpression or knockdown vectors prior to Ang II treatment. Transfection efficiency was confirmed by qRT-PCR and western blot (Figure 2(a), Supplemental Figures S1A and S2A and B). Overexpression of SPI1 exacerbated Ang II-induced ferroptosis, as evidenced by increased protein levels of p53, ACSL4 and TFRC, alongside decreased levels of GPX4 and SLC7A11 (Figure 2(b)). This was further supported by enhanced lipid peroxidation (Figure 2(c), Supplemental Figure S1B), reduced GSH (Figure 2(d)), elevated MDA (Figure 2(e)), heightened Fe2+ content (Figure 2(f)), increased mitochondrial ROS (Figure 2(g)), and decreased ΔΨm (Figure 2(h)). Moreover, SPI1 overexpression promoted Ang II-induced mitochondrial damage in HCMEC/D3 cells, as evidenced by the loss of cristae and rupture of the outer mitochondrial membrane (Figure 2(i)). Conversely, SPI1 knockdown markedly attenuated these indicators of ferroptosis.
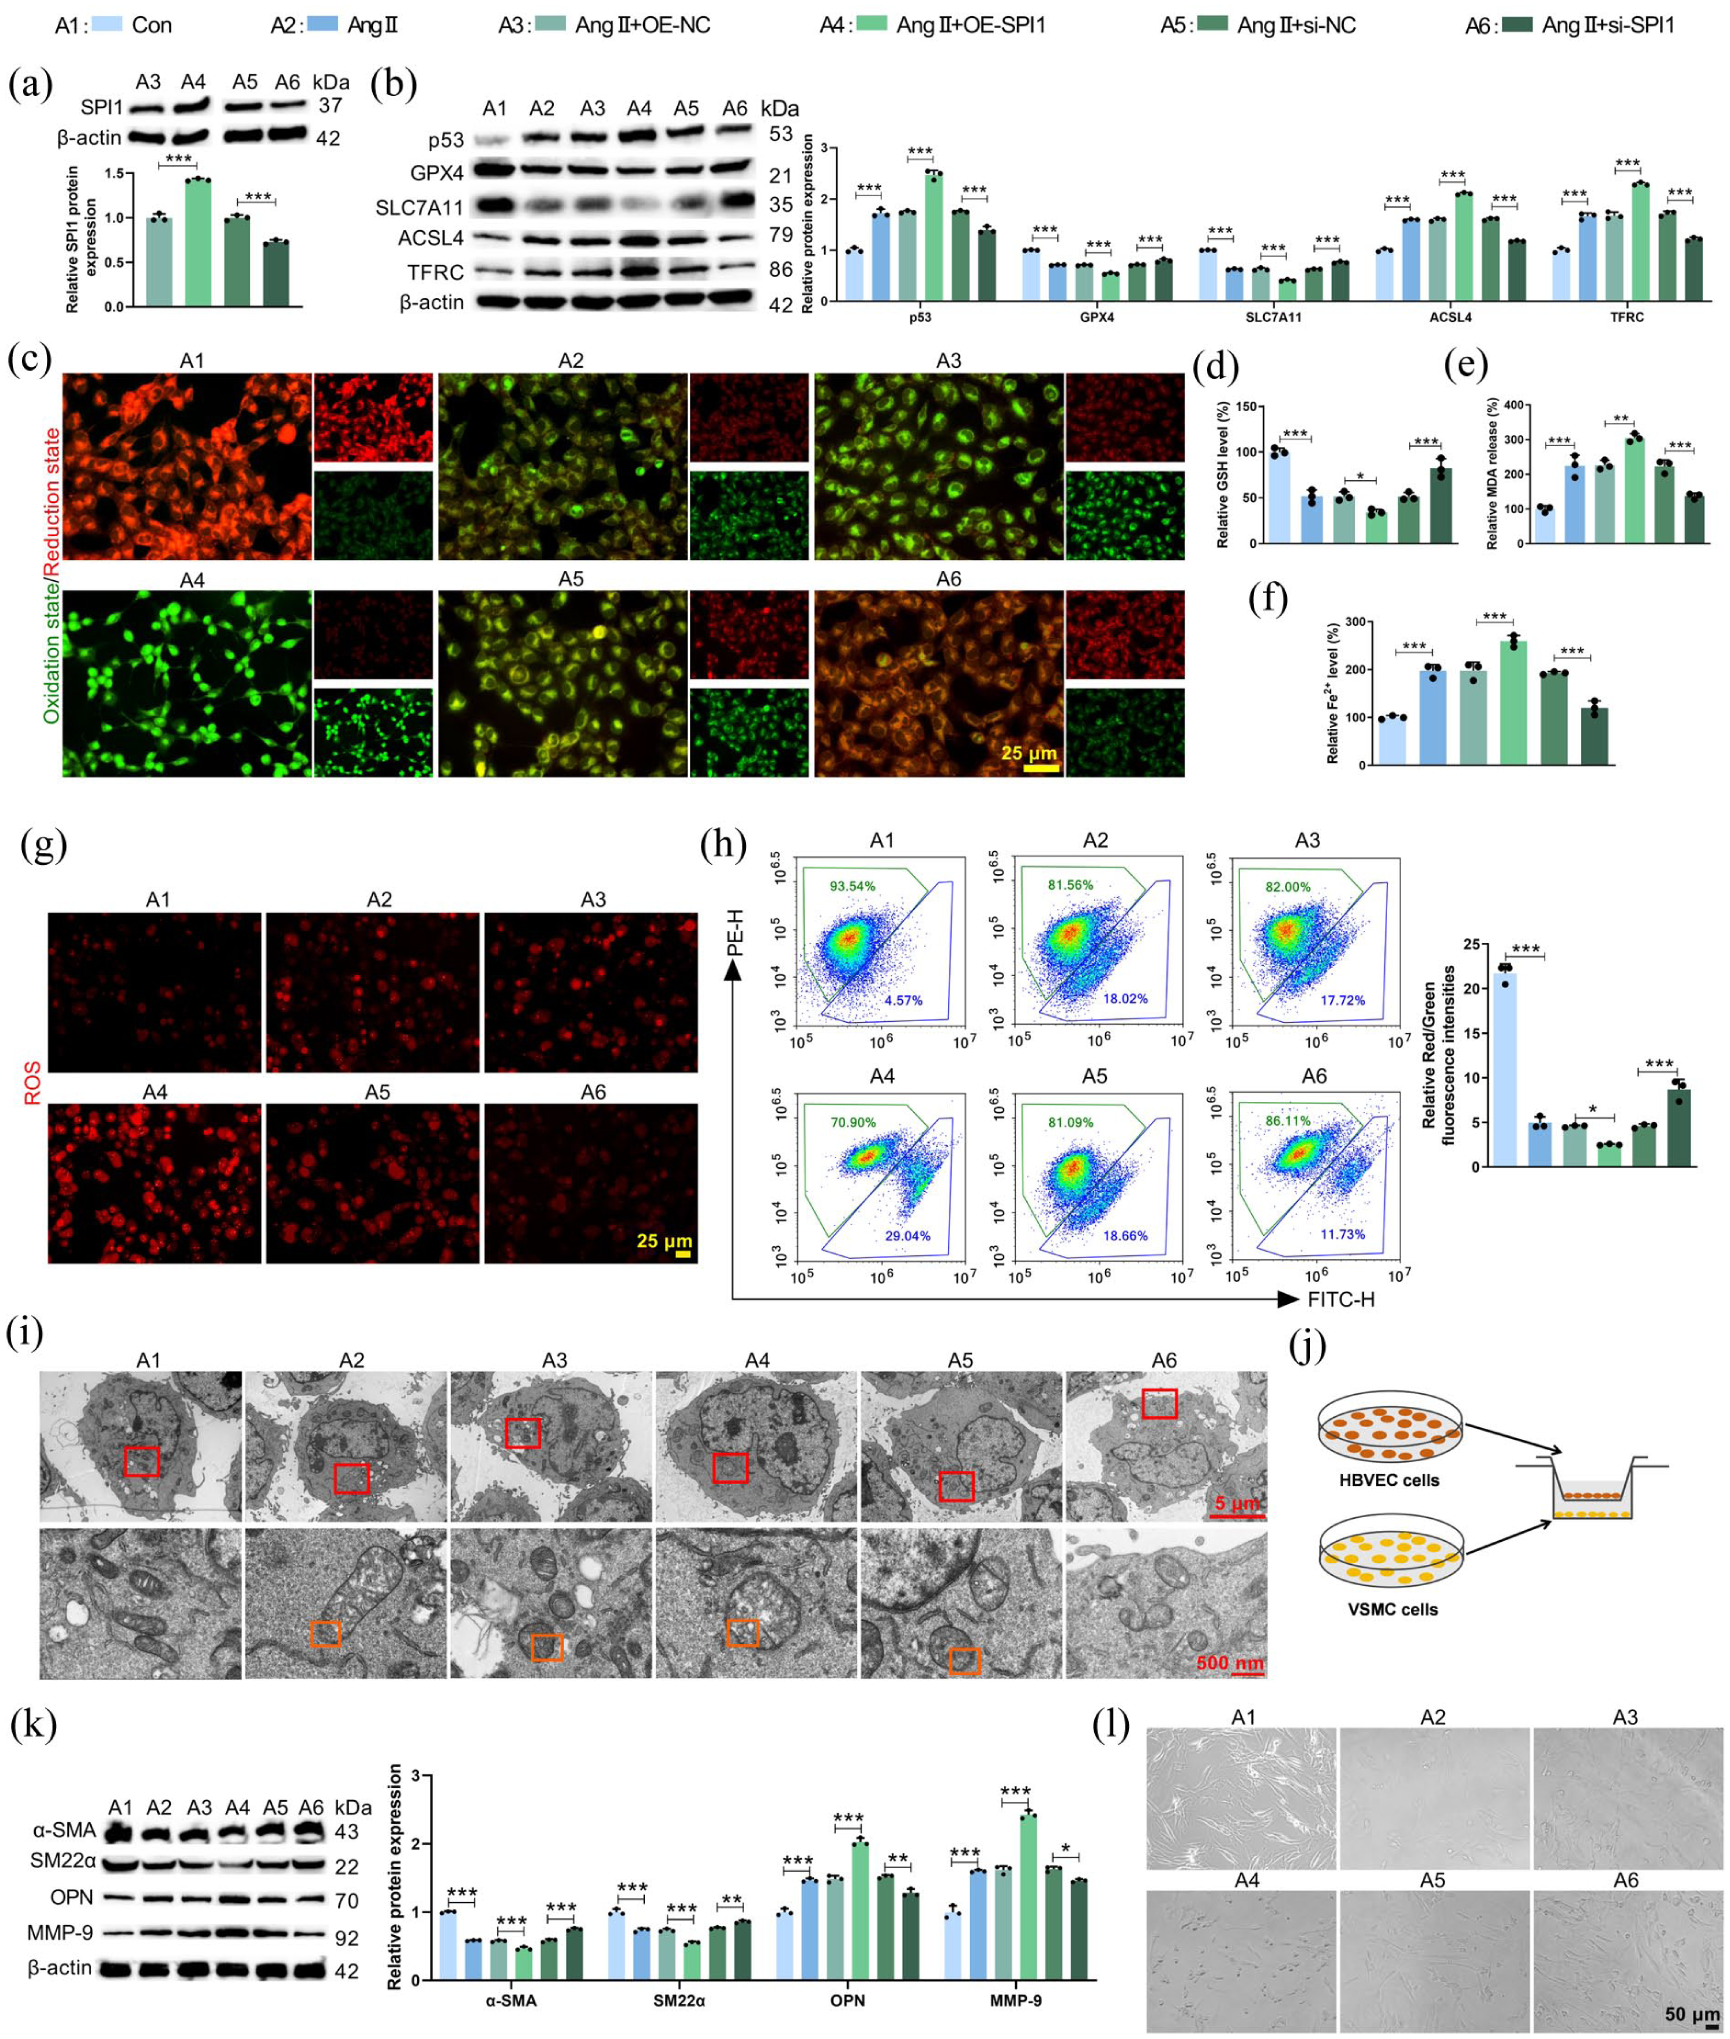
SPI1 influenced HCMEC/D3 cell ferroptosis and VSMC phenotypic switching in a co-culture system. HCMEC/D3 cells were transfected with OE-SPI1 or si-SPI1 before Ang II treatment. (a) Western blot confirming SPI1 level in HCMEC/D3 cells after SPI1 overexpression or knockdown (F = 277.4, p < 0.0001). (b) Western blot analysis of ferroptosis-related proteins (p53, GPX4, SLC7A11, ACSL4, TFRC) in HCMEC/D3 cells (Fp53 = 198.1, pp53 < 0.0001; FGPX4 = 231.4, pGPX4 < 0.0001; FSLC7A11 = 358.2, pSLC7A11 < 0.0001; FACSL4 = 811.8, pACSL4 < 0.0001; FTFRC = 245.7, pTFRC < 0.0001). (c) The lipid peroxidation level was measured by C11-BODIPY probe (green, oxidized; red, reduced). (d–f) Measurements of intracellular GSH (F = 45.70, p < 0.0001), MDA (F = 52.59, p < 0.0001), and Fe2+ (F = 70.29, p < 0.0001) levels in HCMEC/D3 cells. (g) Mitochondrial ROS level was detected by MitoSOX Red kit. (h) ΔΨm level was assessed by flow cytometry (F = 300.9, p < 0.0001). (i) Electron micrographs demonstrating the morphology of mitochondria, with red boxes indicating mitochondria and orange boxes highlighting cristae disruption and mitochondrial membrane rupture. HCMEC/D3 cells transfected with OE-SPI1 or si-SPI1 were co-cultured with VSMCs in vitro after Ang II treatment. (j) Schematic diagram showing the co-culture system of HCMEC/D3 cells and VSMCs. (k) Western blot analysis of VSMC contractile (α-SMA, SM22α) and synthetic (OPN, MMP-9) markers in the co-culture system (Fα-SMA = 616.3, pα-SMA < 0.0001; FSM22α = 100.6, pSM22α < 0.0001; FOPN = 161.7, pOPN < 0.0001; FMMP-9 = 218.0, pMMP-9 < 0.0001). (l) The morphology of VSMCs was examined by morphological analysis.
Given the communication between HCMEC/D3 cells and VSMCs, a non-contact co-culture system was established (Figure 2(j)). SPI1 overexpression in HCMEC/D3 cells promoted a synthetic VSMC phenotype, characterized by decreased contractile markers (α-SMA, SM22α) and increased synthetic markers (OPN, MMP-9) at both the protein (Figure 2(k)) and mRNA levels (Supplemental Figure S1C). Morphologically, VSMCs co-cultured with SPI1-overexpressing HCMEC/D3 cells displayed a more synthetic appearance with reduced spindle-shaped morphology (Figure 2(l)), indicative of the synthetic (dedifferentiated) VSMC phenotype. SPI1 knockdown in HCMEC/D3 cells had the opposite effect, promoting a contractile VSMC phenotype. Collectively, these findings positioned SPI1 as a key regulator of Ang II-induced ferroptosis in endothelial cells and the ensuing phenotypic modulation of VSMCs.
Inhibition of ferroptosis in HCMEC/D3 cells attenuated SPI1-induced VSMC phenotypic switching
To confirm whether the effect of SPI1 on VSMC phenotype was mediated through ferroptosis, SPI1-overexpressing HCMEC/D3 cells were treated with the ferroptosis inhibitor Fer-1. Fer-1 treatment effectively counteracted SPI1 overexpression-induced pro-ferroptotic effects in Ang II-treated HCMEC/D3 cells, including restoring GPX4 and SLC7A11 expression, suppressing p53, ACSL4, and TFRC levels (Figure 3(a)), and normalizing lipid peroxidation (Figure 3(b)), GSH (Figure 3(c)), MDA (Figure 3(d)), Fe2+ (Figure 3(e)), mitochondrial ROS (Figure 3(f)), and ΔΨm (Figure 3(g) and (h)). Electron microscopy also confirmed that Fer-1 treatment restored the mitochondrial morphology that was disrupted by SPI1 overexpression (Figure 3(i)). In the co-culture system, inhibition of ferroptosis in SPI1-overexpressing HCMEC/D3 cells significantly rescued SPI1 overexpression-mediated the transition of VSMCs to a synthetic phenotype, as shown by elevated α-SMA and SM22α levels, decreased OPN and MMP-9 expression (Figure 3(j)–(l)) and increased number of contractile VSMCs (Figure 3(m)). Therefore, SPI1 influenced VSMC phenotypic switching by promoting ferroptosis in HCMEC/D3 cells.
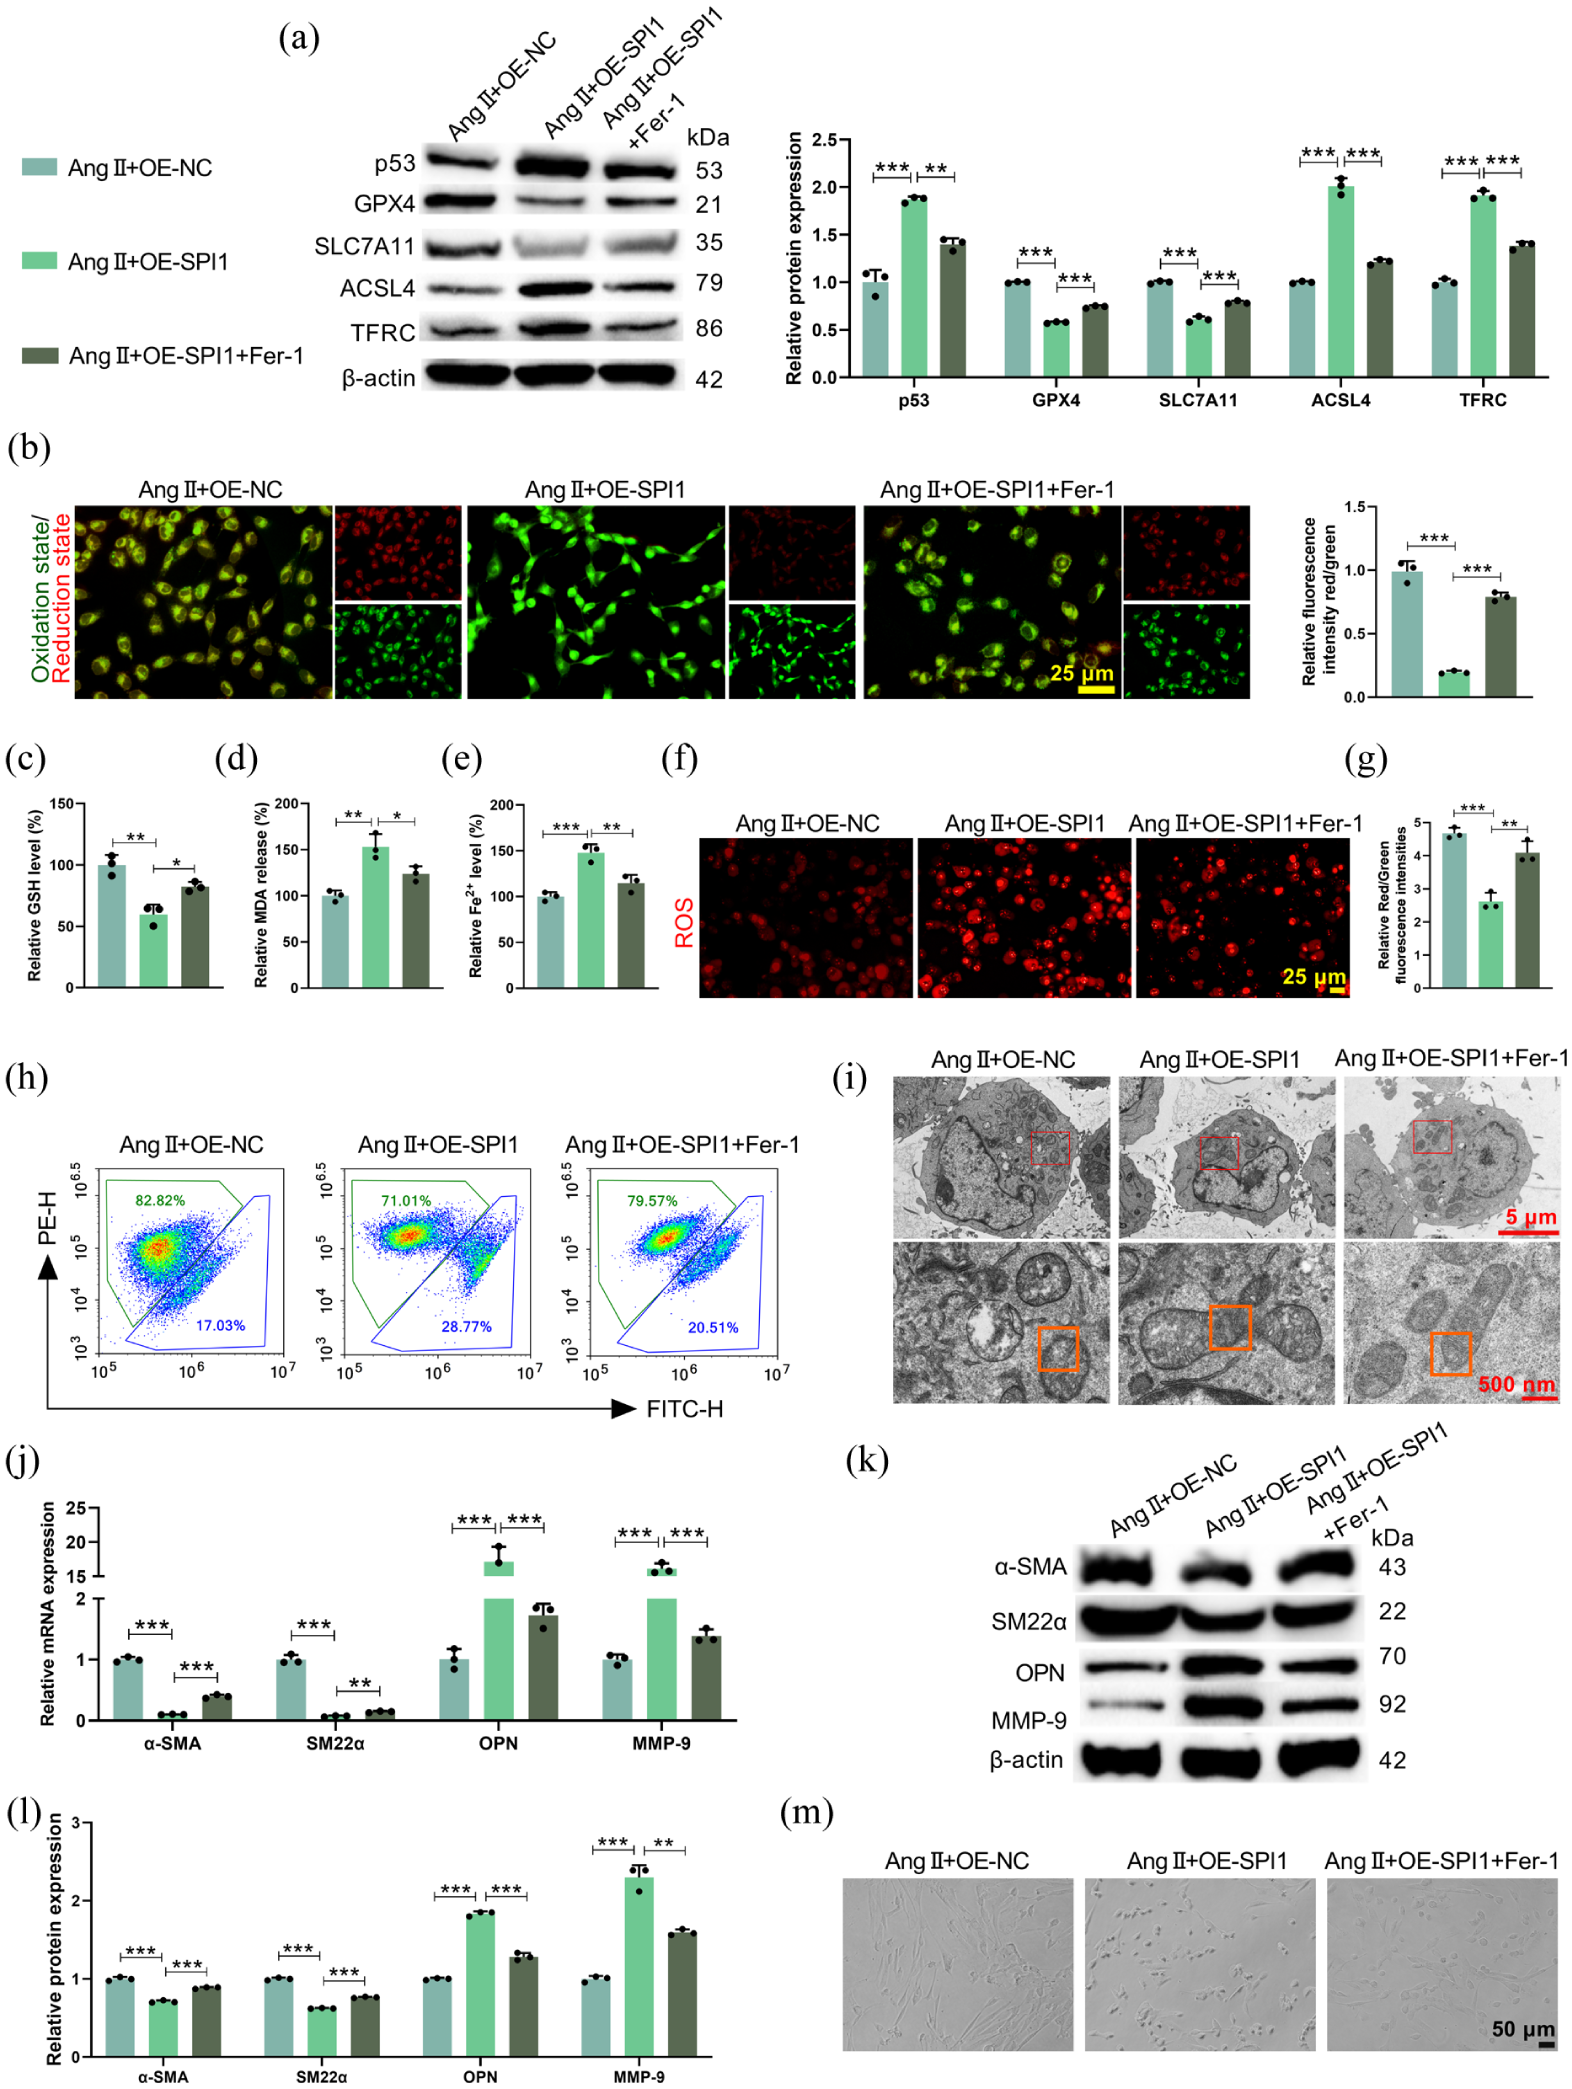
Inhibition of ferroptosis in HCMEC/D3 cells affected SPI1-induced VSMC phenotypic switching. Ang II-induced HCMEC/D3 cells were treated with the ferroptosis inhibitor Fer-1 after SPI1 overexpression. (a) Western blot analysis of ferroptosis-related proteins (p53, GPX4, SLC7A11, ACSL4, TFRC) in HCMEC/D3 cells (Fp53 = 77.28, pp53 < 0.0001; FGPX4 = 1209, pGPX4 < 0.0001; FSLC7A11 = 239.4, pSLC7A11 < 0.0001; FACSL4 = 308.5, pACSL4 < 0.0001; FTFRC = 350.0, pTFRC < 0.0001). (b–e) The levels of intracellular lipid peroxidation (F = 194.8, p = 0.0013), GSH (F = 24.65, p = 0.0013), MDA (F = 21.94, p = 0.0017), and Fe2+ (F = 28.17, p = 0.0009) in HCMEC/D3 cells were measured. (f) MitoSOX Red kit assay examining the mitochondrial ROS level in HCMEC/D3 cells. (g) and (h) Flow cytometry analysis evaluating ΔΨm level of HCMEC/D3 cells (F = 45.64, p = 0.0002). (i) Mitochondrial morphology of HCMEC/D3 cells was analyzed by electron micrographs, with red boxes indicating mitochondria and orange boxes highlighting cristae disruption and mitochondrial membrane rupture. HCMEC/D3 cells treated with SPI1 overexpression and Fer-1 were co-cultured with VSMCs in vitro. (j) and (l) qRT-PCR and Western blot analysis of VSMC contractile (α-SMA, SM22α) and synthetic (OPN, MMP-9) markers in the co-culture system ((j): Fα-SMA = 710.4, pα-SMA < 0.0001; FSM22α = 397.4, pSM22α < 0.0001; FOPN = 152.8, pOPN < 0.0001; FMMP-9 = 1034, pMMP-9 < 0.0001; (k) and (l): Fα-SMA = 187.2, pα-SMA < 0.0001; FSM22α = 918.9, pSM22α < 0.0001; FOPN = 494.9, pOPN < 0.0001; FMMP-9 = 139.3, pMMP-9 < 0.0001). (m) Morphological analysis demonstrating the morphology of VSMCs.
SPI1 promoted FOSL2 acetylation via upregulating EP300
STRING database analysis predicted an interaction between the histone acetyltransferase EP300 and both SPI1 and FOSL2 (Figure 4(a)). In Ang II-treated HCMEC/D3 cells, the expression of EP300 and FOSL2 was increased (Figure 4(b)). Immunofluorescence staining showed that Ang II treatment promoted the expression of FOSL2 and EP300 and enhanced their co-localization (Figure 4(c) and (d)). Phosphosite analysis identified a potential acetylation site on FOSL2 (Figure 4(e)). Furthermore, Ang II treatment increased FOSL2 acetylation in HCMEC/D3 cells compared with the control group (Figure 4(f)). Notably, SPI1 overexpression enhanced the interaction between SPI1 and EP300 (Figure 4(g)), while promoting FOSL2 acetylation, FOSL2 and EP300 levels (Figure 4(h)). SPI1 knockdown demonstrated the opposite effect. Moreover, pharmacological inhibition of EP300 with C646 reduced FOSL2 acetylation, whereas inhibition of deacetylases with TSA increased it (Figure 4(i)). Western blot revealed that C646 treatment reduced EP300 expression, increased histone deacetylase (HDAC1, HDAC2, HDAC3) levels (Figure 4(j)), diminished SPI1-EP300 interaction (Figure 4(k)), and reduced EP300-FOSL2 interaction (Figure 4(l)). In contrast, TSA treatment produced the opposite effect to C646. Immunofluorescence confirmed that C646 weakened the co-localization of SPI1 with EP300 and of EP300 with FOSL2, whereas TSA enhanced their co-localization (Figure 4(m)). Therefore, SPI1 promoted the acetylation of FOSL2 by upregulating EP300 in Ang II-treated HCMEC/D3 cells.
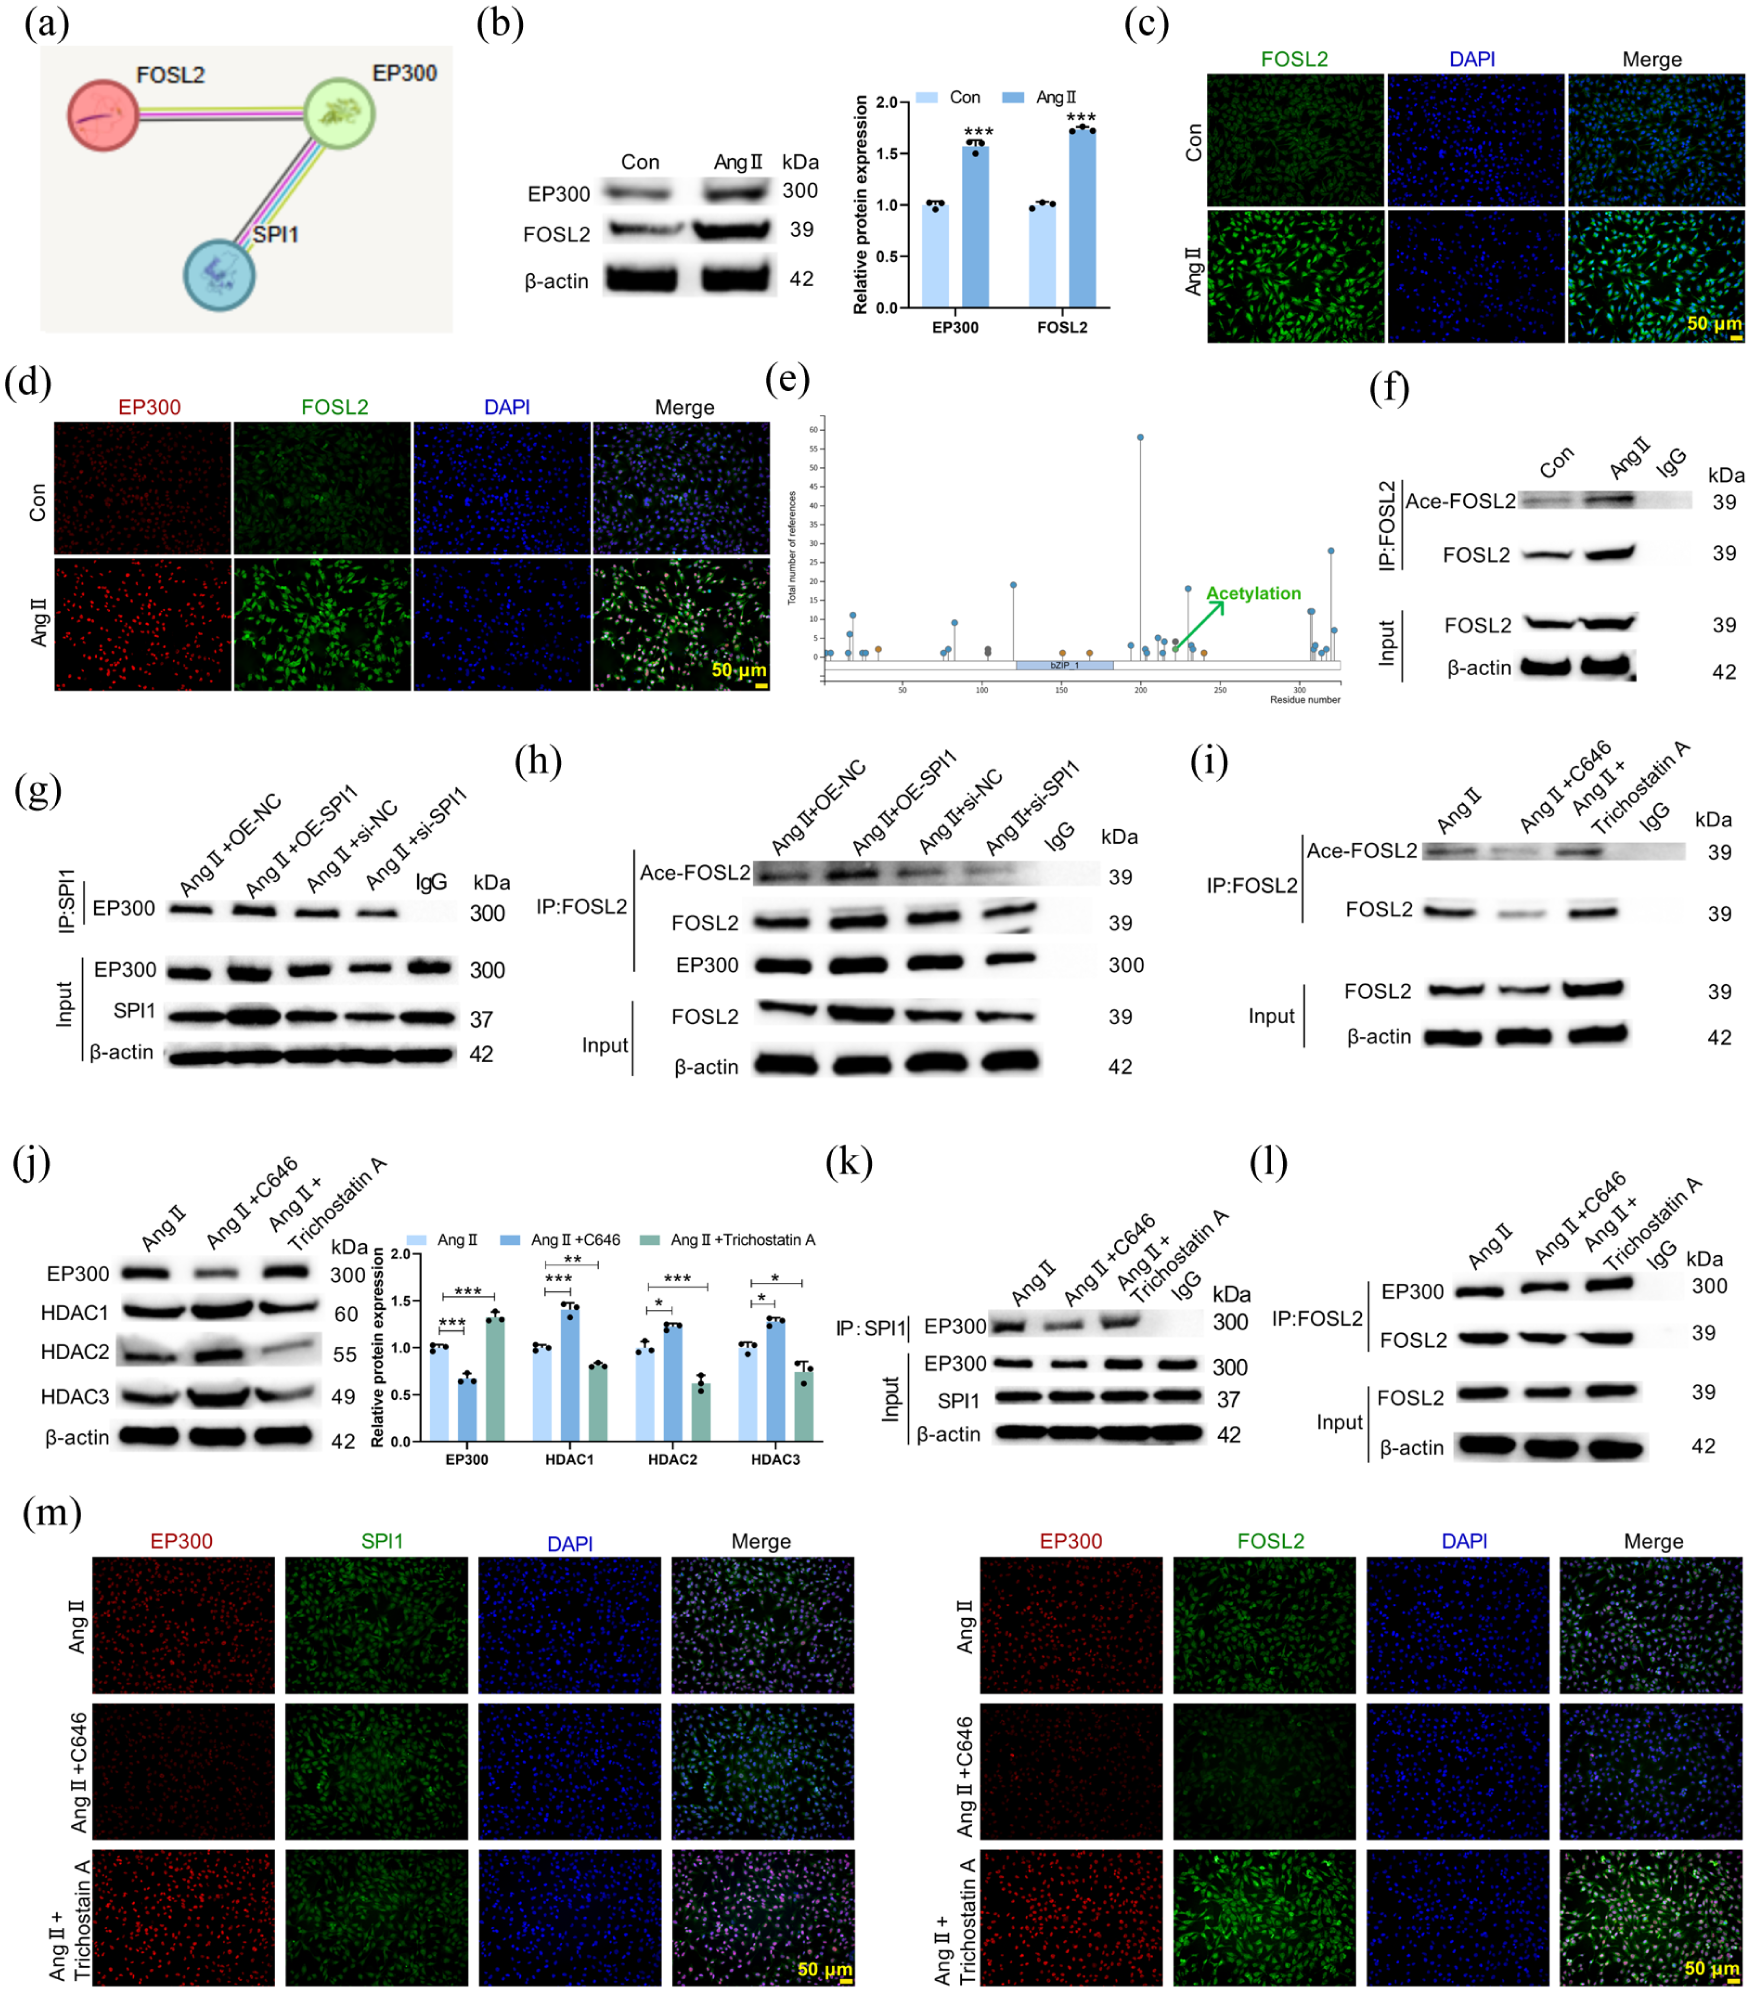
SPI1 regulated FOSL2 acetylation via the acetyltransferase EP300. (a) STRING database prediction of protein interactions between EP300, SPI1, and FOSL2. Purple lines denote experimentally determined interactions, yellow lines indicate text-mining evidence, black lines represent co-expression evidence, and blue lines correspond to gene co-occurrence evidence. HCMEC/D3 cells were treated with or without Ang II. (b) Western blot analysis of EP300 and FOSL2 expression in HCMEC/D3 cells (pEP300 < 0.001; pFOSL2 < 0.001). (c) Immunofluorescence staining showing FOSL2 expression and localization in HCMEC/D3 cells. (d) Co-localization relationship of FOSL2 (green) and EP300 (red) was examined by immunofluorescence staining. (e) A potential acetylation site on FOSL2 was predicted by Phosphosite database. (f) FOSL2 acetylation level in HCMEC/D3 cells was detected by Co-IP analysis. HCMEC/D3 cells were transfected with OE-SPI1 or si-SPI1 prior to Ang II treatment. (g) Co-IP assay showing the interaction between SPI1 and EP300. (h) Co-IP assay demonstrating FOSL2 acetylation level and EP300 expression under SPI1 modulation. HCMEC/D3 cells were treated with Ang II in the presence or absence of the EP300 inhibitor C646 or the deacetylase inhibitor TSA. (i) Co-IP analysis of FOSL2 acetylation level in HCMEC/D3 cells. (j) Western blot analysis of EP300, HDAC1, HDAC2, and HDAC3 expression in HCMEC/D3 cells (FEP300 = 139.4, pEP300 < 0.0001; FHDAC1 = 120.0, pHDAC1 < 0.0001; FHDAC2 = 66.46, pHDAC2 < 0.0001; FHDAC3 = 36.40, pHDAC3 = 0.0004). (k) Co-IP assay assessing the SPI1-EP300 interaction. (l) Co-IP analysis evaluating the interaction between FOSL2 and EP300. (m) The co-localization of SPI1 (green) with EP300 (red), and FOSL2 (green) with EP300 (red) was analyzed by immunofluorescence assay.
FOSL2 acetylation enhanced HCMEC/D3 cell ferroptosis
To assess the role of FOSL2 acetylation in Ang II-treated HCMEC/D3 cells, acetylation-mimic (FOSL2-AMP) and acetylation-resistant (FOSL2-AIP) mutants were employed. A luciferase reporter assay revealed that FOSL2-AMP significantly enhanced the promoter activity of p53, a key regulator of ferroptosis (Figure 5(a)). Accordingly, FOSL2-AMP potentiated ferroptosis in HCMEC/D3 cells, demonstrated by increased p53 expression (Figure 5(b), Supplemental Figure S4A), decreased GPX4 and SLC7A11 levels, elevated ACSL4 and TFRC expression (Figure 5(b), Supplemental Figure S4B), enhanced lipid peroxidation (Figure 5(c), Supplemental Figure S4C), reduced GSH level (Figure 5(d)), increased MDA production (Figure 5(e)), enhanced Fe2+ accumulation (Figure 5(f)), exacerbated mitochondrial ROS generation (Figure 5(g)), declined ΔΨm level (Figure 5(h)), and aggravated mitochondrial damage (Figure 5(i)). In contrast, the FOSL2-AIP mutant attenuated these effects. Subsequently, FOSL2 was knocked down in HCMEC/D3 cells that were transfected with either the mutant (FOSL2-AMP, or FOSL2-AIP) or an empty vector. The knockdown efficiency of FOSL2 was confirmed by qRT-PCR and Western blot (Supplemental Figure S2C and D). Notably, we further validated the knockdown efficiency under co-transfection conditions by Western blot (Supplemental Figure S4D), confirming that si-FOSL2 effectively downregulated FOSL2 protein expression even when co-transfected with FOSL2 mutant plasmids. Consistent with the results from the FOSL2-AIP mutant, knockdown of FOSL2 also suppressed ferroptosis in Ang II-stimulated HCMEC/D3 cells (Figure 5(j)–(r), Supplemental Figure S4E and F). Importantly, FOSL2 knockdown effectively abolished the pro-ferroptotic effects induced by the FOSL2-AMP mutant, as shown by the reversal of ferroptosis-related protein expression (Figure 5(j), Supplemental Figure S4E), lipid peroxidation (Figure 5(k), Supplemental Figure S4F), GSH level (Figure 5(l)), MDA production (Figure 5(m)), Fe2+ content (Figure 5(n)), mitochondrial ROS level (Figure 5(o)), ΔΨm level (Figure 5(p) and (q)), and mitochondrial morphology (Figure 5(r)). Moreover, concurrent FOSL2 knockdown further enhanced the inhibitory effect of the FOSL2-AIP mutant on Ang II-induced ferroptosis in HCMEC/D3 cells. These findings established that FOSL2 acetylation was critical for initiating ferroptosis in response to Ang II in HCMEC/D3 cells.
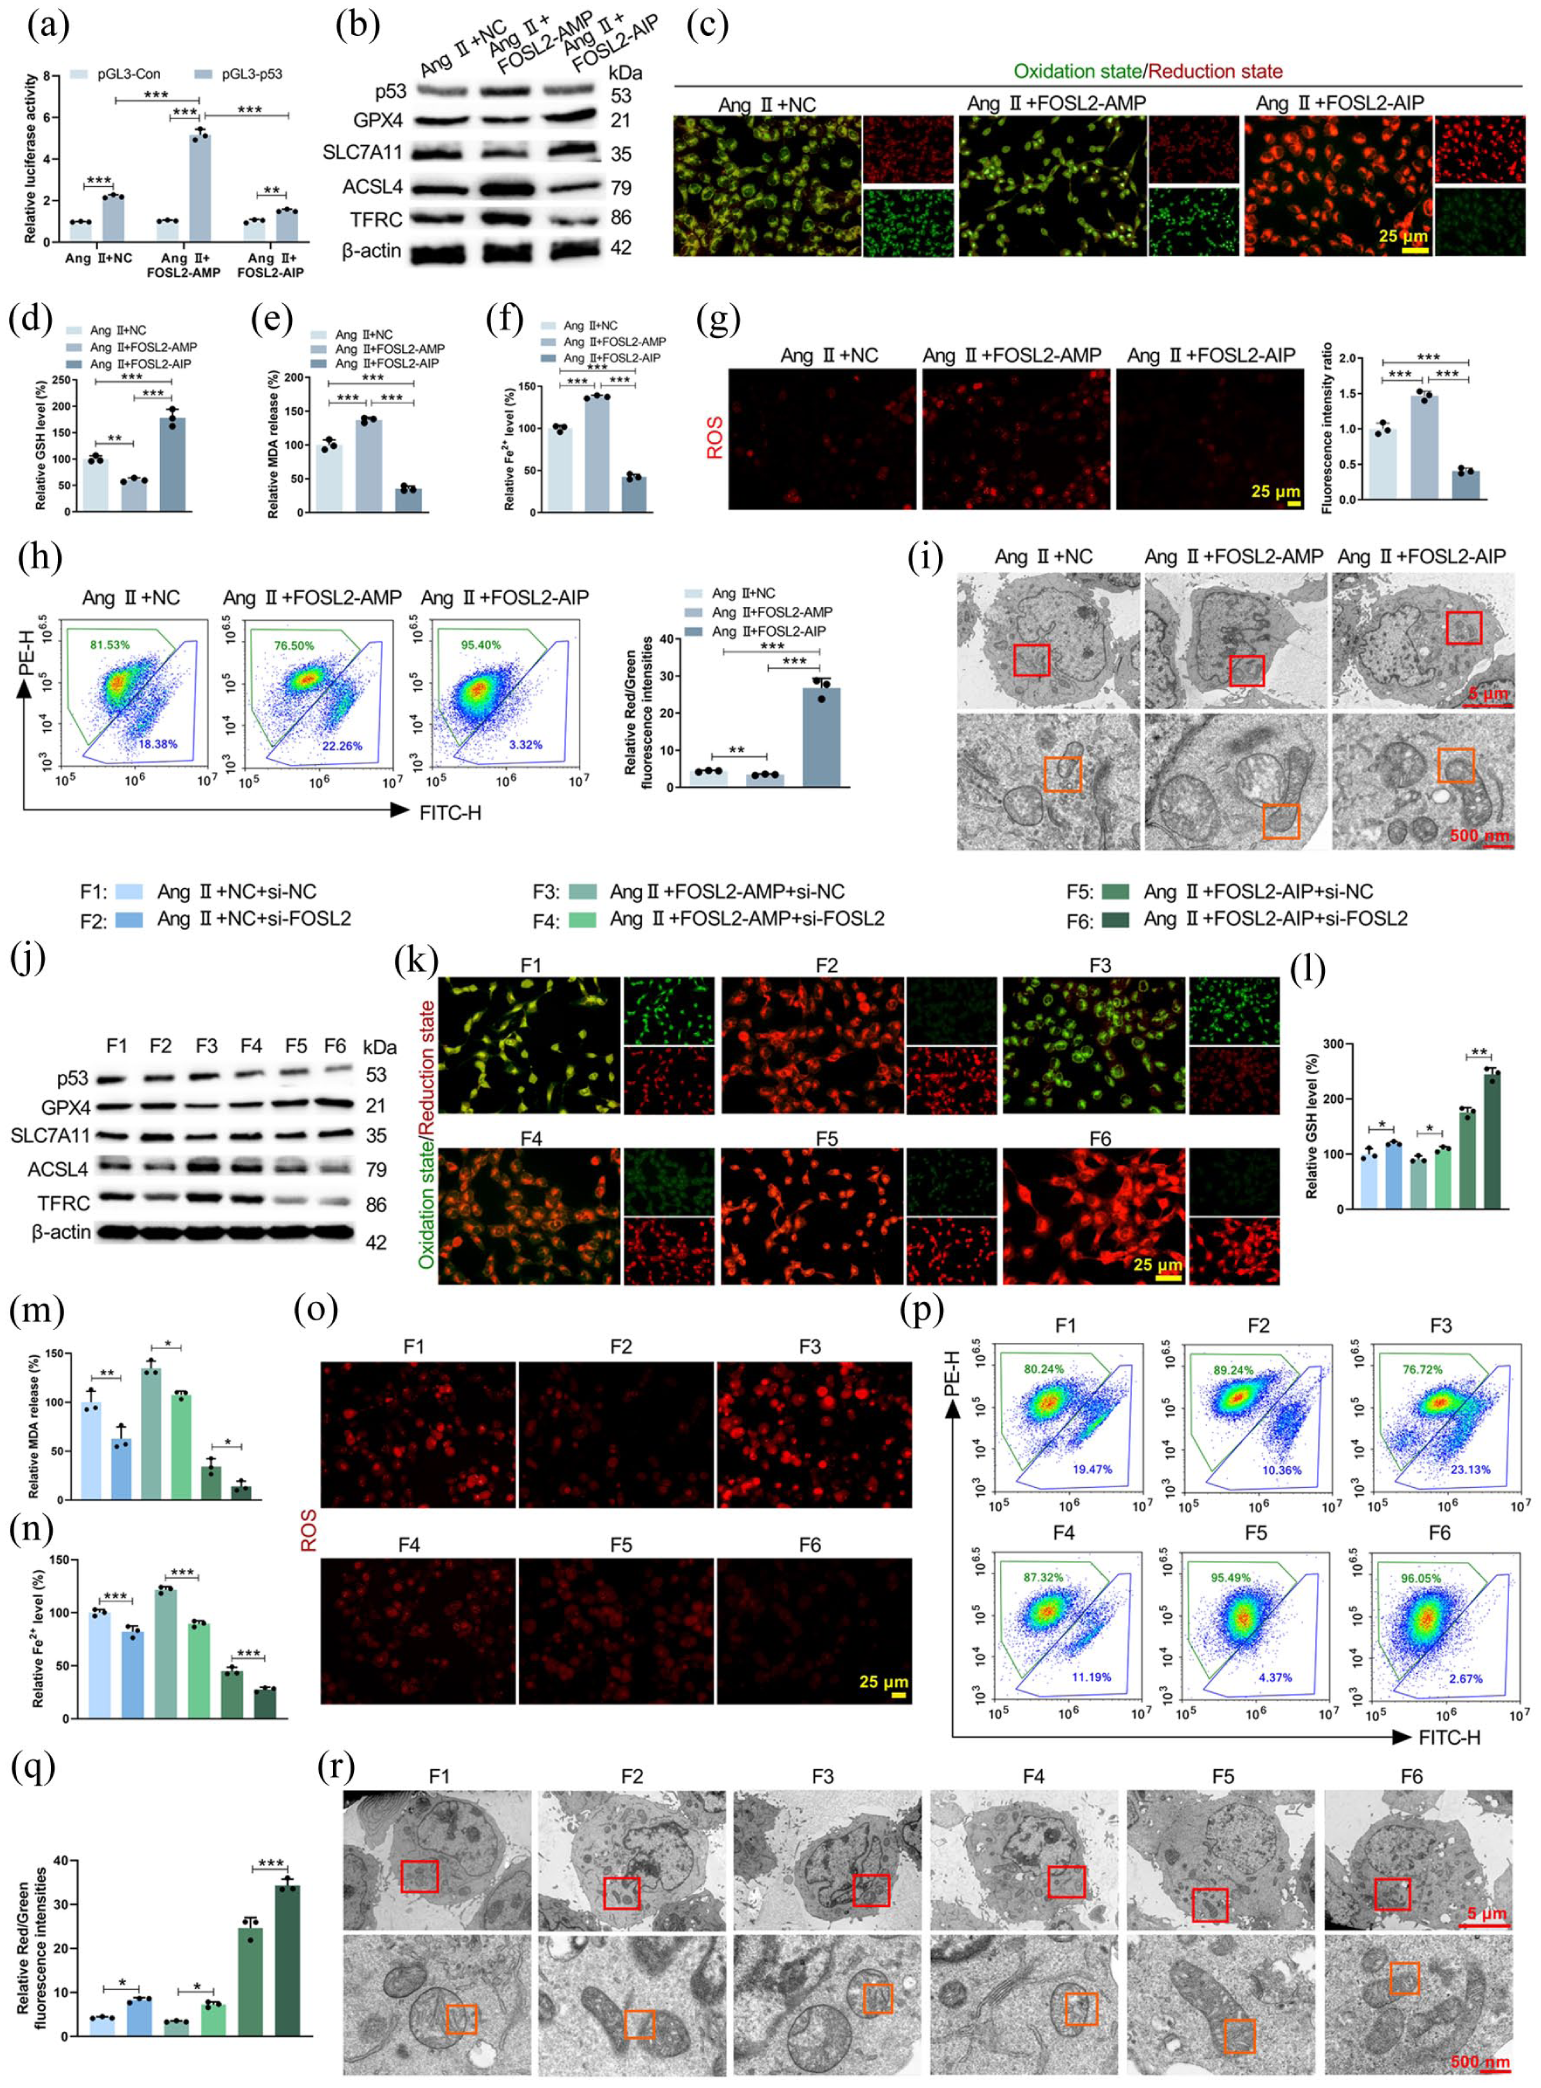
FOSL2 acetylation influenced HCMEC/D3 cell ferroptosis. HCMEC/D3 cells were transfected with acetylation-mimic (FOSL2-AMP) or acetylation-resistant (FOSL2-AIP) mutants. (a) Luciferase reporter assay measuring p53 promoter activity (pAng II + NC < 0.001; pAng II + FOSL2-AMP < 0.001; pAng II + FOSL2-AIP = 0.0011; FPGL3-p53 = 409.9, pPGL3-p53 < 0.0001). (b) Western blot analysis of ferroptosis-related proteins (p53, GPX4, SLC7A11, ACSL4, TFRC). (c) Assessment of lipid peroxidation level was conducted by C11-BODIPY probe. (d–f) Measurements of intracellular GSH (F = 100.9, p < 0.0001), MDA (F = 283.2, p < 0.0001), and Fe2+ (F = 768.3, p < 0.0001) levels. (g) Mitochondrial ROS level was evaluated by MitoSOX Red kit (F = 0.7594, p < 0.0001). (h) Flow cytometry analysis measuring ΔΨm level of HCMEC/D3 cells (F = 230.1, p < 0.0001). (i) Electron micrographs demonstrating morphological changes of mitochondria. HCMEC/D3 cells were co-transfected with FOSL2 mutants and si-FOSL2 or si-NC. (j) Western blot showing the levels of ferroptosis-related proteins. (k–n) Measurements of intracellular lipid peroxidation, GSH, MDA, and Fe2+ levels ((l): F = 170.1, p < 0.0001; (m): F = 87.90, p < 0.0001; (n): F = 303.9, p < 0.0001). (o–q) Mitochondrial ROS and ΔΨm (F = 341.3, p < 0.0001) levels were respectively analyzed by MitoSOX Red kit and flow cytometry. (r) Electron micrographs showing mitochondrial morphological changes.
SPI1 drove HCMEC/D3 cell ferroptosis via FOSL2
HCMEC/D3 cells were treated with Ang II after transfection with OE-FOSL2 or si-SPI1 + OE-FOSL2. The efficiency of SPI1 knockdown and FOSL2 overexpression was confirmed (Supplemental Figure S2A, B, E, and F). Notably, we further validated the co-transfection efficiency (Supplemental Figure S5), confirming that transfection of OE-FOSL2 alone caused no significant change in SPI1 protein expression while markedly elevating FOSL2 abundance; upon co-transfection with si-SPI1, both SPI1 and FOSL2 protein levels were markedly suppressed. As shown in Figure 6(a)–(i), FOSL2 overexpression alone significantly exacerbated Ang II-induced ferroptosis. In contrast, concurrent SPI1 knockdown effectively counteracted the pro-ferroptotic effects induced by FOSL2 overexpression. This effect was demonstrated by a partial reversal of ferroptosis-related protein levels (Figure 6(a)), lipid peroxidation (Figure 6(b)), GSH level (Figure 6(c)), MDA production (Figure 6(d)), Fe2+ content (Figure 6(e)), mitochondrial ROS level (Figure 6(f)), ΔΨm level (Figure 6(g) and (h)), and mitochondrial morphology (Figure 6(i)). In addition, neither overexpression nor silencing of FOSL2 exerted significant effects on SPI1 mRNA and protein expression, further verifying that SPI1 acts upstream of FOSL2 rather than being regulated by FOSL2 (Supplemental Figure S3). Together, these data indicated that SPI1 promoted ferroptosis primarily through regulating FOSL2.
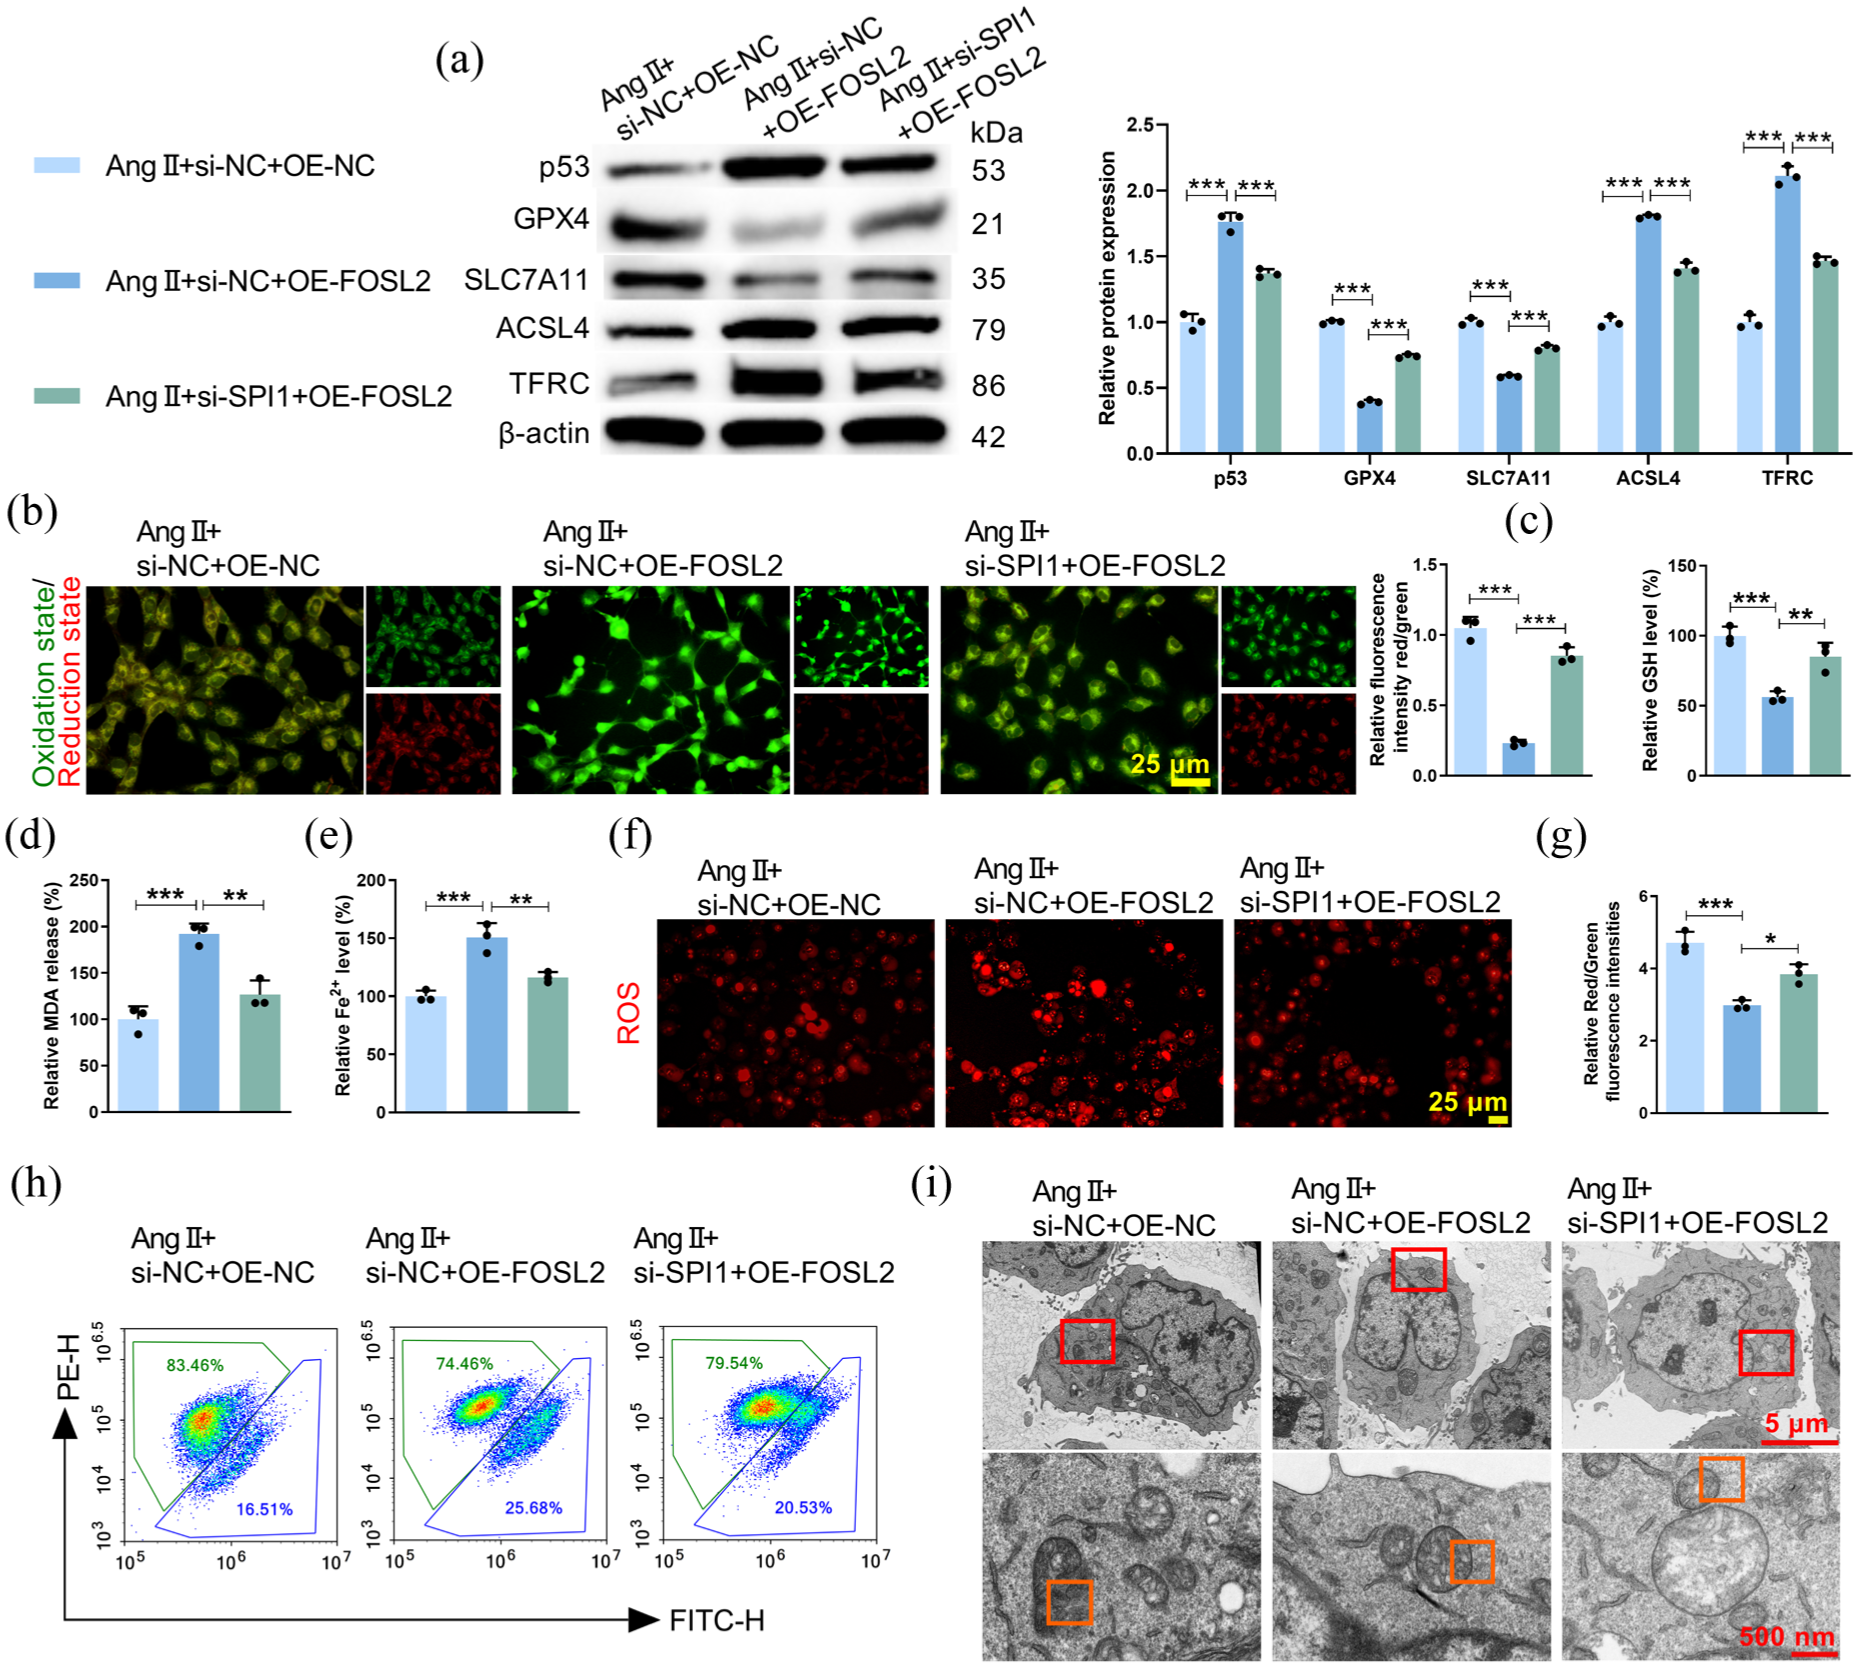
SPI1 influenced HCMEC/D3 cell ferroptosis via regulating FOSL2. HCMEC/D3 cells under Ang II stimulation were co-transfected with: si-NC + OE-NC, si-NC + OE-FOSL2, or si-SPI1 + OE-FOSL2. (a) Western blot analysis measuring the levels of ferroptosis-related proteins (Fp53 = 134.8, pp53 < 0.0001; FGPX4 = 1110, pGPX4 < 0.0001; FSLC7A11 = 280.7, pSLC7A11 < 0.0001; FACSL4 = 362.4, pACSL4 < 0.0001; FTFRC = 300.7, pTFRC < 0.0001). (b–e) Quantitative analysis of lipid peroxidation (F = 157.7, p < 0.0001), GSH (F = 28.08, p = 0.0009), MDA (F = 36.04, p = 0.0005), and Fe2+ (F = 29.51, p = 0.0008) levels in HCMEC/D3 cells. (f–h) MitoSOX Red kit and flow cytometry were respectively performed to assess the mitochondrial ROS and ΔΨm (F = 36.69, p = 0.0004) levels. (i) Electron micrographs of mitochondria.
SPI1 inhibitor DB2313 suppressed IA formation in vivo
Finally, the therapeutic potential of targeting SPI1 was evaluated in vivo. Administration of the SPI1 inhibitor DB2313 to IA model mice significantly reduced the expression of SPI1, EP300, and FOSL2 (Figure 7(a), Supplemental Figure S6) and decreased FOSL2 acetylation (Figure 7(b)). DB2313 treatment effectively suppressed ferroptosis in the Willis circle of IA mice, as shown by downregulation of p53, ACSL4, and TFRC, and upregulation of GPX4 and SLC7A11 (Figure 7(c) and (d)). This was accompanied by reduced lipid peroxidation (Figure 7(e)), increased GSH level (Figure 7(f)), decreased MDA level (Figure 7(g)), reduced ROS level (Figure 7(h)), lower Fe2+ content (Figure 7(i)), and restored ΔΨm (Figure 7(j)). Furthermore, DB2313 promoted a contractile VSMC phenotype, with increased α-SMA and SM22α levels and decreased OPN and MMP-9 expression (Figure 7(k) and (l)). Immunofluorescence jointly confirmed the DB2313-induced upregulation of α-SMA and downregulation of OPN in the Willis circle of IA mice (Figure 7(m) and (n)). Most importantly, DB2313 treatment alleviated IA progression, improving the pathological structure in the Willis circle (Figure 7(o)), reducing its circumference (Figure 7(p)), diminishing vascular bulging (Figure 7(q)), improving neurological scores (Figure 7(r)), and decreasing tail blood pressure (Figure 7(s)). Consequently, SPI1 inhibition mitigated ferroptosis and promoted a contractile VSMC phenotype in the Willis circle, which ultimately attenuated IA progression.
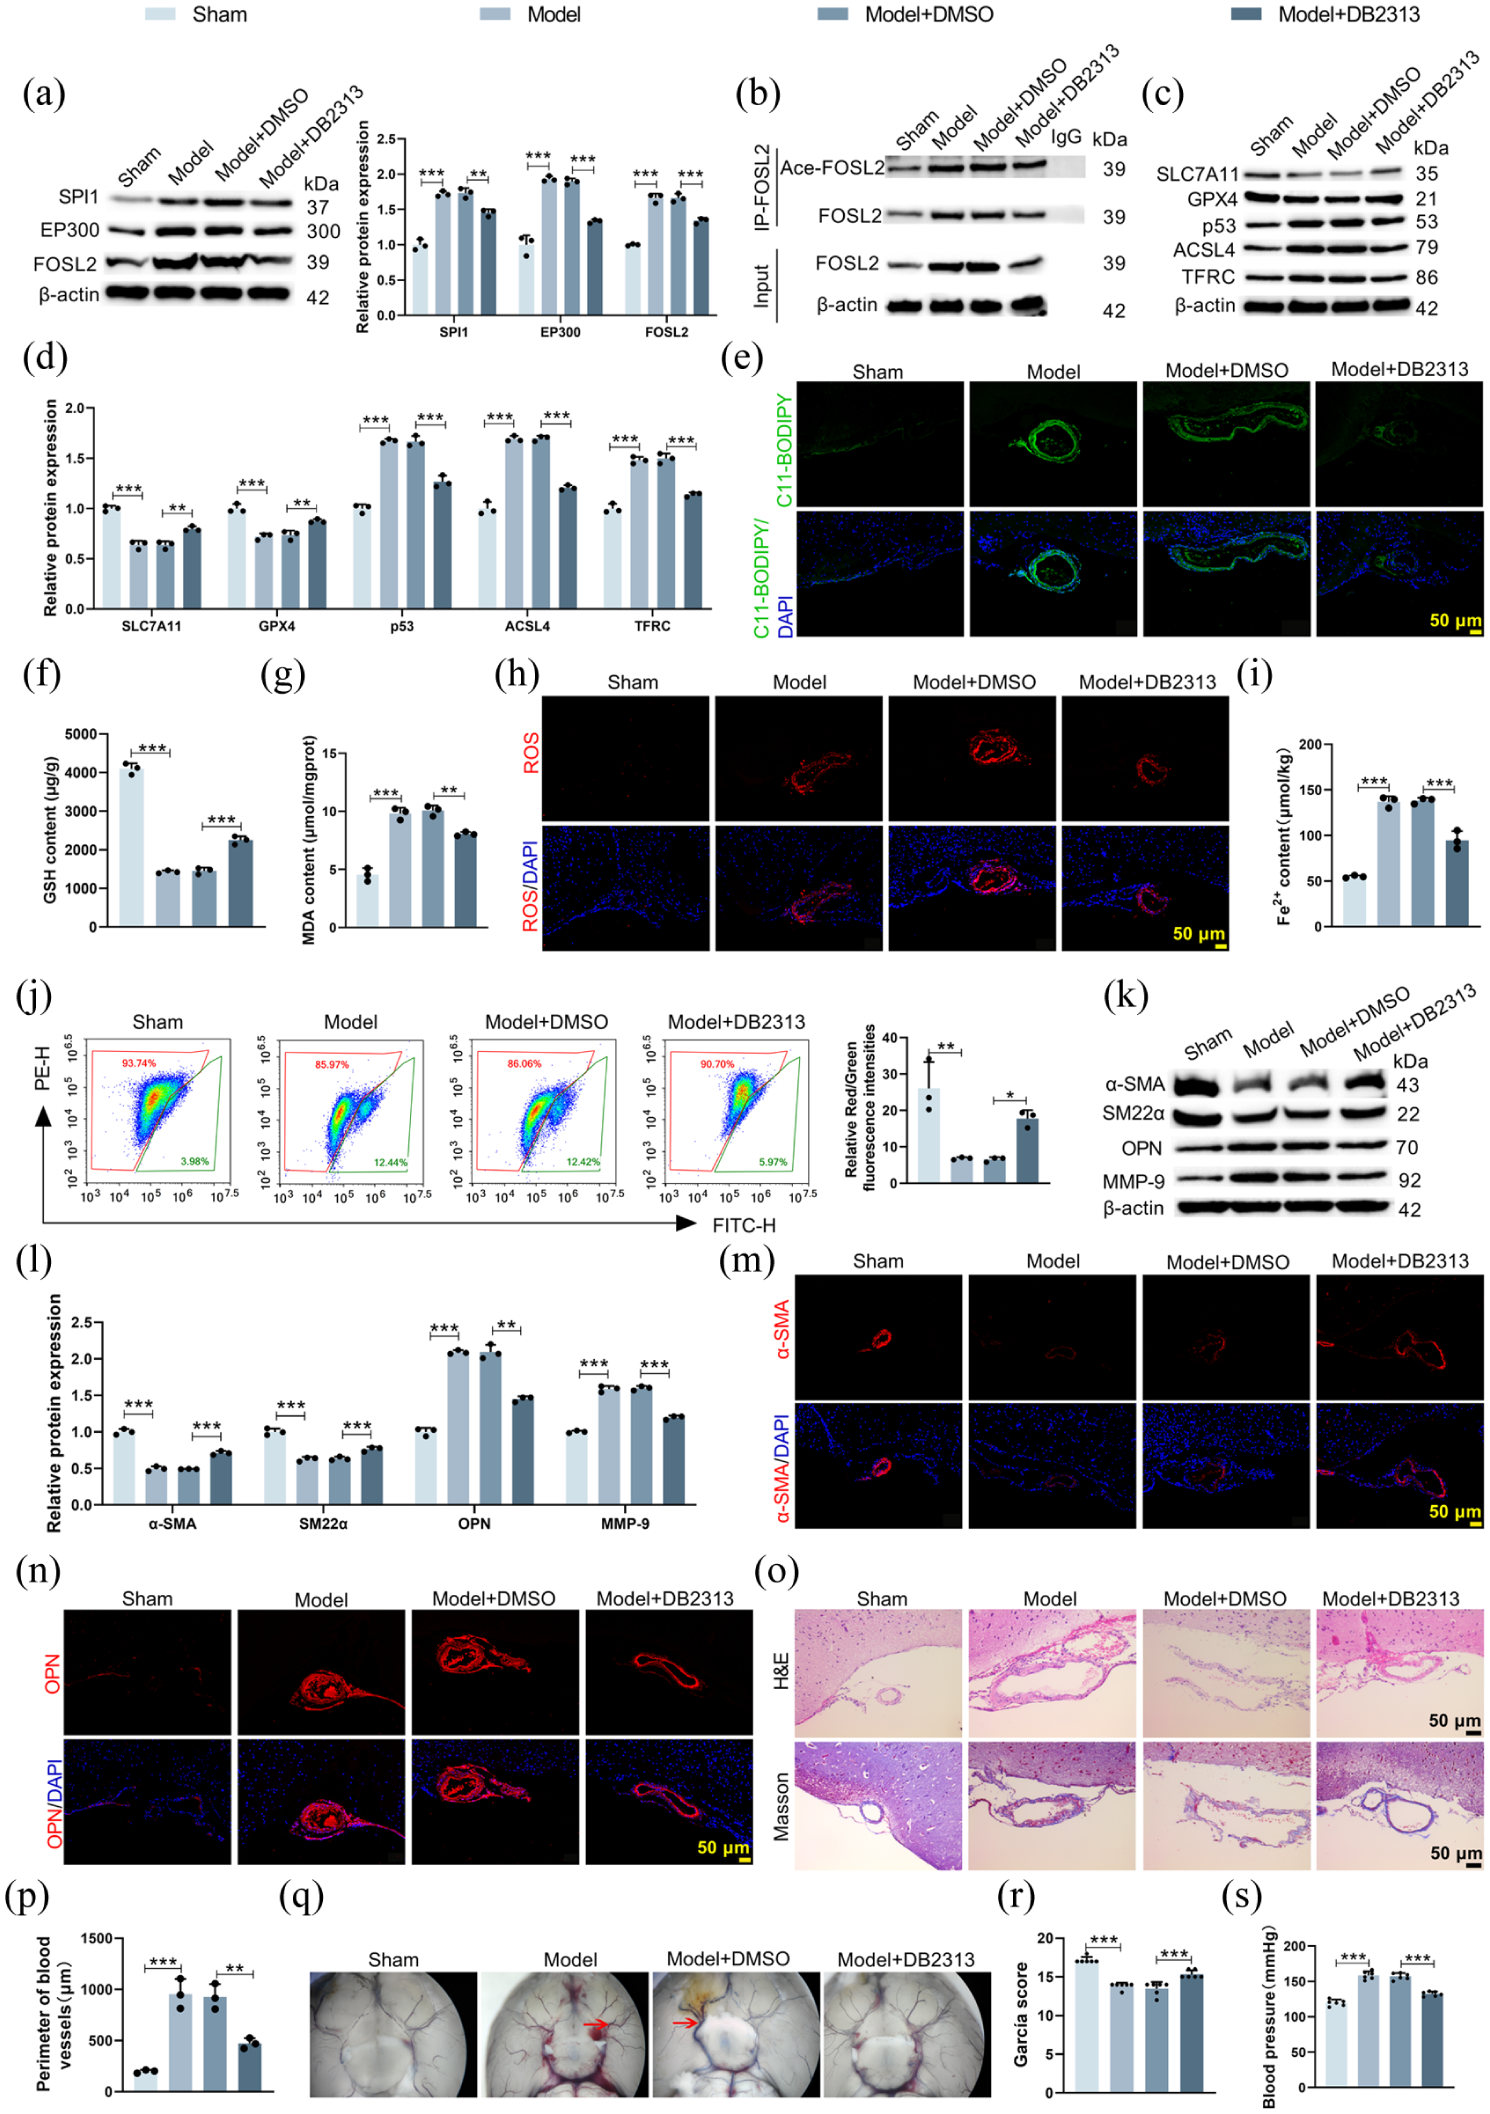
SPI1 inhibitor suppressed IA formation in mice. IA model mice were treated with SPI1 inhibitor DB2313 or DMSO. (a–d) Western blot analysis evaluating the levels of SPI1, EP300, FOSL2, FOSL2 acetylation, and ferroptosis-related proteins in the Willis circle of mice ((a): FSPI1 = 96.44, pSPI1 < 0.0001; FEP300 = 106.9, pEP300 < 0.0001; FFOSL2 = 125.7, pFOSL2 < 0.0001; (c) and (d): Fp53 = 148.3, pp53 < 0.0001; FGPX4 = 39.74, pGPX4 < 0.0001; FSLC7A11 = 79.74, pSLC7A11 < 0.0001; FACSL4 = 231.7, pACSL4 < 0.0001; FTFRC = 118.8, pTFRC < 0.0001). (e–i) Quantitative analysis of lipid peroxidation, GSH (F = 470.5, p < 0.0001), MDA (F = 96.70, p < 0.0001), ROS, and Fe2+ (F = 125.3, p < 0.0001) levels in mouse Willis circle. (j) Flow cytometry analysis was used to analyze ΔΨm level (F = 18.00, p = 0.0006). (k) and (l) Western blot analysis showing VSMC contractile (α-SMA, SM22α) and synthetic (OPN, MMP-9) markers in the circle of Willis (Fα-SMA = 201.5, pα-SMA < 0.0001; FSM22α = 78.65, pSM22α < 0.0001; FOPN = 234.5, pOPN < 0.0001; FMMP-9 = 286.1, pMMP-9 < 0.0001). (m) and (n) Immunofluorescence staining of α-SMA and OPN in mouse Willis circle. (o) H&E and Masson staining were conducted to observe the morphological and structural changes in the Willis circle of mice. (p) The circumference of Willis circle was quantified (F = 40.67, p < 0.0001). (q) Stereomicroscope images demonstrating vascular morphology of mouse skull base. (r) and (s) Modified Garcia scores (F = 51.75, p < 0.0001) and tail blood pressure (F = 104.7, p < 0.0001) in mice were measured.
Recent studies have shown that SPI1 plays a protective role against endothelial senescence via regulating the YAP signaling pathway. 37 To further address the effect of SPI1 inhibition by DB2313 on YAP signaling and cellular senescence, we performed additional experiments in Ang II-treated HCMEC/D3 cells (Supplemental Figure S7). Ang II stimulation markedly increased the protein expression of p-YAP1 and senescence-related markers (p16, p53, and p21), whereas OE-SPI1 or DB2313 treatment did not further change these protein levels (Supplemental Figure S7A and B). SA-β-Gal staining further confirmed no significant differences in cellular senescence rates (Supplemental Figure S7C). Meanwhile, DB2313 treatment partially restored cell proliferation and migration, while SPI1 overexpression reduced these functions (Supplemental Figure S7D and E). These results indicate that in our Ang II-induced endothelial injury model, SPI1 inhibition by DB2313 primarily exerts protective effects through suppressing ferroptosis, rather than modulating YAP phosphorylation or cellular senescence pathways.
Discussion
The primary risk of IA is its rupture, which can lead to intracranial hemorrhage and often severe clinical outcomes. 38 Identifying the initiating events of IA formation is crucial for developing preventive therapies, particularly to prevent IA growth or rupture.3,39 This study revealed, for the first time, a novel role for SPI1 in the pathogenesis of IA. SPI1 mediated FOSL2 acetylation to promote vascular endothelial cell ferroptosis and facilitate the transition of VSMCs to a synthetic phenotype by regulating EP300, ultimately exacerbating IA progression. Our findings not only elucidated a new SPI1/EP300/FOSL2 acetylation axis that influenced communication between vascular endothelial cells and VSMCs in IA, but also identified a potential therapeutic target for intervention.
This study first confirmed the critical role of SPI1 in IA. Significant upregulation of SPI1 was observed in both animal and cellular models (Figure 1(g)–(i), (k)–(m)), consistent with previous bioinformatic analyses suggesting SPI1 as a potential key regulator in IA.22,23 SPI1, a member of the ETS family, is known to play central roles in hematopoiesis and inflammation.40,41 This study extended its function to the novel field of cerebrovascular pathology. We found that SPI1 gain- and loss-of-function exacerbated or alleviated Ang II-induced endothelial cell ferroptosis, respectively (Figure 2(b)–(i)). This aligns with reports indicating SPI1 can regulate ferroptosis in other disease models.24 –26,42 However, unlike reported effects of SPI1 on SLC7A11 and GPX4 expression in trophoblast cells and osteosarcoma cells,24,42 our experimental data in IA vascular endothelial cells demonstrated that SPI1 broadly regulated other key ferroptosis molecules (p53, ACSL4, TFRC) (Figure 2(b)). These findings suggested that the regulation of ferroptosis by SPI1 was cell and disease type-specific, and its impact on specific targets might depend on the cellular context.
The elucidation of the mechanism by which SPI1 regulated FOSL2 acetylation was a key finding of this study. Our data confirmed that SPI1 did not directly regulate FOSL2, but rather facilitated FOSL2 post-translational modification by upregulating the histone acetyltransferase EP300 (Figure 4(g) and (h)). This provided a new perspective on how transcription factors could “indirectly” regulate downstream effector proteins. EP300, a crucial coactivator, is widely recognized for its role in endothelial cell homeostasis.43 –45 While prior research has showed that EP300 influences VSMC ferroptosis via the HIF-1α/HMOX1 axis, 46 this study was the first to link EP300 function to endothelial cell ferroptosis in the context of IA pathology. More importantly, using FOSL2 acetylation site mutants, it was directly demonstrated that FOSL2 acetylation was required for its ability to promote endothelial cell ferroptosis (Figure 5(a)–(j)). This finding is consistent with observations in other cancers where FOSL2 acetylation enhances its transcriptional activity, 34 but the present study introduced this mechanism for the first time in the field of vascular biology.
Beyond establishing the pro-ferroptotic function of FOSL2 acetylation, our study further identified the transcriptional activation of p53 as a downstream signal of FOSL2 acetylation. p53, a classic tumor suppressor protein, has a well-established role in regulating endothelial cell ferroptosis.47,48 Our luciferase reporter assays demonstrated that the acetylated form of FOSL2 significantly enhanced p53 promoter activity (Figure 5(a)). This finding effectively connected the upstream acetylation signal to the downstream classical ferroptosis execution pathway, forming a complete signaling axis from SPI1 to EP300, to FOSL2 acetylation, and finally to p53-induced ferroptosis.
Another significant finding was the demonstration that endothelial cell ferroptosis drove VSMC phenotypic switching (Figures 2(k), (l) and 3(j)–(m)). Endothelial dysfunction can induce VSMCs to switch to a synthetic phenotype, leading to vascular remodeling.49,50 Using a co-culture system, this study provided the first evidence that signals derived from ferroptotic endothelial cells were sufficient to induce a shift in VSMCs from a contractile to a synthetic phenotype, contributing to IA progression. Furthermore, inhibiting ferroptosis with Fer-1 effectively mitigated this aberrant phenotypic switching (Figure 3(j)–(m)). These results innovatively demonstrated the critical role of endothelial cell ferroptosis in intercellular communication, offering new insights into how different cell types collaborate to promote IA development. Although the precise mechanisms by which endothelial cell ferroptosis drives VSMC phenotypic switching remain to be elucidated, several possibilities have been proposed. Given that ferroptosis is characterized by excessive ROS production and lipid peroxidation,51,52 products such as 4-HNE and MDA may act as paracrine signals to induce oxidative stress-mediated phenotypic transition in VSMCs. Additionally, endothelial-derived exosomes carrying specific miRNAs or proteins have been shown to mediate endothelial cell-VSMC communication and promote VSMC phenotypic switching. 53 Future studies are warranted to further explore these possibilities.
Data from our in vivo studies provided preliminary evidence supporting the therapeutic potential of targeting SPI1 for IA treatment. Administration of the SPI1 inhibitor DB2313 in this study significantly alleviated the severity of IA in mice (Figure 7(o)–(s)), concomitant with the downregulation of the SPI1-EP300-FOSL2 axis (Figure 7(a) and (b)), inhibition of ferroptosis (Figure 7(c)–(j)), and restoration of the VSMC contractile phenotype (Figure 7(k)–(n)). Currently, pharmacological treatment options for IA are very limited.54,55 This research suggested that SPI1 could be a promising novel target. Although the specificity of DB2313 requires further evaluation, its therapeutic effect clearly indicates the potential value of inhibiting the SPI1 pathway in IA management. Certainly, this study has limitations. First, the precise molecular details of how SPI1 regulates EP300 expression, as well as the specific mechanisms by which ferroptotic endothelial cells regulate VSMC phenotype, warrant further exploration. Second, whether FOSL2 acetylation regulates other target genes involved in IA progression besides p53 deserves further investigation. Third, translating SPI1 inhibitors to the clinic will require more comprehensive pharmacodynamic and safety assessments. Finally, the connection between endothelial ferroptosis-driven synthetic SMC phenotypic switching and increased IA rupture risk needs to be further established, and TEER assay in a co-culture system is warranted to assess endothelial barrier dysfunction in this process in future studies.
In conclusion, this study systematically elucidated a novel mechanism by which SPI1 promoted vascular endothelial cell ferroptosis and VSMC phenotypic switching via the EP300-FOSL2 acetylation-p53 axis, thereby aggravating IA. These findings deepen the understanding of the molecular pathology of IA and lay a theoretical foundation for developing intervention strategies targeting SPI1.
Supplemental Material
sj-docx-1-jcb-10.1177_0271678X261463947 – Supplemental material for SPI1 promotes endothelial cell ferroptosis and intracranial aneurysm progression via EP300-mediated FOSL2 acetylation
Supplemental material, sj-docx-1-jcb-10.1177_0271678X261463947 for SPI1 promotes endothelial cell ferroptosis and intracranial aneurysm progression via EP300-mediated FOSL2 acetylation by Lingfeng Lai, Zhifan Zheng, Hengyang Ouyan and Yeyu Zhao in Journal of Cerebral Blood Flow & Metabolism
Supplemental Material
sj-pdf-1-jcb-10.1177_0271678X261463947 – Supplemental material for SPI1 promotes endothelial cell ferroptosis and intracranial aneurysm progression via EP300-mediated FOSL2 acetylation
Supplemental material, sj-pdf-1-jcb-10.1177_0271678X261463947 for SPI1 promotes endothelial cell ferroptosis and intracranial aneurysm progression via EP300-mediated FOSL2 acetylation by Lingfeng Lai, Zhifan Zheng, Hengyang Ouyan and Yeyu Zhao in Journal of Cerebral Blood Flow & Metabolism
Footnotes
Abbreviations
Ang II: angiotensin II
CCK-8: Cell Counting Kit-8
Co-IP: co-immunoprecipitation
EP300: E1A binding protein P300
ETS: E26 transformation-specific
Fe2+: ferrous iron
Fer-1: ferrostatin-1
FOSL2: FOS-like antigen 2
GPX4: glutathione peroxidase 4
GSH: glutathione
H&E: hematoxylin and eosin
HCMEC/D3: human cerebral microvascular endothelial cells
IA: intracranial aneurysm
ICA: internal carotid artery
MDA: malondialdehyde
MMP-9: matrix metalloproteinase-9
ΔΨm: mitochondrial membrane potential
OE: overexpression
qRT-PCR: quantitative real-time PCR
ROS: reactive oxygen species
SAH: subarachnoid hemorrhage
SPI1: spleen focus-forming virus proviral integration 1
TSA: trichostatin A
VSMC: vascular smooth muscle cell
Ethical considerations
The reporting of animal experiments in this manuscript complies with the ARRIVE guidelines 2.0. All animal experimental procedures were reviewed and approved by the Ethics Committee of The first affiliated hospital, Jiangxi Medical College, Nanchang University (CDYFY-IACUC-202504GR033).
Author contributions
Lingfeng Lai: conceptualization, formal analysis, project administration, methodology, writing—original draft preparation, writing—review and editing; Zhifan Zheng: formal analysis, project administration, methodology, software, writing—review and editing; Hengyang Ouyang: data curation, formal analysis, methodology, writing—review and editing; Yeyu Zhao: resources, supervision, funding acquisition, writing—review and editing.
Funding
The authors disclosed receipt of the following financial support for the research, authorship, and/or publication of this article: This study was supported by National Natural Science Foundation of China (82560245), Natural Science Foundation of Jiangxi Province of China (20192BAB215024), Natural Science Foundation of Jiangxi Province of China (20212BAB206029), and Science and Technology Project of Jiangxi Provincial Health Commission (202610243).
Declaration of conflicting interests
The authors declared no potential conflicts of interest with respect to the research, authorship, and/or publication of this article.

Data availability statement
The datasets used and/or analyzed during the current study available from the corresponding author on reasonable request.
Supplemental material
Supplemental material for this article is available online.
References
Supplementary Material
Please find the following supplemental material available below.
For Open Access articles published under a Creative Commons License, all supplemental material carries the same license as the article it is associated with.
For non-Open Access articles published, all supplemental material carries a non-exclusive license, and permission requests for re-use of supplemental material or any part of supplemental material shall be sent directly to the copyright owner as specified in the copyright notice associated with the article.
