






Abstract
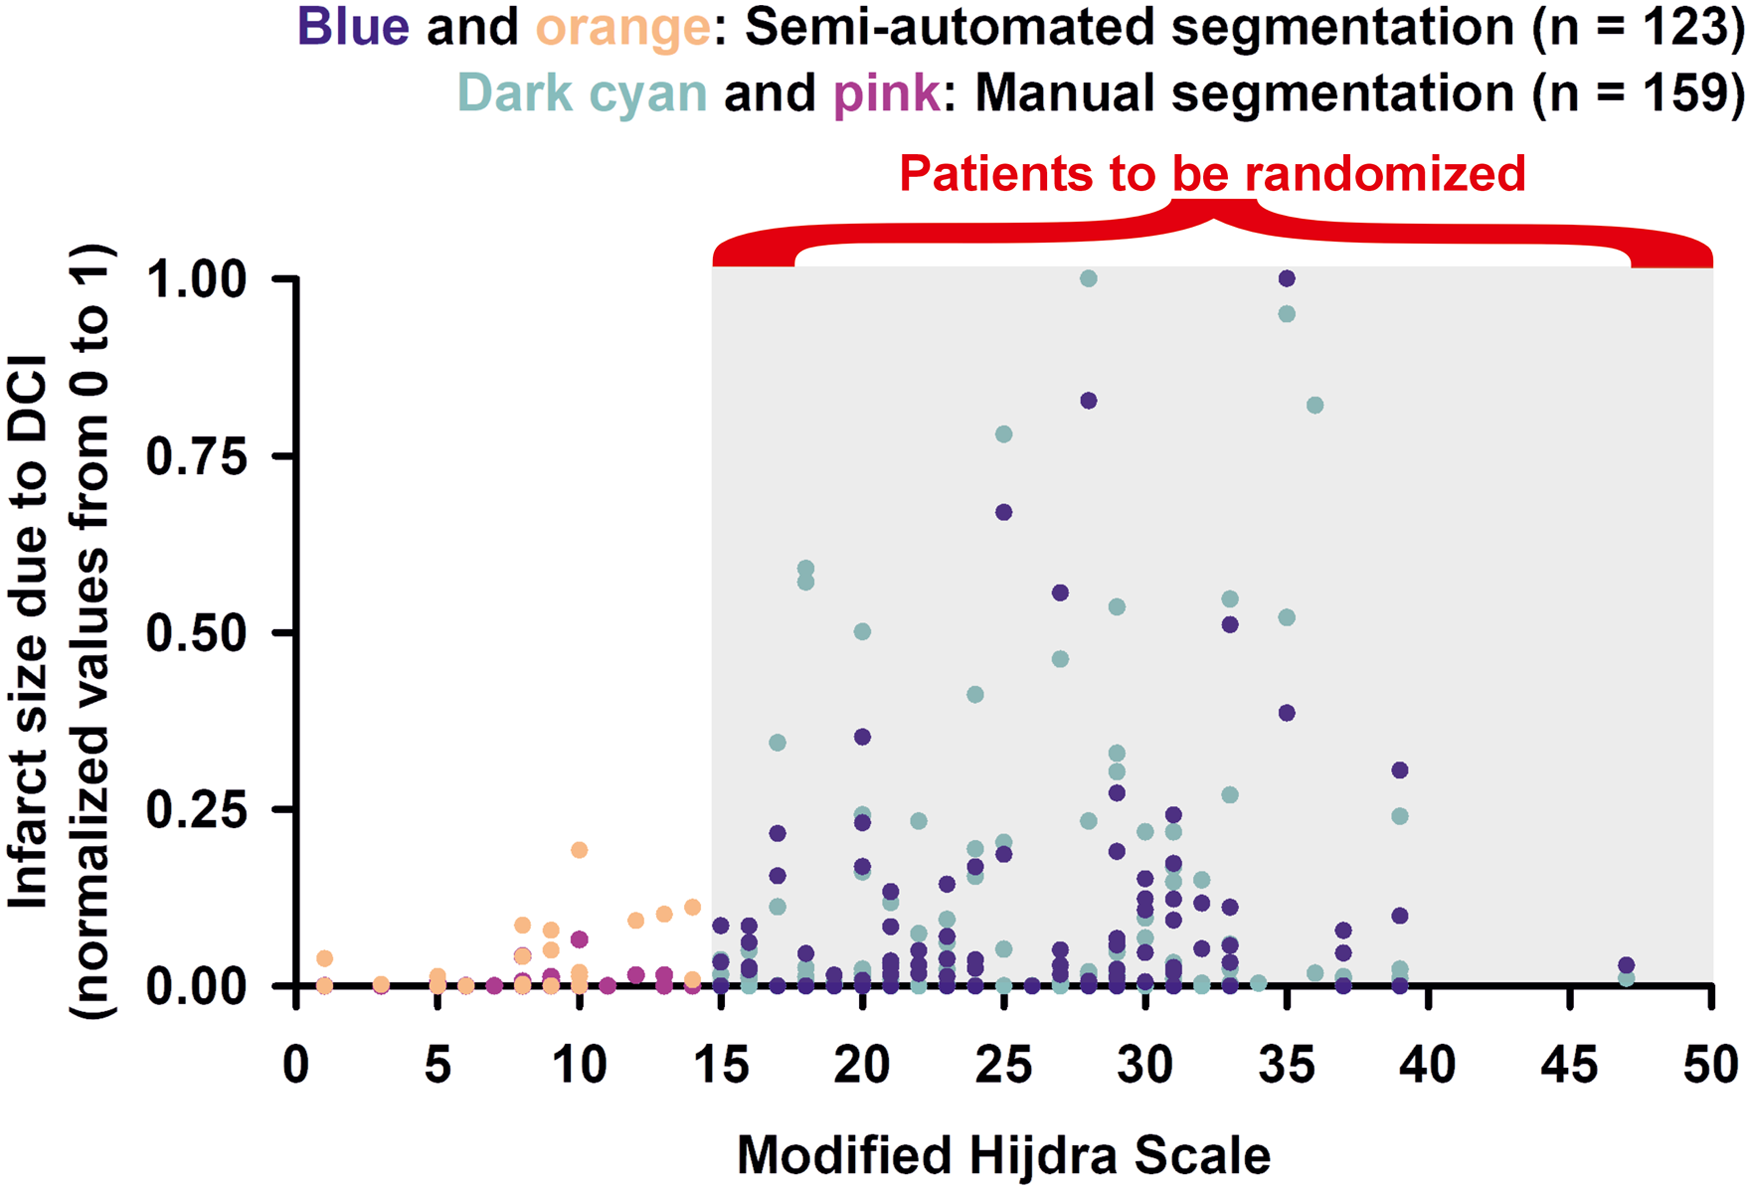
Delayed cerebral ischemia (DCI) occurs several days after subarachnoid hemorrhage (SAH) and could therefore be mitigated by treatment intervention. As testament to the great challenge of designing effective trials, however, the prevalence and severity of DCI have remained unchanged for decades. A critical need in the development of novel prophylactic treatments is optimizing initial prediction for DCI, since improved risk stratification based on prognosis could increase the statistical power of randomized trials, thereby increasing the probability of success and reducing costs. The primary objective of this study, using secondary analysis of data from the DISCHARGE-1 trial, was to evaluate the power of initial variables (medical history, clinical examination, and pre-interventional CT) for predicting the volume of delayed infarcts in SAH survivors. In multivariate analysis of 164 early survivors with pre-interventional CT within 72 h of the initial hemorrhage, the modified Hijdra scale (mHS; β = −0.016, p < 0.001) was the only independent predictor of infarct volume due to DCI, outperforming common clinical scores und manually segmented hemorrhage volumes. Furthermore, early brain injury (EBI) volume identified high-risk patients for early death early on. Thus, we propose a combined approach using mHS and EBI volume for early risk stratification in randomized trials targeting DCI.
Keywords
Introduction
Subarachnoid hemorrhage (SAH) is a life-threatening disease with an incidence of 6/100,000 person-years. 1 Case fatality varies between 27% and 44% for individual regions.2,3 The global cerebral ischemia caused by the increase in intracranial pressure during the initial aneurysm rupture is thought to be responsible for diffuse damage to the brain. 4 Early focal brain injury (EBI) within the first 48 h results from intracerebral hemorrhage (ICH) and/or early cerebral ischemia5,6 (ECI) and accounted for 56% of total focal brain damage in the recent DISCHARGE-1 trial. 7 The remaining 44% was due to delayed cerebral ischemia8 –10 (DCI) that occurs between 48 h and approximately 2 weeks after the initial hemorrhage. Overall, about three quarters of the total focal brain damage after aneurysmal SAH (aSAH) is ischemic and one quarter results from ICH. 11 Of ischemic damage, 90% involves the cerebral cortex and adjacent white matter, while 10% occurs in deep structures.7,12,13 Early and delayed cortical infarcts correlated weakly with each other, while early and delayed deep infarcts showed no correlation. 14 Long-term consequences of aSAH are motor, cognitive and emotional disabilities, and patients with a poor outcome can also experience late neurodegeneration and brain atrophy, often in conjunction with late-onset epilepsy. 15
Worldwide, virtually all patients with suspected SAH undergo a medical history, physical examination and CT scan, and there are many candidate measures based on initial clinical exams for prediction of potentially modifiable outcomes, such as delayed ischemic infarcts, short- and long-term disability, and mortality. These candidates include the World Federation of Neurosurgical Societies (WFNS) scale, 16 assessment of whether global cerebral edema (GCE) is present in the initial CT,17 –19 scales for estimating blood distribution such as modified Fisher scale (mFS), 20 Hijdra scale, 21 and modified Hijdra scale (mHS), 22 manual segmentation of blood volumes, 23 in addition to scales that integrate the initial clinical condition and initial CT findings, such as the Rosen–Macdonald scale (RMS) 24 and VASOGRADE. 25 Determining the best possible initial prediction among these candidate measures is a critical gap in the development of new treatment strategies, since improved risk stratification based on optimized prognostic estimation might improve the statistical power in randomized trials, thereby reducing effort and costs. 26
DISCHARGE-1 is the largest clinical trial to date investigating the predictive value of spreading depolarizations (SD) for secondary complications and clinical outcome in patients with cerebral injury. 7 Its primary objective was to determine whether SD-induced depression of brain activity predicts DCI after aSAH and could therefore be suitable for stratification of rescue therapies in real time, especially in comatose patients. SD and depression periods were recorded using a subdural electrode strip in accordance with the published recommendations of the Co-Operative Studies on Brain Injury Depolarizations (COSBID) group. 27 Outcome parameters included EBI (ICH + ECI) as well as delayed brain infarcts (DCI) ipsilateral to the electrode strip, as measured by manual segmentation of serial neuroimages. Using secondary analysis of these data, the primary objective of the present study was to evaluate the power of the initial variables based on medical history, clinical examination, and pre-interventional CT for predicting the volume of delayed infarcts in the whole brain in early survivors after aSAH.
Material and methods
Ethics
Based on predefined criteria, we selected patients from the prospective database of the DISCHARGE-1 trial performed between September 2009 and April 2018. 7 DISCHARGE-1 was preregistered (http://www.isrctn.com/ISRCTN05667702). The protocol was approved by the ethics committees of Charité–Universitätsmedizin Berlin, University of Bonn, Goethe-University Frankfurt, University of Cologne, and University Hospital Heidelberg. Either informed consent or surrogate informed consent was obtained. Research was conducted in accordance with the Declaration of Helsinki. Results are reported following the STROBE guidelines (https://www.strobe-statement.org). Inclusion/exclusion criteria of the present study are given in Supplementary Material and Methods.
Populations, missing values, and estimands
Supplementary Figure 1(a) shows the patient flow and entry into analysis. Of the 205 aSAH patients in the database, six did not meet the inclusion/exclusion criteria, leaving 199 patients. Twenty-four patients were excluded due to lack of a pre-interventional CT performed within 72 h after the initial hemorrhage. Accordingly, the first target population of our analysis consisted of the remaining 175 patients. Eleven of 175 patients died prematurely in hospital, on median day 4 (interquartile range (IQR): 4–7) after the initial hemorrhage, before neuroimaging could be performed to assess tissue loss due to DCI. Since, by definition, we had no chance of detecting tissue loss due to DCI, these patients were included in examining the binary endpoint “early death” (yes/no) and the endpoint “infarct volume due to ECI,” but were excluded from further analysis. Predictor variables included WFNS and RMS as well as variables exclusively based on the initial CT scan such as mFS, Hijdra scale, mHS and the GCE scale. The values for all these potential predictors were available in full. In one of the 11 patients who died early, the infarct volume due to ECI could not be determined because of diffuse hypoxic-ischemic encephalopathy. Since the assumption of “missing at random” (MAR) is not fulfilled here, we did not perform any imputation in this case. Thus, analyses for “early death” (yes/no) and “infarct volume due to ECI” were conducted as complete-case analyses.
The analysis of the remaining 164 patients (= early survivors) constituted the primary analysis. In the primary analysis, predictor variables included not only WFNS, RMS, mFS, Hijdra scale, mHS, and GCE scale, but also the manually segmented volumes of subarachnoid blood (SAHblood-volume), intraventricular hemorrhage (IVHblood-volume), and ICH (ICHblood-volume), the combined volumes of subarachnoid blood and IVH (SAH–IVHblood-volume), subarachnoid blood and ICH (SAH–ICHblood-volume), IVH and ICH (IVH–ICHblood-volume), and the total blood volume of all three compartments. Manually segmented blood volumes were missing in 24 of 164 patients (14.6%). For early survivors, in addition to the primary analysis, we also determined the predictive power of the initial variables for the total infarct volume due to ECI and DCI, the early patient outcome using the modified Rankin scale (mRS) on day 14, the long-term outcome using the extended Glasgow outcome scale (eGOS, 1–8) 7 (IQR: 5–11) months after the initial hemorrhage, and the delayed mortality at 7 months. The amount of missing data for these outcome variables (estimands) was 8.5% for delayed death, 3.0% each for the volume of delayed infarcts and the total infarct volume due to ECI and DCI, 6.7% for day-14 mRS, and 8.5% for eGOS at 7 months. For the early-survivor cohort, missingness was assumed compatible with the MAR assumption. Multiple imputation was conducted for all predictors and the five outcomes, generating 500 imputed datasets to ensure stable variance estimation. 28 Continuous variables were imputed using predictive mean matching and ordinal variables via proportional odds models, and binary variables using logistic regression. The imputed values were generated from the conditional distributions of the observed data rather than using fixed or least-favorable values. Parameter estimates and standard errors were pooled using Rubin’s rules. Post-imputation, variable distributions were compared with pre-imputation values (Supplementary Table 1). Differences were minimal (<0.05 in standard deviation for most variables), confirming that imputation preserved the original data structure.
Patients
The study design of DISCHARGE-1 has been previously described in detail. 7 Patients were treated according to standard care and applicable guidelines for the treatment of aSAH during neurocritical care, including oral nimodipine prophylaxis.7,29,30 Supplementary Figure 1(b) shows the study flow. Note that for each patient, the first 24 h after the initial bleeding were always referred to as “day 0,” the second 24 h as “day 1,” and so on. In short, the pre-interventional CT scan, which was performed at a median of 2.1 (IQR: 1.3–5.4) h after the initial hemorrhage, was used to (1) establish the diagnosis of aSAH, (2) determine the CT-based initial scores, and (3) perform volumetric hemorrhage quantification. Placement of the subdural electrode strip for ECoG was performed either directly after surgical treatment of the aneurysm via craniotomy (n = 157) or, in coiled patients, after burr hole trepanation simultaneously with the placement of a ventricular drain or oxygen sensor (n = 18). The first post-interventional CT was used to locate the subdural electrodes. We adopted the volumes of parenchymal lesions in both hemispheres and the infratentorial region from DISCHARGE-1, which were derived from manual segmentation and classified according to the three etiologies ICH, ECI, and DCI. 7 Both pre-interventional CT and the first post-interventional neuroimage were used to quantify the volume of focal brain damage due to ICH. The volume of early ischemic infarcts was assessed using either a post-interventional MRI (n = 148) or CT (n = 27) performed no later than day 5. The median day of this neuroimage, referred to as imageearly, was day 2 (IQR: 1–3). The volume of delayed ischemic infarcts was evaluated using a follow-up imagepost-monitoring (MRI: n = 135, CT: n = 24) on day 14 (IQR: 13–15) in comparison to imageearly. In DISCHARGE-1, MRI scans were also semi-automatically segmented into apparently normal brain tissue in the combined gray matter and white matter, lateral ventricles and subarachnoid space, or abnormal brain tissue (ABT) comprising apparently abnormal signal, reflecting cytotoxic or vasogenic edema, gliosis or hemorrhage (compare Dreier et al. 15 for a detailed description of semi-automated segmentation). We also adopted these values for MRIearly and MRIpost-monitoring from DISCHARGE-1. 7 Manual and semi-automated segmentation of the neuroimages was performed by different evaluators (manual: VH, semi-automated: SL). The initial CT-based scores and volumetric hemorrhage quantification are explained in the Supplementary Material and Methods and Supplementary Figures 2 and 3.
Statistical analysis, data preparation, and transformation
Continuous variables were assessed for normality using histograms, Q–Q plots, and skewness/kurtosis measures. Variables with significant skewness were transformed to approximate normal distributions. Specifically, inverse transformations were applied to strongly right-skewed variables, including IVHblood-volume, ICHblood-volume, IVH–ICHblood-volume, and infarct volume due to DCI. Log and natural log transformation was applied to GCE, infarct volume due to ECI, and total infarct volume due to ECI and DCI, respectively, and square root transformation to SAHblood-volume, SAH–IVHblood-volume, SAH–ICHblood-volume, and total blood volumeSAH–IVH–ICH. All regression coefficients for transformed variables reflect associations on the transformed scale. Interpretation in the text was converted back into their original directional meaning. Descriptive statistics (mean ± standard deviation) were reported before and after imputation (Supplementary Table 1). Univariate regression analysis and multivariate regression modeling are described in the Supplementary Material and Methods. All tests were two-tailed, with a significance level of p < 0.05. Analyses were performed using IBM SPSS Statistics (v29.0.2.0).
Results
In our initial analysis of 175 patients, we examined the predictive power of six variables collected upon admission with regard to infarct volume due to ECI and early death. The results of these univariate regression analyses are given in Supplementary Results and Supplementary Tables 2 and 3. As a result of the 11 early deaths, the number of study subjects available for the primary analysis decreased from 175 to 164. The 164 patients had a median age of 56 (IQR: 47–63) years. The female:male ratio was 2.3:1.0 (114 women and 50 men). When examining patient outcomes after 7 (IQR: 5–11) months, 34 of 164 patients (20.7%) had died, with a median age of 58 (IQR: 48–69) years at the time of initial hemorrhage. Twenty-four of the 114 women (21.1%) and 10 of the 50 men (20.0%) died. Supplementary Table 1 shows a descriptive analysis of the 13 untransformed and transformed predictors and outcomes before and after multiple imputation. As can be seen, average volumes changed slightly but remained generally constant before and after imputation.
Univariate regression analysis between predictors and infarct volume due to DCI
In the primary analysis, we determined the predictive power of 13 variables for infarct volume due to DCI in the 164 early survivors (Supplementary Table 4). The regression analysis, using the inversely transformed volume of infarcts due to DCI as outcome, revealed an association with higher Hijdra scale (β = −0.016, p < 0.001), mHS (β = −0.016, p < 0.001), SAHblood-volume (β = −0.053, p = 0.004), SAH + IVHblood-volume (β = −0.047, p = 0.005), and total blood volumeSAH + IVH + ICH (β = −0.029, p = 0.039). Note that the negative signs result from the inverse transformation of the infarct volume due to DCI. The interpretation in the text was then reverted to its original direction, such that higher rather than lower values of the predictors were associated with a higher infarct volume due to DCI. There was a significant positive relationship between infarct volume due to DCI and both IVHblood-volume (β = 0.223, p = 0.036) and IVH + ICHblood-volume (β = 0.247, p = 0.020). Since both the predictors IVHblood-volume and IVH + ICHblood-volume as well as the outcome infarct volume due to DCI were inversely transformed from their original values, these correlations also suggested that a larger intraventricular blood volume was associated with a larger infarct volume due to DCI. The mHS and Hijdra scale accounted for 9.9% and 8.7% of the variance, respectively (R2 = 0.0987 and R2 = 0.0865 in Supplementary Table 4). While SAHblood-volume and SAH–IVHblood-volume explained 4.8% and 4.6% of the variance, respectively, IVH + ICHblood-volume, IVHblood-volume, and total blood volumeSAH + IVH + ICH accounted for 3.2%, 2.6%, and 2.6% of the variance, respectively. These results were derived from simple linear regression, using the t-test for each coefficient.
Univariate analysis between predictors and total infarct volume due to ECI and DCI
Higher RMS (β = 0.183, p = 0.006), WFNS (β = 0.241, p = 0.007), and mFS (β = 0.451, p = 0.032) were positively correlated with a larger total infarct volume due to ECI and DCI (Supplementary Table 5). Various measures of bleeding severity were also strongly associated with total infarct volume due to ECI and DCI, including Hijdra scale and mHS (β = 0.070 and β = 0.068, respectively, both p < 0.001), SAHblood-volume (β = 0.215, p = 0.004), SAH–IVHblood-volume (β = 0.259, p < 0.001), and total blood volumeSAH + IVH + ICH (β = 0.157, p = 0.004). Since IVHblood-volume and IVH–ICHblood-volume were inversely transformed from their original form, their negative associations (β = −1.072, p = 0.016 and β = −1.078, p = 0.011) with total infarct volume due to ECI and DCI also suggested that higher rather than lower blood volumes were linked with a higher infarct volume. Among the significant predictors, mHS (12.4%) and Hijdra scale (11.7%) explained the largest proportion of variance, followed by SAH–IVHblood-volume (8.8%), SAHblood-volume (5.0%), total blood volumeSAH + IVH + ICH (4.9%), RMS (4.5%), WFNS (4.4%), IVH–ICHblood-volume (3.8%), IVHblood-volume (3.5%), and mFS (2.8%). Overall, while the predictors were significantly associated with total infarct volume, each explained only a modest proportion of the variance individually. The associations were evaluated using simple linear regression with t-tests.
Univariate regression analysis between predictors and day-14 mRS
Day-14 mRS was the only outcome variable associated with all 13 predictors in the univariate regression analysis (Supplementary Table 6). The total blood volumeSAH + IVH + ICH explained the largest proportion of variance among all predictors (16.1%; β = 0.255, p < 0.001). Significance was assessed using the Wald χ2 test for each variable using ordinal regression analysis.
Univariate analysis between the predictors and the eGOS at 7 months
The results are given in detail in Supplementary Table 7. Significant predictors of eGOS at 7 months explained varying proportions of outcome variance: total blood volumeSAH + IVH + ICH (17.3%), RMS (14.1%), SAH–IVHblood-volume (12.1%), SAH–ICHblood-volume (11.5%), IVH–ICHblood-volume (11.0%), WFNS (8.5%), mHS (7.6%), Hijdra scale (7.0%), IVHblood-volume (6.7%), ICHblood-volume (5.3%), and SAHblood-volume (4.6%). Collectively, these results highlight that both clinical severity and total hemorrhage burden are initial determinants of long-term functional outcome. The results were obtained using ordinal regression with the Wald χ2 test.
Univariate logistic regression analysis between the predictors and delayed death
The results are given in detail in Supplementary Table 8. Several predictors were significantly associated with delayed death. RMS (β = 0.315, p = 0.003; Exp(β) (odds ratio (OR)) = 1.37, 95% confidence interval (95% CI): 1.11–1.68, Nagelkerke-R2 = 5.3%) and SAH–IVHblood-volume (β = 0.290, p = 0.007; OR = 1.33, 95% CI: 1.08–1.65, Nagelkerke-R2 = 4.2%) were the strongest predictors of delayed death. However, the predictive power of individual variables was modest, with none explaining more than 6% of the variance. The findings were obtained using simple logistic regression analyses, with significance assessed by the Wald χ2 test.
Multivariate analysis
The results of the multivariate analysis are shown in Table 1. In multivariate analysis, infarct volume due to ECI was associated with WFNS (β = 0.210, p = 0.009) and mHS (β = 0.030, p = 0.024). This model explained 6.8% of the variance (adjusted R2 = 0.068), suggesting that most of the variability in infarct volume due to ECI was attributable to other, unmeasured factors. Only mHS (β = −0.016, p < 0.001) remained a significant predictor of infarct volume due to DCI. The model explained 9.4% of the variance. Both mHS (β = 0.063, p < 0.001) and WFNS (β = 0.172, p = 0.043) were significant predictors of total infarct volume due to ECI and DCI. Together, they explained 11.6% of the variance. WFNS (β = 0.302, p < 0.001) and ICHblood-volume (β = −0.772, p = 0.014) were significant predictors of day-14 mRS, that is, the post-monitoring functional status. The model explained 14.5% of the variance. RMS (β = −0.339, p < 0.001), ICHblood-volume (β = 1.535, p = 0.001), and SAHblood-volume (β = −0.282, p = 0.005) predicted the eGOS at 7 months. The model accounted for 15.1% of the variance. Higher RMS had borderline significance for early death (β = 0.314, p = 0.050), while delayed death was significantly predicted by RMS (β = 0.315, p = 0.003). The model of early death explained 6.2% and the model of delayed death explained 5.4% of the respective variance. Linear regression was used for continuous and ordinal outcomes, while logistic regression was applied for binary outcomes (early death and delayed death). Effect size and statistical power are explained in the Supplementary Results and Supplementary Table 9.
The final multivariate model relationship between the predictors and outcomes.
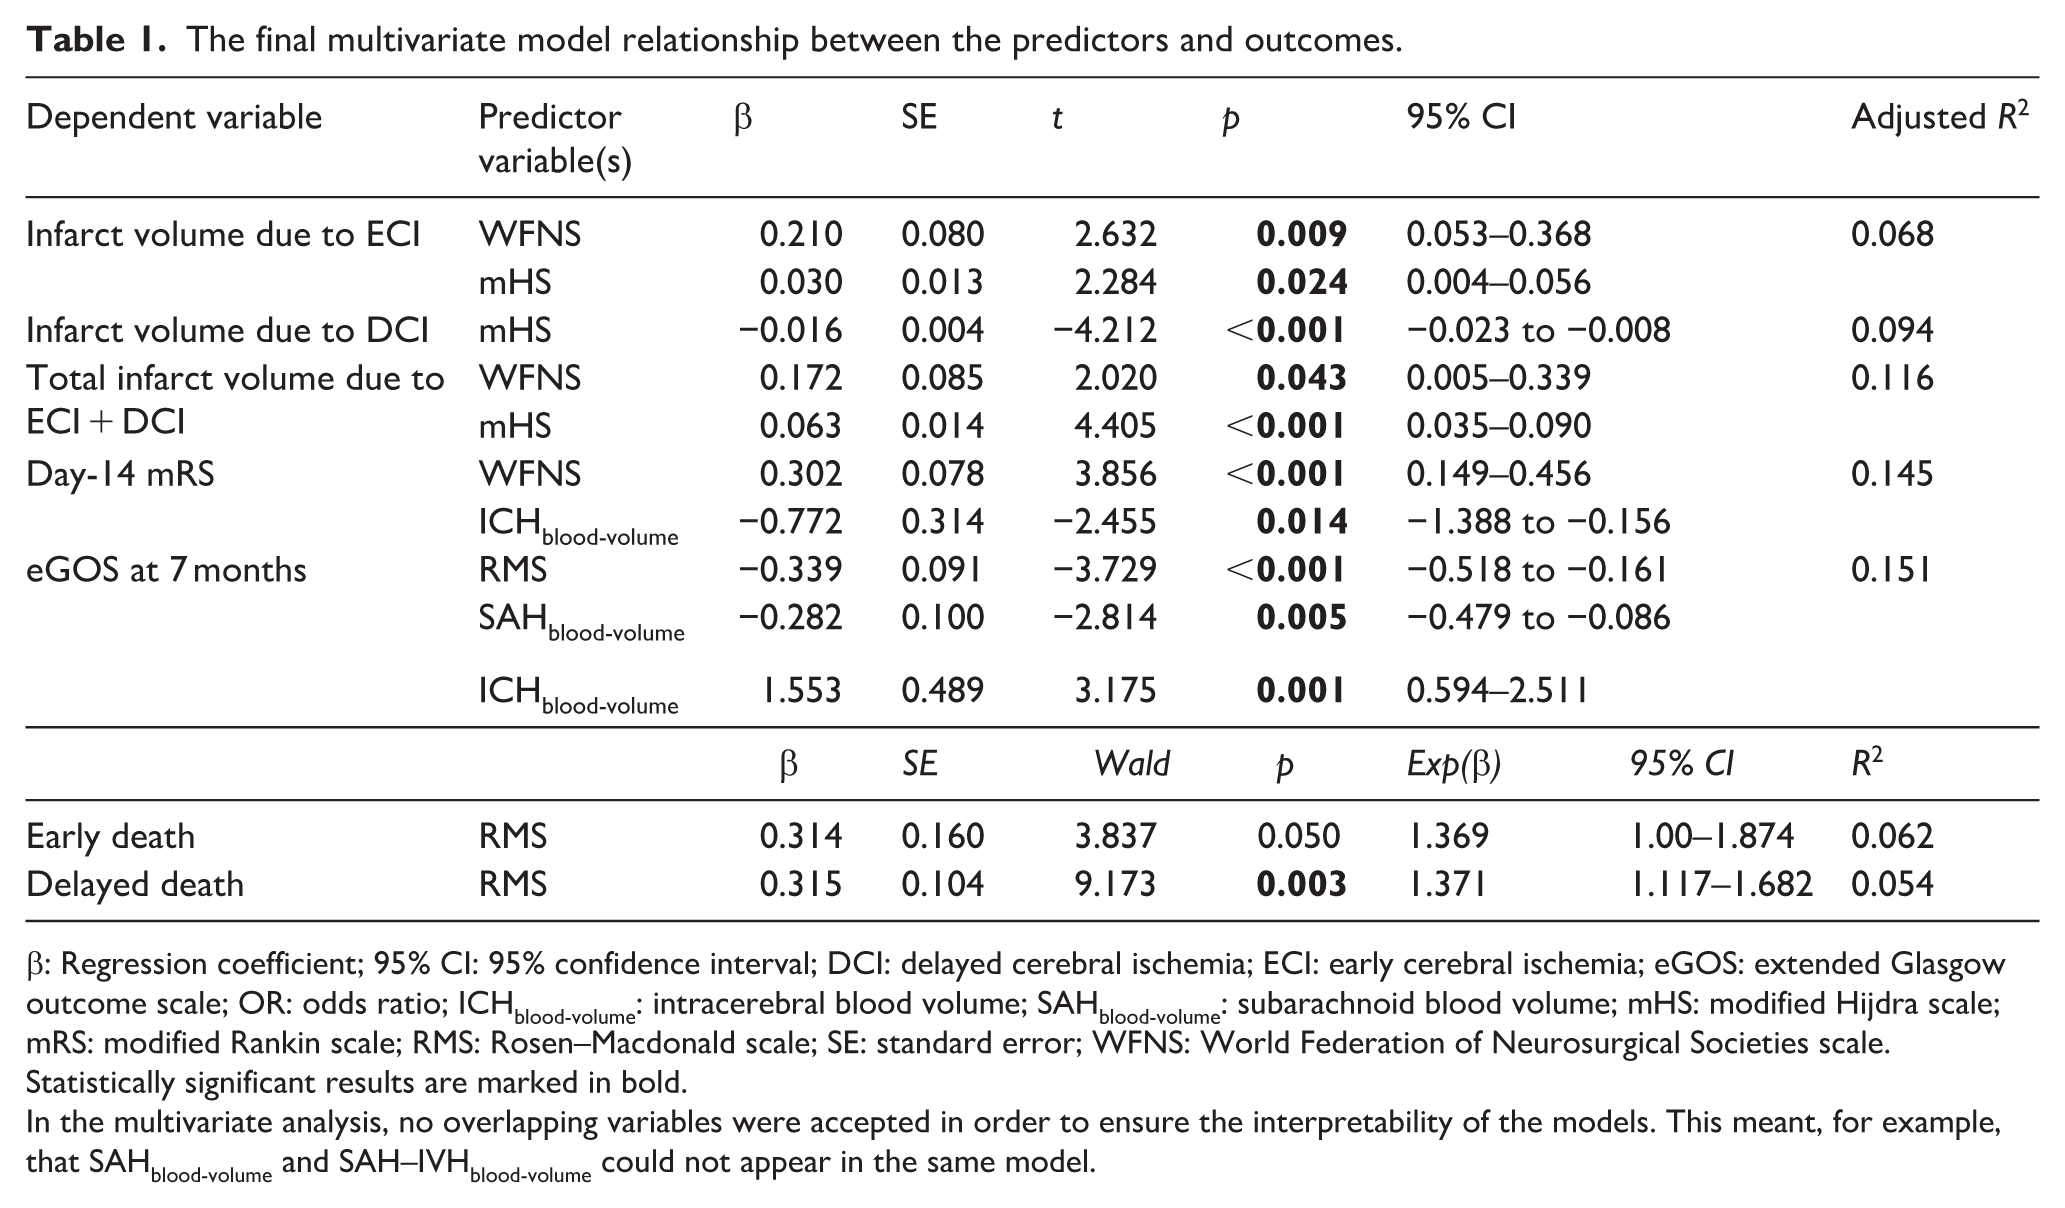
β: Regression coefficient; 95% CI: 95% confidence interval; DCI: delayed cerebral ischemia; ECI: early cerebral ischemia; eGOS: extended Glasgow outcome scale; OR: odds ratio; ICHblood-volume: intracerebral blood volume; SAHblood-volume: subarachnoid blood volume; mHS: modified Hijdra scale; mRS: modified Rankin scale; RMS: Rosen–Macdonald scale; SE: standard error; WFNS: World Federation of Neurosurgical Societies scale.
Statistically significant results are marked in bold.
In the multivariate analysis, no overlapping variables were accepted in order to ensure the interpretability of the models. This meant, for example, that SAHblood-volume and SAH–IVHblood-volume could not appear in the same model.
A possible strategy for treatment stratification in trials targeting DCI
According to the multivariate analysis above, mHS was the only independent predictor of infarct volume due to DCI among the initial variables. Only untransformed, complete case data were used for the following analyses in order to classify the results and facilitate their interpretation with regard to possible clinical applications. First, we visualized the binary prediction of delayed infarction occurrence by the mHS using a receiver operating characteristic (ROC) analysis, including a dot histogram (Figure 1(a) and (b)). Although the result is statistically significant (area under the curve (AUC): 0.67 (95% CI: 0.59–0.76), p = 0.0002, n = 159), the plots demonstrate that a simple binary (yes/no) approach based on mHS is insufficient for individual prediction of delayed infarcts. Thus, an AUC of 0.50 indicates no better predictive value than chance; an AUC between 0.60 and 0.70 is thought to be indicative of a diagnostic test with limited predictive value. 31
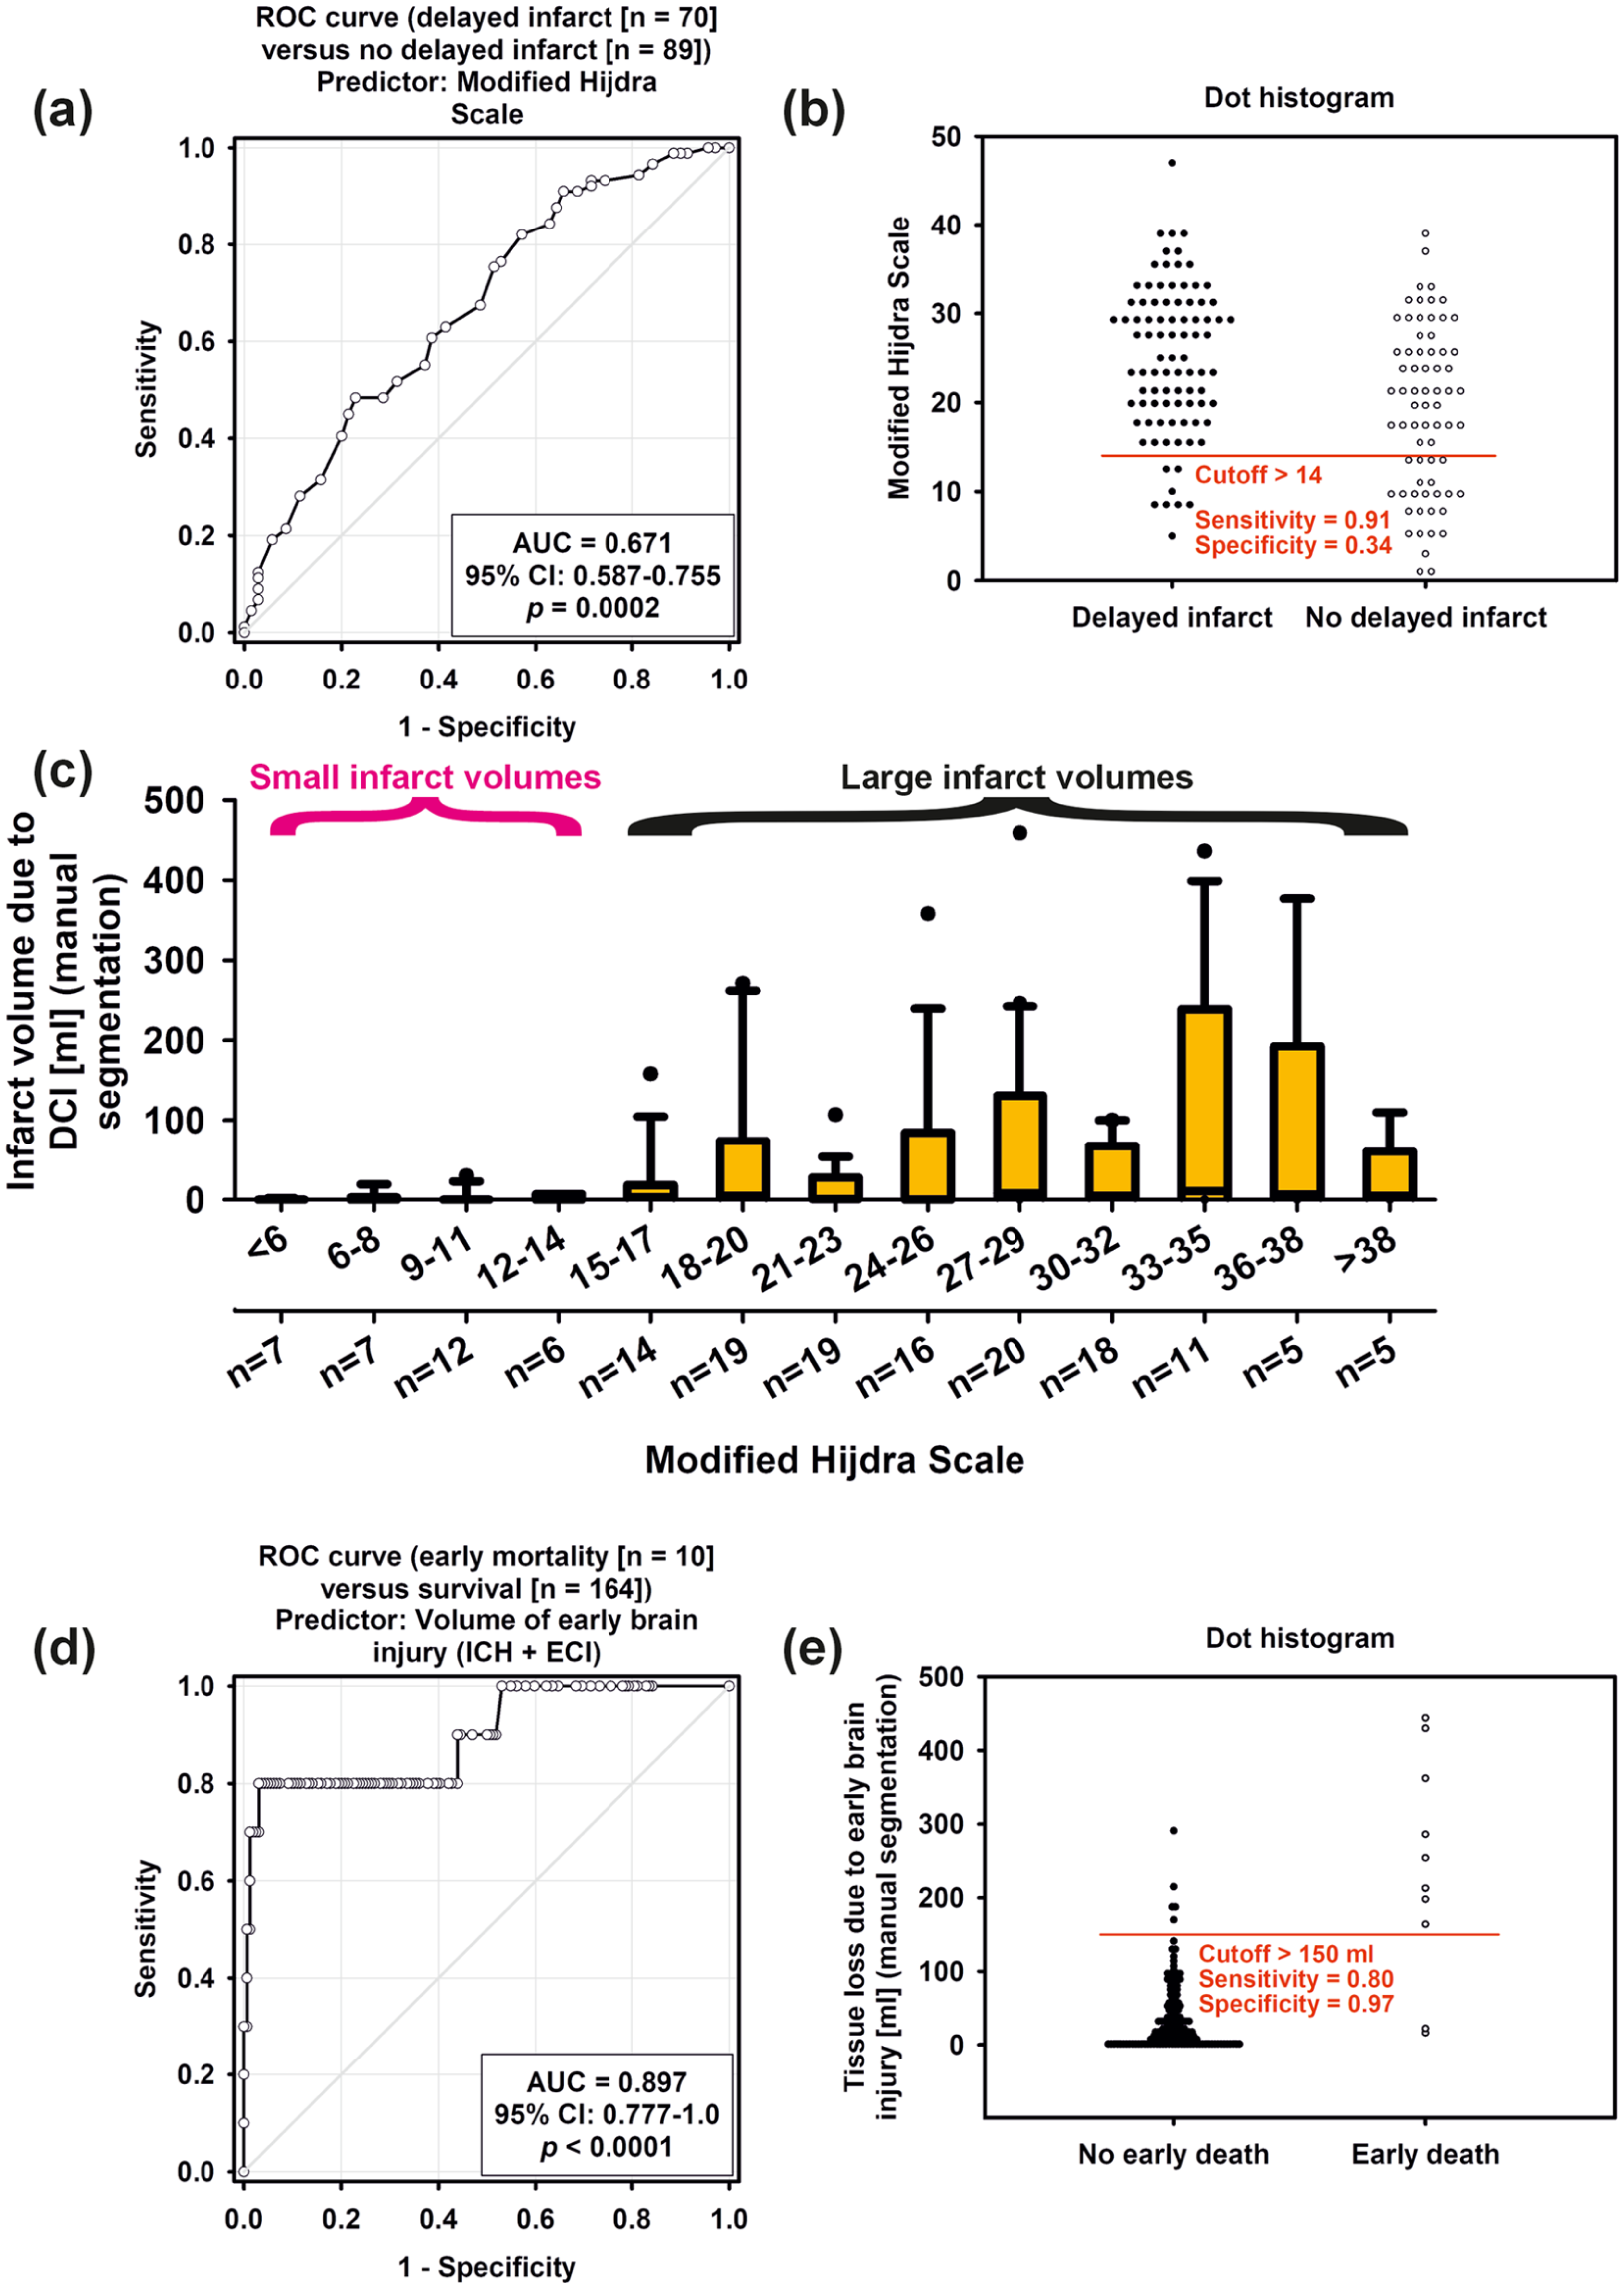
(a) Binary prediction of delayed infarction occurrence (yes/no) by the mHS using a ROC analysis and (b) dot histogram. Although the result is statistically significant, the plots demonstrate that a simple binary approach based on mHS is insufficient for individual prediction. If, for example, a cutoff value for mHS greater than 14 or less than 15 is used for the binary prediction of delayed infarcts, the sensitivity is high, but the specificity is insufficient, (c) however, the infarct volume due to DCI as a function of mHS suggests that there is a range of mHS values below a cutoff of 15 in which only relatively small delayed infarcts occur, (d) the volume of EBI in the entire brain is a strong predictor of early death, and (e) the dot histogram shows that the EBI volume available from neuroimaging after aneurysm occlusion is well suited for excluding patients at high risk of early death from randomized intervention trials targeting DCI.
However, examination of the infarct volumes due to DCI as a function of mHS suggests that only relatively small delayed infarcts occurred for mHS values below a cutoff of 15 (Figure 1(c)). In this low mHS range, the largest infarct volume due to DCI was 30.1 ml. The scatter plot in Figure 2(a) illustrates the same finding. In the group of 127 patients with mHS >14 (127 of 159 early survivors = 79.9%), 81 of 127 (63.8%) had a delayed infarct and 41 of 127 (32.3%) had a delayed infarct with a volume >20 ml. By contrast for the 32 patients with mHS <15 (32 of 159 early survivors = 20.1%), only eight of 32 (25.0%) had a delayed infarct, and only one patient had a delayed infarct with a volume of >20 ml. These same results are also found using the semi-automated segmentation method to estimate infarct volume due to DCI. Thus, “ABT in % of intracranial volume in MRIpost-monitoring minus ABT in % of intracranial volume in MRIearly (ABT%post-monitoring-early)” began to rise above an mHS value of ~14 (Supplementary Figure 4; for the interrater reliability between ABT%post-monitoring-early and the manually segmented infarct volume due to DCI, see Supplementary Results and Supplementary Figure 5).
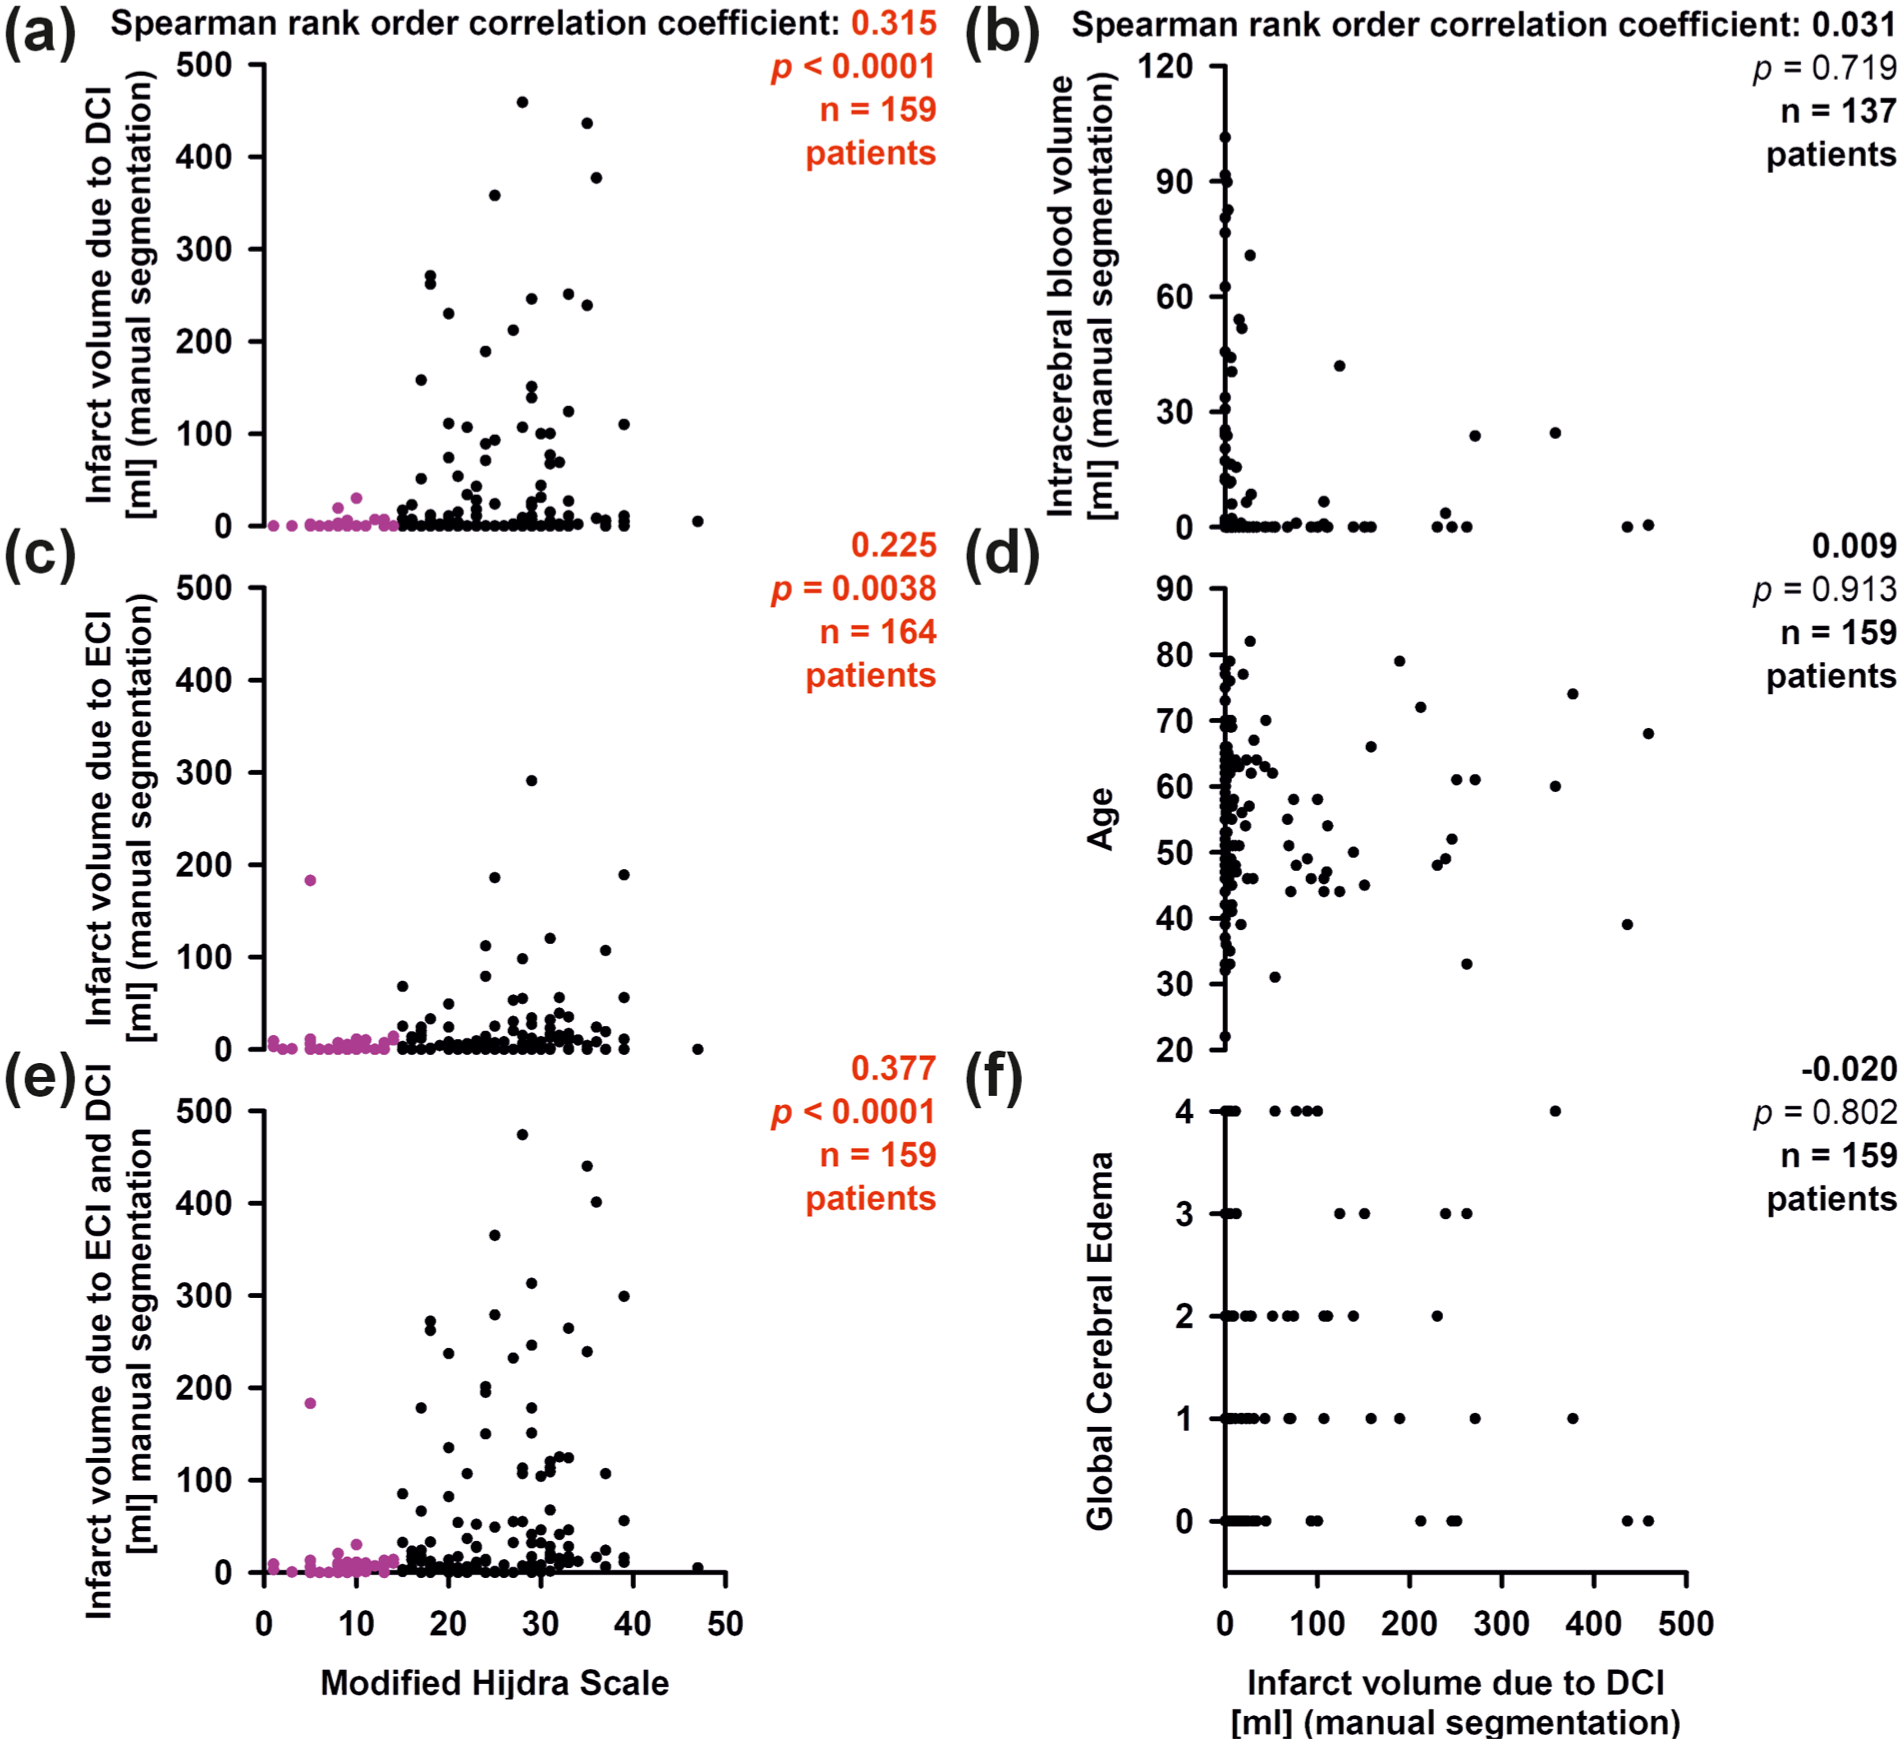
Scatter plots of early survivors. Complete case analyses. Statistically significant results are marked in red. Patients with mHS <15 in (a, c, e) are marked in pink. The x-axis in (e) also applies to (a, c). The x-axis in (f) also applies to (b, d).
Figure 2(c) and (e) suggest that, apart from one outlier, the same mHS cutoff also applied to the infarct volume due to ECI and the total infarct volume due to ECI and DCI in early survivors. Based on these data, we propose that this mHS cutoff could be used as a simple but potentially effective tool for early risk stratification in randomized intervention trials targeting DCI. By this strategy, only patients with an mHS score greater or equal to 15 would be randomized, and those with mHS below 15 would be excluded or randomized separately.
A possible role of EBI volume for treatment stratification in trials targeting DCI
In the main DISCHARGE-1 publication, we previously found that the EBI (ICH + ECI) volume ipsilateral to the recording strip was by far the strongest predictor of early death among the variables tested, including initial predictors and predictors of the early post-interventional time period. 7 Figure 1(d) and (e) show that the EBI volume of the entire brain is a similarly strong predictor of early death. Thus, we found that a cutoff value of 150 ml in EBI volume had a sensitivity of 80% and a specificity of 97% for early death. The segmentation of the EBI volume can be completed once the first neuroimage after aneurysm occlusion is available. Accordingly, patients with an EBI volume ⩾150 ml should be excluded from studies targeting DCI at this point in time.
It is noteworthy that the eGOS at 7 months is determined not only by the infarct volume due to DCI, but also by the EBI volume. 7 If eGOS at 7 months is intended as the primary endpoint in trials targeting DCI, consideration should therefore be given to stratifying treatment allocation not only according to mHS but also according to EBI volume in order to create similar baseline conditions for the intervention and control groups. The following example calculations suggest that an EBI volume of 20 ml is a suitable cutoff for simple dichotomization immediately after aneurysm occlusion in order to distinguish patients who are likely to have a good eGOS at 7 months based on EBI volume from patients who are likely to have a poor eGOS. This can be demonstrated both within the group of patients with mHS >14 and within the group of patients with mHS <15. Thus, among the 118 early survivors with mHS >14 and known eGOS at 7 months, a group of 67 patients (56.8%) with an EBI volume ⩽20 ml achieved an eGOS of 6 (IQR: 3–7), while the group of 51 patients (43.2%) with an EBI volume >20 ml had only an eGOS of 3 (IQR: 1–5; Mann–Whitney rank sum test (MWRST), p = 0.002). In contrast, the infarct volume due to DCI showed no difference between these two groups (DCI, if EBI ⩽20 ml: median: 5 (IQR: 0–32) ml, mean value ± standard deviation: 43 ± 85 ml; DCI, if EBI >20 ml: 5 (IQR: 0–69) ml, 57 ± 109 ml; MWRST, p = 0.828). For the 30 early survivors with mHS <15 and known eGOS at 7 months, an EBI volume ⩽20 ml resulted in a group of 17 patients (56.7%) who achieved an eGOS of 7 (IQR: 6–8), while the group of 13 patients (43.3%) with an EBI volume >20 ml had an eGOS of only 3 (IQR: 3–4; MWRST, p = 0.014). The infarct volume due to DCI again showed no difference between the two groups (DCI, if EBI ⩽20 ml: 0 (IQR: 0–0) ml, 4 ± 9 ml; DCI, if EBI >20 ml: 0 (IQR: 0–2) ml, 1 ± 2 ml; MWRST, p = 0.762). In trials targeting DCI with eGOS at 7 months as the primary endpoint, combined stratification based on both EBI volume and mHS could therefore be useful to focus patient selection on those most likely to benefit from intervention while increasing statistical power at the same time.
Vice versa, it is worth noting that the group of 106 patients (73.1%) with an infarct volume due to DCI ⩽20 ml achieved an eGOS of 6 (IQR: 3–7), while the group of 39 patients (26.9%) with an infarct volume due to DCI >20 ml had only an eGOS of 1 (IQR: 1–3; MWRST, p < 0.001). Between these two groups, the EBI volume showed no difference (EBI, if DCI ⩽20 ml: 16 (IQR: 3–48) ml, 32 ± 39 ml; EBI, if DCI >20 ml: 22 (IQR: 8–57) ml, 46 ± 62 ml; MWRST, p = 0.201). Overall, all these calculations reinforce the notion 32 that eGOS at 7 months is determined by both EBI volume and infarct volume due to DCI.
Correlation of blood volume-related scores with each other and with early and delayed infarct volumes
Figure 3 examines the relationships between mHS and other important initial variables. We found a particularly high correlation with manually segmented SAHblood-volume (Figure 3(a)), a good correlation with IVHblood-volume (Figure 3(c)), and no correlation with ICHblood-volume (Figure 3(e)). The correlation between mHS and RMS (Figure 3(b)) may be explained by the fact that RMS also contains components that correlate directly or indirectly with larger subarachnoid blood volumes, such as clot thickness and aneurysm size (Supplementary Figure 6(a)). In addition, there was a weak correlation between mHS and WFNS (Figure 3(d)), but no correlation between mHS and GCE (Figure 3(f)).
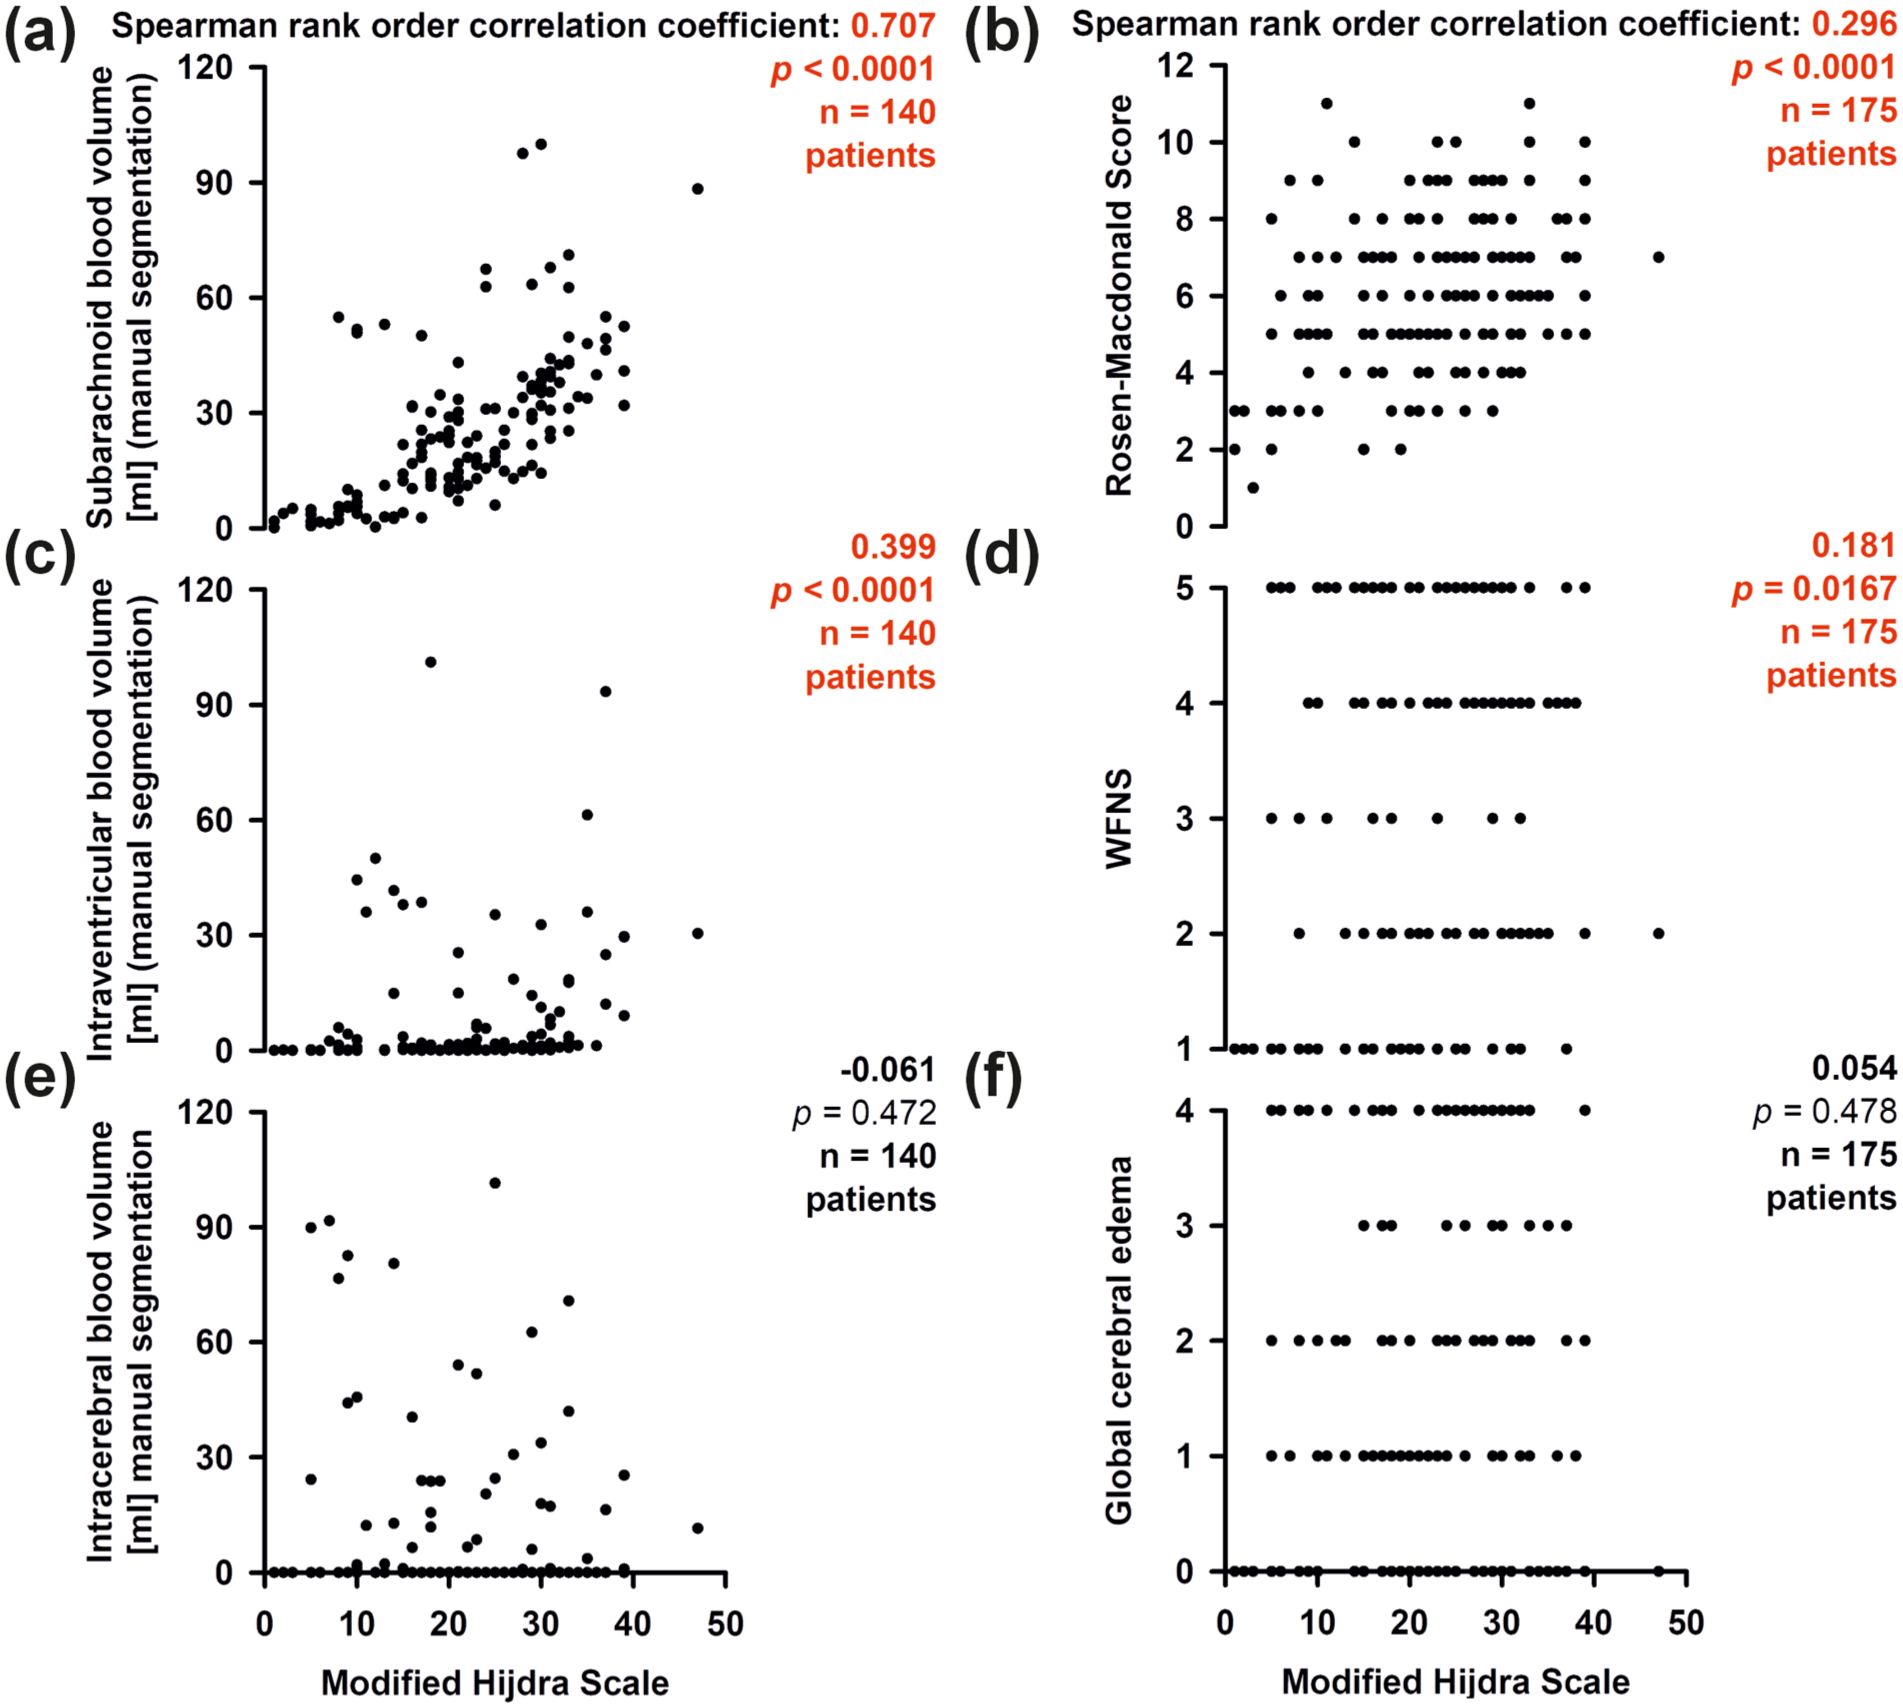
Scatter plots of early survivors (a, c, e) and the whole population including patients who died early (b, d, f). Complete case analyses. Statistically significant results are marked in red. The x-axis in (e) also applies to (a, c). The x-axis in (f) also applies to (b, d).
Both infarct volume due to ECI and infarct volume due to DCI correlated with SAHblood-volume in the early survivors (Figure 4(a) and (b)). Only the infarct volume due to DCI, but not the infarct volume due to ECI, correlated with IVHblood-volume (Figure 4(c) and (d)). The combined subarachnoid and intraventricular blood volumes correlated most strongly with the infarct volume due to ECI as well as with the infarct volume due to DCI (Figure 4(e) and (f)), while none of the infarct volumes correlated with tissue loss due to ICH (ECI: Spearman’s ρ = 0.026, p = 0.761, n = 140; DCI; Figure 2(b)). The infarct volume due to DCI did not correlate with age (Figure 2(d)), GCE (Figure 2(f)) or EBI volume (Spearman’s ρ = 0.084, p = 0.292, n = 159).
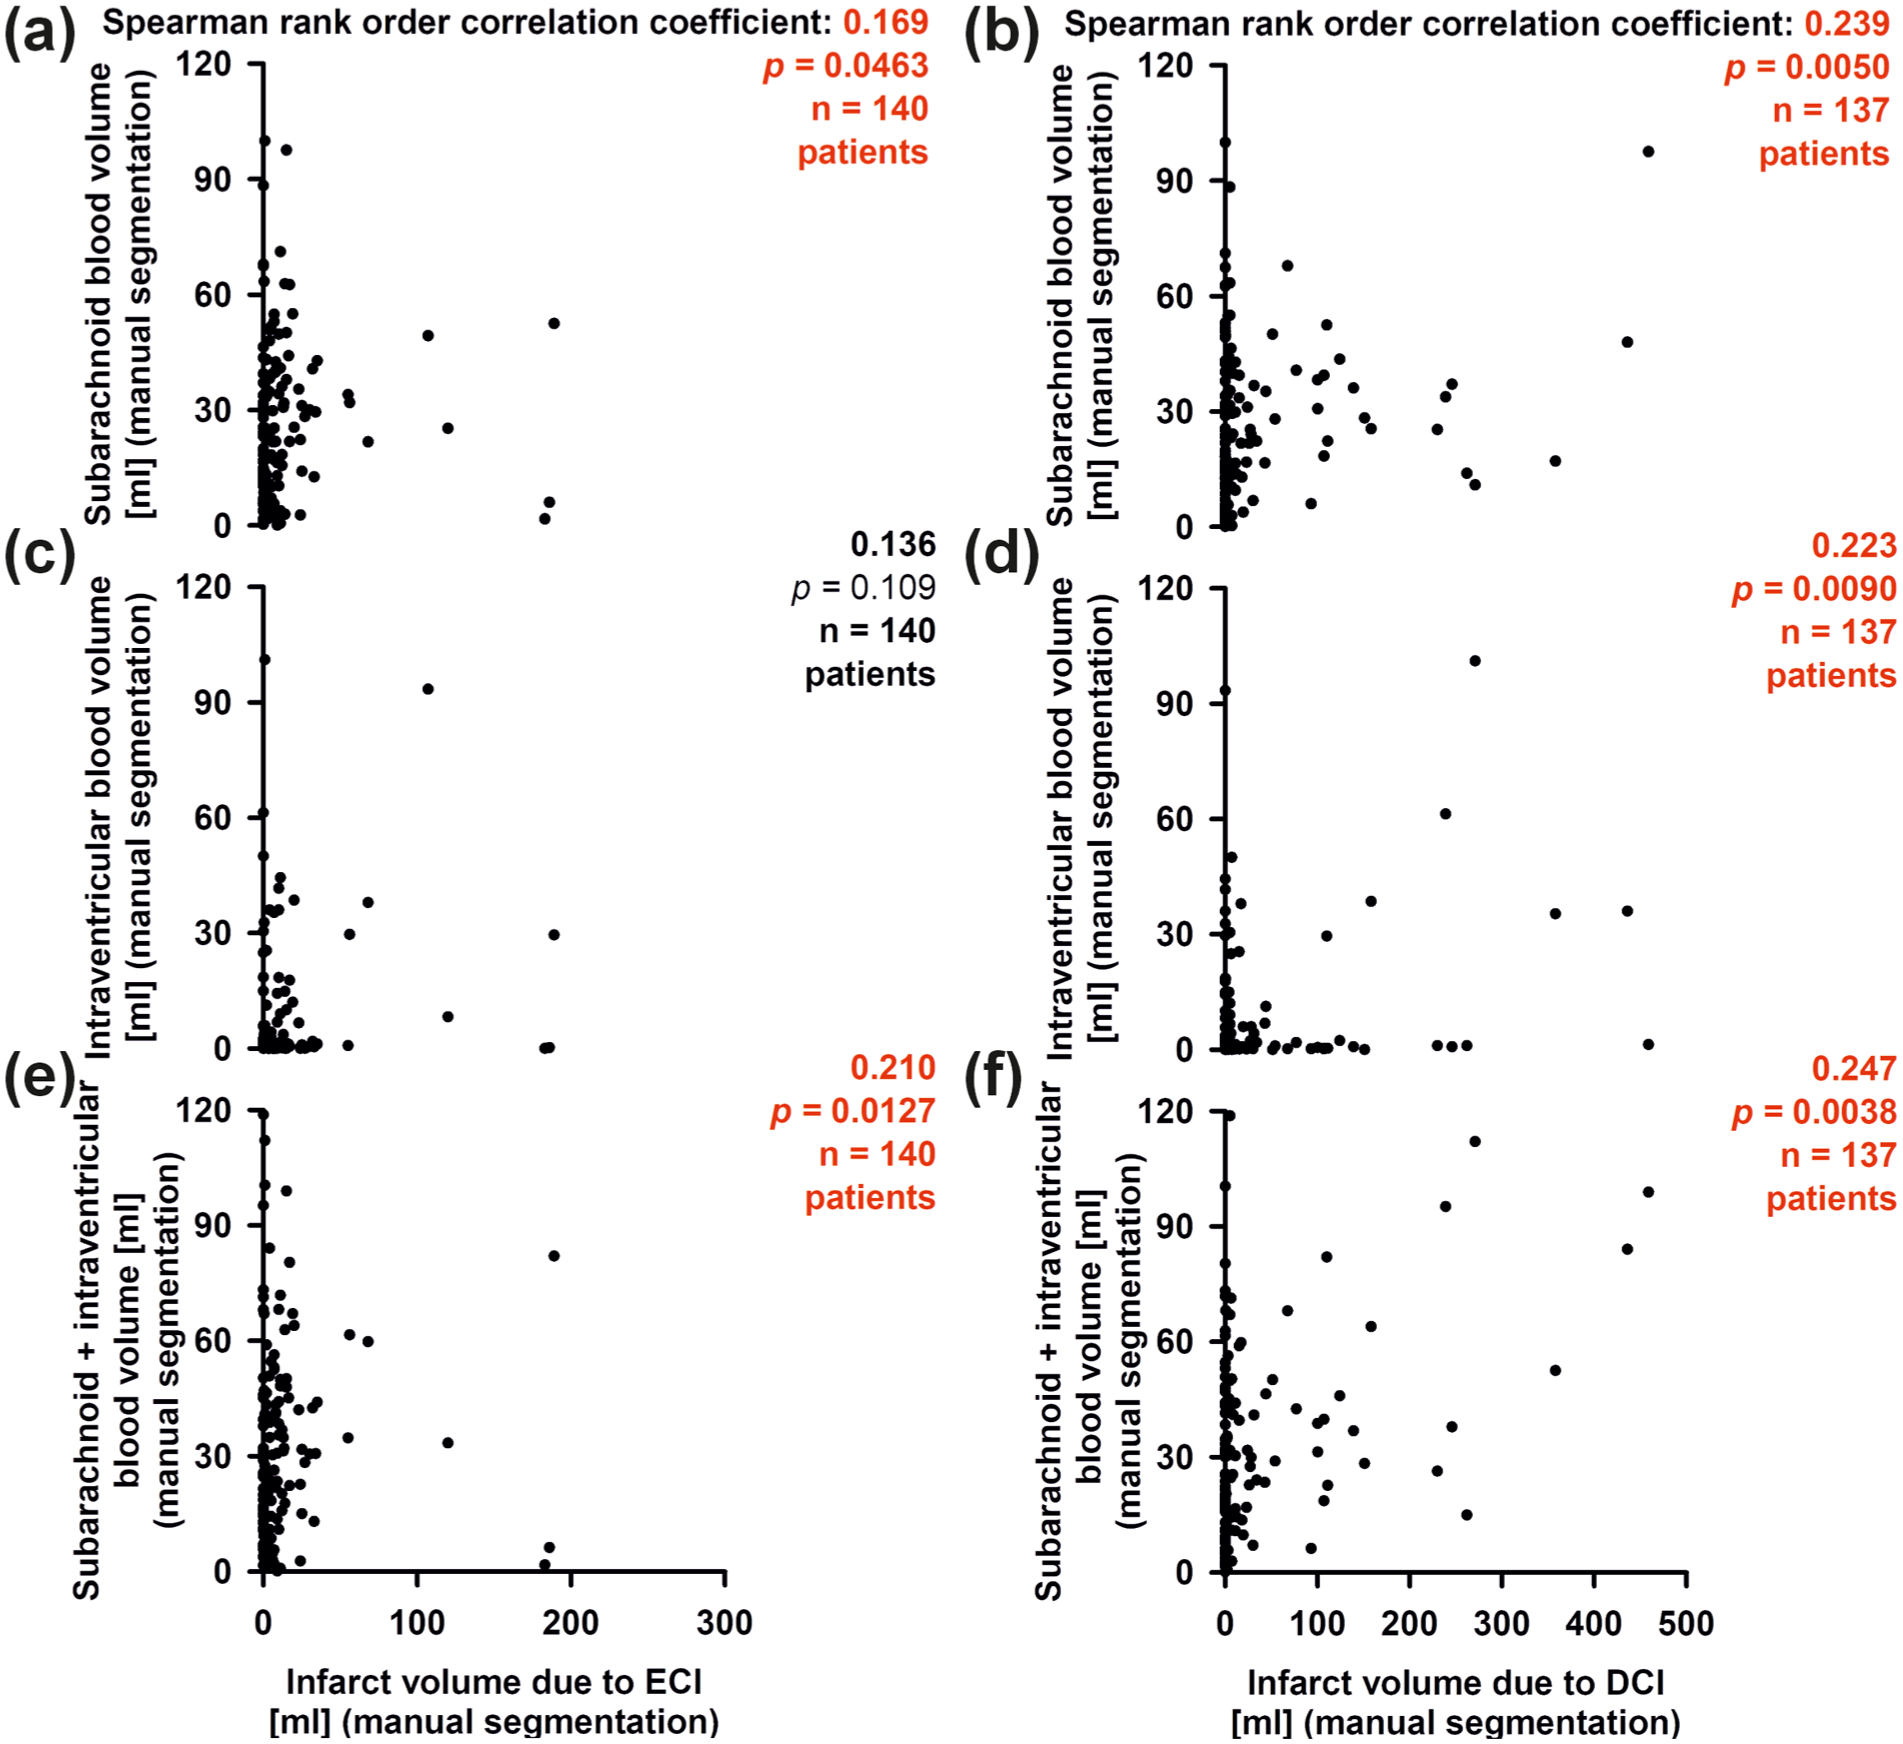
Scatter plots of the early survivors. Complete case analyses. Statistically significant results are marked in red. The x-axis in (e) also applies to (a, c). The x-axis in (f) also applies to (b, d).
Common outcome predictors and clinical outcome at 7 months
Figure 5 shows that the patient outcome (eGOS at 7 months) correlated with manually segmented SAHblood-volume (Figure 5(a)), IVHblood-volume (Figure 5(c)), ICHblood-volume (Figure 5(e)), RMS (Figure 5(b)), and mHS (Figure 5(d)). The WFNS correlated similarly strongly with patient outcome as the mHS (Spearman’s ρ: −0.307, p < 0.0001, n = 161). The strongest of all individual initial predictors of patient outcome at 7 months was total blood volume, which was calculated by adding SAHblood-volume, IVHblood-volume, and ICHblood-volume (Figure 5(f)).
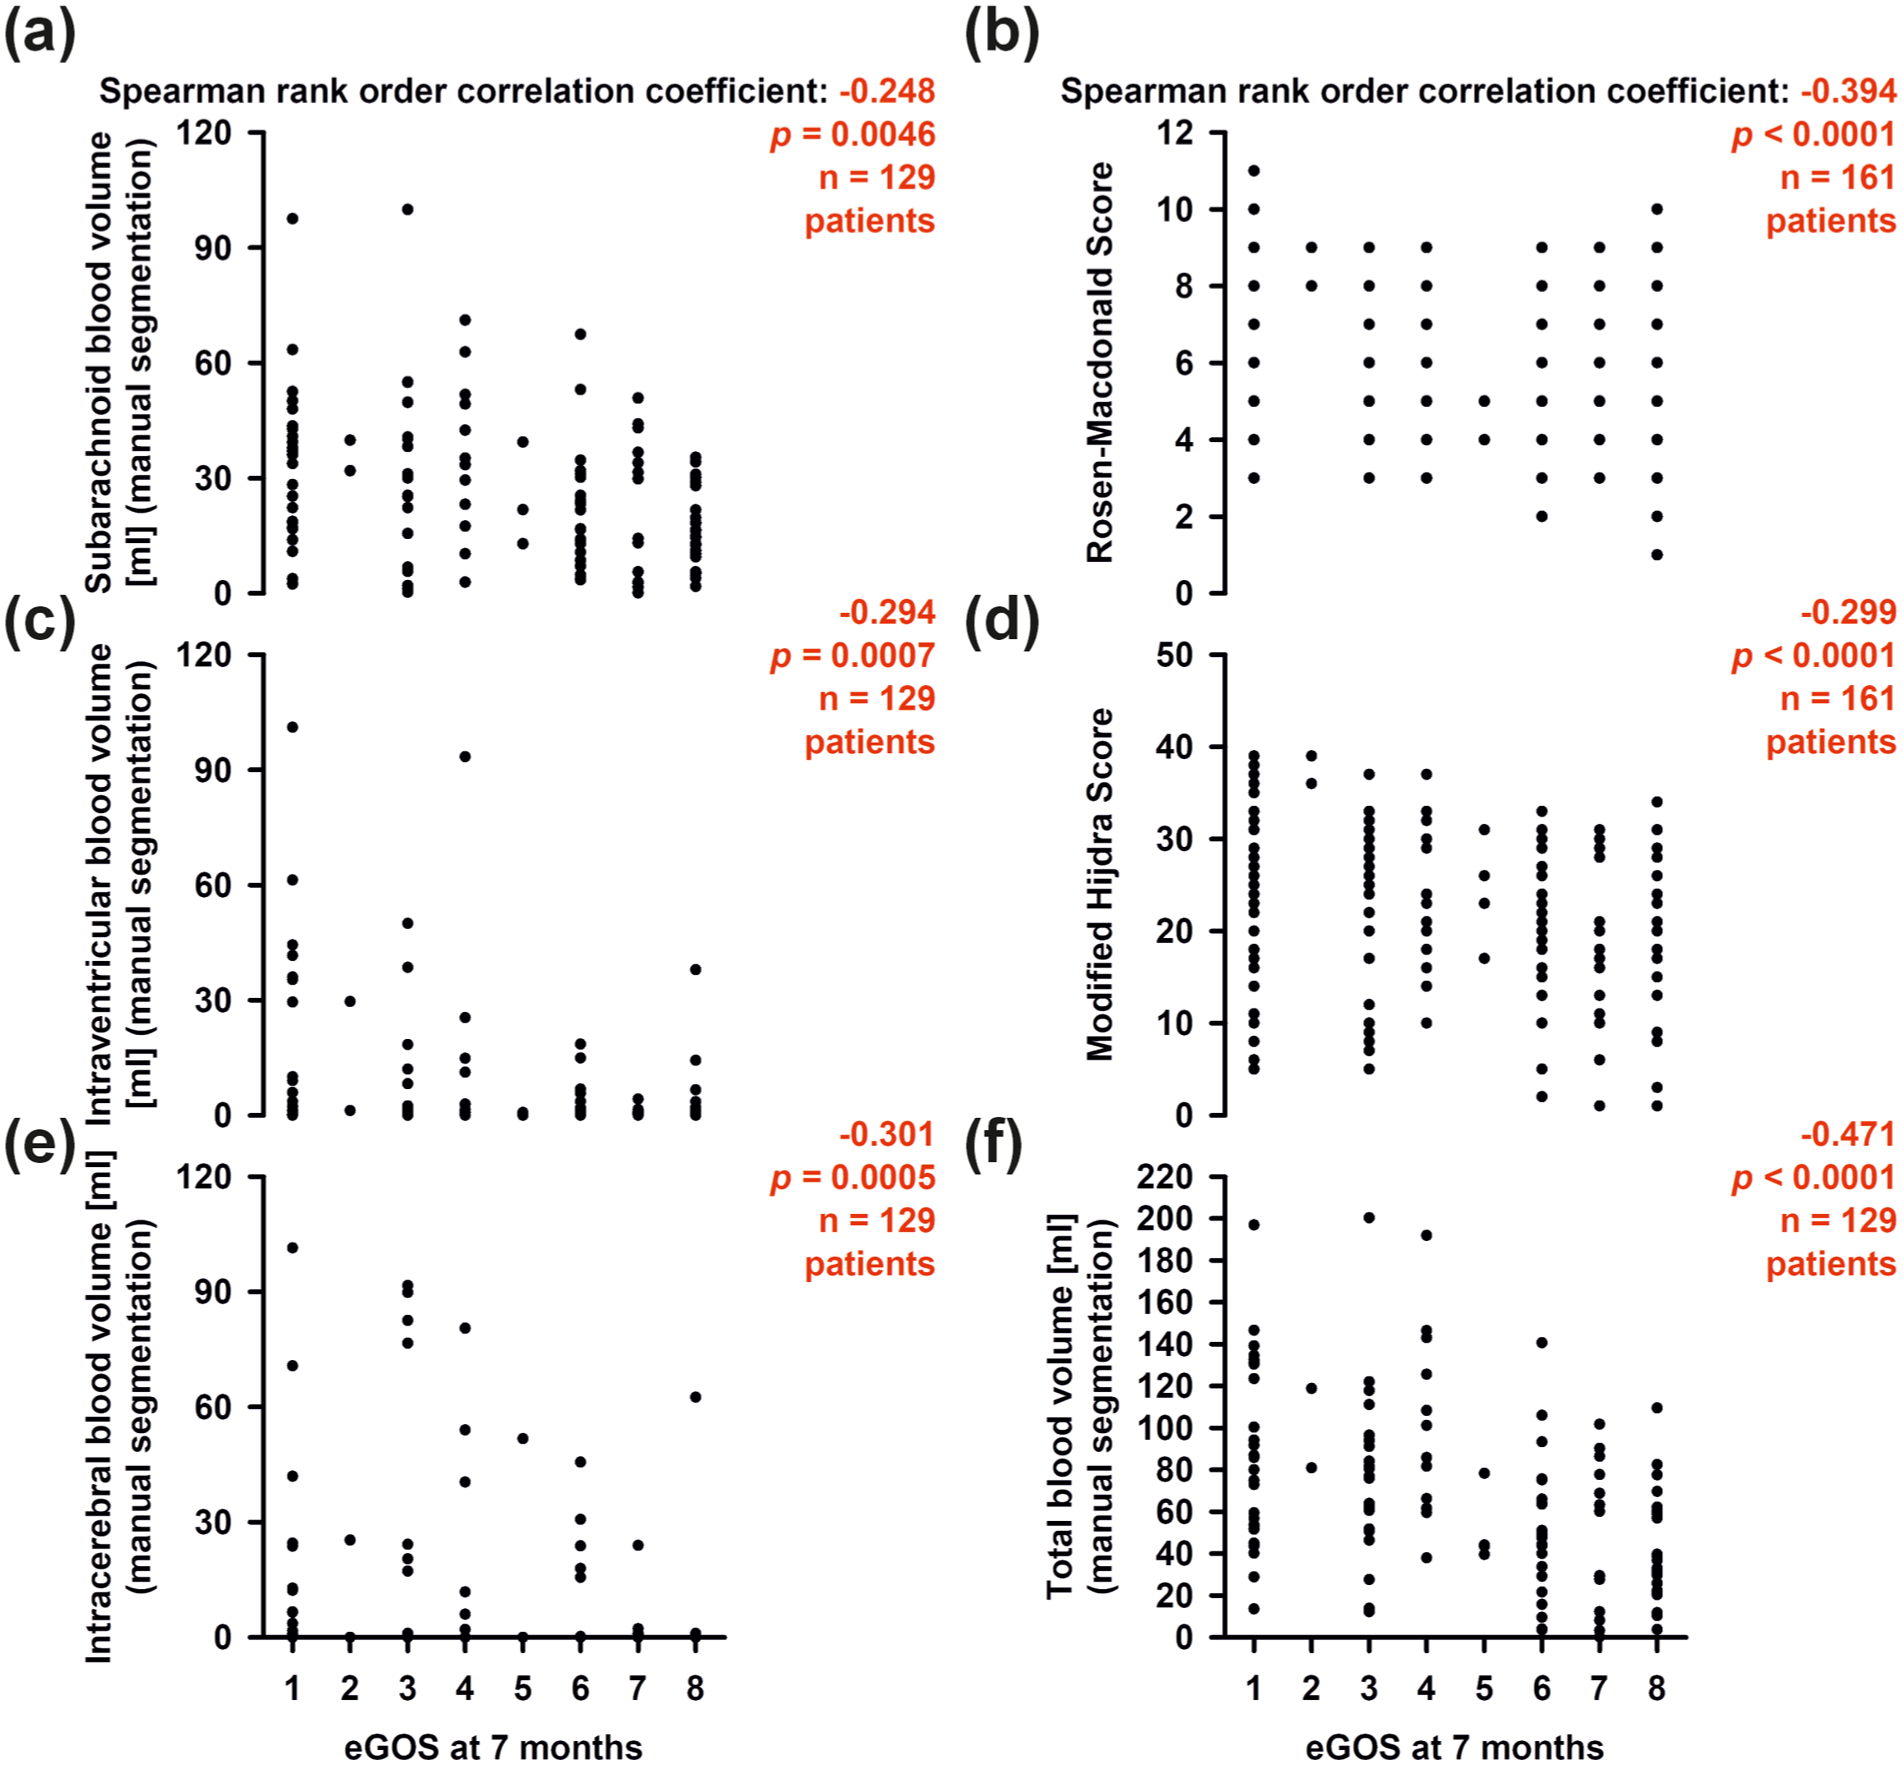
Complete case analyses. Statistically significant results are marked in red. The x-axis in (e) also applies to (a, c). The x-axis in (f) also applies to (b, d).
WFNS may be the most commonly used initial predictor of clinical outcome after aSAH. The WFNS correlated with IVHblood-volume (Supplementary Figure 7(c)) and ICHblood-volume (Supplementary Figure 7(e)), but not with SAHblood-volume (Supplementary Figure 7(a)). WFNS correlated with infarct volume due to ECI (Supplementary Figure 7(d)) and tissue loss due to ICH (Supplementary Figure 7(f)), but not with infarct volume due to DCI (Supplementary Figure 7(b)). Figure 6 shows the comparison between the five different WFNS categories in terms of infarct volume due to ECI, DCI, and combined ECI and DCI, tissue loss due to ICH, and patient outcomes (eGOS at 7 months and overall mortality).
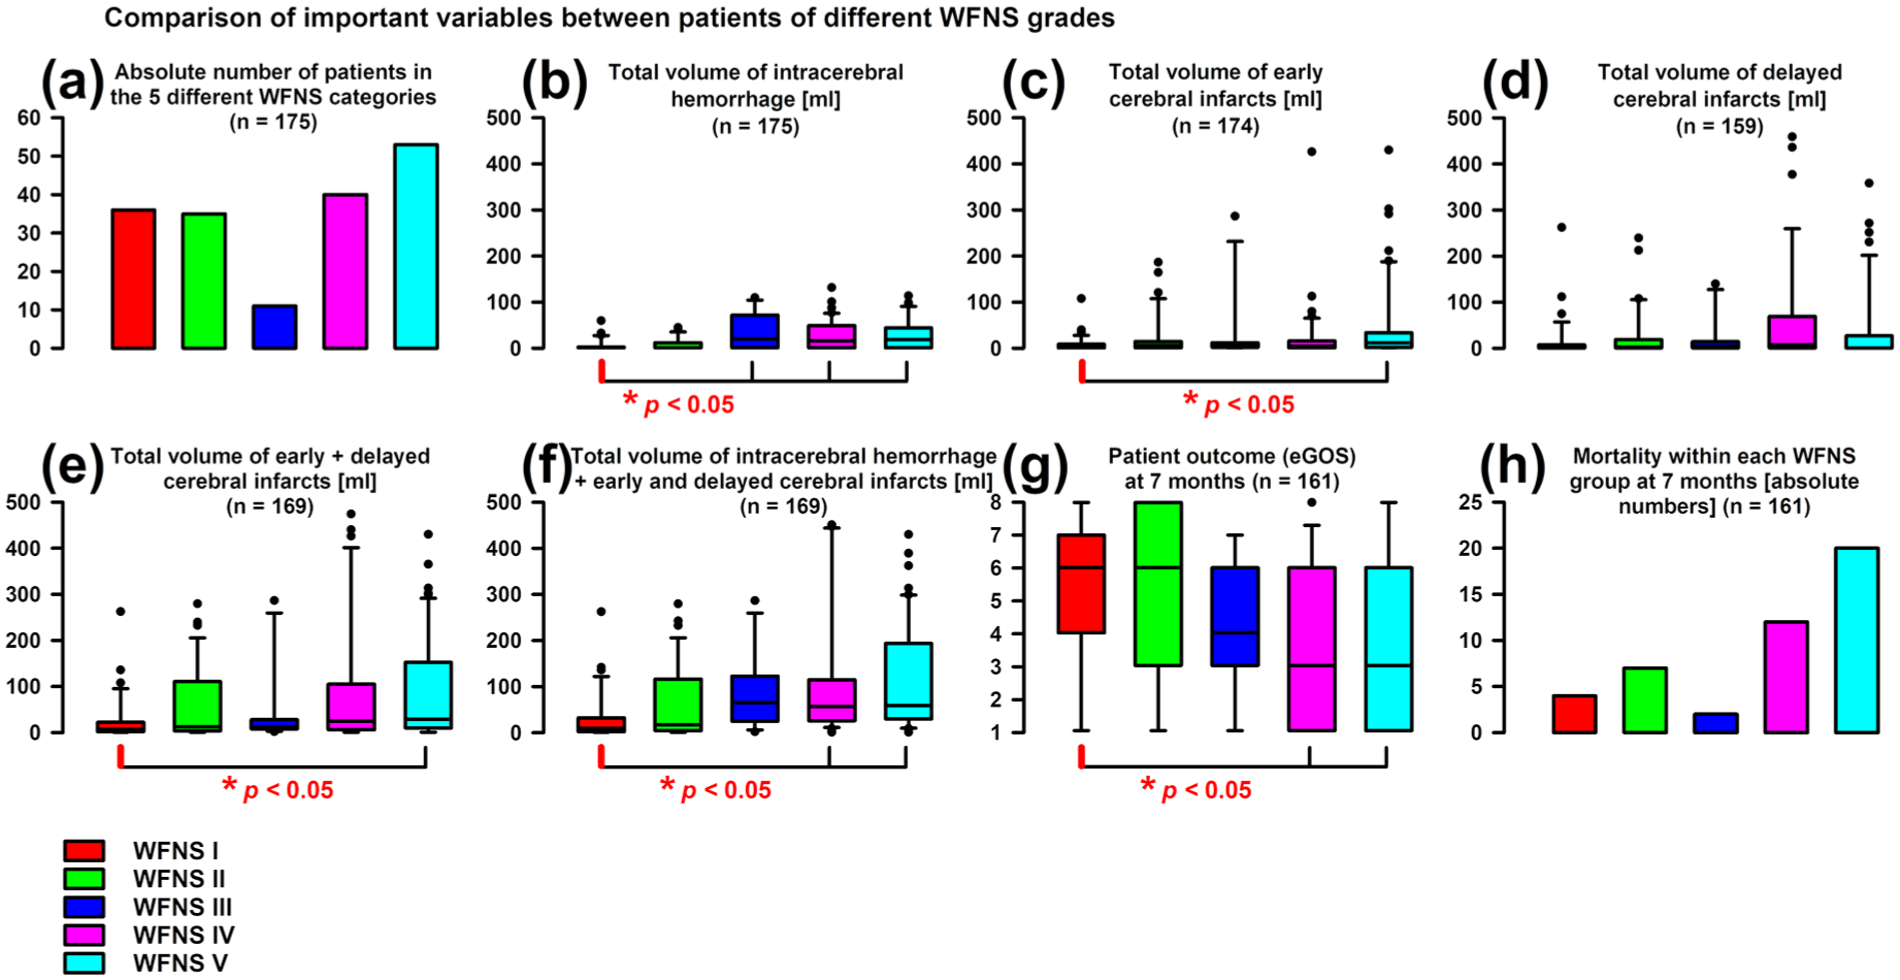
(a) The WFNS scale is an important clinical scale for prognosis assessment after aSAH. The distribution of WFNS I–V patients is shown. Note the significant number of WFNS I patients in our study, (b–f) distribution of the corresponding manually segmented damage volumes across the five WFNS categories, (g) comparison of the eGOS between the five WFNS grades, and (h) comparison of the overall mortality at 7 months between the five WFNS grades, including early deaths. Statistical tests were performed with Kruskal–Wallis one-way ANOVA on ranks and post hoc Dunn’s tests.
RMS is probably a more potent predictor of clinical outcome after aSAH than WFNS because it correlates not only with IVHblood-volume (Supplementary Figure 6(c)) and ICHblood-volume (Supplementary Figure 6(e)) but also, to a certain extent, with SAHblood-volume (Supplementary Figure 6(a)). Furthermore, RMS correlated with infarct volume due to ECI (Supplementary Figure 6(d)) and tissue loss due to ICH (Supplementary Figure 6(f)), but not with infarct volume due to DCI (Supplementary Figure 6(b)).
VASOGRADE
We also determined the VASOGRADE 25 as a predictor, but it was only analyzed for orientation purposes, as our population of early survivors consisted almost exclusively of patients with VASOGRADE yellow (n = 71) and VASOGRADE red values (n = 84). Only four patients had a VASOGRADE green value. Thirty of 71 patients (42.3%) with VASOGRADE yellow and 36 of 84 patients (42.9%) with VASOGRADE red developed delayed infarcts (χ2 test, p = 0.962). The median infarct volume was 2 (IQR: 0–10) ml in patients with VASOGRADE yellow and 5 (IQR: 0–43) ml in patients with VASOGRADE red (MWRST, p = 0.202).
Discussion
Despite many trials4,33 –35 and although it does not counteract angiographic vasospasm, 36 oral nimodipine remains the only prophylactic treatment that reduces the risk of DCI and poor functional outcome after aSAH.4,37,38 Yet even with nimodipine prophylaxis, the risk of DCI remains high, with 89/159 (56%) patients in our study population developing delayed infarcts. The average infarct volume due to DCI was 38 ± 84 ml and the median was 2 (IQR: 0–24; range: 0–459) ml. Nimodipine is therefore by no means sufficient to prevent DCI 33 and novel treatment strategies are needed. Moreover, considering the heterogeneity of initial presentation, DCI risk, and outcomes after aSAH, early risk stratification is needed for the conduct of interventional trials in order to focus trials on patients most likely to benefit and to maximize chances to detect treatment effects if they exist. 39 WFNS and RMS grades are obvious candidates for stratification in interventional trials. However, the analysis presented here in Figure 6(d) and Supplementary Figures 6(b), and 7(b), along with the simple (Supplementary Table 4) and multivariate linear regression analyses (Table 1), clearly demonstrate that WFNS and RMS are unsuitable for treatment stratification in interventional trials targeting DCI.
In contrast, mHS was the only significant predictor retained in the final multivariate model for infarct volume due to DCI. The Hijdra scale takes into account blood in cisterns, fissures, and ventricles, but not intracerebral blood. 21 The mHS additionally considers space-occupying blood clots in cisterns and fissures. 22 Accordingly, mHS correlated strongly with the manually segmented subarachnoid blood volume (Figure 3(a)). It correlated somewhat less strongly with the ventricular blood volume (Figure 3(c)) and did not correlate with the intracerebral blood volume (Figure 3(e)). A particular advantage of mHS over manually segmented blood volumes is that it can be determined purely visually and without any additional equipment based on the initial CT scan. Admittedly, the multivariate model for infarct volume due to DCI with mHS as the sole predictor explained only 9.4% of the variance, suggesting that there are other, more important factors contributing to delayed infarcts. In addition, simple binary (yes/no) prediction of delayed infarcts using mHS, although significant, was insufficient for individual prediction (Figure 1(a) and (b)). However, there was an mHS cutoff of 15, below which only relatively small delayed infarcts occurred, suggesting a practical value for mHS to identify and exclude this group of lower risk patients (Figures 1(c), 2(a), and Supplementary Figure 4(a)). In our preselected population, 7 this group with an absolute risk of only 3.1% for delayed infarcts >20 ml comprised approximately 20% of patients. The remaining 80% of patients had an absolute risk of 32.3% for delayed infarcts >20 ml. The relative risk of infarcts >20 ml in patients with mHS >14 was correspondingly 10 times higher (32.3%/3.1%) than in patients with mHS values below 15. These calculations suggest the concept that, to improve statistical power, the patient group with a low risk of large delayed infarcts could be excluded or randomized separately from the group with a high risk of large delayed infarcts in intervention trials targeting DCI. Randomization should take place 24–48 h after aneurysm occlusion, when a neuroimage is available to determine EBI (ICH + ECI). Using the post-interventional neuroimage, patients with EBI ⩾150 ml should also be excluded from trials targeting DCI, as they are at high risk of early death (Figure 1(d) and (e)).
Further studies should confirm whether this concept is feasible. Ideally, post-interventional and follow-up neuroimaging in such studies should be based primarily on MRI rather than CT scans in order to avoid missing either early or delayed ischemic infarcts. Both post-interventional and follow-up neuroimaging would be essential. If only follow-up neuroimaging is performed or if the time periods for imaging are vaguely defined, early infarcts are typically misclassified as delayed infarcts, which is likely a common and underestimated problem in aSAH trials.
Neuromonitoring and mHS
Use of mHS for risk stratification could be useful for clinical trials of prophylactic therapies or rescue therapies,40,41 and particularly those using longitudinal neuroimaging in combination with neuromonitoring technology. In our neuromonitoring studies, for instance, the signature mechanisms (SD-induced spreading ischemia, the transition from clustered SD to a negative ultraslow potential, and the transition from spreading depressions to persistent activity depression) of developing infarction were recorded when the optoelectrodes were located directly above the imaging-confirmed delayed infarcts. 8 However, regional ECoG monitoring of SD also allowed the detection of injury developing remote from the electrode strip, since SD can propagate far from metabolically stressed brain regions.27,42,43 On this basis, multiple regression was used in our previous publication on DISCHARGE-1 to examine the potential association between ipsilateral infarct volume due to DCI and a three-stage set of potential predictors. 7 This set included WFNS, RMS, and mFS as initial variables (step 1), followed by a series of post-intervention variables (step 2) and a series of delayed monitoring variables, including SD variables (step 3). The final multivariate model included the peak value of SD-induced depression duration among all recording days of the delayed period (PTDDDdelayed; β = 0.474, p < 0.001), the median value of the Glasgow coma scale for the delayed period (GCSdelayed; β = −0.201, p = 0.005), and the peak mean blood flow velocity in the ipsilateral middle cerebral artery during the delayed period, as determined by transcranial Doppler sonography (β = 0.169, p = 0.016). This model explained 35% of variance in ipsilateral infarct volume due to DCI. Since mHS was the strongest predictor of infarct volume due to DCI among the variables examined here, a future multiple regression analysis based on the three time steps should include mHS to determine whether this improves the multivariate prediction model for DCI.
WFNS and RMS
Both WFNS and mHS were included in the final multivariate models of infarct volume due to ECI and total infarct volume due to ECI and DCI. WFNS and ICHblood-volume were included in the final multivariate model of day-14 mRS. The WFNS is a scale for the initial neurological deficit upon admission. 16 Accordingly, it correlated in particular with tissue loss due to ICH and infarct volume due to ECI. It also correlated with IVHblood-volume and ICHblood-volume, but not with SAHblood-volume. The latter could be one reason why the WFNS did not correlate with infarct volume due to DCI. 23
Only RMS was included in the final models of early and delayed death. RMS, SAHblood-volume and ICHblood-volume were included in the final model of eGOS at 7 months. RMS is a score, that is, composed of the WFNS as well as information from medical history and neuroimaging (CT and angiography). 24 Interestingly, unlike WFNS, RMS correlated with the blood volumes in all three compartments, that is, to a certain extent also with SAHblood-volume. This could explain why RMS is a stronger predictor of outcome at 7 months than WFNS. Accordingly, blood volumes in each of the three compartments were predictors of eGOS at 7 months, but total blood volume, that is, the sum of SAHblood-volume, IVHblood-volume, and ICHblood-volume, was the strongest single predictor of eGOS at 7 months among all initial variables. In other words, the blood in all three compartments synergistically determines the long-term clinical outcome.
Limitations
Our study, a secondary analysis of a prospective, non-interventional, prognostic cohort, has limitations. Our patient cohort exhibited more severe aSAH than typically reported. This is attributable to the fact that the study neurosurgeons opted for invasive neuromonitoring when they assessed a high risk of secondary deterioration. 7 Accordingly, our results may be more relevant to a severely affected patient population. The case severity could also explain why outcome data were missing in 14/175 (8.0%) of cases. Major reasons why more severely affected patients are more likely to be lost to follow-up are that (1) contact is lost because their address changes as they no longer live in their own home but in a nursing home, (2) they may no longer be able to answer phone calls, and the phone number on file becomes invalid, and (3) they are less likely to survive. Another potential limitation regarding the generalizability of the findings is that most patients underwent clip ligation rather than coil embolization. However, there were no significant differences in predictors and outcomes between these two groups (Supplementary Table 10).
Conclusion
Overall, blood in the various compartments of the brain after aSAH causes three major forms of pathology with different temporal courses: ICH, ECI, and DCI, all of which contribute to the long-term clinical outcome. WFNS and RMS are more closely related to EBI, that is, ICH plus ECI. This leads to the paradox that although WFNS and RMS are quite good predictors of clinical outcome at 7 months, they fail as predictors of infarct volume due to DCI. In contrast, mHS is a predictor of both infarct volume due to DCI and clinical outcome at 7 months. Therefore, if the primary endpoint in clinical trials targeting DCI is the delayed infarct volume, patients should be stratified according to the mHS in order to focus the group of randomized patients on those with similar risk. If, on the other hand, the primary endpoint is clinical outcome, stratification should be based on both mHS and EBI volume.
Supplemental Material
sj-pdf-1-jcb-10.1177_0271678X261463954 – Supplemental material for The modified Hijdra scale for prediction of delayed cerebral infarcts after subarachnoid hemorrhage
Supplemental material, sj-pdf-1-jcb-10.1177_0271678X261463954 for The modified Hijdra scale for prediction of delayed cerebral infarcts after subarachnoid hemorrhage by Vasilis Kola, Prabin Basnet, Viktor Horst, Sebastian Major, Coline L Lemale, Nils Hecht, Maren KL Winkler, Karl Schoknecht, Svetlana Lublinsky, Stefan Wolf, Peter Vajkoczy, Michael Scheel, Jed A Hartings, Alon Friedman, Johannes Woitzik, Peter Martus and Jens P Dreier in Journal of Cerebral Blood Flow & Metabolism
Footnotes
Acknowledgements
Not applicable.
Author contributions
JPD and VK had full access to all of the data in the study and take responsibility for the integrity of the data and the accuracy of the data analysis. JPD, VK, and PB developed the study concept and design. VK scored the initial CTs. VH performed the manual segmentation of the hemorrhage volumes. VK, PB, VH, SM, CLL, NH, MKLW, KS, SL, SW, PV, MS, JAH, AF, JW, PM, and JPD were involved in data acquisition, analysis, and interpretation. JPD, VK, and PB drafted the manuscript. VH, SM, CLL, NH, MKLW, KS, SL, SW, PV, MS, JAH, AF, JW, and PM provided a critical revision of the manuscript for important intellectual content. PB and PM performed the univariate and multivariate analyses as independent trial statisticians. In addition, JPD and VK contributed to the descriptive statistical analysis and interpretation. JPD obtained funding. VK, VH, SM, CLL, NH, MKLW, KS, SW, MS, and JW provided administrative, technical, and material support. PV, MS, JAH, AF, JW, PM, and JPD supervised aspects of the study. All authors read and approved the final version of the manuscript.
Author informations (optional)
Not applicable.
Funding
The authors disclosed receipt of the following financial support for the research, authorship, and/or publication of this article: Supported by Deutsche Forschungsgemeinschaft (DFG DR 323/10-2, project number: 413848220), Deutsche Forschungsgemeinschaft (DFG DR 323/13-1, project number: 570363796), and EU Horizon (MSCA-DN 101119916—SOPRANI) to Dr. Jens P Dreier.
Declaration of conflicting interests
The authors declared no potential conflicts of interest with respect to the research, authorship, and/or publication of this article.
Ethics approval and consent to participate
The protocol was approved by the ethics committees of the Charité–Universitätsmedizin Berlin, University of Bonn, Goethe-University Frankfurt, University of Cologne, and University Hospital Heidelberg. Either informed consent or surrogate informed consent was obtained. Research was conducted in accordance with the Declaration of Helsinki.
Consent for publication
Not applicable.

Data availability statement
Electronic recording, processing, and storage of the data were approved by the data protection officer of the Charité Universitätsmedizin Berlin (data protection votes from May 28, 2008 and May 5, 2014). The raw datasets analyzed during the current study are not publicly available because the patient’s informed consent only permits the data analysis and publication by the investigators.
Supplemental material
Supplemental material for this article is available online.
References
Supplementary Material
Please find the following supplemental material available below.
For Open Access articles published under a Creative Commons License, all supplemental material carries the same license as the article it is associated with.
For non-Open Access articles published, all supplemental material carries a non-exclusive license, and permission requests for re-use of supplemental material or any part of supplemental material shall be sent directly to the copyright owner as specified in the copyright notice associated with the article.
